Dutch Environmental Indicator for
plant protection products, version 2
Input, calculation and aggregation procedures
Report 607600002/2008 A.M.A. van der Linden et al.
RIVM, P.O. Box 1, 3720 BA Bilthoven, the Netherlands Tel +31 30 274 91 11 www.rivm.nl RIVM Report 607600002/2008
Dutch Environmental Indicator for plant protection
products, version 2
Input, calculation and aggregation procedures
AMA van der Linden, RIVM JG Groenwold, Alterra R Kruijne, Alterra R Luttik, RIVM
RCM Merkelbach, Alterra
Contact:
AMA van der Linden
Laboratory for Ecological Rick Assessment Ton.van.der.Linden@rivm.nl
This investigation has been performed by order and for the account of the Netherlands Ministry of Housing, Spatial Planning and the Environment and the Netherlands Ministry of Agriculture, Nature and Food Quality, within the framework of project M/607600, Pesticide Fate in the Environment
© RIVM 2008
Parts of this publication may be reproduced, provided acknowledgement is given to the 'National Institute for Public Health and the Environment', along with the title and year of publication.
Abstract
Dutch Environmental Indicator for plant protection products, version 2 Input, calculation and aggregation procedures
The Dutch Environmental Indicator for plant protection products (NMI) is a software package used for calculating the potential environmental impact of plant protection products, which are used in
agriculture. This report gives an overview of input data and calculation and aggregation procedures used to estimate the emissions and potential impacts of these products.
Key words:
Rapport in het kort
Nationale milieu-indicator voor gewasbeschermingsmiddelen, versie 2 Input, aggregatie- en berekeningsmethoden.
De Nationale Milieu-Indicator voor gewasbeschermingsmiddelen is een softwarepakket dat wordt gebruikt voor de berekening van emissies en milieubelasting van deze middelen. Dit rapport geeft een beschrijving van benodigde invoergegevens van het softwarepakket en de concepten van de gebruikte aggregatie- en berekeningswijzen.
Trefwoorden:
Contents
Summary 9 Samenvatting 11 1 Introduction 13 1.1 Overview of indicators 13 1.2 General principles 141.3 Running the system, input and output 15
1.4 Limitations 15
1.5 Set-up of the report 16
2 Input data 17 2.1 Geographical information 17 2.2 Soil data 18 2.3 Hydrological data 18 2.4 Climate data 18 2.5 Crops 18
2.6 Plant protection product use data 19
2.7 Application techniques 21
2.8 Drift 23
2.9 Substance fate and ecotox data 24
3 Emission indicators 25 3.1 Air 27 3.2 Groundwater 32 3.2.1 Metamodel of PEARL 33 3.3 Surface water 36 4 Effect indicators 39 4.1 Soil 39
4.1.1 Soil exposure concentration, single application 39
4.1.2 Soil exposure concentration, multiple applications 40
4.1.3 Potential acute effects in soil 41
4.1.4 Potential chronic effects in soil 42
4.2 Groundwater 43
4.2.1 Groundwater exposure concentration 43
4.2.2 Potential effects in groundwater 44
4.3 Surface water 44
4.3.1 Surface water acute exposure concentration, single application 44
4.3.2 Surface water acute exposure concentration, multiple applications 45
4.3.3 Potential acute effects in surface water 47
4.3.4 Potential chronic effects in surface water 48
4.4 Terrestrial organisms 48
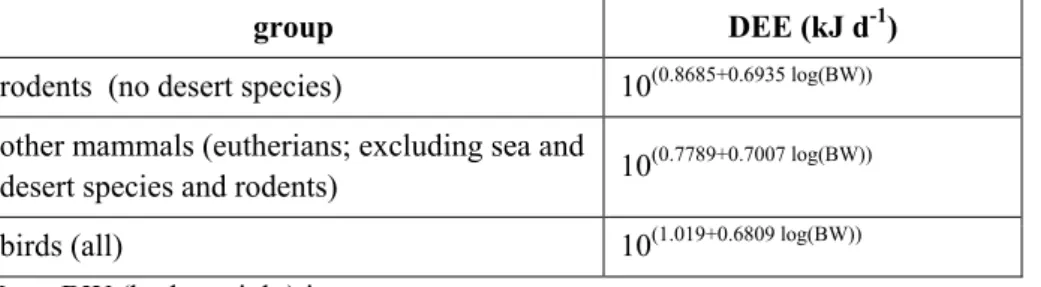
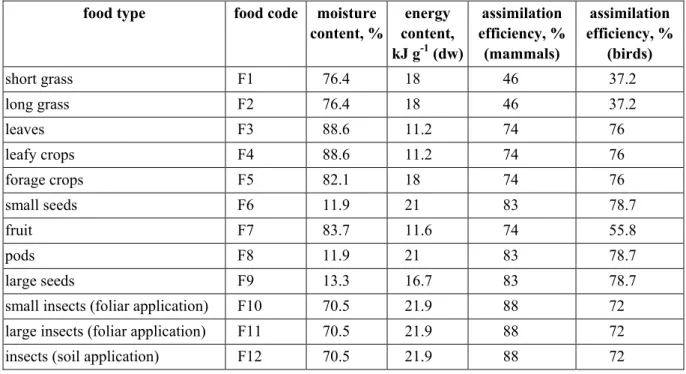
4.4.1 Dietary exposure of birds and mammals by sprayed pesticides 49
References 55
Appendix 1 Glossary 57
Appendix 2 List of symbols 59
Appendix 3 Crops included in NMI version 2 63
Appendix 4 Crop interception fractions 65
Appendix 5 NMI database input for substances 67
Summary
The Dutch Environmental Indicator for plant protection products (NMI) is a software package used for calculating the potential environmental impact of plant protection products, which are used in
agriculture (both arable crops and greenhouse crops). This report gives an overview of input data and calculation procedures used to estimate the emissions and potential impacts. Calculations are
performed for grid cells of 100 ha each, using geographical and time dependent information; results of the calculations therefore vary in space and time.
The NMI currently is capable of calculating the following indicators:
• emission of plant protection products (PPP) to air resulting from volatilisation during application, volatilisation from the plant canopy and volatilisation from the soil; for greenhouse crops, emission to air by volatilisation from the greenhouse is calculated;
• emission of PPP to groundwater resulting from leaching, including leaching from greenhouse crops rooting in soil;
• emission of PPP to surface water resulting from lateral drainage and drift during application, including lateral drainage from greenhouse crops rooting in soil;
• emissions resulting from some point sources from greenhouses and bulb disinfections to surface water;
• potential acute and chronic effects in the soil of treated fields;
• potential acute and chronic effects in surface water resulting from drift to surface water; • potential acute and chronic effects to terrestrial organisms feeding on treated fields;
• potential effects of leaching to groundwater regarding its potential use as source for drinking water. The potential chronic effect modules are new in version 2. Apart from this a number of more technical changes were realised.
Emissions are calculated as amounts (kg) active ingredients emitted from treated fields; potential effects are expressed as Environmental Indicator Units. Results can be visualised on maps.
Furthermore, results can be given as numbers per, amongst others, crop, agricultural sector and the Netherlands as a whole.
Calculation concepts apply to a single application of a plant protection product at the field scale. Unfortunately, input information is not available for individual fields. Information on applications is derived from national investigations whereas data on land use are from national census data. The NMI is therefore best fit for applications at the national scale. Results might be less accurate when the NMI is used at the regional scale with the same input data. The accurateness will depend on the
Samenvatting
De Nationale Milieu-Indicator (NMI) voor bestrijdingsmiddelen is een softwarepakket dat gebruikt wordt voor de berekening van emissies en potentiële effecten van gewasbeschermingsmiddelen, welke in de Nederlandse landbouw (zowel vollegrond als glastuinbouw) worden gebruikt. Dit rapport beschrijft de benodigde invoergegevens en de concepten voor de berekening van de emissies en de potentiële effecten en de aggregatieprocedures. De berekeningen worden voor gridcellen van 100 ha uitgevoerd, gebruikmakend van locatiespecifieke en tijdsafhankelijke invoer. De resultaten zijn daarom ook variabel in ruimte en tijd.
De NMI bevat momenteel modules voor de berekening van:
• emissie van gewasbeschermingsmiddelen naar de lucht, inclusief de vervluchtiging uit kassen; • emissie van gewasbeschermingsmiddelen naar het grondwater als gevolg van uitspoeling, inclusief
de uitspoeling van grondgebonden kasteelten;
• emissie van gewasbeschermingsmiddelen naar oppervlaktewater als gevolg van laterale drainage en drift, inclusief de laterale drainage van grondgebonden kasteelten;
• emissie vanuit puntbronnen in de kasteelt en de afspoeling van erven bij de ontsmetting van bollen; • potentiële acute en chronische effecten in de bodem van behandelde percelen;
• potentiële acute en chronische effecten in het oppervlaktewater als gevolg van de driftbelasting; • potentiële acute en chronische effecten op terrestrische organismen die foerageren op behandelde
percelen;
• potentiële effecten op het grondwater als bron voor de drinkwatervoorziening.
De modules voor de berekening van potentiële chronische effecten zijn nieuw in versie 2. Daarnaast werd een aantal meer technische aanpassingen doorgevoerd.
Emissies worden berekend als hoeveelheid (kg) werkzame stof; potentiële effecten als
Milieu-Indicator Punten (MIP’s). Resultaten van de berekeningen kunnen zichtbaar worden gemaakt op kaarten. Getalsmatige uitvoer is verder onder andere mogelijk per gewas, per sector en voor Nederland als geheel.
De concepten voor de berekeningen gaan uit van een toepassing van een gewasbeschermingsmiddel op veldschaal, maar de benodigde invoer is niet voorhanden voor die schaal. Gegevens over toepassingen zijn ontleend aan landelijke enquêtes. De toepassing van de NMI is dan ook vooral op landelijke schaal. Bij gebruik van dezelfde invoergegevens zullen resultaten minder betrouwbaar zijn als voor regio’s wordt gerekend; de betrouwbaarheid hangt dan af van de representativiteit van de landelijke invoergegevens voor de betreffende regio. Om voor regio’s betrouwbare uitvoer te krijgen zullen op de regio toegespitste invoergegevens moeten worden gebruikt.
1
Introduction
On behalf of the Netherlands Ministry of Agriculture, Nature and Food Quality (LNV) and the Netherlands Ministry of Housing, Spatial Planning and the Environment (VROM) the research institutes ALTERRA and RIVM develop a computation system for the calculation of environmental indicators, called NMI. The computation system should be capable of calculating:
• loads of various environmental compartments with plant protection products; • potential effects of these products in distinguished environmental compartments.
The purpose of the NMI is to support the evaluation of plant protection programmes of the Dutch Government, such as laid down in the policy document ‘Nota Duurzame Gewasbescherming (Sustainable Plant Protection)’ (LNV, 2004).
The NMI builds upon earlier Dutch studies regarding the development of environmental indicators for pesticides (Brouwer et al., 1999; Brouwer et al., 2000). In these studies, emissions of plant protection products to surface water and groundwater, potential effects on aquatic organisms and potential effects on the quality of groundwater were calculated according to methods which, at the time, were also used in pesticide registration. In addition, potential effects on birds were calculated. However, the
calculation method for this differed slightly from the method used in registration. Characteristic for the calculation methods used in pesticide registration in that period was the use of a few fixed scenarios; environmental conditions were highly standardised, temporal variations were categorised into two seasons and spatial differences were not taken into account. The NMI differs from the earlier studies especially with regard to the spatial and temporal variability.
1.1
Overview of indicators
The NMI currently is capable of calculating the following indicators:
• emission of plant protection products (PPP) to air resulting from volatilisation during application, volatilisation from the plant canopy and volatilisation from the soil;
• emission of PPP to air by volatilisation from greenhouses; • emission of PPP to groundwater resulting from leaching;
• emission of PPP to surface water resulting from lateral drainage and drift during application; • emission of PPP to surface water resulting from treatment of plant material;
• potential acute effects in the soil of treated fields; • potential chronic effects in the soil of treated fields;
• potential acute effects in surface water resulting from drift to surface water; • potential chronic effects in surface water resulting from drift to surface water; • potential acute effects to terrestrial organisms feeding on treated fields; • potential chronic effects to terrestrial organisms feeding on treated fields;
• potential effects of leaching to groundwater regarding its potential use as source for drinking water; • potential chronic effects to groundwater inhabiting organisms.
Some of the indicators require external data selection. For example, a set of reference values for ecotoxicological effects (relevant ecotoxicological concentrations) have to be chosen and this set has to be imported in the NMI database.
Modules for calculating additional indicators can and will be added to the system. The following indicators are being developed:
• potential chronic effects in surface water resulting from lateral drainage. The set-up of the package is such that other indicators can be added quite easily. No emissions are calculated for:
• applications of liquid soil disinfectants (the liquid soil disinfectants are not included in the national surveys on the use of PPP; for these substances the use is authorised on a case by case basis); • non-agricultural applications (insufficiently detailed use data available; no calculation method
implemented);
• surface runoff from agricultural fields (no satisfying calculation method available yet); • seed disinfection, all methods (spraying, slurrying, coating, powdering, etcetera) (no satisfying
calculation method available yet; no use data for seed disinfection available);
• algae removal from the glass deck of greenhouses (no satisfying calculation method available yet); • pheromone applications (insufficiently detailed use data; no satisfying calculation method available
yet);
• rodenticide applications (bait, smoke tablets, etcetera) (no satisfying calculation method available yet).
For some of these applications the emissions are assumed to be zero due to the fact that a suitable method for their calculation has not yet been implemented or is missing; for some other applications (non-agricultural applications, seed disinfection, pheromones) sufficiently detailed information about the use of products is lacking and calculated emissions would be very uncertain.
1.2
General principles
All potential environmental effect indicators described in this report are based on the principle of relating predicted environmental concentrations to ecotoxicological effect concentrations or environmental concern concentrations. By definition the value of one for the ratio of the predicted environmental concentration to the ecotoxicological effect concentration is called an Environmental Indicator Unit (EIU); in Dutch: Milieu-Indicator Punt (MIP):
ECC
PEC
EIU
=
Eq.1-1in which:
EIU Environmental Indicator Unit, (-)
PEC Predicted Environmental Concentration, (e.g. mg kg-1 or µg dm-3) ECC Environmental Concern Concentration, (e.g. mg kg-1 or µg dm-3)
The Predicted Environmental Concentration is either an initial concentration or a long-term concentration. The initial concentration is used when assessing acute effects occurring within a few
hours, while the long-term concentration is used when assessing chronic or semi-chronic effects due to exposure for a couple of weeks. Chapter 4 gives details of the calculation of the various indicators.
1.3
Running the system, input and output
The NMI is an ensemble of databases, calculation modules and report facilities. The databases contain all the information to calculate emissions and potential impacts for all registered plant protection products that are used in agriculture in the Netherlands; at this moment for the period 1998 – 2005. In order to target calculations to specific needs, the user can make selections with respect to:
• plant protection products, one – all (option to select all substances belonging to a functional group at once);
• period, month – year;
• crop, single crop – all (option to select all crops in an agricultural sector at once); • area, municipality - whole country, (see section 1.4 for limitations);
• indicators (one – all) (several options, for example emissions only or spray applications only). Some of the indicators require selection of (eco)toxicological endpoints before running the system. The data in the substances database need to be compatible with the selected indicator or the selected ecotoxicological endpoint (see also section 2.9 and Appendix 5). The selection of the data is not a feature of the NMI. Appropriate data have to be selected off-line and transferred to the NMI database. The user is responsible for the consistency of the data.
Output of the software package is by means of tables (output data files that can be imported in spreadsheets) and maps. The amount of output is dependent on user specifications and ranges from very huge amounts, when output for each grid cell is selected, to rather limited amounts, when only total area sums are requested.
1.4
Limitations
Calculations in the NMI are set up to run on the scale of one application, i.e. the field scale. The most detailed output, however, is at the scale of one square kilometre. The spatial scale at which the NMI is to be used is determined by the input data. The current database of the NMI contains input values valid for the regional scale (crop, soil and climate data) and national scale (pesticide use data). The
representativeness of the use data will usually determine the reliability of the results and limit the scale at which the NMI is used. The limited experience so far has indicated that results may still be
acceptable at the regional scale (Kruijne et al., 2007).
The temporal scale of the NMI is also determined by the detail of the input database. The current database contains monthly averages of input values regarding applications of plant protection products and weather data. The finest temporal resolution is therefore one month. Calculations on emissions and impacts initially are for a surface unit of 1 ha; upscaling to larger areas is based on the total treated area, i.e. results for the larger area are obtained by multiplying results for one hectare by the area on which the respective plant protection products are used.
1.5
Set-up of the report
Chapter 2 describes input data and parameters for the exposure and potential effect calculations, to a limited degree of detail with reference to original descriptions. Chapter 3 describes how emissions from the target areas are calculated. Finally, chapter 4 describes the calculation of Predicted Environmental concentrations and Ecological Concern Concentrations for the various environmental compartments and their organisms and the potential environmental impacts.
2
Input data
The NMI uses large amounts of input data, regarding: • soil data, variable in space;
• climate data, variable in space and time (for example different long term average temperature for each month);
• crops, acreages and their distributions over the Netherlands, variable in time (two distinct years included at the moment);
• for greenhouses: the areas soil bound cultivation and substrate cultivation, variable in time; • for greenhouses; recirculation of drainage water and recirculation of condensation water; • PPP use data, variable in space and time, dependent on the crop;
• information on application techniques;
• crop interception data, varying with crop and growth stage;
• drift data, depending on crop, application technique and drift reduction measures; • pesticide fate and ecotoxicology data.
The different input data are discussed in some detail in the following paragraphs.
The primary goal of the NMI is to serve as an evaluation tool. Although the NMI calculation methods resemble the methods used by the Board for the authorisation of plant protection products and biocides (Ctgb) to a great extent, it is not a tool to be used in the registration procedures. As local input with respect to climate, land use and timing of the application may highly influence the potential effects of the PPP, especially geographical information has been added to enlarge the evaluation capacity of the NMI.
2.1
Geographical information
The exposure concentrations as calculated by the NMI vary with both the time of application of the plant protection product (month of the application) and the location at which they are applied. Time influences the exposure concentrations because of temperature differences and differences in growth stage of the plants over the year. Because the parameters have spatial variability, the resulting exposure concentrations vary with space too. Characteristics of locations (x,y-co-ordinates) are stored into geographical databases, from which they are retrieved during the calculations.
In the STONE-instrument, a plot is defined by a unique combination of meteorology, physical and chemical soil conditions, boundary conditions for drainage flow, and boundary conditions for regional groundwater flow. The STONE-schematisation of the Netherlands has a resolution of 6.25 ha
(250 x 250 m grid cells) and contains 6405 different plots (Kroon et al., 2001). An overlay was made of this national schematisation with the crop distribution maps (100 ha cell size (1 * 1 km2), see
section 2.5). So a NMI grid cell contains at maximum 16 STONE cells. Although in principle
calculations are on a hectare basis and the NMI computes indicator units for each application of a plant protection product on an agricultural field, output is generated per grid cell.
2.2
Soil data
Soil characteristics (organic matter content, dry bulk density and pH) for each of the cells of 1 * 1 km2 were taken from the STONE instrument (Kroon et al., 2001). The original data, available at the 250 * 250 m2 scale were aggregated to the desired cell size. For the aggregation area weighted means
over the 100 ha-cells were calculated.
2.3
Hydrological data
The NMI uses a metamodel of GeoPEARL for dividing the amount of PPP leaching downwards from the root zone (section 3.2.1) in two components; i) drainage flow of PPP towards the surface water, and ii) flow of PPP towards the groundwater. A prototype of GeoPEARL was used to calculate these two components for each STONE plot and for 20 combinations of PPP and application time (May, 15th or November, 1st). The median fraction of drainage flow is used for calculating the local emission by
drainage flow towards surface water.
Aggregation of the median fraction of drainage flow depends on the seepage conditions: 1. if there is no upward seepage within the 100 ha-cell, the mean of the STONE grid cells (see
section 2.1) is used to calculate lateral drainage flow;
2. if there is upward seepage in one or more STONE grid cells (see section 2.1) within the NMI grid cell, the area weighted national average lateral drainage flow is used to calculate the lateral drainage flow for the grid cell.
The density of surface watercourses within the NMI grid cells is based on the topographical map (TOP10-vector; scale 1 : 10000) and stored as the surface area ratio water : land per 100 ha-cell (assuming a constant water width of 1 m at all locations).
2.4
Climate data
For 15 meteorological regions daily average temperatures over a 20-year period (1981 – 2000) were provided by the Dutch Royal Meteorological Institute. Each grid cell in the STONE schematisation (see section 2.1) is assigned to one of the 15 meteorological stations. Monthly and yearly averages for NMI grid cells are calculated as the area weighted mean over the STONE cells within the NMI grid cell.
2.5
Crops
The crop definitions and crop areas in the NMI follow the classification system of Statistics Netherlands (CBS and LEI; 1998, 2004). In these statistics only the net arable land use surfaces are used, i.e. the agricultural land use without roads, edges and green borders (non-target crops). Depending on the application data available, these crops in the CBS-classification system can be included in the NMI. An NMI-crop is defined as a group of crops in the CBS-classification system. The resulting NMI-crop list contains 40 arable crops and 14 greenhouse crops including mushrooms (survey 1998). The total crop areas for both survey years are shown in Table 2.1.
The NMI-crop maps are calculated based on the crop statistics and on the land use map of the
Netherlands (LGN4, LGN5; www.lgn.nl). The land use map has a resolution of 25 * 25 m2. The legend of the LGN contains nine agricultural land use classes; pasture, maize, potatoes, sugar beets, cereals, greenhouses, fruit orchards, flower bulbs and other crops besides several non-crop classes. The
calculation procedure combines the detailed classification of municipality based crop statistics with the high resolution of the land use data:
1. aggregate each agricultural land use class from 25 m x 25 m pixels to a surface area per grid cell (in % per 100 ha);
2. relate each crop to an agricultural land use class;
3. distribute in each municipality the area of a crop among the grid cells containing the related land use class;
4. aggregate the area of CBS-crops to the area of NMI-crops per grid cell (in ha per 100 ha). Table 2.1 Data sources and summary data of the combination of crop statistics and land use for the two crop data sets in the NMI
crop statistics (CBS) land use data NMI version 2
survey (year) number of municipalities number of crops (CBS) database version satellite images (year) number of crops (CBS) with application data available number of NMI-crops area covered with NMI-crops (%) 1998 540 123 LGN4 1999, 2000 69 54 95 2004 483 160 LGN5 2003, 2004 74 57 94
2.6
Plant protection product use data
Data on the use of plant protection products were obtained from databases of the Agricultural
Economics Research Institute (LEI) and Statistics Netherlands (CBS), for the year 1998 and 2004. Both surveys where used to get the most reliable and national samples from a great range of pesticide uses in agriculture and horticulture. The survey of 2004 is almost entirely based on CBS data, because LEI data were not completely available. Pesticide use on grass was obtained from LEI because this was not covered by the CBS survey. Based on these surveys, the data are transformed from usage of plant protection products to active substances per crop per month. More details are given in Smidt et al. (2002).
The resulting data set provides information about: • crop; • active ingredient; • (target) object; • application method; • month; • dosage;
• number of applications per year; • fraction treated area.
Table 2.2 gives some background information on the surveys of LEI and CBS.
Table 2.2 Number of polls underlying the 1998 and 2004 use data sets
sector LEI 1998 CBS 1998 totals 1998 CBS 2004 arable farming 1344 165 1509 1112 bulbs 149 109 258 235 floriculture glasshouse 157 90 247 420 tree nursery 96 86 182 491 mushrooms 21 67 88 33 fruits 110 191 301 188 vegetables glasshouse 57 110 167 155
vegetables open air 199 61 260 569
cattle1 517 163 680 488
total 2650 1042 3692 3691
1) CBS 1998 only fodder maize 1) LEI 2004 grass survey
The NMI-database contains the average, annual dosage. The NMI is not prepared for handling regional based application data. For this reason, the usage of wet soil fumigants could not be included in the NMI-database.
Yearly sales data (the so-called RAG data), as gathered by the Dutch bureau ‘Dienst BasisRegistratie’, are used to adjust the above-mentioned LEI and CBS data so as to bring them in line with yearly total sales of each individual active substances. After editing (e.g. converting to active ingredient) the information on yearly sales of pesticides in the Netherlands is provided for use in the NMI by the Dutch Plant Protection Service.
Sales data include amounts of pesticides used by professionals on non-agricultural crops and other objects (for example sports grounds and pavements). As the NMI is intended to calculate emissions and effects from agricultural uses of plant protection products and calculation methods not necessarily are valid for non-agricultural uses of plant protection products, the sales data are corrected for the amounts used outside agriculture. Corrections were based on surveys as described by Syncera (2005).
The crop definitions (Appendix 3) and application data from the survey year 1998 are used for the calculations for the years 1998 - 2001, whereas the survey year 2004 is used for calculation years 2002 – 2005. This breakpoint between 2001 and 2002 more or less coincides with the implementation of the drift emission reduction measures according to the regulation ‘Lozingenbesluit Open Teelt en Veehouderij (LOTV)’.
2.7
Application techniques
Data on application techniques were also obtained from LEI and CBS. The data are gathered along with the use data in the previous paragraph. The data were grouped to enable the correct choice of the calculation method for the amount of pesticide emitted from the target area (Table 2.3). The way plant protection products are applied may affect the emission to environmental compartments and therewith the potential impact of the plant protection product.
Table 2.3 Application techniques, emission routes and receiving environmental compartments
environmental compartment and emission route
air surface
water soil
ground water
object application technique
spr ay dr ift loss while applicatio n volatilisation fr om crop, so il or h ard s urface spray drift * latera l drainage ru no ff (p oin t s ou rces ), leaching f rom casks, etc. de position leaching
field applications (whole field treatments):
crop field spraying * x x x x x x
soil (surface) field spraying * x x x x x
non-spraying x x x
soil (mixing) field spraying * x x x
non-spraying (granules) x x x
field applications (partial treatments):
crop local spraying x
stem lubricating, aerosol x x
in/near buildings:
bulb dipping / disinfection x
crop root x x
stable spraying x x
greenhouses:
crop spraying, fogging, LVM$ x x^ x x#
soil (surface) spraying, fogging, LVM x x^ x x#
soil (mixing) spraying, granules, etc. x^ x x#
* field spraying by a field sprayer in combination with drift reducing methods (see section 2.8)
^ only for crops not cultivated on substrate
# only for crops not cultivated on substrate, in greenhouses without a pipe drainage system $ low volume mist application
Leaching to groundwater is calculated for all soil bound crops, both open air crops and greenhouse crops. Leaching is not calculated for crops grown on artificial substrates. For crops grown on both soil and artificial substrates, the fraction soil bound crop is used to calculate the leaching. Table 2.4 gives the soil bound fraction for these crops. Information is taken from the Geographical Information System for Agricultural Farms (GIAB) for the years 1998 and 2004.
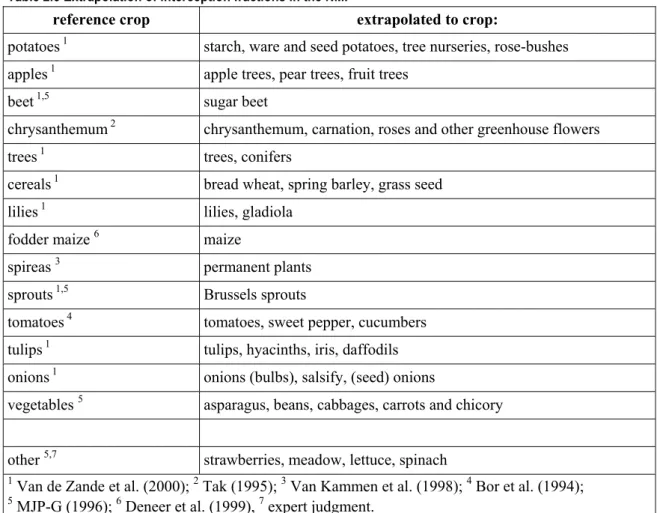
If a plant protection product is sprayed over the crop, part of the dose may be intercepted by the crop. The percentage intercepted is dependent on the growth stage of the crop and the application technique. Appendix 4 gives the interception fractions, whereas Table 2.5 gives the extrapolation to crops not covered by the original data.
Table 2.4 Greenhouse crops rooting in soil (fraction of the total crop area), the remaining part of the crop area is substrate
survey year crop sector
1998 2004
freesias 0.96 1.00
lilies (glasshouse culture) 0.96 0.97
chrysanthemum 0.94 1.00
pot plants (green) 0.90 0.90
pot plants (flowers) 0.90 0.90
carnation 0.62 - orchids 0.58 0.70 roses (glasshouse) 0.29 0.26 gerberas 0.25 0.23 alstroemeria floriculture (greenhouse) - 0.87 sweet pepper 0.08 0.17 cucumbers 0.07 0.15 tomatoes 0.06 0.15 radish
glass vegetables (greenhouse)
Table 2.5 Extrapolation of interception fractions in the NMI
reference crop extrapolated to crop:
potatoes 1 starch, ware and seed potatoes, tree nurseries, rose-bushes
apples 1 apple trees, pear trees, fruit trees
beet 1,5 sugar beet
chrysanthemum 2 chrysanthemum, carnation, roses and other greenhouse flowers
trees 1 trees, conifers
cereals 1 bread wheat, spring barley, grass seed
lilies 1 lilies, gladiola
fodder maize 6 maize
spireas 3 permanent plants
sprouts 1,5 Brussels sprouts
tomatoes 4 tomatoes, sweet pepper, cucumbers
tulips 1 tulips, hyacinths, iris, daffodils
onions 1 onions (bulbs), salsify, (seed) onions
vegetables 5 asparagus, beans, cabbages, carrots and chicory
other 5,7 strawberries, meadow, lettuce, spinach
1 Van de Zande et al. (2000); 2 Tak (1995); 3 Van Kammen et al. (1998); 4 Bor et al. (1994); 5 MJP-G (1996); 6 Deneer et al. (1999), 7 expert judgment.
2.8
Drift
Spray drift data are stored in the NMI database, with different values for the two survey years. Drift data were constituted using four data sources:
• data on spraying equipment and spraying techniques, resulting from the surveys by Statistics Netherlands (see also section 2.6);
• spray drift data for standard spraying techniques under standard conditions, derived from research by Van de Zande et al. (1997) and Porskamp et al. (2001);
• spray drift reduction data resulting from measures to reduce spray drift to surface water; • data on the degree of implementation of such measures in Dutch agriculture in 1998
(Wingelaar et al., 2001) and in 2004 (Vijftigschild, 2006)).
This information was used to construct drift tables. For the year 1998, standard spraying techniques were assumed (including standard no-spray zones) and standard spray drift factors were assigned to each combination of crop and application technique. For the year 2004, by regulation (LOTV; Kalf and Roex, 2003), Dutch farmers should apply drift reduction techniques when spraying plant protection
products in the open field. Minimum drift reductions percentages, resulting from these techniques, are given in the regulation. These reduction percentages were included in the drift tables for 2004. Often more than one application technique will be used to spray a specific plant protection product on a crop. Weighted average values are then used for the combination crop and PPP.
2.9
Substance fate and ecotox data
For calculating environmental exposure a number of physico-chemical and fate data of plant protection products are necessary. The physico-chemical data include: molar mass, saturated vapour pressure and solubility in water. For acidic substances in addition the acid dissociation constant (pKa) is necessary.
The fate data include: the constant for sorption on soil organic matter (KOM) (for acidic substances for
both the molecular and the ionic species) and the transformation constant (DegT50) in soil under
reference conditions. For metabolites essentially the same information is necessary and, in addition, the formation fraction, i.e. the molar fraction of the parent that is transformed into the metabolite. The ecotox data include LC50, EC50, LD50 and NOEC values for algae, birds, daphnia, earthworms and fish.
Appendix 5 gives a listing of all necessary substance fate and ecotox data as well as some
miscellaneous data. Substance data need to be provided by the user of the instrument. The user should take care of providing data which are consistent with the requirements of the NMI. For easy reference units have been added to the table.
3
Emission indicators
One of the features of the NMI is that it can calculate emissions of plant protection products to non-target areas and compartments. The following non-target areas and compartments are distinguished:
• air
• groundwater; • surface water;
• neighbouring nature areas.
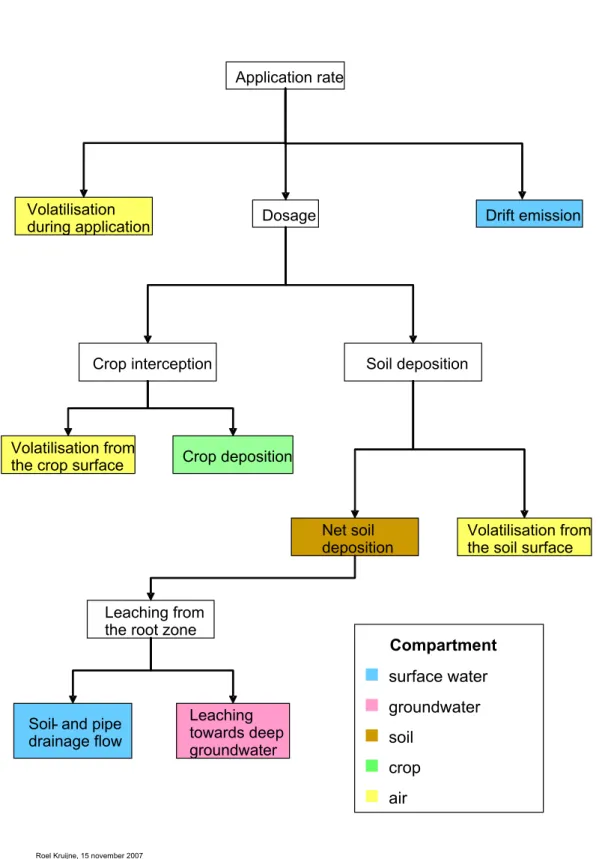
This chapter describes the methods for calculating the emissions. Figure 3.1 gives an overview of included processes for open air applications. In general it is not possible to keep balance of all flows. The reason for this is that parameters for the individual processes are not always derived from experiments keeping balance of all processes. In contrary, often a single process is considered and parameters are related to the (nominal) dose applied in the experiment. For example, drift deposition onto surface water is expressed as the fraction (or %) of the nominal deposition on the target field per unit surface area (usually expressed in mg m-2), not as fraction of the total amount applied. As field dimensions are unknown, it is impossible to convert drift deposition fraction into absolute amounts.
Figure 3.1 Overview of included processes for open air applications Application rate
Dosage Drift emission
Volatilisation during application
Volatilisation from the soil surface Volatilisation from
the crop surface
Soil deposition Crop interception
Crop deposition
Leaching from the root zone
Soil - and pipe drainage flow Leaching towards deep groundwater Net soil deposition
Roel Kruijne, 15 november 2007
Compartment
surface water
groundwater
soil
crop
air + + + +3.1
Air
Volatilisation to air is calculated for three routes: • volatilisation during application;
• volatilisation from plant leaves; • volatilisation from the soil surface.
Volatilisation during application was studied by Holterman (2000); his results are included in the NMI:
A
f
E
app,air=
al Eq.3-1with:
Eapp,air emission to air during application, (kg ha-1)
fal fraction of the dose lost during application, (-), default 0.03
A the nominal rate for a single application, (kg ha-1)
For a typical spray application on arable fields 3% of the applied amount stays in the air for a longer period and can be transported to outside the treated area. A part of the spray-droplets is or becomes so small that they stay air-born and their residence in the air is prolonged. The fraction volatilised during spraying when using an axial sprayer, as for instance in fruit cultivation and tree nurseries, might be higher. Data to support this assumption are lacking.
The volatilisation from plant leaves is calculated using the regression equation (Smit et al., 1998; Smidt et al., 2000):
(
CV
crop)
1
.
661
0
.
316
log
( )
P
satlog
=
+
Eq.3-2with:
CVcrop the cumulative volatilisation (% of amount reaching the crop)
Psat the saturated vapour pressure of the substance (mPa), Psat ≤ 11.8 mPa.
The regression equation is based on a relatively small number of experiments. Psat is dependent on the
temperature (see Eq.3-3) and therefore the amount volatilised is dependent on the time and the place of application, which determine the temperature. If Psat ≥ 11.8 mPa the cumulative volatilisation is taken
⎟
⎟
⎠
⎞
⎜
⎜
⎝
⎛
⎟⎟
⎠
⎞
⎜⎜
⎝
⎛
−
Δ
−
=
r vap r sat satT
T
R
H
P
P
,exp
1
1
Eq.3-3 with:Psat,r the saturated vapour pressure at reference conditions, (mPa)
ΔHvap molar enthalpy of vaporisation, J mol-1, (value 95000 J mol-1)
R molar gas constant, (J mol-1 K-1), (value 8.314 J mol-1 K-1)
T local temperature, (K)
Tr reference temperature, (K), (value 293.15 K)
Eq.3-2 was derived for non-dissociating substances. Charged substances in general have a negligible tendency to volatilise. For weak acidic substances only the non-ionised form contributes to the volatilisation. For these substances, the volatilisation from the crop is corrected for the dissociation:
crop crop ND crop
f
CV
CV
=
, Eq.3-4 with:(
pHapp pKa)
crop NDf
−+
=
10
1
1
, Eq.3-5 where:fND,crop the fraction not–dissociated substance on the leaf surface, (-)
pHapp the pH of the application solution, (-), default pHapp = 7
pKa the dissociation constant of the substance, (-)
For substances which become positively charged dependent on the pH (i.e. bases), in principle the volatilisation will become lower with declining pH. In databases, however, very few pKa for such
substances are recorded. Therefore the influence of pH on the volatilisation of these substances is neglected in the NMI. For inorganic substances almost never saturated vapour pressures are recorded in databases. For these substances, the saturated vapour pressure is set to zero and therefore the calculated volatilisation will be zero too.
The total amount of substance volatilised from the crop, assuming no wash-off from the plants, is calculated according to:
(
)
100
, , air app i crop air cropE
A
f
CV
E
=
−
Eq.3-6 with:Ecrop,air the total amount volatilised from the crop, (kg ha-1)
fi fraction intercepted by the crop, (-), input from database
Volatilisation from the soil surface is also calculated using a regression equation (Smit et al., 1997; Smidt et al., 2000):
(
gas)
soil
FP
CV
=
71
.
9
+
11
.
6
log
100
Eq.3-7in which CVsoil is the cumulative volatilisation from the soil surface (% of amount reaching the soil)
and FPgas is calculated from:
sl soil liquid gas gas gas
K
K
K
FP
lg lgρ
ε
ε
ε
+
+
=
Eq.3-8 with:FPgas the fraction of substance in the gas phase, (-), 0 ≤ FPgas ≤ 1
εgas the volumetric gas fraction, (volume gas per volume soil)
εliquid the volumetric liquid fraction, (volume soil solution per volume soil)
ρsoil the soil dry bulk density, (kg dm-3)
Klg the liquid to gas partitioning coefficient, (-)
Ksl the soil to liquid partitioning coefficient, (dm3 kg-1), (see Eq.3-16 and Eq.3-17)
The volumetric gas fraction is calculated according to:
εgas = 1 - εliquid - εsolid Eq.3-9
with:
εsolid = ρsoil / ρsolid Eq.3-10
and:
ρsolid = 1 / (om5 / ρom + (1 - om5)/ ρmin ) Eq.3-11
εsolid the volumetric solid fraction, (volume solid parts per volume soil)
ρsolid the density of the solid phase, (g cm-3 of soil)
om5 the organic matter fraction of the top 5 cm of the soil, (-)
ρom the density of organic matter, (= 1.47 g cm-3 of soil)
The liquid to gas partitioning coefficient, Klg, is the inverse of the dimensionless Henry coefficient, KH (-):
S
T
R
M
P
K
gridcell sat H001
.
0
=
Eq.3-12 with:M molar mass, (g mol-1)
R molar gas constant, (8.314 J mol-1 K-1) Tgridcell temperature of the grid cell, (K)
S solubility in water, (mg dm-3)
0.001 conversion factor from mPa to Pa
The Henry coefficient is dependent on the temperature as both the saturated vapour pressure (see Eq.3-3) and the water solubility are dependent on temperature:
⎟⎟
⎠
⎞
⎜⎜
⎝
⎛
⎟⎟
⎠
⎞
⎜⎜
⎝
⎛
−
Δ
−
=
r dis rT
T
R
H
S
S
exp
1
1
Eq.3-13 with:Sr the solubility in water at reference temperature, (mg dm-3)
ΔHdis the molar enthalpy of dissolution, J mol-1, value 27000 J mol-1
Dissociation of substances also influences the partitioning of the substance over the three phases in the soil. For weak acidic plant protection products Eq.3-8 is modified to account for the dissociation of the substance:
⎟
⎟
⎠
⎞
⎜
⎜
⎝
⎛
+
+
=
soil ND sl soil liquid gas gas gasf
K
K
K
FP
, lg lgρ
ε
ε
ε
Eq.3-14 with: ) ( ,10
1
1
a gridcell pK pH soil NDf
−+
=
Eq.3-15 where:fND,soil the fraction not–dissociated substance in the soil surface layer, (-)
The partitioning of the substance over the solid phase and the liquid phase is expressed by the partitioning coefficient Ksl, according to:
om sl
om
K
K
=
5 Eq.3-16and, for substances with pH-dependent sorption behaviour:
com om sl
om
K
K
=
5 , Eq.3-17with:
Kom the organic matter sorption constant, (dm3 kg-1)
Kom,com the combined sorption constant, (dm3 kg-1), see Eq.3-27
The volatilisation from the soil surface is dependent on the time of application (as this influences temperature) and the location (as this determines temperature and soil type and, therefore, FPgas). The
total amount volatilised from the soil surface, assuming no wash-off from the plants, is:
(
)
100
)
1
(
, , air app i soil air soilE
A
f
CV
E
=
−
−
Eq.3-18 with:Esoil,air the total amount volatilised from soil, (kg ha-1)
100 factor to convert % to fraction
The total volatilisation (emission to air) for each substance is the sum of the individual volatilisation routes.
Except for soil fumigants, the amount of substance volatilised from the bulk soil usually is negligible and therefore not considered in NMI version 2. As stated earlier, soil fumigants are not included in the database of version 2 of the NMI.
Emissions from greenhouses by volatilisation to air is calculated based on the saturated vapour pressure of the substance and the application technique. Table 3.1 shows the volatilisation fraction for
applications with high volume techniques, fogging and low volume techniques.
Table 3.1 Volatilisation for combinations of vapour pressure class and application technique (fraction of the application rate)
vapour pressure (mPa)
high volume fogger low volume
< 0.01 0.01 0.01 0.05
≥ 0.01 - < 0.1 0.05 0.05 0.15
≥ 0.1 - < 1 0.1 0.25 0.25
≥ 1 - < 10 0.3 0.35 0.35
3.2
Groundwater
The NMI calculates leaching to groundwater starting from the net soil deposition:
d sw air soil air crop air app N
A
E
E
E
E
S
=
−
,−
,−
,−
, Eq.3-19 with:SN the net soil deposition, (kg ha-1)
Esw,d emission to surface water as a result from drift, (kg ha-1)
The nominal rate for a single application is obtained from the pesticide use table, which is based on pesticide use inventories by Statistics Netherlands (CBS) and the Agricultural Economics Research Institute (LEI) (see chapter 2.4). For a detailed description: see Smidt et al. (2002). The fraction washed off from the canopy is unknown; information is lacking and the (default) value is taken to be zero. The leaching process is relatively slow compared to other emission processes and, therefore, transformation processes have to be taken into account when calculating emissions due to leaching. Transformation results in dissipation of a plant protection product and only a fraction of the net soil deposition will leach to groundwater. Transformation however also results in metabolites or other degradation products. (In the remainder of the text the term metabolites includes also other degradation products.) In principle, the NMI is capable of calculating the leaching of all metabolites, provided that the fate parameters of the metabolite and the relationship of the metabolite with a parent substance are included in the substances database. The relationship of parent and metabolite is indicated by a formation fraction, i.e. the amount of metabolite formed in mole equivalents of the parent. Also indirectly formed metabolites are related in this way to the parent. By including information on metabolites, the user of the NMI decides which metabolites are taken into account in the calculations. The leaching of a substance is highly dependent on environmental conditions and chemical properties of the substance. The use of a generic leaching fraction is therefore not possible. Instead, a leaching fraction is calculated for each substance separately (see section 3.2.1) and this leaching fraction is used to calculate the leaching amount. The leaching to the depth of one metre below soil surface is
calculated from: N PEARL fle p gw
f
F
S
E
,=
Eq.3-20 N PEARL m p p m fle m gwf
F
S
M
M
f
E
,=
, Eq.3-21 with:Egw predicted amount leaching to groundwater (depth one metre), (kg ha-1)
FPEARL the leaching fraction obtained from the PEARL metamodel (see section 3.2.1), (-)
M molar mass, (g mol-1)
ffle factor to account for the fraction leaching error (see section 3.2.1), (-)
fp,m the molar fraction of the parent molecule converted to the metabolite, (-)
The total amount leaching to groundwater at a depth of one metre is the sum of the amounts calculated for the parent and all relevant metabolites. For multiple applications the total amount reaching the soil is used to calculate the leaching. There is no correction for transformation of substances in between the applications. This is because transformation is already accounted for in the PEARL model; correction would lead to an overestimation of the transformation.
The net amount of pesticide arriving at the bottom of the unsaturated zone of the soil may be subject to further leaching to the deeper groundwater, but also subject to lateral drainage. The fractions lateral drainage to surface water (fdr) and leaching to groundwater (1-fdr) were calculated by running
GeoPEARL for a number of representative substances and calculating the average of the fractions for each grid cell (see also section 2.3). The results were then stored as an attribute of the soil map and used in the calculations as appropriate. The amounts leaching to deeper groundwater are calculated as:
)
1
(
,p fle PEARL N dr dgwf
F
S
f
E
=
−
Eq.3-22and for metabolites as:
)
1
(
, , pm PEARL N dr p m fle m dgwf
F
S
f
M
M
f
E
=
−
Eq.3-23 with:Edgw emission to deeper groundwater as a result of leaching, (kg ha-1)
fdr fraction lateral drainage, (-), see section 2.3
The amounts going to surface water via lateral drainage, Esw,ld,p and Esw,ld,m are calculated analogously
with (1-fdr) replaced by fdr.
Leaching from greenhouses is calculated for soil bound crops (crops rooting in soil). Emissions to the groundwater is calculated when no drainage system is underlying the greenhouse. As it has been demonstrated that the leaching is underestimated by PEARL (Lieffijn et al., 2000) an additional leaching, proportional to the application rate is assumed. Emission by leaching from greenhouses therefore consists of i) a part depending on the physico-chemical properties of the substance (section 3.2.1), and ii) a fixed part of the application rate (0.1%).
3.2.1
Metamodel of PEARL
The NMI uses a metamodel of the PEARL model (Tiktak et al., 2000; Leistra et al., 2001) to calculate leaching to groundwater. The metamodel interpolates (logarithmically) between results obtained for standard runs with the PEARL model, using the half-life and the sorption constant of the plant protection product. The standard runs consisted of runs with the (former) standard Dutch scenario for variable half-life (range: 1 to 200 days), variable sorption constant (range: 0 to 200 dm3 kg-1) and variable application time (one for each month). A standard spray application of 1 kg ha-1 to the soil surface was assumed and volatilisation was switched off. The results, the maximum average concentration in the upper metre of the groundwater, CPEARL (mg m-3 or μg dm-3), and the fraction
leached to groundwater, FPEARL (-), were transferred and stored into an NMI database. The metamodel
Spatial variation in leaching is approximated by accounting for differences in temperature and
differences in soil organic matter content in the grid cells. Differences in temperature are accounted for by calculating the local half-life for the plant protection product and using this local half-life in the interpolation procedure. The local half-life is calculated according to:
T l
f
DegT
DegT
50 , 50=
Eq.3-24 with:⎟
⎟
⎠
⎞
⎜
⎜
⎝
⎛
⎟
⎟
⎠
⎞
⎜
⎜
⎝
⎛
−
Δ
−
=
SS lt gridcell T TT
T
R
H
f
exp
1
1
, Eq.3-25 with:DegT50,l the local half-life in the grid cell, (d)
DegT50 the nominal half-life of the substance as listed in the substance table, (d)
fT factor denoting the influence of temperature, (-)
ΔHT molar enthalpy of transformation, (J mol-1), (default value 54000 J mol-1)
R molar gas constant, (J mol-1 K-1), (value 8.314 J mol-1 K-1) Tgridcell,lt long term average temperature of the grid cell, (K)
TSS long term average temperature of reference scenario, (K), (value 282.36 K ≡ 9.21 ºC)
The factor fT is based on the long term average temperature because it accounts for the (relatively)
small differences in temperature between the meteo districts in the Netherlands, while the day to day variations are already accounted for in the original calculations with PEARL.
The DegT50 is read from the NMI substance database. The DegT50 can be based on results from
standard laboratory tests, but also on results from so-called higher tier experiments. The selection of the appropriate DegT50 is done outside the NMI; the NMI uses the value provided via the NMI substance
database.
Differences in soil organic matter are accounted for by calculating local sorption constants. The local sorption constant of a substance in this approach is calculated from the sorption constant in the
substance table and the organic matter content in the top 35 cm layer of the soil, which is dependent on the location: om ref grid l om
om
K
om
K
,=
Eq.3-26 with:Kom,l the local sorption constant, (dm3 kg-1)
Kom the sorption constant from the substance table, (dm3 kg-1)
omgrid the organic matter content in the top 35 cm layer of the grid cell, (%)
omref the organic matter content in the top layer of the reference, (4.7%)
The thickness of this layer originates from the STONE soil schematisation (see section 2.2). The organic matter content of the top 35 cm layer is chosen, because the majority of the transformation in
general takes place in the plough layer of the soil; transformation in deeper layer is usually less. The value of the reference organic matter content is according to the former Dutch Standard Scenario. The local sorption constant is used in the interpolation process.
In case of slightly acidic substances, there is a further correction for the pH of the grid cell. Firstly, a combined sorption constant for the acidic molecule and its conjugated base is calculated:
(
)
(
)
gridcell a a gridcell pK pH base om pK pH acid om com omM
M
K
M
M
K
K
− −−
+
−
+
=
10
1
1
10
1
, , , Eq.3-27 with:Kom,acid the sorption constant of the acidic molecule, (dm3 kg-1)
Kom,base the sorption constant of the conjugated base, (dm3 kg-1)
M molar mass of the acidic molecule, (g mol-1)
pHgridcell the pH of the top 35 cm of the grid cell soil, (-)
pKa the dissociation constant of the substance, (-)
Secondly, the local sorption of the substance is then calculated from:
com om ref grid l om
K
om
om
K
,=
, Eq.3-28and this local sorption constant is used to interpolate in the metamodel. The procedure described above is identical for metabolites.
The Kom, Kom,acid and Kom,base are read from the NMI substances database. The data may result from
standard laboratory experiments as well as higher tier experiments. Again the user is responsible for providing the appropriate data to the NMI system.
For some substances, there might be evidence that PEARL – and consequently the metamodel – is not capable of predicting the correct leaching fraction. The pesticide registration procedure accounts for this incapability by using an error term (ffle) in the calculation. The error term accounts for
discrepancies in the leaching fraction, not for errors in the degradation and sorption constants. The fraction leaching error is to be provided via the NMI substances database; the default of this parameter is 1, indicating the absence of an error.
3.3
Surface water
The total loss of pesticides by spray drift may partially be deposited on watercourses and surface water. Other areas on which spray drift may be deposited are: agricultural area outside the treated field, nature area and built-up area. In version 2 of the NMI the surface water is considered as the receiving area. The amounts entering the watercourse or the nature area can be calculated using appropriate values for the drift factors. The emission by drift to surface water is:
2
100
10
%
4 , ,=
⋅
⋅
sw sw sw drift d swW
L
A
E
Eq.3-29 with:Esw,d the emission to surface water by the drift process, (kg ha-1)
%drift,sw the drift as influenced by application technique and drift reducing measures, (%), (see
section 2.8)
Lsw the length of the surface water (per ha field), (m)
Wsw the width of the surface water, (m)
Note that the geometry of the treated field and the surface watercourses is not known.
The factors 104 and 100 in the denominator are to convert from kg ha-1 to kg m-2 and from % to fraction. The factor 2 in the denominator is to account for the wind direction: it is assumed that only surface water downwind from the treated area is exposed.
Another emission route of plant protection products to surface water is drainage. Water infiltrating in the soil may drain to surface water, sometimes via artificial drains. The emission of plant protection products to surface water via this route is calculated according to the method described in section 3.2. The NMI also calculates various point source emissions from farm yards:
• emissions resulting from the treatment of plant materials (mainly flower bulb disinfection ); • emissions from mushroom cultivation (described in more detail in De Nie (2002));
• emissions to surface water resulting from cleaning glass of greenhouses; • emissions from disposed artificial substrates;
• emissions due to disposal of surplus (drainage) water of greenhouses; • emissions of condense water.
The term surface water is used in two different senses in the Netherlands:
1. in pesticide registration, surface water is the water in watercourses that may be exposed to plant protection products;
2. in (overall) pesticide policy, surface water is defined as the body potentially holding water, i.e. the watercourse and its side-slopes.
When in pesticide policy reference is made to emissions to surface water, then the second definition is used; drift to watercourses contributes to these emissions. The two apprehensions have impact on the calculation routines in the NMI. To avoid confusion, in this report the term surface water will be used when referring to the first sense and the term watercourse for the second sense.
Except for the emission of condense water, the emissions mentioned above are assumed to be a fraction of the application rate:
A
f
E
sw,tr=
tr Eq.3-30with:
ftr fraction emitted to surface water, (-)
Eq.3.30 holds for all these individual emission routes (except emission of condense water).
The emission factors lump several factors influencing the overall emission fro a specific source. For example, for the mushroom cultivation it takes into account the fraction of farms having a settling tank, the percentage of the dose reaching the settling tank and the dissipation from the settling tank by transformation and volatilisation. The emission factor for the emissions from flower bulb disinfection is 0.0014 (0.14%). Parameters determining the emissions from greenhouses are based on the GLAMI report (Lieffijn et al., 2000).
The fraction of the dose dissolved in the condense water depends on of the vapour pressure class of the substance and the crop height (Table 3.2). The height of the greenhouse crops is assumed constant in time (Table 3.3).
Table 3.2 Fraction of dose solved in condense water saturated vapour pressure class
(mPa) crop height class (m) fraction (-) < 0.01 < 1 0.00005 < 0.01 > 1 0.00005 ≥ 0.01 - < 0.25 < 1 0.0075 ≥ 0.01 - < 0.25 > 1 0.0017 ≥ 0.25 - < 10 < 1 0.036 ≥ 0.25 - < 10 > 1 0.001 ≥ 10 < 1 0.081 ≥ 10 > 1 0.0046
crop sector height (m)
roses (glasshouse) 1.5
bed plants 1
pot plants (flowers) 0.5
chrysanthemum 0.5
freesias 0.5 gerberas 0.5 orchids 0.5
pot plants (green) 0.5
lilies (glasshouse culture) 0.5
carnation 0.5 alstroemeria floriculture (greenhouse) 0.85 cucumbers 2 sweet pepper 2 tomatoes 2 radish
glass vegetables (greenhouse)
0.2
mushrooms mushrooms 0.25
The total emission to surface water is the sum of the amounts from the drift process, the lateral drainage process and the emissions from point sources:
condens sw tr sw ld sw d sw sw
E
E
E
E
E
=
,+
,+
,+
, Eq.3-31Esw,tr here is the sum of the emissions of all applicable point sources. Deposition of plant protection
4
Effect indicators
4.1
Soil
The general principle of comparing an exposure concentration with ecotoxicological data for organisms or the ecosystem is followed for the soil environment. Soil here is defined as the top layer of the treated field. For the thickness of this top layer the following default values apply:
• 0.05 m for spray applications when assessing acute and chronic risk;
• 0.05 m for injection applications, treated seeds, bulbs and tubers when assessing acute and chronic risk;
• 0.2 m for applications incorporated in soil when assessing acute and chronic risk.
The exposure concentration is calculated from the net soil deposition, soil characteristics obtained from the soil map of the Netherlands and, when relevant, the transformation rate of the substance.
4.1.1
Soil exposure concentration, single application
Ecotoxicological data for soil organisms have the dimension [M M-1] and therefore the exposure concentration also has the same dimension. Input to the calculation of the exposure concentration is the net soil deposition. The net soil deposition is calculated from the nominal application rate and several emission terms (see also Eq. 3.19):
d sw air soil air crop air app N
A
E
E
E
E
S
=
−
,−
,−
,−
, Eq. 4-1All loss fractions play a role when a crop protection product is sprayed over the crop. When another application technique is used, for instance injection or incorporation, some of the loss fractions may be absent.
The nominal application rate and the loss fractions are derived from procedures as described in chapters 2 and 3. The fractions lost by volatilisation during application and drift depend on application technique and reduction measures as described elsewhere (Smidt et al., 2000; Smidt et al., 2002) and chapter 2). The fraction intercepted is dependent on the crop type and the growth stage of the crop, which in turn is dependent on the time (moment in the growth cycle). The fraction volatilised from the soil is dependent on physico-chemical properties of the crop protection product, soil characteristics, soil conditions and climate conditions (see section 3.1).
We may now convert the amount reaching the soil into a soil content to make an ecotoxicological assessment possible: soil soil N