Diabetes, stress response and blood pressure: prenatal nutritional programming in a rat model
M Siemelink, A Verhoef, A van de Kuil, JAMA Dormans, G Pesman, AH Piersma
This investigation has been performed by order and for the account of the Inspectorate for Health Protection and Veterinary Public Health, within the framework of project 650100, “Nutrition and pregnancy”.
Abstract
The current epidemic increase of diabetes in western societies is associated with lifestyle factors. Increased caloric intake in combination with decreased physical exercise predisposes for obesity and diabetes. However, an additional important cause of the diabetes epidemic may be found in nutrition during pregnancy. Prenatal
nutritional programming of physiological parameters is increasingly considered as an important determinant of diseases in adulthood such as cardiac failure, obesity and diabetes. The current study describes the continuing development of an animal model for prenatal programming. Continuous blood pressure determinations in stress-free conscious rats showed no changes after prenatal diets with a reduced protein content or with an increased saturated fatty acid content. In addition, no changes were observed in the adrenal response to ACTH, either in vivo or in vitro. Remarkably, the insulin
response was increased in adult offspring after a prenatal saturated fatty acid rich diet. The latter finding prompts further research into the role of nutritional fatty acids in prenatal programming of glucose homeostasis. This mechanism my have important public health impact in view of current dietary habits and increasing diabetes prevalence in western societies.
Samenvatting
De huidige epidemische toename van diabetes in de westerse samenleving is geassocieerd met leefstijlfactoren. Verhoogde calorische inname in combinatie met verminderde
lichamelijke inspanning verhoogt de kans op het krijgen van obesitas en diabetes. Echter, een additionele oorzaak van de diabetes epidemie ligt mogelijk in de voeding tijdens de
zwangerschap. Programmering door de voeding tijdens de zwangerschap van fysiologische parameters in het nageslacht wordt in toenemende mate beschouwd als een belangrijke determinant van aandoeningen op volwassen leeftijd waaronder cardiovasculaire ziekten, obesitas en diabetes. Dit onderzoek beschrijft de verdere ontwikkeling van een diermodel voor prenatale programmering. Continue bloeddrukmeting in stressvrije wakkere dieren lieten geen veranderingen zien na prenatale diëten met verminderd eiwitgehalte danwel met en verhoogde concentratie verzadigd vet. Ook de bijnierrespons op ACTH, gemeten in vivo en in vitro, liet geen veranderingen zien. Opvallend was de verhoogde insulinerespons in volwassen nakomelingen na een prenataal dieet verrijkt met verzadigd vet. Deze bevinding vraagt om nader onderzoek naar de rol van vetzuren in het dieet bij de prenatale
programmering van de regulatie van de glucosespiegel in het bloed. Dit mechanisme kan belangrijke implicaties hebben voor de volksgezondheid, gegeven moderne eetgewoonten en de toenemende prevalentie van diabetes in de westerse wereld.
Contents
1. INTRODUCTION ...6
1.1 AIM AND RELEVANCE OF THE STUDY...6
2. MATERIALS AND METHODS...8
2.1 EXPERIMENTAL DESIGN...8
2.2 TEST ANIMALS...9
2.3 TEST COMPOUND...9
1.4 EXPERIMENTAL DIETS...10
2.5 MEASUREMENTS FROM MATING UNTIL ADULTHOOD IN DAMS AND PUPS...10
2.5.1 Body weight and food intake ...10
2.5.2 Weaning at age 3 weeks...10
2.5.3 Puberty onset of male pups...11
2.6 MEASUREMENTS IN THE OFFSPRING AT THE AGE OF 12 WEEKS...11
2.6.1 Oral glucose tolerance test (OGTT) ...11
2.6.2. Blood pressure and heart rate ...12
2.6.3. In vivo stimulation of the pituitary-adrenal axis by ACTH ...14
2.6.4 Autopsy ...14
2.6.5 Pathology...15
2.6.6 In vitro stimulation of adrenal cells by ACTH...15
2.7 STATISTICAL ANALYSIS...15
3. RESULTS...16
3.1 DIETARY COMPOSITION...16
3.2 MATERNAL PARAMETERS...16
3.2.1 Premating and pregnancy period: body weight and food intake...16
3.2.2 Lactation period: food intake ...16
3.2.3 Litter size ...16
3.3 THE OFFSPRING...16
3.3.1 Body weight increase and survival in the weaning period ...16
3.3.2. Offspring growth at age 4-12 weeks...17
3.3.3 Puberty onset...18
3.3.4 Blood pressure at age 12 weeks...18
3.3.5 Oral glucose tolerance test...19
3.3.6 In vivo ACTH challenge at age 12 weeks ...21
3.3.7 In vitro corticosterone respons after ACTH stimulation ...21
3.3.8 Necropsy at age 12 weeks...22
3.3.9 Pancreas morphometry...22
4. DISCUSSION...23
ACKNOWLEDGEMENTS...25
REFERENCES...26
APPENDIX 1: DIETARY COMPOSITION ...27
APPENDIX 2: MATERNAL FOOD INTAKE AND BODY WEIGHT AND LITTER DATA ...28
APPENDIX 3: OFFSPRING BODY WEIGHT DURING WEANING ...30
APPENDIX 4: MALE OFFSPRING DEVELOPMENT AFTER WEANING ...31
APPENDIX 5: BODY WEIGHT AND CARDIOVASCULAR DATA OF CANNULATED RATS ...32
APPENDIX 7: PLASMA CORTOCOSTERONE RESPONSE (MMOL/L) TO ACTH CHALLENGE IN VIVO (CF. FIGURE 11)...34 APPENDIX 8: INDIVIDUAL IN VITRO CORTICOSTERON RESPONSE (NG/L) AFTER ACTH STIMULATION OF ADRENAL CELLS IN SUSPENSION (CONTINUED ON NEXT PAGE) ...35 APPENDIX 9: NECROPSY DATA...37 APPENDIX 10: INDIVIDUAL DATA PANCREAS MORPHOMETRY ...38
1.
Introduction
In recent years, much research effort has been devoted to the hypothesis that chronic diseases in adulthood may have their origin in utero. Common diseases such as diabetes mellitus and hypertension have been associated with reduced fetal growth and birth weight (Barker and Osmond, 1986; Hales et al.,1991). Also after birth, the change in environmental conditions seems to have important influences on, for example, the occurrence of catch-up growth in low-birth weight babies (Osmond et al., 1993). Maternal nutrition is one of the factors
involved in determining fetal growth and birth weight but has also less obvious effects on the anatomic and physiologic programming of organ systems (Siemelink et al., 2000, 2002). Animal experiments have illustrated this concept. For example, a maternal low protein diet seems to decrease the activity of the placental enzyme 11ß-hydroxy steroid dehydrogenase (11ß-HSD), thereby increasing the exposure of the fetus to maternal glucocorticoids (Seckl, 1998). As a consequence, ‘default settings’ of the developing fetal hypothalamus-pituitary-adrenal (HPA) axis change, which in turn influence basal levels of stress hormones in later life. As a consequence, the adult offspring seem to have a different window of adaptability which may become clear especially during physiologically challenging conditions. When the environment continues to place a demand on the compromised physiological system this may result in a higher susceptibility to chronic diseases.
In this study, we used a low protein diet as well as a pharmaceutical agent, carbenoxolone, which also decreases placental 11ß-HSD activity, to investigate adrenocortical function in
vivo as well as in vitro in male offspring. In addition, the effect on several parameters of
dietary fat content in combination with a low protein diet and the effect of a diet rich in saturated fatty acids was examined. Current dietary guidelines regarding fat intake
recommend a consumption of saturated fatty acids (SFA) not higher than 10 % of the energy intake (Voedingsraad, 1989), which is lower than the actual intake in the Netherlands
(Gezondheidsraad,1998). Therefore, the consumption of SFA is still higher than
recommended. Previous work of our research group (Siemelink et al., 2002) demonstrated significant effects on the structure and function of the pancreas of a diet high in saturated fatty acids. In view of the public health importance of preventing the rapidly increasing incidence of diabetes mellitus in combination with a higher than desirable intake of saturated fatty acids in western societies, we also studied a diet rich in saturated fatty acids to
determine underlying mechanisms and to assess reproducibility.
1.1
Aim and relevance of the study
The aim of this study was threefold:
a- As a follow-up to our first study, we investigated the underlying mechanisms of the prenatal programming theory in which we especially focussed on the sensitivity of the HPA-axis among adult male rats fed different diets in utero and during weaning, using diets varying in protein and fat content and in fat composition.
b- For comparison with our and other earlier studies we collected blood pressure data. Several studies have been shown to induce hypertension in the offspring with a prenatal low protein diet regime in utero, while other studies could not confirm this (Petry et al., 2001). Most of the studies in which hypertension has been shown have used the tail-cuff method to determine blood pressure. We compared our blood pressure data obtained via direct
cannulation under anesthesia in our previous study with a different technique of blood pressure measurement in conscious, unrestrained animals through a chronic cannula in the present study.
c- In order to confirm and extend our findings in our earlier study we analyzed glucose homeostasis through an oral glucose tolerance test and studied the histology of the pancreas.
2.
Materials and methods
2.1
Experimental design
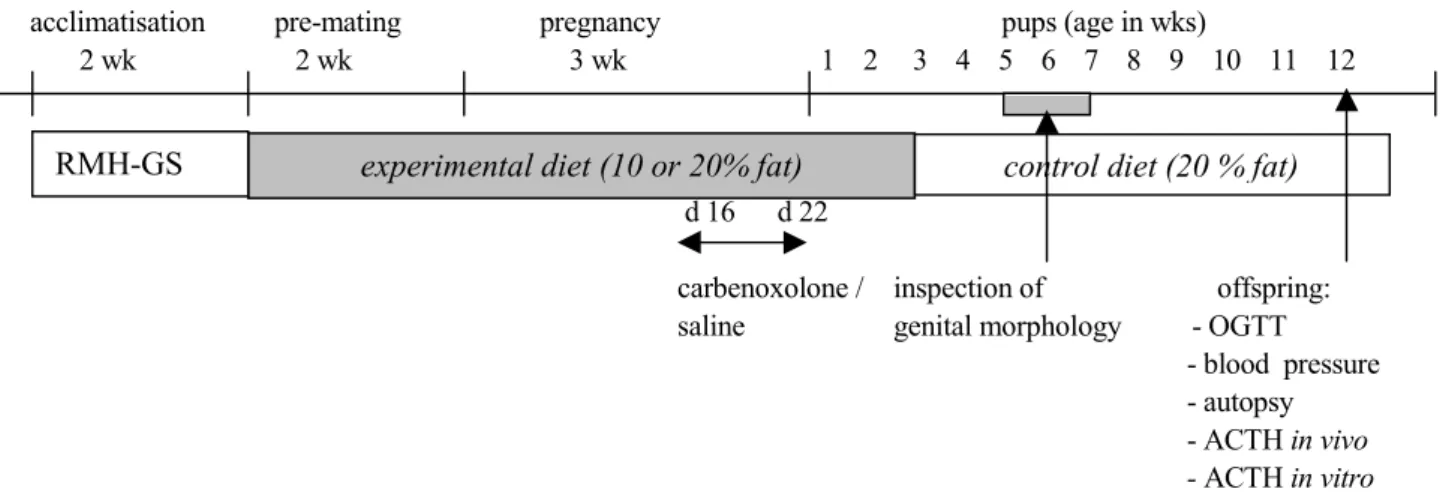
An overview of the experimental procedures is given in figure 1. For a more detailed description of the design and procedures, see protocol no. AAP 2001-0157.
Briefly, female adult animals were exposed to the experimental diet two weeks before mating (pre-mating period), and during pregnancy and the lactation period. Experimental diet
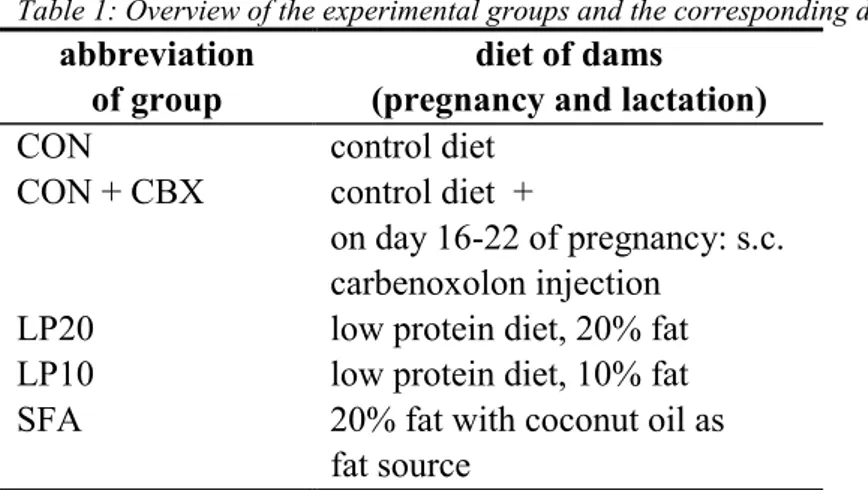
consisted of pelleted high-fat diets (20% w/w), based on soy oil (control diet; CON group) or saturated fatty acid-rich coconut oil (SFA group). In combination with the soy oil based diet, the pharmaceutical agent carbenoxolone was given in the last trimester of pregnancy (CBX group) or a low protein diet (9%) was given with different fat contents. Animals on the low protein diet in combination with a 10% soy oil content are referred to as the ‘LP10 group’ whereas animals on the low protein diet with 20% soy oil are referred to as the ‘LP20 group’. An overview of the experimental groups is given in table 1.
Table 1: Overview of the experimental groups and the corresponding diet.
abbreviation of group
diet of dams
(pregnancy and lactation)
CON control diet
CON + CBX control diet +
on day 16-22 of pregnancy: s.c. carbenoxolon injection
LP20 low protein diet, 20% fat LP10 low protein diet, 10% fat
SFA 20% fat with coconut oil as
fat source
During the premating and pregnancy period, body weight gain and food intake was monitored.
At birth, birth weight and litter size were recorded and litter size was culled to 8 pups with a preference for male pups. During weaning, body weight of the pups and food intake of the dams was recorded weekly. After weaning, all male offspring was transferred to the CON diet and were housed individually. Timing of puberty onset was monitored externally by preputial separation [1015]. At the age of 12 weeks, a series of measurements was performed on one male rat of each litter. Firstly, after a training period, blood pressure as well as heart rate was determined in conscious, unrestrained rats, followed by a test for adrenocortical function. Secondly, adrenocortical responsiveness was also determined in vitro. Thirdly, glucose tolerance was assessed by means of an oral glucose tolerance test. Fourthly, weight, morphology and pathology of specific organs involved in prenatal programming was
acclimatisation pre-mating pregnancy pups (age in wks)
2 wk 2 wk 3 wk 1 2 3 4 5 6 7 8 9 10 11 12
d 16 d 22
carbenoxolone / inspection of offspring: saline genital morphology - OGTT
- blood pressure - autopsy
- ACTH in vivo
- ACTH in vitro Figure 1 : Study design
2.2
Test animals
All procedures involving animals were conducted with approval from the Dutch Animal Ethics Committee. Upon arrival, animals were randomly numbered. Ninety female animals of the Harlan Cpb-WU strain aged 9 weeks were housed in groups in macrolon type 2 cages upon arrival. During the acclimatization period (two weeks) RMH-GS chow in pellets was available ad libitum. In addition, two groups of seven male rats (age 11 weeks) were used on alternating days to mate with the females. Light period was from 6.00 a.m. to 6.00 p.m. Mating period started at 4.00 a.m. A male rat was introduced into a cage with 4 females and stayed there for two hours. When a positive lordosis reaction of a female was observed, the female was housed individually after mating. After birth, litter size was culled to eight pups with a preference for male pups. After weaning, male animals were numbered at random and housed individually to prevent social hierarchical structures which influence basal stress hormone levels. All animals had access to water and food ad libitum. The rats were maintained under controlled conditions at 20-24° C and at a relative humidity of 50-70%. Throughout the experiment, the dams as well as the male offspring were housed randomly in the animal chamber.
2.3
Test compound
Scientific name: carbenoxolone Structure:
Figure 2: structure of carbenoxolone
experimental diet (10 or 20% fat)
Biological mechanism: inhibitor of the placental enzyme 11ß-hydroxysteroid dehydrogenase (11ß-HSD).
Human therapeutic application: gastric ulcers (protection of the gastric ulcers against acids) Exposure period: day 16 – day 21 of pregnancy
Dose and exposure mode: daily subcutaneous injection of 12.5 mg carbenoxolone / kg body weight in saline [999] to pregnant female rats in the CON + CBX group.
Storage: 4° C.
Purchased from: Sigma, C4790.
2.4
Experimental diets
From the premating period to the end of the lactation period, the experimental diet was given to the animals (a minimal period of 8 weeks). The diets were semi-synthetic, isocaloric, contained 20% fat and were pelleted (10 mm.) Diets were stored at –20˚ C to minimize peroxidation. Each day a freshly thawed portion was offered to the rats. A vitamin- and mineralmix was added to the diets (for dietary composition, see appendix 1). Dietary oils were purchased by Hope Farms from Chempri B.V. Oleochemicals. Diets were manufactured and packed by Hope Farms B.V., Woerden. On three consecutive days, a batch of 150 kg of diet was manufactured each day. Methionine was added to the diets to prevent a sulphur-deficiency in the LP diets. The protein content in the LP diets was 9% w/w. In the SFA diet, a fraction of soy oil (3%) was added to provide the essential fatty acids. Dietary analyses were performed by TNO Nutrition, Zeist. In table 1, the experimental groups are given.
2.5
Measurements from mating until adulthood in dams and
pups
2.5.1 Body weight and food intake
* DamsDuring the premating period, food intake was measured twice weekly and animals were weighed weekly. During pregnancy, food intake was measured on day 3, 8, 13 and 18
of pregnancy (day 1 of pregnancy is defined as the day after mating). Food intake of the dams was determined on day 0, 6, 11, 16 and 21. Food intake was monitored during one day on a weekly basis during the lactation period starting at day 1.
* Pups
The day on which the pups were found was defined as postnatal day 1. On this day, litter size, sex ratio and birth weight of all the pups was recorded after which litter size was reduced to 8 pups per litter with a preference for male pups. Body weight of the pups was recorded on postnatal day 1, 7, 14 and 21. Since pups were not individually marked, average pup weight per sex per litter was calculated.
2.5.2 Weaning at age 3 weeks
All female pups were sacrificied at the end of the lactation period by a CO2/O2 gaseous mix. Male pups were housed individually to avoid a social hierarchical structure which influences basal hormone levels.
2.5.3 Puberty onset of male pups
In males, the onset of puberty can be easily determined by the separation of the prepuce from the glans penis. This occurs prior to the significant increase in circulating androgen levels. Since we were interested in the settings of hormone systems, we examined the offspring daily from 35 days of age on the capacity for preputial separation as an external sign of pubertal development (Korenbrot et al., 1977). At this particular moment, age and body weight of the animal was recorded.
2.6
Measurements in the offspring at the age of 12 weeks
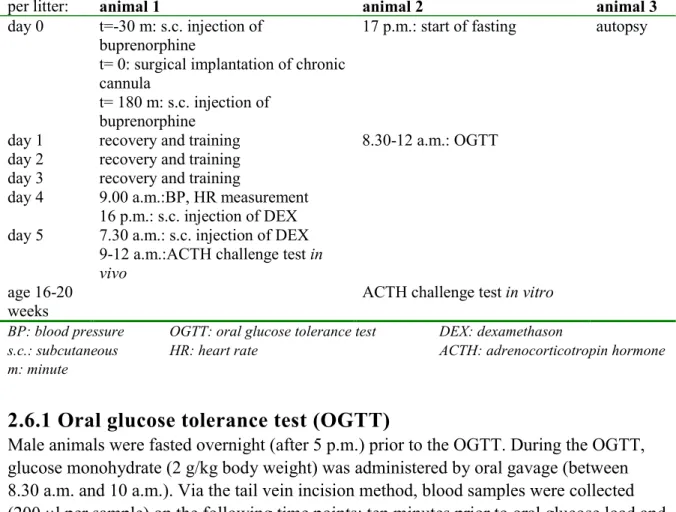
In table 2, an overview of the different measurements over time per animal is given. For each measurement, one male animal of each litter was taken to guarantee independence of the animals. Some measurements were performed, with an intermediate recovery period, on the same animal.
Table 2: Experimental interventions for each male animal at the age of 12 weeks
per litter: animal 1 animal 2 animal 3
day 0 t=-30 m: s.c. injection of buprenorphine
t= 0: surgical implantation of chronic cannula
t= 180 m: s.c. injection of buprenorphine
17 p.m.: start of fasting autopsy
day 1 recovery and training 8.30-12 a.m.: OGTT day 2 recovery and training
day 3 recovery and training
day 4 9.00 a.m.:BP, HR measurement 16 p.m.: s.c. injection of DEX day 5 7.30 a.m.: s.c. injection of DEX
9-12 a.m.:ACTH challenge test in
vivo
age 16-20 weeks
ACTH challenge test in vitro BP: blood pressure OGTT: oral glucose tolerance test DEX: dexamethason
s.c.: subcutaneous HR: heart rate ACTH: adrenocorticotropin hormone m: minute
2.6.1 Oral glucose tolerance test (OGTT)
Male animals were fasted overnight (after 5 p.m.) prior to the OGTT. During the OGTT, glucose monohydrate (2 g/kg body weight) was administered by oral gavage (between 8.30 a.m. and 10 a.m.). Via the tail vein incision method, blood samples were collected (200 µl per sample) on the following time points: ten minutes prior to oral glucose load and on t=5, t=10, t=30, t=60, t=120 minutes after the glucose load. Blood samples were
centrifuged immediately upon collection (3000 rpm, 4° C, 10 minutes). Plasma samples were stored at –80° C. Glucose concentration was measured by a glucose oxidase system (Unimate 5 GLUC HK, Roche); insulin concentration was measured by a RAT insulin ELISA-kit (Mercodia). Both measurements were performed within two months after collection.
2.6.2. Blood pressure and heart rate
2.6.2.1 Surgical procedureFour days prior to the measurement of the arterial blood pressure and heart rate
rats were provided with a left carotid artery cannula (PE 50 Clay and Adams). This day was defined as day 0. The rats were anaesthetized with O2 , N2O (1 : 2) mixed with 3% isoflurane (Isoflurane Vaporiser IMS England). During surgery isoflurane content was reduced to 1.75%.
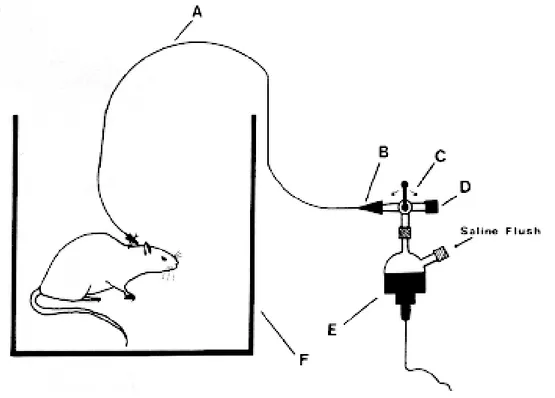
The neck and the back of the neck of the rats were shaved and disinfected with jodium solution. Chlooramfenicol was used to prevent dehydration of the eyes. A small incision was made on the back of the neck and the left carotid artery was exposed through a 2-cm ventral neck incision. The canulla was tunnelled subcutaneously from the ventral neck incision to emerge at the back of the neck (figure 3). Thereafter, the canulla with a blunt end was filled with normal saline, containing heparin 30 IU/ml, and placed into, and advanced through the carotid artery towards the heart until a predetermined distance of 20-25 mm. The position of the cannula was checked by aspirating some blood, and then flushed gently with 100 µl of the heparinized saline solution. After that the cannula was filled with a 50% polyvinylpyrolidone solution in saline with 500 IU/ml heparin(PVP-solution) to prevent the formation of blood clots, and closed with a pin. The insicion in the neck, and the back of the neck of the animals were closed with sutures ( 3- 0 seide). Throughout the operation rectal temperature (TMM module, Hugo Sachs Electronic) was monitored and the body temperature was kept between 37– 39 oC by placing the animals on heated pads and by radiant heating. After the surgery the rats were kept warm and injected with 2 ml i.p. saline. 30 minutes before and 3 hours after the implantation of the cannula in the left arterial carotis the rats were injected with
buprenorphine 0.05 mg/kg s.c, to prevent post operative pain. The rats were kept before and after the surgery and during the measurement periods individually in their own cages. On day 4 the cannula was connected to a Viggo Spectramed disposable pressure transducer. The pressure signal was transduced to Hugo Sachs Electronic (HSE 7806) equipment and
recorded continuously. Blood pressure and heart rate were obtained in resting unrestrained rats (figure 4)
Figure 3: Catheter implantation: A+B: support tubing, C: catheter, D:left carotid artery, E: blunted needle, F: support tubing.
Derived from: A reliable technique for chronic carotid arterial catherization in the rat, Tsui et al., J Pharmacol Meth 25, 343-352, 1991.
Figure 4: Recording system: A+B: extension device, C: three-way stopcock, D: heparin lock, E: transducer, F: animal cage.
Derived from: A reliable technique for chronic carotid arterial catherization in the rat, Tsui et al., J Pharmacol Meth 25, 343-352, 1991.
2.6.2.2 Recovery- and training period
During the days following the operation (recovery period), animals were trained once a day for 30-45 minutes for the blood pressure measurement to accustomize to the procedures and sound of the blood pressure equipment. Animals were transferred from the adjacent housing room to the operating room, where the measurement of the blood pressure took place.
Animals were placed, in their own cage, on the table and a plastic top was placed on the cage to prevent animals from climbing out. The blood pressure tube was connected to the cannule in the animal. Procedures and conditions reflected as closely as possible those during the actual measurement. During this sham measurement, the observer noted down any noticeable events in the behavior of the animals (like sleeping, digging) as well as their time interval. 2.6.2.3 Housing during the recovery period
Since the blood pressure equipment was located in an other building than the animal
chamber, the animals had to be transferred from the original animal chamber to the operating room and for recovery to an adjacent temporarily equipped housing facility. Light-regime and the intensity of the light in this room was similar to the previous animal chamber.
Atmospheric humidity was monitored. A limited access procedure was applied and only under special conditions (changing clothes, disinfecting the zool of the special footwear, wearing a hearnet etc.) one could enter the room. During the recovery period, which lasted three days, fresh food and water was provided to the animals every day. Body weight was recorded daily to monitor the physical condition of the animals.
2.6.3. In vivo stimulation of the pituitary-adrenal axis by ACTH
One day before the experiment, animals to be tested were injected subcutaneously with dexamethasone (DEX, 25 µg/100 g body weight in saline) or saline to depress the endogenous activity of the HPA-axis. This treatment was repeated the next morning90 minutes before the administration of ACTH1-24. At t=0 (8.30 a.m.) the rats were subjected to a subcutaneous injection of ACTH (10 µg/kg body weight). At t=15, t=30, t=45, t=90 and t=120 minutes, 0.2 ml. blood was collected via the canule where possible. Blood samples were centrifuged immediately (3000 rpm, 4°C, 10 min.). Plasma was stored at –80° C to determine plasma level of corticosteron (CORT). CORT was measured by RIA based on the method described by Sweep et al. [1232].
2.6.4 Autopsy
One male animal per litter was anesthesized (CO2 :O2 = 2:1) after the determination of body weight. The following organs were excised and weighed in chronological order: pancreas, brains and pituitary, liver, kidneys, adrenals, heart and thymus. Organs were fixed with phosphate buffered 4% formaldehyde, however the brains, pituitary and a liver lobe were snap-frozen in liquid nitrogen immediately after weighing. A small sample of abdominal fat and muscle was taken and stored at –80° C.
2.6.5 Pathology
For histological examination 5 µm paraplast sections of the adrenals, heart, kidney, liver, pancreas, pituitary, spleen and thymus were cut and stained with hematoxylin and eosin (HE). For morphometry of the pancreas the number and surface area of the islets of the pancreas was measured with the analySIS soft imaging system (SIS, Münster, Germany).
2.6.6 In vitro stimulation of adrenal cells by ACTH
For each experiment, at around 8.00 a.m., one animal at a time was transferred, after
weighing, from the animal chamber to the autopsy room. To prevent a transition from a dark to a light room, light regime in the animal chamber was adjusted from the early beginning of the experiment (i.e. 17 weeks earlier) to have the light period between 6.a.m.and 6.p.m. On each day, 8 male rats of different groups (400-550 g) were killed by decapitation by means of a guillotine. The period between weighing in the animal chamber and killing was kept constant and as shortly as possible (on average 16 seconds). The adrenals were removed, freed of fat and cut. A preparation of crude isolated adrenal cells was made by collagenase digestion. This suspension was purified on a sucrose gradient. Thirdly, when the purified suspension was pre-incubated for 60 minutes, ACTH1-24 was added to the suspension and incubated for 120 minutes. Finally, the concentration of CORT in the cell suspension was measured by the principle of enzyme immunoassay (DSL 10-81100).
2.7
Statistical analysis
Data of all groups were compared to the control group. All data were reported as
means ± SEM in the tables. In the figures, the SEM is shown for the CON group. The data were analyzed using a one-way analysis of variance (ANOVA) when appropriate. When significant interactions were noted, Dunnett’s test was used for determination of difference with the control group. A p-value of <0.05 was considered to imply a significant difference.
3.
Results
3.1 Dietary composition
The dietary composition is shown in appendix 1. The SFA diet contained a relatively high concentration of the short-chain saturated fatty acids lauric and myristic acid compared to the other diets. The fatty acid compositions in the CON diet, LP20 diet and LP10 diet were comparable, which was to be expected since the same soy oil is used in these diets. Total energy content of the LP10 diet was 10% lower as compared to all other diets.
3.2 Maternal parameters
3.2.1 Premating and pregnancy period: body weight and food intake
In the premating and pregnancy period, body weight gain was similar between the groups (appendix 2). Food consumption was significantly higher in the LP10 group (from 17% in the premating period up to 28% in the pregnancy period).3.2.2 Lactation period: food intake
Food intake of the LP20 group was significantly lower compared to the control group. In addition, food consumption in the LP10 group was also signficantly lower at the last day of lactation (appendix 2).
3.2.3 Litter size
No differences in litter size were observed (appendix 2).
3.3 The offspring
3.3.1 Body weight increase and survival in the weaning period
Male pups born to mothers fed the SFA diet had a significantly higher body weight at birth (appendix 3). This was also true for female pups fed the SFA diet and the LP10 diet in utero. Female pups born to mothers who received carbenoxolon in the last trimester of pregnancy also had a significantly higher birth weight. However, this was only significant at birth; the pups were of a similar body weight with increasing age. In the LP20 group, the opposite seems to be true: male as well as female pups had a similar birth weight as the controls, but gained signficantly less weight in the weaning period.
In the LP20 group, survival percentage of the pups up to 3 weeks of age was the lowest among the different groups (appendix 2). Nine pups out of 3 litters died.
0.0 1 0.0 2 0.0 3 0.0 4 0.0 5 0.0 6 0.0 7 0.0 0 5 1 0 1 5 2 0 2 5 ag e (d a ys ) body we ight (gr ams ) C O N C O N + C B X L P 2 0 * L P 1 0 * S F A
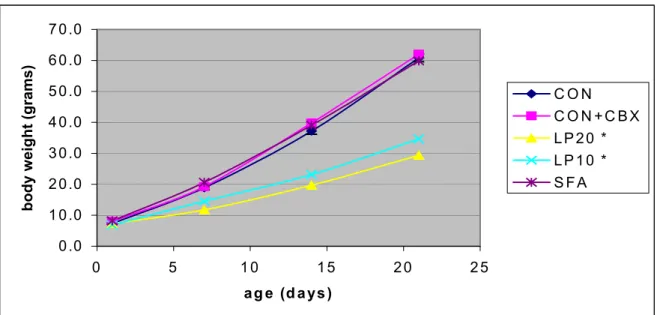
Figure 5: Body weight increase in male pups from birth to weaning age (n= 17-52)
In figure 5 the body weight increase in male pups is shown. Pups fed the LP20 and LP10 diet
in utero and during weaning had a significantly lower body weight gain.
3.3.2. Offspring growth at age 4-12 weeks
The significantly lower body weight in the low-protein groups continued up to age 12 weeks (figure 6) in other words, even after the offspring was transferred to the CON diet (normal protein diet), animals were not able to catch-up for the difference in body weight (for exact data, see appendix 4).
0.0 50.0 100.0 150.0 200.0 250.0 300.0 350.0 400.0 450.0 4 5 6 7 8 9 10 11 12 ag e (w eeks) body we ight (gr ams ) C O N C O N + C B X LP 20 * LP 10 * S F A
Figure 6: Body weight increase of male pups fed different diets in utero. Pups of the LP groups gained significantly less body weight up to age 12 weeks compared to the control group (control: n=48, CON + CBX: n=27, LP20: n=49, LP10: n=37, SFA: n=36). Data are expressed as mean ± SEM (for the control group) and are compared to the control group. *: p< 0.05
3.3.3 Puberty onset
Puberty onset was significantly later in male pups of the LP20 group compared to the control group (36.5 ± 0.3 days vs 35.1 ± 0.3, appendix 4). Body weight of these pups at the start of puberty was significantly lower, as was also true for pups of the LP10 group (appendix 4).
3.3.4 Blood pressure at age 12 weeks
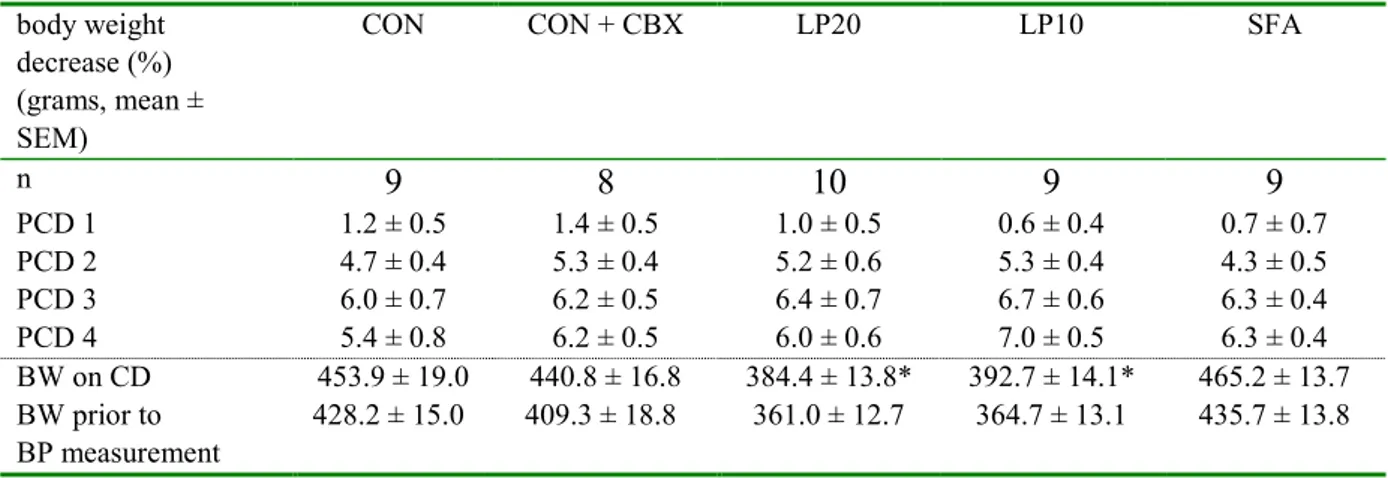
In table 3, the relative decrease in body weight on the following days after the cannulation is shown for each group. The relative decrease has been expressed as a percentage of the body weight at the cannulation day (CD). No significant differences in recovery, measured as the relative decrease in body weight, were noted. On post-cannulation day 4 (PCD 4), the relative decrease in body weight is lower than on post-cannulation day 3 for the CON group and the LP20 group and similar for the CON+CBX group and SFA group. This means that around this time, the physical condition of the animals has been improved. However, this is not the case for the LP10 group, which continue to loose weight on post cannulation day 4.
Table 3: Body weight on cannulation day (CD) and relative decrease in body weight (BW, grams) on day 1-4 after cannulation (PCD: post cannulation day) of the a.carotis compared to body weight on cannulation day(CD). In addition, body weight just before the blood pressure (BP) measurement is given.
body weight decrease (%) (grams, mean ± SEM)
CON CON + CBX LP20 LP10 SFA
n 9 8 10 9 9 PCD 1 1.2 ± 0.5 1.4 ± 0.5 1.0 ± 0.5 0.6 ± 0.4 0.7 ± 0.7 PCD 2 4.7 ± 0.4 5.3 ± 0.4 5.2 ± 0.6 5.3 ± 0.4 4.3 ± 0.5 PCD 3 6.0 ± 0.7 6.2 ± 0.5 6.4 ± 0.7 6.7 ± 0.6 6.3 ± 0.4 PCD 4 5.4 ± 0.8 6.2 ± 0.5 6.0 ± 0.6 7.0 ± 0.5 6.3 ± 0.4 BW on CD 453.9 ± 19.0 440.8 ± 16.8 384.4 ± 13.8* 392.7 ± 14.1* 465.2 ± 13.7 BW prior to BP measurement 428.2 ± 15.0 409.3 ± 18.8 361.0 ± 12.7 364.7 ± 13.1 435.7 ± 13.8
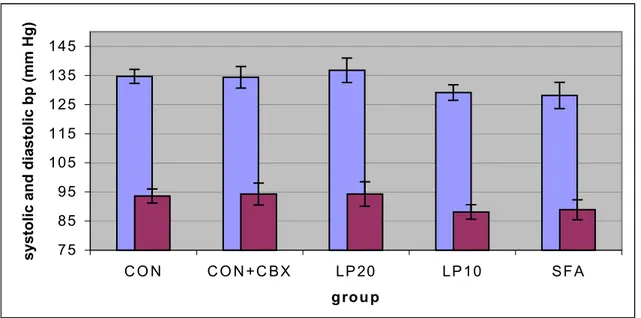
In figure 7, mean systolic (blue) and diastolic (purple) blood pressure is given for each group (the exact data are shown in appendix 5). No significant differences in either systolic or diastolic blood pressure were observed between the groups.
Drop-out of the animals due to loss of cannula or an instabile blood pressure during the measurement was 15-20%, which is comparable with the performance of other research groups using this technique on a routine basis.
75 85 95 105 115 125 135 145 C O N C O N +C BX LP 20 LP10 SF A grou p syst o lic an d d iast o lic b p ( mm Hg )
Figure 7: Systolic and diastolic blood pressure (mean ± SEM) in adult male rats, during blood pressure (bp) measurement in conscious, unrestrained rats via arterial catherization; n=8-10 per group.
Heart rate was monitored during the measurements, the results are shown in figure 8 (exact data is shown in appendix 5). Heart rate of the CON group seemed to be slightly lower, although not significant.
310.0 320.0 330.0 340.0 350.0 360.0 370.0 380.0 390.0 C O N C O N + C B X LP 20 L P 10 S F A g ro u p hear tr ate dur ing bp measurement (b eat s/minut e)
Figure 8.: Heart rate (mean ± SEM) during blood pressure (bp) measurement in conscious, unrestrained rats via arterial catherization; n=8-10 per group.
3.3.5 Oral glucose tolerance test
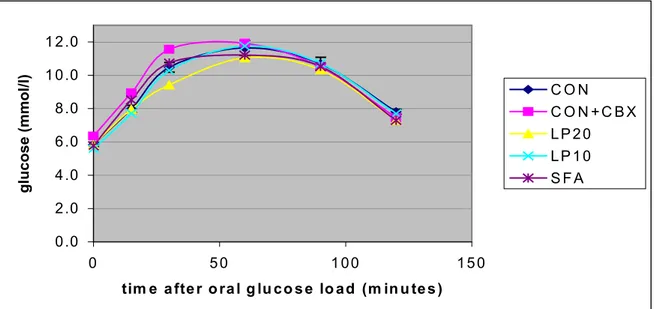
The plasma insulin and plasma glucose levels are shown in figure 9 and 10. For exact data, see appendix 6. The SFA group tended to have a higher insulin response than controls, whereas all other experimental groups tended to give a lower response. No statistically significant differences in fasting plasma insulin or glucose were present. After the administration of glucose, plasma insulin levels rose sharply within 30 minutes. Glucose
levels were maximal at t=60. Plasma glucose level did not differ significantly for any of the groups compared to the control group.
0 .0 1 00 .0 2 00 .0 3 00 .0 4 00 .0 5 00 .0 6 00 .0 7 00 .0 0 5 0 1 0 0 1 50 tim e a fte r o ra l g lu co s e lo ad (m in u te s )
plasma insulin (pmol/l)
C O N
C O N + C B X L P 20
L P 10 S F A
Figure 9:Plasma insulin concentration (mean ± SEM) during the oral glucose tolerance test (glucose: 2 mg/kg body weight) in male, 12-week old animals, n=11-13 per group. 60 minutes after the oral glucose load, insulin concentration in the CON + CBX group and in the LP10 group was significantly lower than the CON group. Two hours after the administration of glucose (t=120), plasma insulin concentration of animals of the LP20 and LP10 group was significantly lower.
0.0 2.0 4.0 6.0 8.0 1 0.0 1 2.0 0 5 0 1 00 1 5 0 tim e a fte r o ra l g lu co s e lo ad (m in u te s ) glucose (mmol/l) C O N C O N + C B X L P 2 0 L P 1 0 S F A
Figure 10: Plasma glucose concentration (mean ± SEM) after an oral glucose load (2 mg/kg body weight) in male, 12-week old animals; n= 11-13 per group. No significant differences were observed.
*
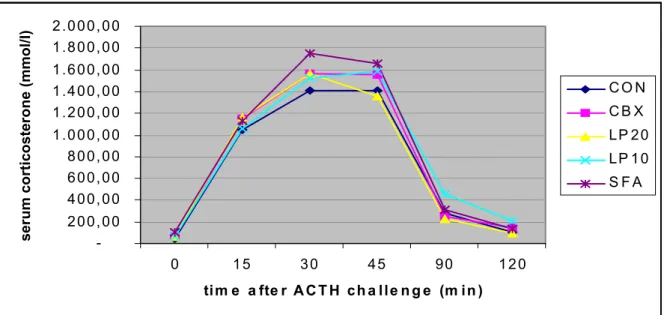
3.3.6 In vivo ACTH challenge at age 12 weeks
Plasma corticosterone response after an ACTH challenge in vivo is shown in figure 11. No significant differences were found. Data are listed in appendix 7.
Figure 11: Plasma corticosterone response after a subcutaneous injection of ACTH (1 U/kg body weight = 10 µg/kg body weight in 0.9% NaCL solution). The endogenous activity of the hypothalamus-pituitary-adrenal axis was suppressed by dexamethason (see Material & Methods). Blood samples were obtained from the chronic arterial cannula. Data are expressed as mean ± SEM (CON); n= 9-12 per group.
3.3.7 In vitro corticosterone respons after ACTH stimulation
In figure 10, a dose-response curve of corticosterone at increasing ACTH concentrations is shown for each of the groups. The individual data, shown in appendix 8, were too scattered and variable to allow for reliable determinations of ED50 values.
-200,00 400,00 600,00 800,00 1.000,00 1.200,00 1.400,00 1.600,00 1.800,00 2.000,00 0 15 30 45 90 120
tim e a fte r A C T H ch a lle n g e (m in )
se rum c o rt ic os te rone ( m m o l/l) C O N C B X LP 20 LP 10 S F A
0 .0 50 .0 1 00 .0 1 50 .0 2 00 .0 2 50 .0 1 10 1 00 1 00 0 [AC T H ] in p g /m l co rt ic os te rone r es pons (ng/ml) C O N C O N + C B X L P 2 0 L P 1 0 S F A
Figure 12: Corticosterone respons in vitro at increasing [ACTH]. Data are expressed as mean ± SEM (CON), n=7-9 per group.
3.3.8 Necropsy at age 12 weeks
At necropsy, the following absolute organs of the offspring fed a low protein diet in utero and during weaning had a significantly lower absolute weight as compared to the CON group: liver, kidney, heart and brain in the LP20 group (appendix 9). These lower organ weights are attributed to the significantly lower body weight at the time of autopsy of these groups. Expressed as a relative organ weight, the brain weight is significantly higher in the LP groups. In addition, relative spleen weight is significantly higher in offspring of the LP20 group.
3.3.9 Pancreas morphometry
Analysis of pancreatic tissue was hampered by the low amount of tissue taken out at
necropsy. It appears difficult to distinguish pancreas from surrounding fat tissue at the age of necropsy. Appendix 10 gives an overview of data collected. These are not a sufficient basis for derivation of conclusions about possible differences among experimental groups.
4.
Discussion
This study was aimed at further development of an animal model for prenatal programming of adult disease. The foregoing study (Siemelink et al., 2001, 2002) showed effects of prenatal nutrition on glucose metabolism. Effects on cardiovascular parameters were not obvious in that study. In the literature, some studies showed hypertension in the offspring, while others did not (Petry et al., 2001). Differences between studies may be partly due to differences in basal diet. In addition, much debate has centered on the validity of the tail cuff method for blood pressure determination. The hypertensive effect of a maternal low protein diet has been shown by Langley-Evans (2000) using the tail-cuff method. In our own previous study, we measured blood pressure under anesthesia. Advantages of measuring blood pressure directly in the arteria carotis are higher validity and reproducibility. However, since anesthesia may have a blood pressure lowering effect, in the present study we chose to measure the blood pressure in conscious, unrestrained and trained rats. In a pilot experiment (data not shown), a recovery period of 4 days after cannulation appeared to be a workable period for allowing sufficient recovery for the rats on the one hand and to prevent a twisted catheter or failure due to a reaction with local tissues on the other. The 4-day recovery period seemed to be sufficient for recovery in most of the groups, since the decrease in body weight was similar or lower on the fourth day after the cannulation compared to the previous days. The relative decrease in body weight of 5-7 % seen in our study is acceptable and has been observed in other studies. A decrease in body weight up to 10% on one day has been accepted as not life threatening. The result of the present study is that systolic and diastolic blood pressure was similar in all groups, with very little variation. Thus, the present model did not reproduce blood pressure effects shown in other studies, and confirms other negative studies. This finding adds to the ongoing debate on dietary factors and blood pressure programming (Petry et al., 2001). When comparing the magnitude of the blood pressures in our previous study and this study, the blood pressure lowering effect of the anesthesia is supported by the data.
The absence of any effect of carbenoxolone treatment, either on blood pressure, or on the ACTH response in vivo and in vitro is surprising. It can only be explained by assuming that the experimental setup was not sufficient to induce such effects. The in vivo ACTH response was not significantly different among all groups, although the SFA group tended to have a higher corticosterone response. The in vitro challenge of adrenal cells in suspension gave very variable results. This shows that it is difficult to isolate and incubate adrenal cells from different animals in parallel under identical conditions. Adrenal cells are very reactive to stress conditions, which are only in part avoidable during the isolation procedure. We have not yet been able to stabilize conditions in such a way that a useful tool resulted for studying the ACTH response of adrenal cells in vitro.
Pregnant animals of the LP10 group had a significantly higher food consumption as
compared to the control group. This is likely caused by the 10% lower energy content in the LP10 group. Both the LP10 and LP20 diet groups showed a decreased postnatal body weight gain, confirming that low protein rather than the fat contribution determined this effect. Furthermore, these findings confirm literature findings on low protein diet in utero and
postnatal growth (Snoeck et al., 1990). Puberty onset was delayed with 1.4 days on average in the LP20 group. This may have been a chance finding as no such effect was found in the LP10 group, which had a similar body weight gain profile.
The glucose tolerance test showed a relatively low insulin response in the low protein diet groups, which replicates findings in our earlier study (Siemelink et al., 2001). However, the effects were not statistically significant, and did not result in changes in glucose clearance. On the other hand, the SFA diet induced a higher insulin response, without affecting the glucose clearance. This also confirms earlier findings and possibly indicates increased insulin resistance. We have not been able to relate these findings to pancreatic morphology due to reduced availability of material for analysis. The finding that a diet high in saturated fat causes increased insulin resistance may have important public health implications. The mechanism which causes these changes should be further explored in view of current dietary habits in western societies and the increased prevalence of obesity and diabetes.
Acknowledgements
The authors are grateful for expert assistance from: Paul Span$, Rob van den Berg$, Cor Schot *, Paul Reulen*, Ruud van Kinderen*, Ron Vlug *, Jan Bos ~, Wim Vleeming ~, Erna Schenk ~, Henny Verharen ~, Piet Beekhof ~, Rija van Loenen ~.
$ Universitair Medisch Centrum St. Radboud, afdeling Chemische Endocrinologie, Nijmegen * RIVM, Central Animal Facility
References
Barker DJP, Osmond C: Infant mortality, childhood nutrition, and ischaemic heart disease in England and Wales. Lancet 1: 1077-1081, 1986.
Hales CN, Barker DJP, Clark PMS: fetal and infant growth and impaired glucose tolerance at age 64 years. Br.Med.J. 303: 1019-1022, 1991.
Korenbrot CC; Huhtaniemi IT; Weiner RI. Preputial separation as an external sign of pubertal development in the male rat. Biol Reprod 17: 298-303, 1977.
Langley-Evans SC. Critical differences in two low protein diet protocols in the programming of hypertension in the rat. Int.J.Food Sci. Nutr. 51: 11-17, 2000.
Osmond C, Barker DJ, Winter PD, Fall CH, Simmonds SJ: Early growth and death from cardiovascular disease in women. BMJ 307: 1519-1524, 1993.
Petry CJ, Ozanne SE, Hales CN. Programming of intermediairy metabolism. Mol.Cell.Endocrinology 185: 81-91, 2001.
Seckl JR: Physiologic programming of the fetus. Clin.Perinat. 25:939-962, 1998. Siemelink M, Opperhuizen A, Piersma AH. Intrauterine nutritional programming of adult disease. RIVM report 650250 005, 2000.
Siemelink M, Dormans JAMA, van Loveren H, Piersma AH. Diet during poregnancy and weaning and adult disease in the offspring in the rat. RIVM report 650250 006, 2001. Siemelink M, Verhoef A, Dormans JAMA, Span PN, Piersma AH. Dietary fatty acid composition during pregnancy and lactation in the rat programs growth and glucose metabolism in the offspring. Diabetologia, in press, 2002.
Snoeck A, Remacle C, Reussens B, Hoet JJ. Effect of a low protein diet during pregnancy on the fetal rat endocrine pancreas. Biol Neonate 1990: 57: 107-118.
Voedingsraad. Nederlandse Voedingsnormen 1989, Den Haag, Voorlichtingsburo voor de voeding 1992.
Appendix 1: Dietary composition
1.1 Composition of the experimental diets
g/100 g diet CON diet LP20 diet LP10 diet SFA diet
ingredients:
stand. vit. premix 0.30 0.30 0.27 0.30
st. spore premix 0.30 0.30 0.27 0.30 CahPo4.2H2O 1.54 1.54 1.38 1.54 CaCO3 1.19 1.19 1.06 1.19 KH2PO4 0.83 1.11 1.02 0.83 KCL 0.83 0.83 0.74 0.83 NaCL 0.36 0.36 0.32 0.36 MgSO4.7H20 0.48 0.48 0.43 0.48 MgO 0.24 0.24 0.21 0.24 Methionine synth. DL 0.30 0.30 0.30 0.30 Choline CL 50% 0.40 0.42 0.43 0.40 sour casein 18.00 9.00 9.00 18.00
corn starch gel inst 50.24 58.94 69.56 50.24
dicacel2+4/cellulose 5.00 5.00 5.00 5.00
soy oil 20.00 20.00 10.00 3.00
coconut oil 17.00
1.2 Macronutrient composition (analysed by TNO Nutrition, Zeist)
CON diet LP20 diet LP10 diet SFA diet protein (g/100 g) 18.8 8.4 8.1 15.4
fat (g/100 g) 15.6 19.1 9.4 18.8
carbohydrates (g/100 g) 46 51.2 58.7 46
energy (kcal/100 g) 400 410 352 415
1.3 Fatty acid composition of the oils in the experimental diets (expressed as percentage of total fatty acids, analysed by TNO Nutrition, Zeist, nd= not detected)
CON diet LP20 diet LP10 diet SFA diet C8:0 caprylic acid nd nd nd 5.6 C10:0 capric acid nd nd nd 4.8 C12:0 lauric acid nd 0.2 0.2 38.5 C14:0 myristic acid 0.2 0.2 0.3 14.6 C16:0 palmitic acid 11.6 11.2 12 10 C16:1 (n-9) palmitoleic acid nd nd 0.1 nd C17:0 0.2 0.3 0.3 nd C18:0 stearic acid 4.2 4.2 4.2 3.3 C18:1 t oleic acid 0.2 0.1 0.1 nd C18:1 c 22.9 22.7 22.6 10 C18:2 (n-6) linoleic acid 52.4 52 51.4 10.9 C18:3 (n-3) linolenic acid 6.8 6.9 6.7 1.4 not identified 1.9 2 2 0.6
Appendix 2: Maternal food intake and body weight and
litter data
Premating period
group CON CBX LP20 LP10 SFA
n 18 18 18 18 18
Body weight (gram ± SEM)
start 239.2 ± 2.9 229.5 ± 3.3 230.4 ± 4.9 237.0 ± 3.6 234.1 ± 4.4
week 1 250.3 ± 2.8 238.0 ± 3.7 246.7 ± 3.9 246.7 ± 4.4 243.7 ± 4.4
week 2 259.9 ± 3.7 244.2 ± 4.2 254.4 ± 4.4 252.4 ± 4.4 250.9 ± 5.1
Food consumption (gram ± SEM)
day 1 15.1 ± 0.6 13.7 ± 0.5 16.8 ± 0.6 17.4 ± 0.8 16.6 ± 0.7
day 3 12.0 ± 0.5 12.0 ± 0.5 13.7 ± 0.5 14.1 ± 0.9 * 11.9 ± 0.6
day 8 11.9 ± 0.5 11.7 ± 0.5 12.4 ± 0.4 13.8 ± 0.4 * 11.9 ± 0.6
Pregnancy
group CON CBX LP20 LP10 SFA
n 18 18 18 17 18
Body weight gain (gram ± SEM)
day 1 - day 6 23.1 ± 4.5 27.2 ± 1.7 27.0 ± 1.9 27.9 ± 1.6 33.0 ± 4.6
day 7 - day 11 23.3 ± 3.7 20.6 ± 1.1 20.5 ± 0.9 22.3 ± 1.3 20.2 ± 0.7
day 12 - day 16 22.7 ± 1.7 24.5 ± 1.5 22.1 ± 1.4 24.5 ± 1.5 24.6 ± 1.6
day 16 - day 21 49.0 ± 2.7 55.1 ± 2.7 46.7 ± 2.2 52.3 ± 2.6 55.3 ± 2.2
day 1 - day 21 118.1 ± 4.9 127.4 ± 4.7 116.4 ± 4.6 126.9 ± 4.9 133.1 ± 7.9
Food intake (gram ± SEM)
day 3 14.8 ± 0.5 14.1 ± 0.7 15.47 ± 0.6 19.0 ± 0.7 ** 15.2 ± 0.9
day 8 14.8 ± 0.6 12.5 ± 1.1 14.7 ± 1.0 18.2 ± 0.9 ** 14.4 ± 1.0
day 13 15.4 ± 0.7 14.6 ± 1.1 15.1 ± 0.8 18.2 ± 0.5 ** 14.7 ± 0.8
day 18 17.3 ± 1.1 15.8 ± 1.1 17.3 ± 0.9 20.7 ± 0.9 ** 14.6 ± 0.7
Lactation period
group CON CBX LP20 LP10 SFA
n 15 12 15 14 10 Food intake day 1 17.5 ± 0.8 16.8 ± 0.8 14.8 ± 1.5 17.7 ± 1.7 20.6 ± 1.2 day 7 32.2 ± 1.1 31.8 ± 1.2 22.8 ± 1.5 ** 30.6 ± 1.2 34.7 ± 1.6 day 14 41.8 ± 1.6 44.1 ± 1.5 31.6 ± 1.5 ** 36.5 ± 1.6 45.7 ± 1.6 day 21 55.2 ± 1.5 58.3 ± 1.0 41.4 ± 1.3 ** 46.3 ± 2.4 ** 55.9 ± 2.8 Litter size
group CON CBX LP20 LP10 SFA
n 15 12 15 14 10
number of pups 9.6 ± 0.8 10.3 ± 0.4 10.6 ± 0.6 11.3 ± 0.7 10.2 ± 0.6
number of dead pups * 1 (1) 3 (2) 9 (3) 2 (4) 3 (5)
survival percentage (%) 100 98 94 99 97
Appendix 3: Offspring body weight during
weaning
males CON n CBX n LP20 n LP10 n SFA n day 1 7.3 ± 0.2 34 8.0 ± 0.1 17 7.2 ± 0.2 32 6.9 ± 0.2 30 8.2 ± 0.1 ** 41 day 7 18.9 ± 0.7 36 19.2 ± 0.3 20 11.7 ± 0.5 ** 34 14.5 ± 0.6 ** 22 20.7 ± 0.3 ** 36 day 14 37.2 ± 1.1 52 39.8 ± 0.4 25 19.7 ± 0.5 ** 38 23.1 ± 0.5** 27 39.1 ± 0.4 32 day 21 60.8 ± 1.2 52 62.0 ± 0.9 23 29.4 ± 0.8 ** 41 34.6 ± 1.0 ** 27 59.9 ± 0.7 36 females CON n CBX n LP20 n LP10 n SFA n day 1 6.6 ± 0.2 34 7.3 ± 0.1 ** 42 6.8 ± 0.2 45 7.4 ± 0.2** 25 7.9 ± 0.2** 14 day 7 17.8 ± 0.6 36 18.4 ± 0.3 39 11.4 ± 0.3 ** 42 13.8 ± 0.4 ** 23 19.3 ± 0.4 19 day 14 35.4 ± 1.1 52 36.9 ± 0.7 49 19.8 ± 0.4 ** 44 23.0 ± 0.5** 29 37.3 ± 0.9 15 day 21 57.6 ± 1.1 52 55.5 ± 1.1 50 29.1 ± 0.7 ** 49 34.3 ± 0.6 ** 29 56.8 ± 1.0 19Appendix 4: Male offspring development after
weaning
Puberty onset
CON CBX LP20 LP10 SFA
body weight (grams ± SEM) 138.0 ± 2.3 (47) 134.0 ± 2.8 (27) 103.5 ± 2.3 **(49) 109.3 ± 2.0 **(37) 132.7 ± 2.2 (36) day ± SEM 35.1 ± 0.3 34.6 ± 0.5 36.5 ± 0.3 ** 34.9 ± 0.3 34.6 ± 0.3
Mean body weight of males (in grams ± SEM)
CON CBX LP20 LP10 SFA
number of pups week 4-12 48 27 49 37 36 week 4 96.6 ± 2.5 94.4 ± 1.4 58.2 ± 1.7 ** 68.4 ± 1.7 ** 91.6 ± 1.8 week 5 134.6 ± 3.0 137.9 ± 2.1 96.8 ± 2.5 ** 109.0 ± 1.9 ** 134.4 ± 2.6 week 6 185.8 ± 3.2 185.3 ± 2.6 134.4 ± 2.8 ** 152.5 ± 2.7** 185.3 ± 3.1 week 7 236.9 ± 4.1 237.6 ± 3.2 176.6 ± 3.5 ** 199.0 ± 3.6 ** 238.8 ± 3.6 week 8 288.5 ± 4.6 285.0 ± 5.0 221.2 ± 4.1 ** 248.2 ± 4.2** 289.9 ± 3.7 week 9 329.8 ± 4.9 327.4 ± 4.7 257.4 ± 4.5 ** 279.8 ± 4.2 ** 332.1 ± 3.6 week 10 361.6 ± 5.8 361.8 ± 6.9 287.1 ± 5.3 ** 307.8 ± 5.0 ** 368.4 ± 4.2 week 11 392.0 ± 5.5 395.1 ± 5.2 311.4 ± 4.8 ** 332.4 ± 4.5** 398.0 ± 3.9 week 12 418.5 ± 5.7 413.8 ± 6.7 336.0 ± 5.3 ** 354.9 ± 5.2 ** 424.1 ± 4.5 * p < 0.05 ** p < 0.01
Appendix 5: Body weight and cardiovascular data of
cannulated rats
CON CON + CBX LP20 LP10 SFA
n 9 8 10 8 8
body weight prior to canulation 453.9 ± 19.0 440.8 ± 16.8 384.4 ± 13.8 392.7 ± 14.1 465.2 ± 13.7
recovery period:
body weight decrease day 1 (%) * 1.2 ± 0.5 1.4 ± 0.5 1.0 ± 0.5 0.6 ± 0.4 0.7 ± 0.7
body weight decrease day 2 (%) * 4.7 ± 0.4 5.3 ± 0.4 5.2 ± 0.6 5.3 ± 1.0 4.3 ± 0.5
body weight decrease day 3 (%) * 6.0 ± 0.7 6.2 ± 0.5 6.4 ± 0.7 6.7 ± 0.6 6.3 ± 0.4
total body weight decrease in recovery period (%) *
5.4 ± 0.8 6.2 ± 0.5 6.0 ± 0.6 7.0 ± 0.5 6.3 ± 0.4
body weight prior to BP measurement
428.2 ± 15.0 409.3 ± 18.8 361.0 ± 12.7 364.7 ± 13.1 435.7 ± 13.8
heart rate during BP measurement 346.7 ± 11.5 370.6 ± 15.4 369.0 ± 11.8 366.1 ± 6.4 361.9 ± 7.9
systolic BP 134.7 ± 2.4 134.4 ± 3.7 136.8 ± 4.2 129.1 ± 2.7 128.1 ± 4.5
diastolic BP 93.6 ± 2.4 94.3 ± 3.8 94.3 ± 4.2 88.1 ± 2.5 88.9 ± 3.4
mean arterial pressure 107.3 ± 2.0 107.6 ± 3.3 108.5 ± 4.0 101.8 ± 2.4 102.0 ± 7.9 * compared to body weight prior to cannulation
Appendix 6: Glucose and insulin
levels during OGTT
Glucose concentration (mmol/l ± SEM)
t 0 15 30 60 90 120 n CON 12 5.8 ± 0.1 8.0 ± 0.2 10.5 ± 0.3 11.6 ± 0.5 10.7 ± 0.4 7.8 ± 0.1 CBX 11 6.3 ± 0.3 8.9 ± 0.5 11.6 ± 0.4 11.9 ± 0.6 10.5 ± 0.5 7.4 ± 0.3 LP20 11 5.8 ± 0.2 8.0 ± 0.1 9.4 ± 0.4 11.0 ± 0.4 10.3 ± 0.3 7.3 ± 0.2 LP10 14 5.6 ± 0.1 7.7 ± 0.2 10.3 ± 0.4 11.7 ± 0.5 10.7 ± 0.3 7.7 ± 0.2 SFA 13 5.8 ± 0.1 8.5 ± 0.3 10.7 ± 0.4 11.2 ± 0.3 10.5 ± 0.3 7.3 ± 0.1
Insulin concentration (pmol/l ± SEM)
t 0 15 30 60 90 120 n CON 12 126 ± 15 330 ± 62 528 ± 102 521 ± 96 322 ± 56 255 ± 31 CBX 11 127 ± 17 268 ± 48 446 ± 75 285 ± 42 ** 282 ± 54 167.0 ± 27 LP20 12 104 ± 23 320 ± 48 281 ± 58 320 ± 46 248 ± 40 146 ± 24 * LP10 13 117 ± 33 232 ± 34 283 ± 36 265 ± 32 ** 182 ± 26 151 ± 22 * SFA 13 121 ± 68 633 ± 94 503 ± 58 343 ± 58 343 ± 58 204 ± 28 Area under the curve (total insulin secretion)
Insulin CON 2082 ± 223 CBX 1575 ± 207 LP20 1419 ± 201 LP10 1196 ± 129 SFA 2228 ± 249 * p < 0.05 ** p < 0.01
Appendix 7: Plasma cortocosterone response (mmol/l) to
ACTH challenge in vivo (cf. Figure 11)
n 0 15 30 45 90 120 CON 9 37.4 ± 10.1 1042 ± 789 1411 ± 111 1413 ± 69 281.9 ± 20.2 101.2 ± 14.7 CBX 11 58.0 ± 12.5 1153 ± 79 1564 ± 84 1559 ± 72 251.6 ± 25.4 144.1 ± 18.8 LP20 12 66.6 ± 9.7 1161 ± 75 1567 ± 103 1360 ± 65 228.7 ± 25.1 88.7 ± 17.8 LP10 12 58.2 ± 9.1 1059 ± 70 1525 ± 85 1585 ± 78 457.5 ± 77.7 209.0 ± 12.1 SFA 10 99.9 ± 9.9 1130 ± 70 1750 ± 73 1660 ± 80 312.0 ± 24.1 130.1 ± 16.3
Appendix 8: Individual in vitro corticosteron response
(ng/l) after ACTH stimulation of adrenal cells in
suspension (continued on next page)
ED 50 (pg ACTH) ACTH concentration (ng/l)group 3 10 30 100 300 833 CON 10.1 32.5 171.5 313.5 314.5 360 CON NTB 0 419 CON 13.8 42.5 122.5 252 233 296.5 CON NTB 51.5 59 56 57 CON 13.3 35.5 97 192 149 CON 7.9 39.5 287 259 217 260 CON 12.3 20 55.5 103.5 73 77 CON 16.2 65 146.5 320 230 CON 11.7 10 40.5 56 81.5 87 66 CON 10.3 34.5 5.5 72.5 103.5 56.5 CON 19.2 41.5 22.5 207 139.5 170.5 CON 11.9 45 17 118 99 240 CON 9.2 * 21 55 81 62 51 CBX 7.1 * 101 204 237.5 272 CBX 8.3 * 128 295 417.5 381 320 CBX 13.2 2.5 84.5 209.5 176.5 201 CBX 9.5 49 131 206 205 CBX 8.2 33 100 146.5 147 133.5 CBX 6.8 36 155 203.5 209 153 CBX 10.4 16 69 98.5 147 85.5 CBX NTB 89 196 180 161.625 CBX 15.6 21.5 80 103 34.5 LP20 6.0 55.5 147.5 99.5 108.5 150 LP20 5.6 72.5 134 153.5 161.5 121.5 LP20 7.0 157 347.5 393 400.5 401 LP20 13.7 8 59 151 156 LP20 NTB 15.5 128 87.5 103.5 107 LP20 8.1 27 145.5 196 148.5 187 LP20 14.9 51 79.5 135 151.5 117 LP20 NTB 13 41.5 36 LP20 10.5 62 36 135 157.5 61 LP20 8.7 97 49 175.5 168.5 111 LP10 9.9 30 86.5 142.5 141 213 LP10 9.3 93.5 237 362.5 357.5 315 LP10 9.6 146.5 202 254 321.5 245 LP10 12.5 6 26.5 25 5 LP10 20.0 8.5 75.5 67 70 LP10 9.1 16 215 217.5 184.5 175.5
LP10 12.1 63 114.5 182.5 173.5 169.5 LP10 11.4 30 47 67.5 58.5 60 LP10 15.4 13 79 43 228 122 129.5 SFA 7.9 47.5 149.5 216 167.5 235 SFA 6.7 75.5 196 252 256 256 SFA 7.9 35 102 146 167 197 SFA 10.3 34 71 49 42 SFA 7.0 3.5 34 48 55 43.5 SFA 9.4 * 29 52 43.5 SFA NTB 215.5 157 185.5 275 SFA 19.1 44.5 66 120.5 82 96 SFA 7.9 18.5 67.5 103.5 98 92 84.5 SFA NTB 5.5 32.5 44 58.5 30 33.5 SFA 8.5 211 218 175 332.5 323.5 382.5 SFA 8.7 37.5 18 70 94.5 45
Appendix 9: Necropsy data
Absolute organ weight in grams (mean ± SEM)
CON CBX LP20 LP10 SFA
n 12 12 12 12 12
body weight at section 458.3 ± 8.9 492.9 ± 14.6 366.3 ± 11.3** 376.9 ± 9.2 ** 477.9 ± 11.1
liver weight 14.8 ± 0.5 15.9 ± 0.5 11.8 ± 0.4 ** 12.2 ± 0.3 ** 15.4 ± 0.5
pancreas weight 1.1 ± 0.1 1.3 ± 0.1 0.9 ± 0.1 0.9 ± 0.1 1.2 ± 0.1
left kidney weight 1.3 ± 0.0 1.4 ± 0.0 1.0 ± 0.0 ** 1.1 ± 0.0 ** 1.4 ± 0.1
right kidney weight 1.4 ± 0.0 1.4 ± 0.1 1.0 ± 0.0 ** 1.1 ± 0.0 ** 1.4 ± 0.0
adrenal weight 0.1 ± 0.0 0.0 ± 0.0 0.1 ± 0.0 0.0 ± 0.0 0.1 ± 0.0 heart weight 1.6 ± 0.0 1.5 ± 0.1 1.3 ± 0.1 ** 1.3 ± 0.1 ** 1.6 ± 0.1 thymus weight 0.8 ± 0.0 0.7 ± 0.1 0.7 ± 0.1 0.7 ± 0.1 0.7 ± 0.0 spleen weight 0.7 ± 0.0 0.7 ± 0.0 0.6 ± 0.0 0.6 ± 0.0 0.7 ± 0.0 brain weight 1.9 ± 0.0 1.9 ± 0.1 1.8 ± 0.0 ** 1.8 ± 0.0 1.9 ± 0.0 pituitary weight 0.0 ± 0.0 0.0 ± 0.0 0.0 ± 0.0 0.0 ± 0.0 0.0 ± 0.0
Relative organ weight in grams (mean ± SEM)
CON CBX LP20 LP10 SFA
n 12 12 12 12 12
liver/body weight 3.22 ± 0.07 3.22 ± 0.07 3.23 ± 0.05 3.23 ± 0.04 3.22 ± 0.06
pancreas/body weight 0.227 ± 0.020 0.256 ± 0.010 0.245 ± 0.014 0.233 ± 0.012 0.257 ± 0.023 left kidney/body weight 0.29 ± 0.01 0.28 ± 0.01 0.29 ± 0.01 0.28 ± 0.01 0.28 ± 0.01 right kidney/body weight 0.30 ± 0.01 0.28 ± 0.01 0.29 ± 0.00 0.29 ± 0.01 0.28 ± 0.01 adrenal/body weight 0.012 ± 0.001 0.010 ± 0.001 0.014 ± 0.001 0.013 ± 0.001 0.012 ± 0.000 heart/body weight 0.35 ± 0.01 0.32 ± 0.01 0.34 ± 0.01 0.35 ± 0.01 0.34 ± 0.01 thymus/body weight 0.18 ± 0.01 0.13 ± 0.01 0.20 ± 0.02 0.20 ± 0.02 0.15 ± 0.01 spleen/body weight 0.15 ± 0.01 0.15 ± 0.01 0.17 ± 0.01 * 0.17 ± 0.01 0.15 ± 0.01 brain/body weight 0.42 ± 0.01 0.39 ± 0.01 0.48 ± 0.01 ** 0.48 ± 0.01 ** 0.40 ± 0.01 pituitary/body weight 0.002 ± 0.000 0.002 ± 0.000 0.003 ± 0.000 0.003 ± 0.000 0.002 ± 0.000 *: p <0.01 ** p < 0.001
Appendix 10: Individual data pancreas morphometry
Animal no. opp.pan opp.islets N % islets N N>0.03
mm2 N>0.03 mm2 mm2 mm2 /100 mm2 per 100 mm2 CON 1 63.44 0.34 44 0.54 69 2 3 5 32.14 0.15 24 0.46 75 1 3 11 20.77 0.14 23 0.67 110 0 0 12 96.13 0.95 84 0.98 87 4 4 13.4 8.93 0.01 5 0.11 55 0 0 18 20.89 0.18 20 0.86 95 3 14 0.60±030 81±19 4±5 CBX 20.2 14.54 0.07 11 0.48 75 0 0 22.3 17.78 0.05 19 0.28 106 0 0 22.4 10.18 0.05 12 0.49 117 0 0 25 13.49 0.06 6 0.44 44 0 0 27.2 58.47 0.35 38 0.59 64 3 5 0.45 ±0.11 81±30 1±2 LP20 37 24.81 0.06 17 0.24 68 0 0 46 11.90 0.01 3 0.08 25 0 0 47 32.97 0.14 20 0.42 60 0 0 48 21.39 0.03 12 0.14 56 0 0 50 11.27 0.03 9 0.26 79 0 0 51 81.25 0.94 81 1.15 99 7 9 53 21.46 0.15 24 0.69 111 0 0 0.43±0.38 71±29 1±3 LP10 57 26.00 0.11 27 0.42 103 0 0 57-4 14.13 0.03 7 0.21 49 0 0 59-3 17.33 0.05 18 0.29 103 0 0 59-4 23.23 0.20 29 0.86 124 1 4 63 26.96 0.18 30 0.66 111 0 0 66-4 49.61 0.35 41 0.71 82 1 2 68-4 19.35 0.14 24 0.72 124 0 0 69 60.27 0.23 49 0.38 81 1 2 70-4 12.86 0.04 12 0.31 93 0 0 0.50±0.23 97±24 1±1 SFA 78 47.11 0.58 53 1.23 112 3 6 83 35.67 0.06 26 0.16 72 0 0 84-3 25.72 0.03 10 0.11 38 0 0 86-4 118.65 2.03 120 1.71 101 17 14 86b 29.59 0.14 19 0.47 64 1 3 0.74±0.70 77±30 5±6
![Figure 12: Corticosterone respons in vitro at increasing [ACTH]. Data are expressed as mean ± SEM (CON), n=7-9 per group.](https://thumb-eu.123doks.com/thumbv2/5doknet/3084370.9543/22.892.114.775.112.424/figure-corticosterone-respons-vitro-increasing-acth-data-expressed.webp)
