DEVELOPING A VISUAL SYNTAX FOR
THE
PROCESS
AND
DECISION
MODELING LANGUAGE DECICLARE
USING THE PON-S METHODOLOGY
Lander Hoste
Aantal woorden / Word count: 22059
Stamnummer / student number: 01504486
Promotor / supervisor: Prof. Dr. Frederik Gailly
Masterproef voorgedragen tot het bekomen van de graad van:
Master’s Dissertation submitted to obtain the degree of:
Master in Business Engineering: Data Analytics
This page is not available because it contains personal information.
Ghent University, Library, 2021.
ii
Preface
Before you lies the thesis that concludes my education as a Master in Business Engineering: Data Analytics. During a 5-year learning program at Ghent University, multiple courses taught me how to approach problems from an analytical perspective. This new way of thinking was inevitable to successfully write this dissertation about the recently developed process and decision modeling language DeciClare.
This dissertation is primarily addressed to other researchers in the domain of business process modeling. They could further refine the proposed visual syntax. Nevertheless, this visualization of DeciClare makes the abstract syntax more understandable and tangible for users. Therefore, we move one step closer in the direction of a modeling language that has its practical use in representing flexible and knowledge-intensive processes.
I would like to thank both my promotor, Prof. Dr. Frederik Gailly, and commissioner, Dr. Steven Mertens, to guide me in the writing of this paper. Their support and advice should not be underestimated and played a vital role in the final result of this dissertation.
Lander Hoste
iii
Preamble
Originally, the visual syntax of DeciClare presented in this dissertation would have been explicitly evaluated by the target audience (doctors/surgeons/other people) as the last step in the design process. A methodology suited to test the intuitiveness of DeciClare’s notation was found in Bork, Schrüffer, & Karagiannis (2019). In this work, the authors present a design for an empirical evaluation study that should be conducted during face-to-face interviews.
Unfortunately, this evaluation study could not be carried out due to the unexpected Covid-19 situation. It would have been irresponsible to contact doctors and surgeons to evaluate the language when they have their hands full saving lives. Moreover, the lockdown also prevented me from interviewing other potential users of the language. As a consequence, I could only include the empirical evaluation study in this thesis without executing it. However, future researchers can make use of the proposed material to test DeciClare’s intuitiveness.
This preamble is drawn up in consultation between the student and the supervisor and is approved by both.
iv
Table of content
CONFIDENTIALITY AGREEMENT ... I PREFACE ... II PREAMBLE ... III LIST OF ACRONYMS ... V LIST OF TABLES ... VI LIST OF FIGURES... VII1. INTRODUCTION ... 1
2. RELATED RESEARCH ... 3
2.1 KNOWLEDGE-INTENSIVE PROCESSES ... 3
2.2 IMPERATIVE VERSUS DECLARATIVE LANGUAGES ... 5
2.3 DECLARATIVE MODELING LANGUAGES ... 6
2.4 IMPORTANCE OF A VISUAL SYNTAX ... 9
2.5 DECICLARE EXPLAINED ... 12
3. PROPOSED FRAMEWORK FOR VISUAL SYNTAX: PON-S ... 14
4. PON-S APPLIED FOR DECICLARE ... 20
4.1 SPECIFY DIALECTS ... 20
4.2 IMPLEMENT DIALECTS ... 23
4.2.1 Definition of the dialect symbol set and application of support principles ... 23
4.2.1.1 Functional/control-flow perspective ... 23
4.2.1.2 Data perspective ... 42
4.2.1.3 Resource perspective ... 49
4.2.1.4 Optional constraints ... 59
4.2.1.5 Symbol set for the simplified dialect ... 60
4.2.2 Identification of ways to manage complexity ... 63
4.2.2.1 Evaluation of the symbol set complexity ... 63
4.2.2.2 Complexity Management and Cognitive Integration ... 67
4.3 VALIDATE DIALECTS ... 73
4.3.1 Designer evaluation ... 73
4.3.2 Empirical evaluation ... 75
5. CONCLUSION ... 78
6. LIMITATIONS AND FURTHER RESEARCH ... 79 7. LIST OF REFERENCES ... VIII APPENDIX 1. PON-S EXPLAINED ... 1.1 APPENDIX 2. OPTIONAL CONSTRAINTS ... 2.1 APPENDIX 3. EMPIRICAL EVALUATION COMPLETE DIALECT ... 3.1 APPENDIX 4. EMPIRICAL EVALUATION SIMPLIFIED DIALECT ... 4.1
v
List of acronyms
BPCN - Business Process Constraint Network
BPM - Business Process Modeling
BPMN - Business Process Model and Notation CMMN - Case Management Model and Notation CMQF - Conceptual Modeling Quality Framework DCR Graphs - Dynamic Condition Response Graphs DMN - Decision Model and Notation
DPIL - Declarative Process Intermediate Language GCMM - Generic Metric Measuring Model Complexity KiP - Knowledge-intensive Process
LTL - Linear Temporal Logic
OCBC - Object-Centric Behavioral Constraints
OMG - Object Management Group
PoN - Physics of Notation
PoN-S - Physics of Notation – Systematized TBDeclare - Target-Branched Declare
vi
List of tables
Table 1. Research overview of declarative modeling languages. ... 11
Table 2. Dialect set of DeciClare's visual syntax. ... 22
Table 3. Representation of events. ... 25
Table 4. AtLeast, AtMost, Exactly, Init, and Last. ... 28
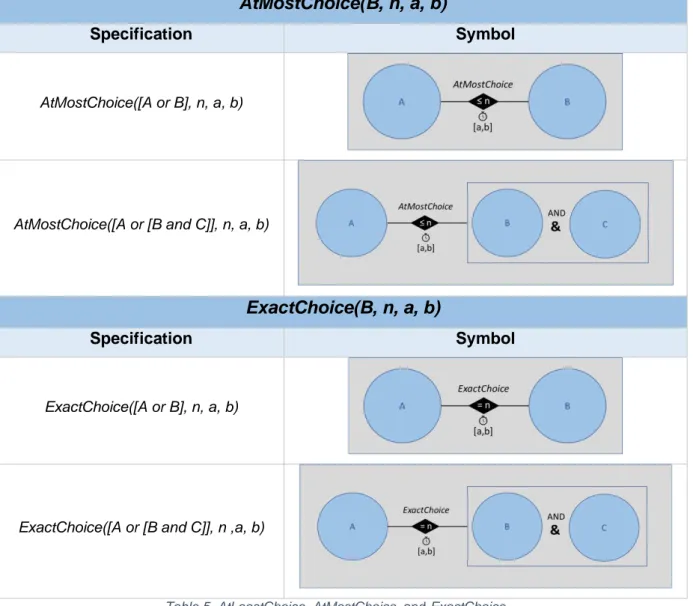
Table 5. AtLeastChoice, AtMostChoice, and ExactChoice. ... 30
Table 6. EventAvailabilitySchedule and EventUnavailabilitySchedule... 31
Table 7. RespondedPresence. ... 33
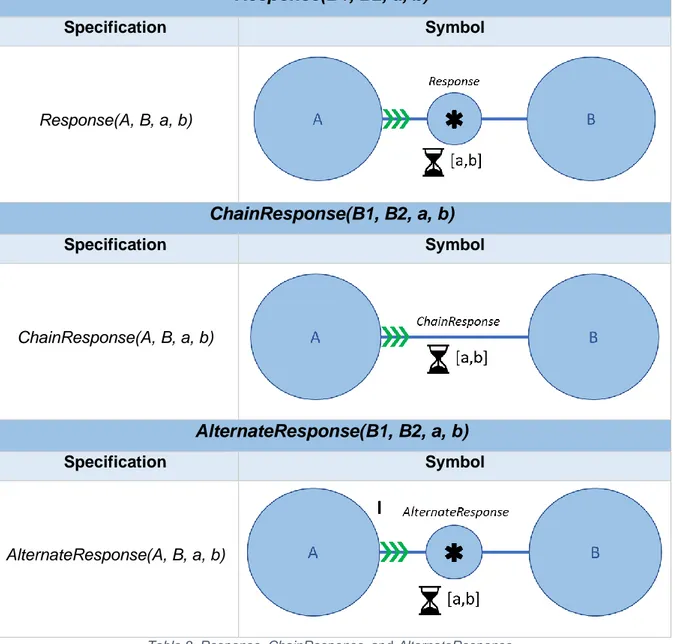
Table 8. Response, ChainResponse, and AlternateResponse. ... 35
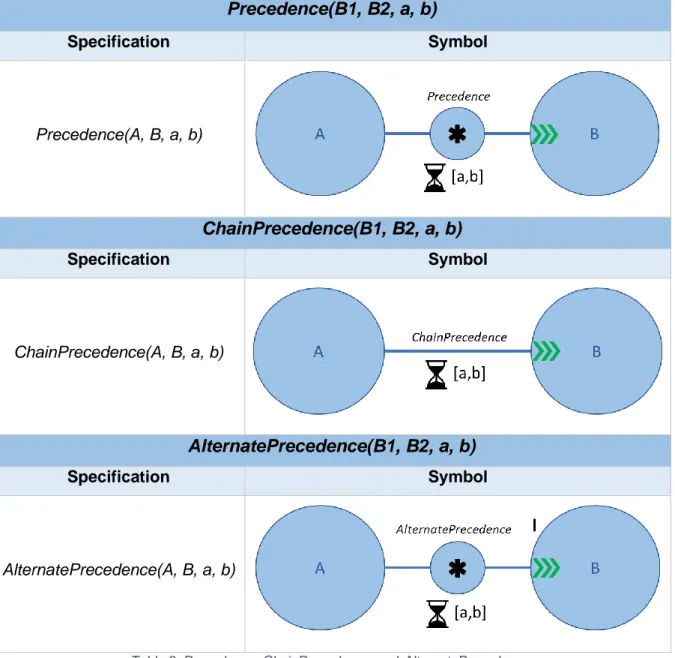
Table 9. Precedence, ChainPrecedence, and AlternatePrecedence. ... 37
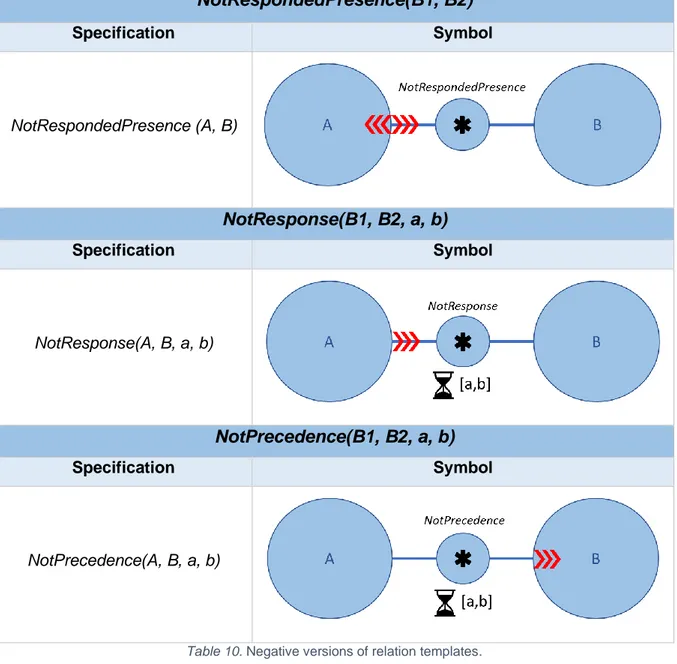
Table 10. Negative versions of relation templates. ... 39
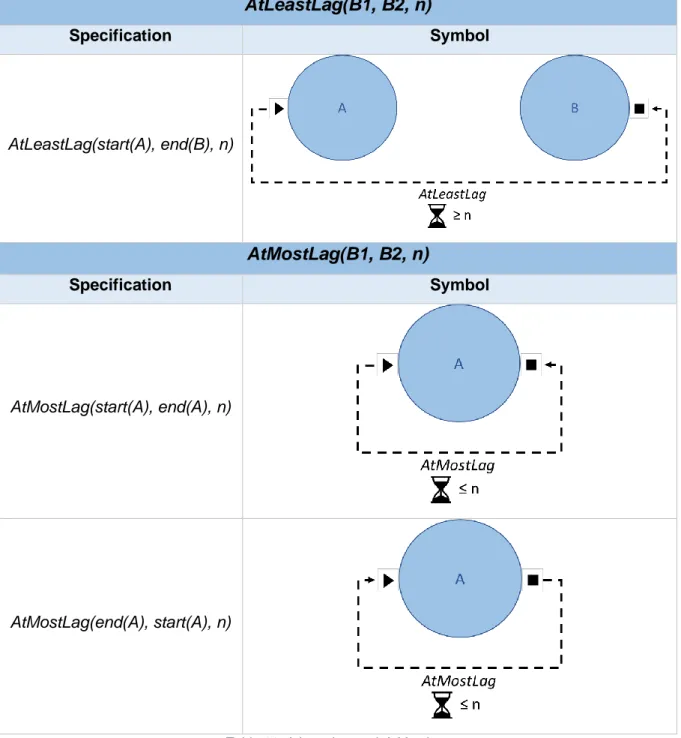
Table 11. AtLeastLag and AtMostLag. ... 41
Table 12. Read, Insert, Update, and Delete. ... 45
Table 13. AtLeastAvailable, AtMostAvailable, and ExactAvailable. ... 51
Table 14. ResourceAvailabilitySchedule and ResourceUnavailabilitySchedule. ... 52
Table 15. AtLeastUsage, AtMostUsage, and ExactUsage. ... 55
Table 16. ActivityAuthorization and NotActivityAuthorization. ... 56
Table 17. Overview of the semantic constructs in the complete and simplified dialects. ... 62
Table 18. Calculation of the model complexity. ... 66
Table 19. Overview of the Complexity Management and Cognitive Integration techniques. ... 72
vii
List of figures
Figure 1. Example of a Declare model for the treatment of a fracture. ... 7
Figure 2. Metamodel of DeciClare.. ... 13
Figure 3. PoN-S groups of PoN principles. ... 17
Figure 4. PoN-S methodology. ... 18
Figure 5. Example of ChainResponse with events. ... 36
Figure 6. Example of positive and negative Response template in grayscale. ... 39
Figure 7. Example of RequiredUpdate with an activation decision... 46
Figure 8. Example of a data-aware AtLeast constraint. ... 47
Figure 9. Example of a data-aware Response constraint. ... 48
Figure 10. Example of the SimultaneousCapacity template. ... 53
Figure 11. Example of a DecisionAuthorization constraint. ... 57
Figure 12. Example of a ResourceInequality constraint. ... 58
Figure 13. Overview of incorporated perspectives in the simplified dialect. ... 61
Figure 14. Example complete dialect. ... 65
Figure 15. Example simplified dialect. ... 65
Figure 16. Example with collapsed subprocesses. ... 68
Figure 17. Example with expanded subprocess. ... 69
Figure 18. Example with pools. ... 70
Figure 19. Example summary (long shot) diagram. ... 71
Figure 20. Example of a less sequentially defined case. ... 74
Figure 21. Relationship between Semantic Transparency, Perceived Cognitive Effectiveness, and Perceived Usefulness.. ... 75
Figure 22. Evaluation technique for notation effectiveness.. ... 76 Figure 23. Specify dialect(s). ... 1.1 Figure 24. Implement dialect(s)... 1.3 Figure 25. Define dialect symbol set. ... 1.4 Figure 26. Apply support principles. ... 1.5 Figure 27. Identify ways to manage model complexity. ... 1.6 Figure 28. Validate dialect(s).. ... 1.8
1
1.
Introduction
In the past, process modeling languages such as BPMN (Object Management Group (OMG), 2015; White, 2004), Petri nets (Murata, 1989; Petri, 1962), and UML activity diagrams (Object Management Group (OMG), 2015) were seen as the answer to every Business Process Modeling (BPM) problem. The domain of BPM is highly relevant for managers to understand, compare, and improve business processes and could significantly impact their cost-effectiveness (van der Aalst, 2013).
The previously mentioned languages fall under the umbrella of the imperative modeling languages since they attempt to provide a complete enumeration of all valid process variations (Fahland et al., 2009; Goedertier, Vanthienen, & Caron, 2015). While these languages have proven their effectiveness in modeling standardized and simple processes that can be found in the field of manufacturing (Lu & Sadiq, 2007), things become complicated for knowledge-intensive business processes (KiPs) (Di Ciccio, Marrella, & Russo, 2015; Mertens, Gailly, & Poels, 2017). Such processes can be found in fields such as healthcare (Mulyar, Pesic, van der Aalst, & Peleg, 2008; Rovani, Maggi, De Leoni, & van der Aalst, 2015).
In KiPs, a myriad of process variations are often valid at design time. As a result, imperative languages lack the freedom to model such processes efficiently (van der Aalst, Pesic, & Schonenberg, 2009). Additionally, the more unpredictable a process is, the higher the relative importance of data. For instance, the next step in the medical treatment of a patient is fueled by data (e.g. expertise of the doctor, result of a CT scan…). Hence, the data perspective should be explicitly incorporated into a modeling language suitable for KiPs (Di Ciccio et al., 2015). In contrast to their imperative counterparts, where all process variations are enumerated, declarative modeling languages rely on a set of rules and constraints that should be followed (van der Aalst et al., 2009). Process variations that comply with these constraints are allowed, even if not mentioned explicitly. This way, model designers only need to specify the rules of the game, and not a complete specification of all possible process paths.
Consequently, declarative languages offer a solution to decrease the modeling effort drastically. They also resolve the flexibility issues that imperative languages face in the case of modeling loosely framed and KiPs (Goedertier et al., 2015). Furthermore, some of these languages attempt to include the data perspective. This should make them more applicable to represent KiPs. However, until recently, there did not exist a declarative language that complied with all modeling requirements for KiPs as formulated by Mertens et al. (2017).
2 To overcome this limitation, Mertens et al. (2017) developed a more adequate declarative modeling language, called DeciClare. This language not only serves as a process modeling language but it also specifies how decisions are made at run time of the process. Hence, DeciClare’s abstract syntax is the most powerful one to model loosely framed and KiPs up until this point. However, currently, no graphical representation exists for this language.
Having an effective abstract syntax is one thing, being able to use the language as an end-user who does not know all semantics by heart is something else. The graphical representation of the abstract syntax has a tremendous impact on the usability and effectiveness of the language and should, therefore, not be regarded as a simple afterthought (Moody, 2009). Instead, similar to the semantics, the visual syntax of a language should be scientifically motivated. In general, the importance of an effective visual syntax has been undervalued by many researchers and is seldom based on solid theory.
This dissertation suggests a graphical representation for DeciClare based on an explicit methodology, namely the Physics of Notation – Systematized (PoN-S) (da Silva Teixeira, 2017). This procedure rests on the Physics of Notation (PoN) of Moody (2009) and serves as a stepwise guide to design a cognitively effective visual syntax. A representation that can be readily understood by end-users is vital for the acceptance and adoption of DeciClare as a modeling language. Consequently, the research question is as follows:
“How to develop a cognitively effective visual syntax for the declarative process and decision modeling language DeciClare for end-users using the
PoN-S methodology?”
Hence, the contribution of this dissertation is a complete and scientifically motivated visual syntax for the declarative modeling language DeciClare, starting from the abstract syntax as presented by Mertens et al. (2017). The remainder of this thesis is structured in the following way. In Section 2, an overview is provided of the relevant works in the field of (declarative) process modeling languages, including a brief explanation of DeciClare. Afterward, the PoN-S methodology (da PoN-Silva Teixeira, 2017) to design the visual syntax for DeciClare is elaborated in Section 3, followed by the actual execution of this framework in Section 4. The conclusion of this thesis can be found in Section 5, followed by some limitations and suggestions for further research in Section 6.
3
2.
Related research
This section delves into the relevant literature of BPM in the context of the research question. Section 2.1 provides some background about the characteristics of knowledge-intensive processes. Afterward, the difference between imperative and declarative process modeling languages and the superiority of the latter type to model KiPs is discussed (Section 2.2). Subsequently, we will present an overview of the most well-known declarative languages in Section 2.3. Then, the importance of visual representations to improve understandability for users is demonstrated in Section 2.4, followed by a brief explanation of the abstract syntax of DeciClare in Section 2.5.
2.1 Knowledge-intensive processes
In 2013, van der Aalst denoted the concept of predictability as a useful way to classify various business processes. Predictability refers to the extent to which the way of execution of a process can be determined in advance (Pesic, 2008). Four categories can be identified using predictability as a means of classification. Firstly, unframed processes are impossible to specify beforehand as each execution of the process is unique. Secondly, ad hoc framed processes use a predefined model as a point of reference, with numerous changes during run time. This could, for example, be the case for the baseline schedule of a project that faces delays or reorganizations when it is executed. Thirdly, loosely framed processes can be specified a priori and have a large but finite number of possible process executions. Finally, tightly framed processes follow a predefined process model. In general, the more knowledge-intensive a process, the more it is located towards the unframed side of the continuum. This makes a KiP hard to predict at design time.
Depending on the predictability of a process, a modeling language should support four major perspectives to a certain extent (La Rosa, Dumas, ter Hofstede, & Mendling, 2011; Mertens et al., 2017). Firstly, the functional perspective relates to available activities and events. Secondly, the control-flow perspective defines their ordering in the process. Thirdly, the availability of resources required for the process and the relationships among them refer to the resource perspective. Finally, the data objects that are consumed and generated by the process to make appropriate decisions reflect the data perspective. Stated differently, the data perspective refers to the knowledge that governs the functional, control-flow, and resource perspectives (Di Ciccio et al., 2015).
4 These perspectives are no separate silos, as they are heavily influenced by one another (Mertens et al., 2017). For instance, the availability of resources has a major impact on the ordering of activities in the model (functional and control-flow perspectives). Additionally, the data perspective provides decision logic on how to respond to the unavailability of resources. Hence, modeling loosely framed and KiPs requires special attention. This is because the execution of a KiP highly depends on knowledge workers (Di Ciccio et al., 2015). These people do not act like machines but make decentralized decisions according to their knowledge and the case-specific information available. Therefore, the data perspective is of paramount importance in the modeling of loosely framed and KiPs (Mertens et al., 2017). Operators should be given the freedom to make the right decisions, considering all data values. This freedom incorporation should be supported by the models at design time or at run time, or both (Reichert & Weber, 2012; Schonenberg, Mans, Russell, Mulyar, & Van Der Aalst, 2008).
Yet, externalizing the knowledge is not straightforward, as it typically is of a tacit (or implicit) nature (Ferreira & Ferreira, 2006). However, by making the knowledge explicit, the process becomes more transparent and decisions can be motivated more easily (Mertens et al., 2017). One way to overcome this externalization problem is by using process mining techniques that automatically create models from historic data logs of the process (Mertens, Gailly, & Poels, 2018).
As a result of the unique character of loosely framed and KiPs, Mertens et al. (2017) formulated four requirements that modeling languages should meet to represent such processes adequately:
- Req 1: The language must support ‘flexibility by design’. Due to the inherently variable and unpredictable nature of KiPs, plenty of process variations could be valid (Di Ciccio et al., 2015; Rovani et al., 2015). Flexibility by design indicates that not every allowed process variation should be designed into the model explicitly (Schonenberg et al., 2008). Under such circumstances, the choice of the most appropriate path is postponed from design time to run time, where knowledge workers will eventually pick the execution mode (Goedertier et al., 2015).
- Req 2: The language has to offer support for modeling complex decisions. The choice for a certain process variation is not random but results from circumstantial information and the available knowledge. Therefore, the data perspective should be explicitly captured by the process models to offer guidance for modeling complex decisions (Borrego & Barba, 2014; Di Ciccio et al., 2015).
5 - Req 3: The language needs to allow reasoning about resources. As has been mentioned, the resource perspective has a big impact on the other three perspectives. Hence, resources need to be included to make models more realistic.
- Req 4: The language must define a clear link between the different perspectives while carefully considering the domain appropriateness. The final requirement stresses the importance of a mixed-perspective language, as opposed to the multi-perspective kind, where the multi-perspectives are treated in separation.
2.2 Imperative versus Declarative Languages
As business processes are becoming more and more knowledge-intensive, researchers in the field of BPM are thoroughly investigating declarative modeling languages as alternatives for their imperative counterparts. This is because the characteristics of declarative modeling languages are more aligned with the requirements to model KiPs.
One of the strengths of imperative modeling languages such as BPMN is their ability to include all possible process paths in a process model (Fahland et al., 2009; Goedertier et al., 2015). However, in the context of modeling KiPs, this turns out to be a serious drawback. Incorporating all possible variations of an unpredictable process will almost certainly lead to “spaghetti”-like models. Hence, traditional imperative languages do not support the required flexibility at design and run time to model KiPs effectively (Goedertier et al., 2015; Reichert & Weber, 2012). Moreover, the modeling effort to enumerate all process variations should not be underestimated.
On the other hand, declarative modeling languages describe the constraints and rules that indicate which process variations are prohibited (Goedertier et al., 2015; van der Aalst et al., 2009). Other variations that are not excluded by these constraints are allowed. In this way, the effort to model KiPs is reduced significantly compared to imperative languages. Moreover, it is easier to modify models when processes change in the case of declarative languages because constraints can simply be added, changed, or removed (Mukkamala, 2012). By way of contrast, imperative modeling languages would require the entire model to be revised. Hence, the balance between flexibility and support is managed better in the case of declarative languages (van der Aalst et al., 2009).
In between the declarative and imperative paradigm, a separate class of hybrid modeling languages exists (e.g. Goedertier et al., 2015). These languages attempt to reap benefits by combining constructs from each paradigm. However, a complete specification of this group of languages is beyond the scope of this dissertation.
6 It is worth noting that the incorporated flexibility in declarative languages often comes at the expense of understandability (van der Aalst et al., 2009), which could be seen as a proxy for the quality of process models (Mendling, Reijers, & Cardoso, 2007). This makes declarative process models harder to maintain (Fahland et al., 2009; Haisjackl et al., 2016). Therefore, a clear visual syntax that can be easily interpreted by end-users could partly mitigate the issue of understandability (Haisjackl et al., 2016; Mertens et al., 2017).
2.3 Declarative Modeling Languages
In 2008, Pesic introduced Declare as the first fully-fledged declarative modeling language. This language uses Linear Temporal Logic (LTL) as a formalism for constraint specification. LTL is a kind of logic that describes sequences of transitions between states in a reactive system (Grumberg, Clarke, & Peled, 1999). Besides the traditional logical operators, LTL also uses temporal operators which enables modelers to specify entirely new constraints (van der Aalst et al., 2009).
Declare translates the semantics of constraint templates into a concrete constraint with a graphical representation that is more intuitive. Therefore, end-users do not need to know LTL to understand Declare models. In this modeling language, three types of constraint templates are supported (Pesic, 2008):
- Existence constraints specify the number of executions or the cardinality of an activity, which could either be a lower or upper bound. For instance, existence(1, diagnosis) indicates that a doctor should make a diagnosis at least once in the treatment of a patient. - Relation constraints define how activities are related to one another. For example, response(surgery, revalidation) means that each time a doctor performs a surgery, the patient needs to go through a revalidation afterward. However, in between these two activities, other processes could take place. Note that the notion of metric time is absent in relation constraints, as the time interval between the activities is not specified. Additionally, Pesic (2008) introduces negation constraints, which are negated versions of relation constraints.
- Choice constraints indicate that a choice needs to be made between several activities. For instance, 1 of 2(X-ray scan, CT scan) means that at least one of the two scans needs to be performed at least once.
Thus seen, a Declare model is nothing more than a combination of these three types of constraint templates (van der Aalst et al., 2009). As an example, Figure 1 displays a Declare model for the medical treatment of a fracture (Pesic, 2008). This illustration demonstrates that both branched constraints and guidelines (optional constraints) are also supported, as
7 indicated by constraint c4 and the dashed line for constraint c6 respectively. Despite its popularity, Declare is still imperfect in modeling loosely framed and KiPs. Mertens et al. (2017) indicate that the original language lacks crucial elements to model KiPs effectively. As a result, researchers expanded the language in several ways to boost its expressive power.
Figure 1. Example of a Declare model for the treatment of a fracture. Reprinted from "Constraint-based workflow
management systems: Shifting control to users", by M. Pesic, 2008, p. 145. Copyright 2008 by Maja Pesic.
First of all, some extensions implement the decision logic that governs the execution of activities (i.e. the data perspective) by making the constraints data-aware (Borrego & Barba, 2014; Burattin, Maggi, & Sperduti, 2016; Jiménez-Ramírez, Barba, del Valle, & Weber, 2013; Maggi, Dumas, García-Bañuelos, & Montali, 2013; Montali, 2010; Montali, Chesani, Mello, & Maggi, 2013). In 2015, Mertens et al. adopted a different approach when they developed the semantics for a new language called Declare-R-DMN. In this work, the authors introduced the data perspective using the OMG standard Decision Model and Notation (DMN) (Object Management Group (OMG), 2015). DMN provides a common notation for decision logic that can be readily understood by all business users. The language consists of a decision requirements graph, depicting where the information is coming from, and a decision table indicating how decisions are made.
Secondly, the definition of the Declare language was broadened through the incorporation of the resource perspective, which led to the development of ConDec-R (Barba, Lanz, Weber, Reichert, & Del Valle, 2012; Jiménez-Ramírez et al., 2013; Mertens et al., 2015). This made reasoning about resources possible (e.g. to indicate who is eligible to do surgeries on a patient and how many surgeons are available).
Thirdly, the concept of metric time was added to make process models more realistic (Barba et al., 2012; Burattin et al., 2016; Jiménez-Ramírez et al., 2013; Lanz, Weber, & Reichert, 2014; Montali, 2010; Westergaard & Maggi, 2012). In many cases, constraints need to be
8 expressed in time units. This is, for example, the case when a patient should have a checkup within one month after surgery.
Finally, because many process variations are possible in the case of KiPs (Di Ciccio et al., 2015), support for branched constraints is a necessary condition to model such processes effectively. Target-Branched Declare (TBDeclare) is one example of an extended version of Declare that further elaborates on branched constraints (Di Ciccio, Maggi, & Mendling, 2016). A branched constraint means that one of its parameters is a disjunction of at least two activities (Di Ciccio et al., 2016; Montali, 2010; Pesic, 2008). For instance, an X-ray scan could be followed by either surgery or the application of a cast.
Even though these extensions add valuable features to Declare to make the language more suited to model loosely framed and KiPs, there is still no one-size-fits-all extension of the language that complies with all requirements to model such processes. The paper of Mertens et al. (2017) was only the first in the literature where an explicit metamodel for the abstract syntax of Declare was designed. Until then, only partial metamodels existed (Bernardi, Cimitile, Di Lucca, & Maggi, 2012) which led to some serious misunderstandings about the core concepts of Declare’s semantics (Mertens et al., 2017).
Hence, many of the enriched versions of Declare lack an integrated metamodel where all perspectives are combined, resulting in separate metamodels for each perspective that are poorly integrated (Mertens et al., 2017). This is why the proposed solutions are multi-perspective languages, where different multi-perspectives are treated in isolation. Conversely, modeling KiPs would be more effective using mixed-perspective declarative languages, as the four perspectives are strongly related. For this reason, Di Ciccio et al. (2016) stress the importance of integration, because combining existing extensions leads to a more comprehensive process modeling language. This is also reflected in the fourth requirement of Mertens et al. (2017) to model KiPs (cf. Section 2.1).
Another approach that was developed as an alternative to Declare is the concept of Dynamic Condition Response Graphs (DCR Graphs) (Mukkamala, 2012). Contrary to Declare, constraints in DCR Graphs are not translations of LTL constraint templates. Instead, DCR Graphs are based on event structures (Winskel, 1987) and process semantics are directly expressed as transitions between markings of the graph (Hildebrandt & Mukkamala, 2011). Moreover, DCR Graphs have significantly fewer rule templates than Declare (Pesic, 2008) and the visual syntax takes advantage of ‘color’ as a visual variable to facilitate the identification of the different relation types (Schönig & Jablonski, 2016). On the flip side, the simplicity of DCR Graphs curtails its expressive power to model complex situations (Mertens, Gailly, & Poels, 2019). However, the language can be enriched by offering support for the data perspective
9 and implementing nested sub-graphs (Mukkamala, 2012; Slaats, Mukkamala, Hildebrandt, & Marquard, 2013).
Other declarative modeling languages include the Business Process Constraint Network (BPCN) (Lu, Sadiq, & Governatori, 2009), Guard-Stage-Milestone (Hull et al., 2011), Case Management Model and Notation (CMMN) (Object Management Group, 2013), Declarative Process Intermediate Language (DPIL) which is a transformation of CMMN models (Zeising, Schönig, & Jablonski, 2014), and the recently developed Object-Centric Behavioral Constraints (OCBC), which is a combination of Declare and data modeling languages (Artale, Kovtunova, Montali, & van der Aalst, 2019; Li, de Carvalho, & van der Aalst, 2017). However, these languages still struggle to deal with all intricacies of a loosely framed and KiP. Additionally, BPCN and DCR Graphs do not tolerate guidelines, as they only support hard constraints (Mertens et al., 2017).
In 2017, Mertens et al. used multiple Declare extensions as building blocks for the metamodel of a new mixed-perspective declarative modeling language, namely DeciClare (Section 2.5). This language is the only mixed-perspective language to date that complies with all requirements to model KiPs adequately.
2.4 Importance of a Visual Syntax
As Section 2.3 suggests, plenty of research has been performed to develop the abstract syntax for declarative modeling languages that can model loosely framed and KiPs. However, the ultimate end user reads a model through visual clues that make the underlying semantics more accessible. The symbol sets used in these visual representations should by no means be seen as a random choice because they vary in perceptual discriminability, visual expressiveness, and semantic transparency (Figl, Mendling, & Strembeck, 2013; Moody, 2009). Indeed, the way the abstract syntax is visualized has a tremendous impact on the actual understandability and effectiveness of the language (Bork, Schrüffer, & Karagiannis, 2019; Caire, Genon, Heymans, & Moody, 2013; Hanser, Di Ciccio, & Mendling, 2016; Moody, 2009).
According to Moody (2009), a visual notation comprises a set of graphical symbols (visual vocabulary), compositional rules (visual grammar), and definitions of the meaning of the symbols (visual semantics). The visual vocabulary and grammar are the ingredients of the visual syntax (da Silva Teixeira et al., 2016). In process modeling, the model creator encodes a model using this syntax and assumes that the conveyed message is the same for each model user. However, whether a user reads (decodes) the process model effectively and efficiently is heavily dependent on the visual representation (Figl et al., 2013).
10 Central to the issue of understandability is the cognitive load theory (Sweller, 1994). A distinction needs to be made between intrinsic cognitive load and extraneous cognitive load. The former type refers to the complexity of the information captured in the models, whereas the latter type is influenced by the way the models are represented (Kirschner, 2002). To facilitate understandability, cognitive load for model users should be minimized (Chandler & Sweller, 1996). Yet, the high intrinsic cognitive load is inseparable from the inherent complexity of the KiPs and cannot be influenced by the model creator. On the other hand, extraneous cognitive load can be reduced through a cognitively effective notation (Figl et al., 2013). Cognitive effectiveness relates to the speed, ease, and accuracy by which humans can interpret visual notations (Larkin & Simon, 1987).
Currently, the development of a visual syntax is still regarded as unimportant by a lot of researchers. In Table 1, an overview of the most important papers in the field of declarative modeling languages from Section 2.3 is sketched. Furthermore, the table describes whether or not the authors included an abstract and/or visual syntax in their work. A ‘+’ means that the syntax is covered, whereas a ‘-‘ indicates that the syntax is absent. When the syntax is only available to a certain extent, ‘+/-‘ is shown.
It is clear that most researchers spend more time and effort on the development of a correct abstract syntax. Whereas some declarative languages such as Declare and DCR Graphs have a generally accepted visual syntax (Mukkamala, 2012; Pesic, 2008), the proposed representations are still far from perfect. For instance, Haisjackl et al. (2016) report that the visual syntax of Declare has some major design flaws. Users have trouble recognizing a combination of constraints and tend to read the model sequentially, just like imperative languages. Furthermore, the graphical notation tends to be difficult to understand, especially when diagrams increase in size and complexity (Hanser et al., 2016).
To make a long story short, this section proves that an effective abstract syntax is not enough for a declarative process modeling language to be put into practice. The semantics should be accompanied by an equally important visual syntax that is clear to the end-user of the language. Unfortunately, most papers in this field undervalued the issue of visual representation. If they do include a visual syntax in their work, the choices for certain symbols are rarely motivated or simply based on common sense, which makes the graphical representations highly unreliable (Moody, 2009). Researchers that attempt to develop an effective visual syntax need to adopt a cognitive approach, instead of the semantic mindset that is required for abstract syntaxes (Mertens et al., 2017). This dissertation attempts to develop an effective visual syntax for DeciClare and thus complements the work of Mertens et
11 al. (2017). Additionally, we apply some minor adaptations to the abstract syntax to make the visualization more straightforward (Section 4).
Paper Language Abstract syntax presented? Visual syntax presented? Pesic (2008) Declare + +
van der Aalst et al. (2009) Declare + +
Montali et al. (2013) Declare (data-aware) + +/-
Maggi et al. (2013) Declare (data-aware) + +/-
Borrego & Barba (2014) Declare (data-aware) + +/-
Mertens et al. (2015) Declare-R-DMN +/- +/-
Burattin et al. (2016) MP-Declare +/- -
Montali (2010) Declare (+ extensions) + +
Barba et al. (2012) TConDec-R + +
Westergaard & Maggi (2012) Timed Declare + +/-
Jiménez-Ramírez et al. (2013) ConDec-R + +
Di Ciccio et al. (2016) TBDeclare + -
Mukkamala (2012) DCR Graphs + +
Slaats et al. (2013) DCR Graphs (data-aware) + +
Lu et al. (2009) BPCN + +
Hull et al. (2011) Guard-Stage-Milestone + +/-
Object Management Group
(2013) CMMN + +
Zeising et al. (2014) DPIL +/- +/-
Li et al. (2017) OCBC +/- +/-
Artale et al. (2019) OCBC + +
Mertens et al. (2017) DeciClare + -
This dissertation DeciClare +/- +
12
2.5 DeciClare Explained
In this section, a brief explanation is provided of the work of Mertens et al. (2017), who developed the abstract syntax for the declarative modeling language DeciClare, following the Design Science methodology (Hevner, March, Park, & Ram, 2004; Peffers, Tuunanen, Rothenberger, & Chatterjee, 2007).
The goal of this paper was to develop a mixed-perspective declarative language that takes into account the functional, control-flow, resource, and data perspectives in an integrated manner. In this work, the four perspectives and requirements to model KiPs were the starting point in the development of an abstract syntax, rather than a means of evaluation. With this in mind, the process of modeling loosely framed and KiPs, where all 4 perspectives are prominent, is facilitated.
In the study of Mertens et al. (2017), compliance of current modeling languages with the requirements is checked utilizing a realistic arm fracture case, which symbolizes a loosely framed and KiP. The requirements are operationalized into rule patterns by which the language must abide (e.g. guidelines, lag between activities, durations…). These patterns are based on a literature review (Caron, Vanthienen, & Baesens, 2013; Lanz et al., 2014) and a study of healthcare processes. From this specific example, it is clear that the performance of Declare on these requirements and rule patterns leaves a lot to be desired.
Nonetheless, as explained in Section 2.3, multiple enriched versions of Declare in the literature attempt to mitigate the shortcomings of the original language. These extensions, together with DMN (Object Management Group (OMG), 2015), influenced Mertens et al. (2017) in the development of DeciClare. However, some rule patterns were not supported by any existing extension and needed to be developed by the authors themselves.
Eventually, 36 constraint templates are proposed that make it possible to model all ins and outs of a loosely framed and KiP (Mertens et al., 2019). Additionally, most of these templates are made time-aware and can be branched. Note that, in contrast to TBDeclare (Di Ciccio et al., 2016), DeciClare also allows conjunctive branching next to disjunctions. In Section 4, DeciClare’s constraint templates are explained rigorously.
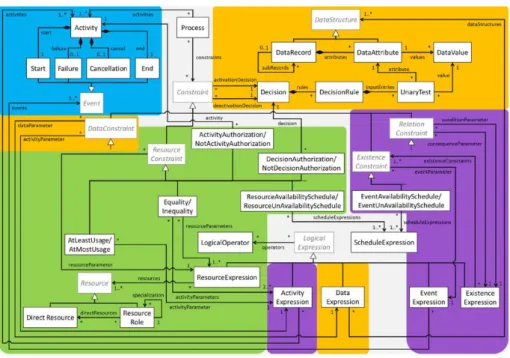
Finally, the authors propose a complete metamodel for the abstract syntax of DeciClare, which is a combination of the separate metamodels for each perspective (Figure 2). The functional, control-flow, resource, and data perspective metamodels are indicated by the colors blue, purple, green, and orange respectively. Unlike other works, the linkages between the perspectives are explicitly modeled.
13 Figure 2. Metamodel of DeciClare. Reprinted from “Towards a decision-aware declarative process modeling language for knowledge-intensive processes”, by S. Mertens, F.Gailly, & G.Poels, 2017, Expert Systems With
Applications, p. 328. Copyright 2017 by Elsevier Ltd.
According to the Conceptual Modeling Quality Framework (CMQF) of Nelson, Poels, Genero, & Piattini (2012), DeciClare performs reasonably well on all three quality types (semantic quality, pragmatic quality, and language-domain appropriateness). Therefore, the expressiveness of the semantics suffices to model the decision logic that is so deep-rooted in KiPs.
However, currently, only a textual representation of the abstract syntax is available, making it difficult for model users to grasp the meaning of certain constraints. Hence, a cognitively effective graphical notation of the semantic constructs would significantly improve communication and problem solving with DeciClare (Moody, 2009).
In this thesis, the design of the visual representation is executed through the Physics of Notation – Systematized methodology (PoN-S) (da Silva Teixeira, 2017). In the following section of this work, this approach is explained rigorously. Another framework that we considered to employ for the design of DeciClare’s visual syntax is elaborated in Hanser et al. (2016). However, the application of the latter methodology is limited to Declare’s constraint templates. Additionally, the authors do not define a process that aids in the design of a concrete syntax. This is why we preferred the more high-level and generally applicable PoN-S framework.
14
3.
Proposed framework for visual syntax: PoN-S
Contrary to abstract syntaxes, visual notations for declarative process modeling languages are currently designed without explicit design rationale. Terms such as “gut feeling” and “best practices” are still the motivation for the choice of certain symbols. This makes it difficult to compare, evaluate, and improve different representations (Moody, 2009).
In 2009, Moody proposed a framework in his work “The Physics of Notations” (PoN) that consists of 9 principles a notation should comply with, based on theoretical and empirical evidence. The usefulness of this widespread framework has been recognized by several other authors in the field of software engineering (e.g. da Silva Teixeira et al., 2016; Figl et al., 2013). In the following paragraphs, each principle will be briefly explained.
Semiotic Clarity. There must be a one-to-one correspondence between symbols and the semantic constructs they represent. If this requirement is violated, then at least one of the following anomalies are present:
- Symbol deficit: a construct is not represented by any graphical symbol. However, in some cases, the absence of a symbol for a certain semantic construct is a deliberate choice to decrease complexity.
- Symbol excess: a symbol does not refer to any construct (e.g. comments). - Symbol redundancy: a construct can be visualized by multiple symbols. - Symbol overload: a symbol represents multiple constructs.
Perceptual Discriminability. This principle relates to how easy it is for users to distinguish between various graphical symbols. The visual distance between symbols can be increased by applying different values for visual variables such as shape and color. Conversely, using text as the sole basis for discrimination between symbol types is cognitively ineffective, because this could be mixed up by users with the labels of the symbol instances. If the differences between symbols are too subtle, misinterpretations will occur, which impedes the accurate interpretation of models (Winn, 1990).
Semantic Transparency. The appearance of a visual representation should say something about its meaning. Icons, for example, are rarely used in process modeling notations. Instead, the lion’s share of modeling languages relies exclusively on abstract geometrical shapes whose definitions need to be learned. Yet, the direct link between the icons and their meaning could aid novices to recognize and recall a model, thus benefiting to the Semantic Transparency (Masri, Parker, & Gemino, 2008; Mendling, Recker, & Reijers, 2010).
15 Semantically transparent representations enable computational offloading, which means that cognitive tasks (understanding) are replaced by perceptual ones (seeing). Because cognitive processing is rather slow and resource-intensive, minimizing the number of cognitive tasks enhances the effectiveness of visual notations (Bork et al., 2019; Moody, 2009).
Complexity Management. The information displayed through the visual notation should not overburden the human mind. If too many elements are shown at the same time, cognitive overload takes place, which hampers comprehension (Miller, 1956). Therefore, explicit mechanisms should be incorporated in the notation to deal with complex diagrams. For instance, modularization and hierarchy are popular simplification techniques that alleviate model complexity and size.
Cognitive Integration. When multiple diagrams are used to describe a system, understanding the displayed information is even more complicated (Siau, 2004). Such representations are only cognitively effective if conceptual and perceptual integration mechanisms are supported: - Conceptual integration: help the model reader to bring together information from different diagrams. For example, a summary diagram provides an overview of the entire system.
- Perceptual integration: provide cues that facilitate navigation between different diagrams (e.g. via a navigational map, precise labeling of diagrams…).
Visual Expressiveness. This concept refers to the number of visual variables that are used to encode information (information-carrying variables). Currently, most modeling languages only use a limited range of values of one visual variable (i.e. shape) to represent different semantic constructs. However, exploiting the full range of multiple variables (e.g. color, size, brightness, orientation…) benefits to the understandability of a notation. This is done well in DCR Graphs, where the various relations are represented by different shapes and colors (Mukkamala, 2012). Once again, it turns out that textual encoding is cognitively ineffective compared to graphical encoding. A critical note concerning this principle is the mixed evidence in research about the optimal complexity of a notation. Some argue that symbols should be kept simple, while others recommend using more complex representations (Figl et al., 2013; Mcdougall, Curry, & de Bruijn, 1999).
16 Dual Coding. Even though the Perceptual Discriminability and Visual Expressiveness principles advocate against the use of text to represent information, it can still contribute to the design of effective visual notations. The Dual Coding theory states that the semantic expressiveness of text can reinforce the visual expressiveness of graphics (Paivio, 1991). For instance, annotations on the diagram can explain the meaning of a graphical symbol.
Graphic Economy. The number of graphical symbols included in a language should not be excessively high because the human mind has boundaries on the number of symbols that can be distinguished (von Klopp Lemon & von Klopp Lemon, 2000). Therefore, the expressiveness of notations and the size of the visual vocabulary should be balanced (Figl et al., 2013). Several techniques can benefit to the graphic economy of a language:
- Narrow down the number of semantic constructs. - Introduce symbol deficits.
- Increase visual expressiveness.
Cognitive Fit. Most notations have a single visual representation for every user or each task. However, the Cognitive Fit theory declares that there should be a fit between the problem representation, task characteristics, and problem-solving skills of a user. For instance, notational requirements differ if a whiteboard is used as a representational medium compared to a drawing tool that can deal with more complexity. The introduction of multiple ways of representation adapted to a specific task and/or audience (i.e. visual dialects) benefits to this fit.
Note that it is not possible to optimize every principle due to interaction effects. For instance, the introduction of symbol deficit benefits to the Graphic Economy but negatively impacts Semiotic Clarity. Besides these trade-offs, synergies between principles can also take place. An increase in the Visual Expressiveness of symbols goes hand in hand with a higher Perceptual Discriminability (Moody, 2009).
Another limitation of this framework is the sole focus on the perspective of the decoder of information (Moody, 2009). Cognitive effectiveness for the model user is seen as the only design goal for visual representations. However, encoding-side goals can also play a role in the design process. For example, the effort to produce a model using the visual syntax should not be exorbitant for model creators.
17 The biggest drawback of PoN is that it only describes 9 principles that languages should follow to be cognitively effective. Even though some researchers have applied the principles to analyze or design visual notations, the initial PoN paper did not prescribe any standardized methods or processes on how to apply or operationalize these principles (Caire et al., 2013; Genon, Amyot, & Heymans, 2011; Störrle & Fish, 2013; van der Linden & Hadar, 2019; van der Linden, Zamansky, & Hadar, 2016).
For this reason, da Silva Teixeira et al. (2016) proposed a systematic approach for applying the Physics of Notation, namely PoN-S (PoN-Systematized). This design methodology can serve as a compass in the journey towards a cognitively effective visual notation. In 2017, da Silva Teixeira improved the initial version and finalized the PoN-S methodology as part of a doctoral dissertation.
In the PoN-S methodology, PoN principles that have a big influence on each other are grouped. For instance, Complexity Management and Cognitive Integration belong together since these are both useful mechanisms when diagrams become larger and more complex. Likewise, Semiotic Clarity, Semantic Transparency, and Perceptual Discriminability are complementary principles and thus seen as a collection. Figure 3 provides an overview of the 4 identified groups of principles. Note that principles across different groups still interact with one another. However, the level of interaction of principles within a group is higher (da Silva Teixeira, 2017).
Figure 3. PoN-S groups of PoN principles. •Semiotic Clarity •Semantic Transparency •Perceptual Discriminability
Group 1 - Basic
principles
•Complexity Management •Cognitive IntegrationGroup 2 - Information
complexity
management principles
•Visual Expressiveness •Graphic Economy •Dual CodingGroup 3 - Supporting
principles
•Cognitive FitGroup 4 - Dialect set
principle
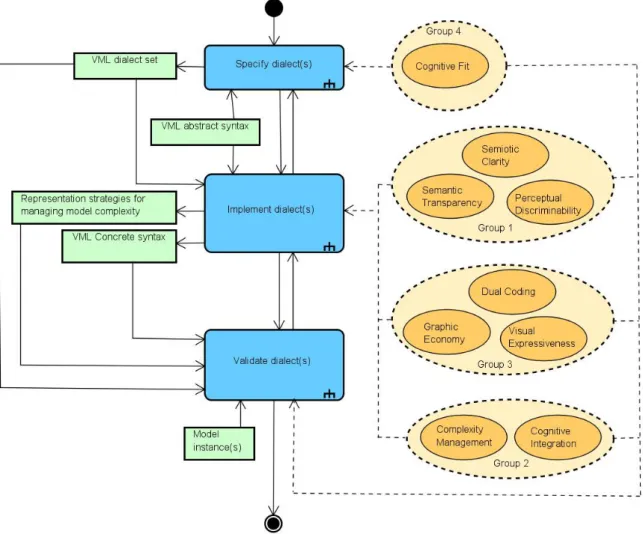
18 The design process of PoN-S is structured according to three main steps. First of all, a decision needs to be made whether multiple visual dialects are required. Then, for each of these dialects, the symbol set is defined, together with ways to manage model complexity. Finally, the dialect(s) needs to be evaluated by the language designer and potential language users. The entire design process is visualized in Figure 4 utilizing an extended version of the UML activity diagrams notation (da Silva Teixeira, 2017). Depending on the phase in the design process, some groups of principles are more prominent than others. A full explanation of the activities Specify dialect(s), Implement dialect(s), and Validate dialect(s) can be found in ‘Appendix 1. PoN-S explained’ (da Silva Teixeira, 2017).
The main inputs of PoN-S are the abstract syntax of the modeling language, together with model instances used for dialect validation. After the execution of the methodology, the language dialect set, concrete syntax, and representation strategies to deal with complexity are the outputs.
Figure 4. PoN-S methodology. Reprinted from “An Ontology-Based Process for Domain-Specific Visual Language
19 In the next section of this thesis, the PoN-S methodology is applied to create a visual syntax for the semantics of DeciClare. As mentioned in Section 2.3, some other declarative languages such as the Declare extensions have similar constraint templates. For these templates, the graphical representations of other languages will be benchmarked against the principles of Moody (2009). According to their compliance with the principles, we investigate whether the existing representations can serve as a source of inspiration for the visual syntax of DeciClare. For instance, in Hanser et al. (2016), the original representation of Declare (Pesic, 2008) is adapted to be more aligned with the PoN principles and can thus partly be re-used. However, some constraint templates of DeciClare are absent in any other language. For these templates, we need to propose a representation ourselves.
20
4.
PoN-S applied for DeciClare
In this section, we go through the stages of the PoN-S methodology to design an appropriate visual syntax for DeciClare (da Silva Teixeira, 2017). As mentioned in the previous section and ‘Appendix 1. PoN-S explained’, the first step should be the definition of the dialect set (Section 4.1). In Section 4.2, each dialect in the set will be implemented, taking into account the appropriate PoN principles (Moody, 2009). Finally, potential problems with the visual syntax of the dialect(s) come to the surface in the validation phase (Section 4.3).
4.1 Specify dialects
We start the design process by specifying the dialect set. In the following paragraphs, the requirements for DeciClare’s visual syntax are elaborated.
Problem domain characteristics. In theory, declarative modeling languages such as DeciClare can be used to model a variety of processes. However, those types of languages were particularly created to deal with flexible and knowledge-intensive processes (Di Ciccio et al., 2015). Hence, the dialect(s) should be able to deal with the intricacies of such processes. It is worth noting that KiPs can be found in a multitude of contexts. According to Rebuge & Ferreira (2012), medical treatment processes are highly dynamic and complex and therefore a proper illustration of a KiP. However, plenty of other domains such as criminal investigations, human resource management, and research and implementation projects can serve as use cases for KiPs (Di Ciccio et al., 2015). For this reason, the visual notation for DeciClare should be dependent on the requirements for KiPs but independent of the specific sector.
Modeling task. Even though the language could be used for sketching on paper or whiteboards, we decide to give priority to the requirements of graphics software as process mining techniques are compatible with such drawing tools. These mining techniques can automatically generate enriched and cognitively effective diagrams.
Stakeholder profile. In KiPs, two main groups of stakeholders can be identified that differ in interests and/or problem-solving skills:
1. Experts: this group needs to know all ins and outs of the process. For instance, surgeons in medical treatments need to know in which operating room brain surgery is performed. The incorporation of the data and resource perspectives in the visual syntax is crucial to make processes more transparent and thus facilitates communication among all stakeholders. Additionally, modeling the as-is situation of the processes offers guidance to standardize and optimize the provided service (Mertens et al., 2017).
21 2. Novices: a characteristic of this group is their lack of knowledge of all process details.
Novices can be further refined into two subgroups:
- Trainees: eventually, this group of beginners needs to attain the same level of proficiency as experts. Hence, trainees should employ the same visual dialect as their more experienced counterparts to encourage knowledge transfers between both groups. An effective visual dialect could significantly shorten and improve training programs (Mertens et al., 2017).
- Customers: the recipients of the service in KiPs also benefit from a visual representation of the process. Customers gain insight into their (future) service if the ‘customer journey’ is displayed via DeciClare. However, not every semantic construct is relevant to them. For instance, a patient does not need to know how many patients can be handled simultaneously in a recovery room. Therefore, a less complex visual dialect will be constructed for these stakeholders.
Consequently, the Cognitive Fit principle recommends using two dialects of DeciClare’s visual syntax (Moody, 2009):
1. A complete dialect without symbol deficits will be designed for experts and trainees. In a sense, this group can be referred to as service providers. As mentioned in Section 3, a trade-off exists between Semiotic Clarity and Graphic Economy. For the complete dialect, priority should be given to the Semiotic Clarity principle because all perspectives (functional, control-flow, resource, and data) need to be included in the notation to make or motivate decisions. Hence, this dialect will be used to facilitate communication between experts, motivate decisions at run time of the process, and encourage knowledge transfers to trainees (Mertens et al., 2017).
2. Alternatively, a simplified dialect is devoted to customers. In this case, the Graphic Economy principle is more important, because customers do not need to know all the details of the semantics. For this reason, symbol deficits will be introduced as a deliberate choice to lower complexity. This inevitably comes at the expense of the Semiotic Clarity principle. The simplified dialect will be used to offer process customers a general overview of the provided service.
22 The design goal for the development of DeciClare’s notation is optimal cognitive effectiveness to improve understandability and maintainability (Moody, 2009). For both dialects, it should be possible to print the diagrams in grayscale without weakening too much the understandability of the language. Therefore, ‘color’ will never be the only visual variable to discriminate between symbols. Instead, colored representations are a form of redundant coding that further enhance distinguishability when diagrams are displayed in color (Moody, 2009). In Table 2, the characteristics of both dialects are summarized.
Dialect Complete dialect Simplified dialect
Target group Service providers (experts +
trainees) Customers
Dialect application
• Enable
communication about the provided service among experts • Motivate decisions at
run time of the process • Encourage
knowledge transfers from experts to trainees
Provide an overview of the offered service
Dialect goal Optimal cognitive effectiveness
Optimal cognitive effectiveness
Dialect directives Completeness (Semiotic Clarity)
Understandability (Graphic Economy)
23
4.2 Implement dialects
Now that the dialect set, goals, and directives are known, the next step concerns the implementation of both dialects. In the first iteration of the dialect implementation phase, we go through the four perspectives that DeciClare incorporates in the metamodel (Section 4.2.1.1, 4.2.1.2, and 4.2.1.3) and define a symbol for each constraint template and other related semantics (Mertens et al., 2017). At the same time, support principles are applied to make the symbols more cognitively effective1. Then, the notion of optional constraints is treated in Section 4.2.1.4. This results in a concrete syntax for the complete visual dialect. Finally, in Section 4.2.1.5, the simplified dialect is created in the second iteration.
4.2.1
Definition of the dialect symbol set and application of support principles
4.2.1.1 Functional/control-flow perspective
The functional and control-flow perspectives impose boundaries on the occurrence and arrangement of activities in the process. With this intention, Mertens et al. (2017) developed existence and relation constraint templates for DeciClare, while keeping in mind the flexibility by design principle (Schonenberg et al., 2008). These constraints can have a numerical bound (parameter ‘n’), are time-aware (indicated by the time interval parameters ‘a’ and ‘b’), and allow for branching. However, not every constraint supports branching in the same manner. An ‘X’ means that exclusive disjunctions are supported (XOR operator), while ‘I’ relates to inclusive disjunctions (OR operator). In a like manner, ‘C’ refers to logical conjunctions (AND operator). Finally, ‘B’ means that both inclusive disjunctions and logical conjunctions can be modeled with this constraint template. Since activities and events are central to the functional and control-flow templates, we start this section by visualizing these two model elements.
1Note that this approach slightly differs from the work of da Silva Teixeira (2017). We immediately apply support principles once
a semantic concept is visualized by a symbol, whereas the authors of PoN-S first define the entire symbol set and use support principles afterward. However, we advocate for the former approach because principles such as Perceptual Discriminability (definition of the dialect symbol set) are heavily influenced by support principles such as Visual Expressiveness (e.g. color) and Dual Coding (e.g. comments). Therefore, one cannot optimize Perceptual Discriminability without taking into account support principles in the first place.
24
Activities and events
Unlike Declare (Pesic, 2008) and several other modeling languages, we opt for circular elements to represent activities instead of rectangles. Even though such a shape is semantically opaque (Moody, 2009) since the meaning cannot be directly inferred from its appearance, circles can still be easily recalled. Activities as circles benefit the readability and understandability because they can be arranged on a diagram in a more space-saving way (Hanser et al., 2016). We decided to picture activities in a light blue, neutral color. Later in this section, these symbols will be incorporated in the visualization of constraint templates related to the functional and control-flow perspectives.
It should be noted that the formal semantics of DeciClare can also be applied at the granularity level of events that are connected to those activities (Mertens et al., 2017). For instance, it is also possible to constitute a constraint stating that the start of activity A should be followed by the start of activity B within 10 minutes.
Next to the straightforward start and end events, DeciClare also supports cancellation and failure events indicating that an activity has been canceled (e.g., when a patient chooses not to undergo surgery at the last moment) or has failed (e.g., because a patient has an allergic reaction using a certain type of drugs). Failure events can be applied to denote exception handling constraints, pinpointing an alternative ending of activities. In general, the four events make it possible to tailor constraints to very specific situations. For this reason, a visual representation for these events is vital for the completeness of a visual dialect (Semiotic Clarity).
The Semantic Transparency principle gives guidance to come up with intuitive icons that illustrate these events (Table 3). In Time-BPMN, the symbols denoting the start and end of activities are attached to the activity on the diagrams (Gagne & Trudel, 2009). Using an analogous approach for DeciClare, the icons need to be connected to our proposed circular activities.
Furthermore, to make the distinction between the different types of events more obvious, we borrowed some aspects of the port visualization of data-aware Declare (Montali, 2010; Montali et al., 2013). The authors suggest that constraints can be anchored to ports instead of activities when they are more fine-grained. Moreover, based on the event’s meaning, the ports are located at different positions relative to the activity. Because people tend to read diagrams from left to right (Haisjackl et al., 2016), “position” is an important visual variable that can benefit the Visual Expressiveness and hint the symbol’s meaning (Moody, 2009).
25 In DeciClare, the icon for the start event is located on the left-hand side of the activity. This can remind users that the symbol concerns a start event. On the opposite, when an activity has ended, the icon will be located on the right of the activity. The other two events, cancellation and failure, are put underneath the circular element since they interrupt a running activity.
Event Start End Cancellation Failure
Icon Position (relative to circular activity)
Left Right Bottom Bottom
Table 3. Representation of events.
When constraints do not concern a specific event but rather the activity in general, the event symbols are left out to reduce the complexity of a diagram (Graphic Economy and Complexity Management). Therefore, in the following sections, the reader may assume that constraints cover activities whenever the icons in Table 3 are not shown in the visualizations of the templates.
AtLeast(B, n, a, b), AtMost(B, n, a, b), Exactly(B, n, a, b), Init(A), and Last(A)
The first existence templates that need to be visualized highlight the minimum (AtLeast) and maximum (AtMost) number of occurrences of activities in the process. These definitions suggest that a circular activity should be the core of the representation. In case the AtLeast and AtMost templates comprise more than one activity, the activities are surrounded by a grey rectangle. This is a form of spatial enclosure, that shows relationships between activities in a more semantically transparent way than if arrows were used (Moody, 2009). A rectangular representation for branching is preferred over a circular one to save space on the diagrams. Depending on the type of branching, specific textual cues supplement the visual notation. For inclusive disjunctions, “OR” is added between the activities. Likewise, “AND” complements the logical conjunction of activities. These textual annotations are applications of the Dual Coding principle as a support mechanism to reinforce the meaning of the symbol. However, according to the Perceptual Discriminability principle, textual cues should never be the sole basis to distinguish between symbols (Moody, 2009). For this reason, an ampersand symbol (‘&’) is also included for logical conjunctions and a pipe symbol (‘|’) for inclusive disjunctions.
26 The original AtLeast template of DeciClare does not support conjunctions, because requiring a pair of activities to occur at least a number of times can be modeled using two separate AtLeast constraints for each activity with that same bound. However, suppose that the conjunction concerns ten activities, then such a constraint template would be very useful to make the diagrams less cumbersome. Consequently, contrary to the metamodel of DeciClare, we choose to define a symbol for conjunctions of the AtLeast template. Even though this is a form of syntactic sugar or construct redundancy (Mertens et al., 2017), we believe that the benefit of simplification outweighs this disadvantage.
In the same vein, Init and Last templates are added to indicate that an activity should be the first or last activity in the process. Again, this is a form of construct redundancy, because this requirement can also be enforced through a series of Precedence constraints2 (Mertens et al., 2017). Though, these two additional templates allow for a tighter representation. To make such existence constraints distinguishable from the other ones, the circles are displayed in green and red for the Init and Last templates respectively (Visual Expressiveness). These particular colors are picked for their resemblance with a traffic light, i.e. green and red for the start and end of the process. When the diagrams are presented in color, these constraint templates will “pop-out” for users (Moody, 2009). Additionally, the words “Init” and “Last” are added to make the constraints also intuitive and perceptually discriminable when diagrams are displayed in grayscale (Dual Coding).
The numerical bound ‘n’ of an existence template is located on top of the circle (or rectangle if the constraint is branched) and is preceded by an inequality sign to improve understandability (‘≥’ for AtLeast and ‘≤’ for AtMost). The third form of syntactic sugar is the addition of an Exactly template. This constraint comes in useful when an activity or a combination of activities should occur exactly n times in the process. Normally, two constraints would be necessary to model this situation (one AtLeast and one AtMost constraint), but now a single Exactly constraint suffices. For such a constraint, the numerical bound n is accompanied by an equality (‘=’) sign. Similar to the Init and Last constraints, the names of the other constraint templates are placed on top of the circular or rectangular elements for simplification purposes.
The last parameters that should be added at the bottom of the symbols are the time parameters ‘a’ and ‘b’. The TConDec-R specification of Barba et al. (2012) is an excellent example of how icons can improve the semantic transparency of a symbol. In this language, the time parameters are accompanied by a clock icon, which makes their meaning clear at first sight. Therefore, we decide to implement a similar solution.
27 Table 4 summarizes the previous paragraphs and illustrates the proposed symbols for several specifications of the constraint templates. As an illustration, the activities are labeled as ‘A’ and ‘B’.