RIVM reportno. 259101011/2002
Preliminary modelling and mapping of critical
loads for cadmium and lead in Europe
J.-P. Hettelingh, J. Slootweg, M. Posch (eds.)
S. Dutchak, I. Ilyin (EMEP/MSC-E)
ICP M&M Coordination Center for Effects
EMEP – Meteorological Synthesizing Centre - East
wge
wge
of theof the Working Group on EffectsWorking Group on Effects
Convention on Long-range Transboundary Air Pollution
This investigation has been performed by order and for the account of the Directorate for Climate Change and Industry of the Dutch Ministry of Housing, Spatial Planning and the Environment within the framework of RIVM-project M259101, “UNECE-LRTAP”; and for the account of the Working Group on Effects within the trustfund for the partial funding of effect oriented activities under the Convention.
Table of Contents
Acknowledgements 5
Preface 6
Summary 8
Samenvatting (Summary in Dutch) 9
PART I Modelling and Mapping of Critical Loads for Cadmium and Lead 10
1. Preliminary Modelling and Mapping of Critical Loads for
Cadmium and Lead and their Exceedances – Executive Summary 11
1.1 Introduction 11
1.2 Preliminary critical load results 12
1.3 Preliminary exceedance computation results 14
1.4 Recommendations 16
References 16
2. Guidance for the Calculation of Critical Loads for Cadmium and Lead
in Terrestrial and Aquatic Ecosystems 17
2.1 Background and aim 17
2.2 Terrestrial ecosystems 19
2.3 Aquatic ecosystems 28
2.4 Summary of the present approach 32
2.5 Limitations in the present approach and possible future refinements 33
References 33
Appendix 1: Relations between cadmium and lead contents in soils extractable
by aqua regia and total contents determined by HF extraction or x-ray fluorescence analysis 35
3. Summary of National Data 37
3.1 Introduction 37
3.2 Requested critical loads and auxiliary parameters 37
3.3 Data submissions from the participating countries 38
3.4 Results 40
3.5 Concluding remarks 49
4. Modelling Deposition Fields of Lead and Cadmium for Critical Load Exceedance Estimates 51
4.1 Emission data 51
4.2 Brief description of the transport model 52
4.3 Modification of dry deposition scheme for the effect-oriented tasks 54 4.4 Fields of lead and cadmium depositions for 1990, 2000 and 2010 59
4.5 Future activities 63
References 63
PART II National Focal Centre Reports 65
AUSTRIA 66 BELARUS 67 BELGIUM 68 BULGARIA 69 CZECH REPUBLIC 76 FINLAND 81
FRANCE 82 GERMANY 86 ITALY 92 NETHERLANDS 96 NORWAY 104 RUSSIAN FEDERATION 105 SLOVAKIA 108 SWEDEN 109 SWITZERLAND 110 UKRAINE 112 UNITED KINGDOM 113
Annex 1: Background Information on the Derivation of Critical Limits for Lead and Cadmium 119
Acknowledgements
The methods and resulting maps contained in this report are the product of collaboration within the Effects Programme of the UNECE Convention on Long-range Transboundary Air Pollution, involving many institutions and individuals throughout Europe. National Focal Centres, whose reports regarding modelling and mapping activities appear in Part II are gratefully acknowledged for their contribution.
• In addition the Coordination Center for Effects at the RIVM Department for Environmental Assessments thanks the following:
• The Directorate for Climate Change and Industry of the Dutch Ministry of Housing, Spatial Planning and the Environment for its continued support,
• The EMEP Steering Body for its collaboration,
• The UNECE Working Group on Effects, the Task Force of the International Co-operative Programme on the Modelling and Mapping of Critical Levels and Loads and Air Pollution Effects, Risks and Trends and its Expert Groups on Transfer Functions and Critical Limits for their collaboration and assistance,
• The UN/ECE secretariat for its valuable support, including the preparation of official documentations, and in particular Mr. R. Chrast for his important assistance to our work, • The RIVM graphics department for its assistance in producing this report.
Preface
The Working Group on Effects (WGE) of the United Nations Convention on Long-range
Transboundary Air Pollution (UNECE-CLRTAP), at its 20th session, “noted the need to further
develop and test the methodology for mapping critical loads for heavy metals (Pb, Cd) and, to this end, invited the International Co-operative Programme on the Modelling and Mapping of Critical Levels and Loads and Air Pollution Effects, Risks and Trends ICP Mapping (ICP-M&M) and the Coordination Center for Effects (CCE) to issue, by the end of 2001, a call for relevant data to be provided by the NFCs on a voluntary basis” (EB.AIR/WG.1/2001/2 para. 37f).
In response to this invitation the CCE issued a call for data on critical loads for lead and cadmium on 18 December 2001 requesting its twenty four National Focal Centres (NFCs) to respond not later than 11 March 2002.
This report summarises the results of this call to which 17 parties responded. Maps of critical loads for lead and cadmium presented in this report are tentative and preliminary.
The report is produced in collaboration with EMEP/MSC-E to enable the preliminary comparison of critical load maps to maps of lead and cadmium deposition in 2000 and 2010.
An executive summary including critical load and exceedance maps is provided in chapter 1. Maps of critical loads are a first illustration of the application of available data and methods. Eleven NFCs sent data while six NFCs indicated not to be able to respond to the call at this point in time. Detailed NFC reports are provided in Part II.
The International Co-operative Programme on the Modelling and Mapping of Critical Levels and Loads and Air Pollution Effects, Risks and Trends agreed that the results should only be used for testing the currently available methodology and data.
The results have been presented at the 12thCCE workshop (15-17 April 2002) and the 18th Task
Force on Modelling and Mapping (18-19 April 2002) in Sorrento (Italy).
The work performed by NFCs used results from preparatory work conducted under the Convention since 1995. In 1998, two manuals were published, presenting guidelines for calculation methods, critical limits and input data for the calculation of critical loads of heavy metals for terrestrial and aquatic ecosystems. The development of those manuals started in 1994 and several drafts were discussed at CCE workshops in 1995, 1996 and 1997. Together with other background documents they were also discussed at the “International Workshop on Critical Limits and Effect-based Approaches for Heavy Metals and POPs” in November 1997 in Bad Harzburg, Germany. In those two manuals various possibilities are described to calculate critical loads for heavy metals in view of the use of:
• Simple or (more) complex models, based on a mass balance approach for metals • Different types of critical limits
• Different types of transfer functions between metals in the soil solid phase and soil solution Since the publication of the manuals a “Workshop on Effects-based Approaches for Heavy Metals” was held in Schwerin, Germany, 12–15 October 1999, focusing on the use of methods and transfer functions and on critical limits to calculate critical loads. Furthermore, an “Ad-hoc International Expert Group Meeting on Effect-based Critical Limits for Heavy Metals” was held 11–13 October
2000 in Bratislava, Slovak Republic focussing specifically on the derivation of critical limits for heavy metals. This work is not yet finalised and is continued into 2003 by two expert groups, i.e. on transfer functions and critical limits.
Results of this historic work were boiled down to a “guidance” document summarising the state the methodology and the required data. This guidance document was provided to each of the NFCs and also made available through the CCE website www.rivm.nl/cce. This guidance document is included in this report as chapter 2.
Chapter 3 provides a detailed overview of the national submissions regarding ecosystems, and background data including a tentative inter-country comparison of data statistics.
Chapter 4 describes the methodology and data involved in the modelling of atmospheric dispersion of lead and cadmium, which have been used in this study to compute critical load exceedances. The report is finalised with two Annexes. Annex 1 provides an update of the guidance document
(chapter 2) which have evolved since results of the call were presented at the 12thCCE workshop
and 18thTask Force on Modelling and Mapping meeting in Italy (Sorrento, 15-19 April 2002).
Annex 2 consists of the effect-based critical load maps for cadmium and lead using a uniform background database, as an update of what has been presented in the CCE Status Report 2001.
Summary
At its 20th session the Working Group on Effects (WGE) of the Convention on Long-range
Transboundary Air Pollution of the United Nations Economic Commission for Europe (UNECE-CLRTAP), noted the need to further develop and test the methodology for mapping critical loads for cadmium and lead. To this end, the WGE invited the International Cooperative Programme on Modelling and Mapping (ICP M&M) and its Coordination Center for Effects at the RIVM (RIVM-CCE) to issue, by the end of 2001, a call for relevant data to be provided by its network of National Focal Centers (NFCs) on a voluntary basis.
This report describes the results of this call for data. NFCs were requested to apply (1) an
effect-based methodology, identifying atmospheric deposition (critical loads) that will not lead to
concentrations of heavy metals above critical limits for microbiota, plants and invertabrates and/or (2) a stand-still approach identifying atmospheric deposition (stand-still loads) that will not lead to any further accumulation of heavy metals in the soil. Seventeen NFCs responded of which eleven provided data.
The report, includes
• the methodological guidance provided to the NFCs at the time of the call.
• preliminary European maps of both critical and stand-still loads loads based on the response from Bulgaria, Belarus, The Czech Republic, Germany, Italy, The Netherlands, Russia, Slovakia, Switzerland, Ukrain, and the United Kingdom.
• preliminary exceedance maps produced in collaboration with the EMEP-Meteorological Synthesizing Centre East under the UNECE-CLRTAP.
The results of the call for data described in this report have been presented and discussed at the 12th
CCE workshop and the 18thTask Force of the ICP M&M which were held back-to-back in Italy
(Sorrento, 14-19 April 2002). Main recommendations include the further review of methods and national data, the review of atmospheric as well as other heavy metal inputs (in particular on agricultural soils), the exploration of critical limits including those related to human health and the exploration of effect-based approaches for mercury.
The ICP M&M recommended the work of the Expert Group on Critical Limits and the Expert Group on Transfer Functions to continue its work in 2003, using the results of the preliminary call for data on critical loads of cadmium and lead.
Samenvatting
De “Working Group on Effects” (WGE) van de “Convention on Long-range Transboundary Air Pollution” onder de “United Nations Economic Commission for Europe” (UNECE-CLRTAP) heeft
tijdens haar 20ebijeenkomst besloten dat de methode om kritische depositiewaarden voor cadmium
en lood in kaart te brengen verder ontwikkeld moet worden. De WGE heeft daarom de “International Cooperative Programme on Modelling and Mapping” (ICP M&M) en het bijbehorende “Coordination Center for Effects” van het RIVM (RIVM-CCE) gevraagd om eind 2001 een verzoek te richten aan het netwerk van “National Focal Centres” (NFC’s) om de relevante data te verstrekken, op vrijwillige basis. Dit rapport beschrijft de resultaten van dit RIVM-CCE werk.
Aan NFC’s is verzocht om een effect-georiënteerde – en/of een stand-still methode toe te passen. De eerste methode geeft kritische depositiewaarden voor cadmium en lood die het risico van schade aan planten beperkt. De tweede methode begrenst verdere toename van de metalen in de bodem. Zeventien NFC’s reageerden, waarvan elf gegevens hebben opgestuurd die zijn verwerkt. Het rapport bevat:
• de methodologische leidraad die door het RIVM-CCE aan NFC’s werd verstrekt,
• de eerste voorlopige Europese kaarten van kritische – en stand-still waarden gebaseerd op de respons van Bulgarije, Duitsland, Italië, Nederland, Oekraïne, Rusland, Slowakije, Tsjechië, het Verenigd Koninkrijk, Wit-Rusland en Zwitserland en
• de voorlopige overschrijdingskaarten gemaakt in samenwerking met het EMEP-Meteorological Synthesizing Centre East onder de UNECE-CLRTAP.
De resultaten zijn gepresenteerd en bediscussieerd op de 12eCCE-workshop en de 18eTask Force
van de ICP M&M die, op uitnodiging van Italië, in Sorrento werden gehouden (14-19 april 2002). Daar werd door deskundigen aanbevolen meer aandacht te besteden aan methoden en data, met name de evaluatie van atmosferische - en andere belastingen door zware metalen (van met name landbouwgronden), verder onderzoek naar kritische grenzen voor milieu en gezondheid en de verkenning van effect-georiënteerde methoden voor kwik depositie.
De ICP-M&M heeft verder aanbevolen het werk van de “Expert Group on Critical Limits” en de “Expert Group on Transfer Functions” in 2003 voort te zetten mede op basis van de hier gerapporteerde resultaten.
Part I
Modelling and Mapping of Critical Loads
for Cadmium and Lead
Part I consists of four chapters focussing on methods and data for the modelling and mapping of critical loads and exceedances, and presents a preliminary analysis of the NFC response.
Chapter 1 is an executive summary of the response results including preliminary maps of critical loads and exceedances.
The methodology for the computation of critical loads for cadmium and lead is based on extensive preparatory work in past years. This was boiled down to a “guidance” document which was sent to NFCs as background information to the call. This guidance document is included here as chapter 2. Chapter 3 provides a data analysis of the response to the call for data. Finally, chapter 4 provides a description of the modelling of deposition fields of the two heavy metals.
1
Preliminary Modelling and Mapping of Critical Loads
for Cadmium and Lead and their
Exceedances – Executive Summary
Jean-Paul Hettelingh, Jaap Slootweg, Maximilian Posch, Sergey V. Dutchak1, Ilia Ilyin1
1.1
Introduction
The Working Group on Effects (WGE) at its 20thsession “noted the need to further develop and test
the methodology for mapping critical loads for heavy metals (Pb, Cd) and, to this end, invited the ICP Mapping and the CCE to issue, by the end of 2001, a call for relevant data to be provided by the NFCs on a voluntary basis” (EB.AIR/WG.1/2001/2 para. 37f). In response to this invitation the CCE issued such a call for data on 18 December 2001 requesting its National Focal Centres (NFCs) to respond not later than 11 March 2002. In support of this call NFCs were provided with a Guidance document (reprinted in chapter 2).
The call requested parties to provide effect-based critical loads and stand-still loads using the 50x50
km2 EMEP grid system. Effect-based critical loads in the context of the Convention equal the
atmospheric deposition that will not lead to concentrations of heavy metals above critical limits in defined compartments in a steady-state situation. These critical loads can be derived using (a) critical limits of heavy metal concentrations in the soil solution which will not harm microbiota and plants and/or (b) critical limits of (reactive) soil metal concentrations which will not lead to adverse impacts on soil functioning, such as soil invertebrates that ingest soil. Stand-still loads in the context of the Convention equal the atmospheric deposition that will not lead to any further accumulation of heavy metals in the soil. In fact, stand-still loads should also include other than atmospheric inputs.
Finally, parties were encouraged to provide ecosystem information using the European Nature Information System (EUNIS) to enhance cross-border comparison of ecosystems (see also Hall, 2001).
Following recommendations from a joint meeting of the bureaux of the EMEP Steering Body and the Working Group on Effects, a collaboration was started between the EMEP/MSC-E and the CCE. The aim of the collaboration is to use MSC-E results of modelled deposition of cadmium and lead deposition fields in 1990, 2000 and 2010 (see chapter 4) for the computation of preliminary exceedance maps. MSC-E and CCE also agreed to attempt the assessment of ecosystem dependent exceedances.
Preliminary results of the call for data and exceedance maps have been shown and discussed at the 12th CCE workshop and the 18th Task Force of the ICP M&M which were held back-to-back in Italy (Sorrento, 15-19 April 2002).
This chapter summarises the NFC response and shows 5th percentile critical load maps for cadmium and lead and their exceedances.
1.2
Preliminary critical load results
Critical load data were received from National Focal Centres (NFCs) of Bulgaria, Belarus, Czech Republic, Germany, Italy, The Netherlands, Russia, Slovakia, Switzerland, Ukraine and the United Kingdom. Effects-based critical loads (protecting microbiota and plants) were submitted by ten NFCs. Germany also submitted critical loads, which protect soil organisms (e.g. invertebrates). Stand-still loads were submitted by Bulgaria, Czech Republic, Germany, Italy, The Netherlands, Slovakia and the United Kingdom. Italy only provided loads based on semi-dynamic calculations, which are shown on European maps of stand-still loads. Austria, Belgium (Flanders), Finland, France, Sweden and Norway informed the CCE not to be able to participate at this time.
All NFCs provided critical loads for forest ecosystems, three NFCs also included natural vegetation. Three NFCs also provided critical loads for arable land, implying that atmospheric deposition is a major contributor to heavy metals input to these soils. See Chapter 3 for details on the ecosystems for which data have been submitted.
Preliminary European critical and stand-still load maps of cadmium and lead have been produced using data of the participating countries. Due to the preliminary and exploratory nature of the modelling and mapping exercise, no European databases have been used by the CCE to fill regional gaps of critical loads.
Critical load/stand-still load maps of cadmium and lead are shown in Figures 1-1 and 1-2,
respectively. The maps show 5thpercentile critical loads in each 50x50 km2EMEP grid cell. A 5th
percentile critical load implies that 95% of the mapped ecosystems will be protected from adverse effects if the atmospheric deposition of cadmium in that grid cell is equal to this critical load value.
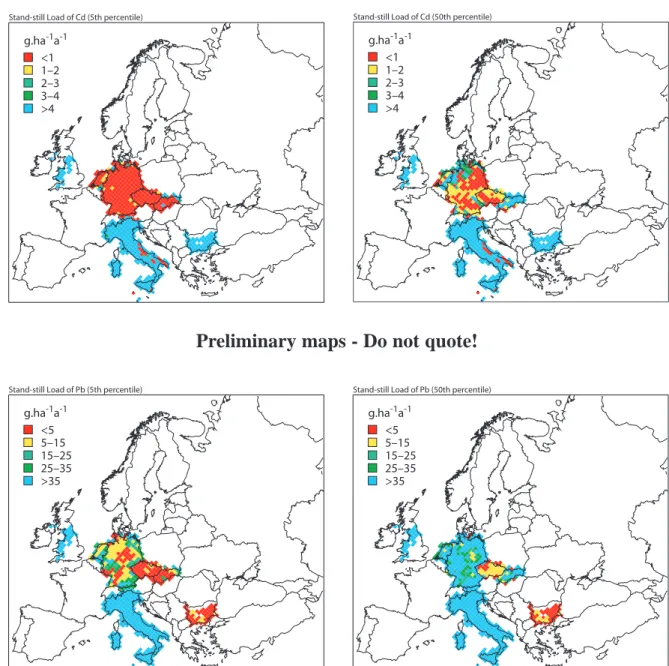
Similarly, the 5thpercentile stand-still load addresses protection against accumulation. Figure 1-1
shows the maps of the 5thpercentile of effect-based critical loads (left) and stand-still loads (right)
for cadmium. Comparison of the two maps shows that the stand-still approach may lead to lower values for cadmium in the Czech Republic, Germany, The Netherlands, and the United Kingdom
while higher values occur in Bulgaria and Slovakia. Figure 1-2 shows the maps of the 5thpercentile
of effect-based critical loads (left) and stand-still loads (right) for lead. Comparison of the two maps shows that the stand-still approach may lead to lower values for lead in the Czech Republic, Germany, The Netherlands and the United Kingdom and to higher values in Bulgaria and Slovakia.
Preliminary maps - Do not quote!
Figure 1-1: Preliminary maps of the 5th percentile of effect-based critical loads (left) and
stand-still loads (right) for cadmium. Comparison of the two maps shows that the stand-still approach generally leads to lower values for cadmium in CZ, DE, NL, UK and SK and to higher values in BG.
Preliminary maps - Do not quote!
Figure 1-2: Preliminary maps of the 5th percentile of effects-based critical loads (left) and
stand-still loads (right) for lead. Comparison of the two maps shows that the stand-still approach generally leads to lower values for lead in e.g. DE, NL and SK.
g.ha-1a-1 <1 1–2 2–3 3–4 >4
Critical Load effect-based of Cd (5th percentile)
g.ha-1a-1 <1 1–2 2–3 3–4 >4
Stand-still Load of Cd (5th percentile)
g.ha-1a-1 <5 5–15 15–25 25–35 >35
Critical Load effect-based of Pb (5th percentile)
g.ha-1a-1 <5 5–15 15–25 25–35 >35
1.3
Preliminary exceedance computation results
Using estimates of emissions in 2010, EMEP/MSC-E computed both mean and ecosystem
dependent depositions (see chapter 4) in 50x50 km2 grid cells. These depositions are used to
compute and map exceedances described below.
1.3.1
Preliminary exceedance maps using mean depositions
Figure 1-3 shows the result of comparing the 5thpercentile critical load maps for cadmium and lead
with the mean depositions of these metals. As can be seen the deposition of lead exceeds the preliminary critical loads in a wider area than cadmium deposition.
Preliminary maps - Do not quote!
Figure 1-3: Exceedance of the 5th-percentile critical loads (effect-based) for cadmium (left)
and lead (right) in 2010 using the mean deposition of these metals in 50x50 km2EMEP grid
cells. g.ha-1a-1 <0.0 0.0–0.1 0.1–0.2 0.2–0.5 0.5–1.5 >1.5 Exceedance of 5% CL(Cd) Av.dep. 2010
Dep-data: EMEP/MSC-ERIVM/CCE
g.ha-1a-1 <0 0–2 2–6 6–15 15–40 >40 Exceedance of 5% CL(Pb) Av.dep. 2010
1.3.2
Preliminary exceedance maps using ecosystem-dependent depositions
EMEP/MSC-E tentatively produced ecosystem dependent depositions (see chapter 4) using CCE
land cover information (De Smet and Heuvelmans 1997)2. First results suggest that ecosystem
dependent exceedances do not lead to striking changes in comparison to mean exceedances in Figure 1-3. Tentative results, focussing on lead, are shown in Figure 1-4. Figure 1-4 compares the average deposition of lead to the 5th-percentile forest critical load of lead (left) and the conifer
dependent deposition of lead to the 5th-percentile forest critical load of lead (right). The result shows
an increase in the area of exceedances, especially in Russia, and an increase of the exceedance magnitudes in distributed grid cells in the countries who submitted preliminary critical loads.
Preliminary maps - Do not quote!
Figure 1-4: Ecosystem dependent exceedances in 50x50 km2 EMEP grid cells using the
average deposition of lead to the 5th-percentile forest critical load of lead (left) and the conifer
dependent deposition of lead to the 5th-percentile forest critical load of lead (right). 2In the future an updated CCE land cover map (de Smet and Hettelingh 2001) will be considered.
g.ha-1a-1 <0 0–2 2–6 6–15 15–40 >40
Exceedance of 5% forest CL(Pb) Av.dep. 2010
Dep-data: EMEP/MSC-ERIVM/CCE
g.ha-1a-1 <0 0–2 2–6 6–15 15–40 >40
Exceedance of 5% forest CL(Pb) Forest dep. 2010
1.4
Recommendations
Preliminary critical load and exceedance maps have been produced on the basis of data submissions
of 11 NFCs. Inspection of the data, as reported in chapter 3, and subsequent discussions at the 12th
CCE workshop and at the 18thTask Force lead to the following recommendations to:
(a) review total heavy metal inputs (i.e. atmospheric deposition and other sources, taking present concentrations in soil/soil solution into account),
(b) review methods to identify regions where the application of the stand-still approach might be more appropriate than an effects-based approach,
(c) review cross-border variability of the heavy metal content in soils and the exploration of methods to establish natural and anthropogenic shares of heavy metals in present soil content data,
(d) explore whether atmospheric deposition of heavy metals significantly influences the metal content in agricultural soils,
(e) analyse possible inconsistencies of critical load parameter values across borders, (f) review critical limits and transfer functions,
(g) explore critical limits which can be related to human health, (h) explore effects-based approaches for mercury.
The 18thTF M&M recommended the work of the Expert Group on Critical Limits and the Expert
Group on Transfer Functions to continue its work in 2003, using the results of the preliminary call for data on critical loads of cadmium and lead, described in this report.
References
Hall J (2001) Harmonisation of Ecosystem Definitions. In: M Posch, PAM de Smet, J-P Hettelingh, RJ Downing (eds) Modelling and Mapping of Critical Thresholds in Europe. Status Report 2001, RIVM-Coordination Center for Effects, pp.67-71. (available at www.rivm.nl/cce)
De Smet PAM, Heuvelmans E (1997) Development of the European land cover map. In: M Posch, J-P Hettelingh, PAM de Smet, RJ Downing (eds) Modelling and Mapping of Critical Thresholds in Europe. Status Report 1997, RIVM-Coordination Center for Effects, pp. 41-46. (available at
www.rivm.nl/cce)
De Smet PAM, Hettelingh J-P (2001) Intercomparison of Current European Land Use/land Cover
Databases. In: M Posch, PAM de Smet, J-P Hettelingh, RJ Downing (eds) Modelling and
Mapping of Critical Thresholds in Europe. Status Report 2001, RIVM-Coordination Center for Effects, pp. 41-52. (available at www.rivm.nl/cce)
2.
Guidance for the Calculation of Critical Loads for
Cadmium and Lead in Terrestrial and Aquatic
Ecosystems
Wim de Vries1, Gudrun Schütze2, Paul Römkens1, Jean-Paul Hettelingh
with contributions by Regis Farret3, Mike Ashmore4and Bert Jan Groenenberg1
2.1.
Background and aim
This chapter is a reprint of the guidance document that was distributed to NFCs in the autumn of 2001 to assist them with their response to the call for data on preliminary critical loads for cadmium and lead.
Background
During its 20th session, the Working Group on Effects (WGE) decided to have the Coordination
Center for Effects (CCE) issue a call for data to allow preliminary mapping of European critical loads of cadmium and lead. The call was issued by the end of 2001, leading to results which were
presented at the 12thCCE workshop, at the 18thTFM meeting and which will be presented at the
21stsession of the WGE.
In view of this call, the CCE requested the preparation of the guidance document (reprinted here), summarising the following published information. In 1998 two manuals were published, presenting guidelines for calculation methods, critical limits and input data for the calculation of critical loads of heavy metals for terrestrial ecosystems (De Vries and Bakker, 1998) and aquatic ecosystems (De Vries et al., 1998). The development of those manuals started in 1994 and several drafts were discussed at CCE workshops in 1995, 1996 and 1997. Together with other background documents they were also discussed at the “International Workshop on Critical Limits and Effect-based Approaches for Heavy Metals and POPs” in November 1997 in Bad Harzburg, Germany (De Vries et al., 1997a,b). In those two manuals various possibilities are described to calculate critical loads for heavy metals in view of the use of:
• Simple or (more) complex models, based on a mass balance approach for metals • Different types of critical limits
• Different types of transfer functions between metals in the soil solid phase and soil solution Since the publication of the manuals a “Workshop on Effects-based Approaches for Heavy Metals” was held in Schwerin, Germany, 12–15 October 1999, focusing on the use of methods and transfer functions and on critical limits to calculate critical loads (Gregor et al., 1999). Furthermore, an “Ad-hoc International Expert Group Meeting on Effect-based Critical Limits for Heavy Metals” was held 11–13 October 2000 in Bratislava, Slovak Republic (Curlik et al., 2000), focussing specifically on the derivation of critical limits for heavy metals. At the 17th Task Force of the ICP on Modelling and Mapping in Bratislava in 2001, it was concluded that further harmonisation of critical limits and transfer functions is an urgent need. Two expert groups were set up, which should:
1Alterra Green World Research, Wageningen, The Netherlands. 2OEKO-Data, Strausberg, Germany.
3INERIS, Verneuil en Halatte, France.
• Review the transfer functions and critical limits provided in the manual and, more recently, at the workshop in Bratislava.
• Suggest a harmonised set of transfer functions and critical limits, which can be used in first mapping exercises to gain experience in the use of different approaches.
Aim
The aim of this chapter (at the time of the call for data) is to provide an up-to-date guidance to derive critical loads for heavy metals for both terrestrial and aquatic ecosystems, summarising the: • Mass balance models and input data to calculate critical loads
• Transfer functions, describing the relationship between dissolved and adsorbed concentrations of heavy metals, while accounting for the impact of soil properties
• Critical limits for dissolved and adsorbed concentrations of heavy metals, that are essential to carry out the critical load calculations
This guidance is a summary of the two previous manuals and an update of Gregor et al. (2000). It also includes transfer functions and critical limits proposed in a joint report by the two expert groups (De Vries et al., 2001).
In general, this chapter has not been updated with information becoming available only after the call was made. Therefore, new findings following the presentation of the results of the call for data at
the 12th CCE workshop (14-17 April 2002) and at the 18thTask Force on Modelling and Mapping
(18-19 April 2002) in Sorrento (Italy) have not been included in this chapter. In stead, new information on the derivation of critical limits for lead and cadmium is included in Annex I of this report.
One exception has been made with respect to the naming of loads computed using the stand-still approach. It was agreed at the 18thTF M&M to use the term stand-still loads rather than critical
loads for results of the stand-still approach. This convention has been adopted in this chapter, while also minor textual and layout changes have been made in comparison to the original guidance document.
This chapter provides information on the equations and data that are needed to compute (a) critical loads for terrestrial and aquatic ecosystems using recommended critical limits, i.e. an effect-based approach, and (b) stand-still loads for terrestrial and aquatic ecosystems using a stand-still approach. For the computation of critical and stand-still loads a sequence of equations needs to be assessed. This has been summarised in flowcharts (see Figures 2-1 and 2-2) at the beginning of the sections on terrestrial and aquatic ecosystems respectively.
2.2
Terrestrial ecosystems
Figure 2-1: Flowchart of equations and databases required to compute the critical load of Pb and Cd for terrestrial ecosystems using an effect-based approach (top) and a stand-still approach (bottom).
Computation of critical loads of Pb and Cd for terrestrial ecosystems using recommended critical limits
=
Requires input on (from) CL(M) (equation 1) Mu (eq. 2) Y Xhpp Table 1 Mw (eq. 3) BCw XM XBC Table 2 Critical load database Mle(crit) (eq. 4) Qle [M]ss(crit) Dissolved ?eq.9b Table 3 column 1
Mre(crit) Table 3 column 2 no yes fru Suggested: 0.5 for forest; “own” value for agr. soils
Qle is precip. excess? no eq.5 yes fwe Climate
database Table 5 (eq.10)Kf ,n fru=1 no yes z %OM, %clay, pH Soil database
Computation of stand-still loads of Pb and Cd for terrestrial ecosystems using a stand-still approach
CL(M) (equation 1) Mu(eq. 2) Y Xhpp Table 1 Mw(eq. 3) BCw XM XBC Table 2 Critical load database Mle(crit)(eq. 6) Qle [M]ss(pres) Mre (eq.8) fru Suggested: 0.5 for forest; “own” value for agr. soils
Qleis precip. excess ? no eq.5 yes fwe Climate database
=
Requires input on (from)Kf ,n (Eq.10) eq. 9b Table 5 Table 4 Present metal content Mtt Mst (eq.7) a0 , a1 Table A1, A2 $0,1,2,3 fru=1 no yes z measured? Mre measured? Database yes yes no no Mst measured? yes no %OM, %clay, pH Soil database
2.2.1
Simple steady-state mass balance model and related input data
Steady-state mass balance modelThe critical load is the acceptable total load of anthropogenic heavy metal inputs (deposition, fertilisers, other anthropogenic sources). It corresponds to the sum of tolerable outputs from the system by harvest and leaching minus the natural inputs by weathering release. In the manual for terrestrial ecosystems (De Vries and Bakker, 1998), the default method presented to calculate critical loads of heavy metals for soils includes all relevant metal fluxes in or out of the considered system, while assuming a steady state situation (Manual, page 45, Eq 5). This method is specifically relevant when calculating critical loads for the humus layer. The problem, however, is that transfer functions relating metal concentrations in the soil to those in soil solution are up to now limited to the mineral layer. This implies that any estimate of a critical load for the humus layer is highly uncertain. In order to keep this first approach as simple as possible and also stay as close as possible to the simple mass balance approach for nitrogen and acidity, we simplified this model by neglecting the metal cycling within a terrestrial ecosystem according to (see Manual, page 62, Eq. 34):
(1) where:
CL(M) = critical load of heavy metal M (g ha-1a-1)
Mu = removal of heavy metals by biomass harvesting or net uptake in
forest ecosystems, respectively, from the mineral topsoil (g ha-1a-1)
Mw = weathering release of heavy metals in the mineral topsoil (g ha-1a-1)
Mle(crit) = critical leaching of heavy metals from the mineral topsoil (g ha-1a-1)
The notation has been adapted to that in the critical load equations for acidity and nutrient nitrogen. M stands for a heavy metal and can be substituted by the chemical symbol of the individual metal (Cd, Pb) under consideration. The model can be even more simplified by neglecting weathering
outside volcanic or ore-rich areas (Mw = 0 in Eq.1). This approach, which was already used by
different countries, implies that the critical load equals the net uptake by forest growth or agricultural products plus an acceptable metal leaching rate.
The considered depths for the calculation are 10 cm for forest soils, 20 cm for grassland and 30 cm for arable land (plough layer), which are generally quite homogeneous. Furthermore, adverse impacts on plants and soil organisms, which are the main target groups considered, is mainly related to these layers (De Vries and Bakker, 1998; p.44).
Heavy metal removal by harvest of plants in the mineral topsoil
The most simple approach to describe the removal of heavy metals by biomass is to combine the average yield (or increment) of biomass with the heavy metals content in harvested parts:
(2) where:
fru = root uptake factor, to scale the net uptake in the root zone to the depth considered (-)
Y = annual average removal of biomass (dry weight) (kg ha-1a-1)
Xhpp = content of the heavy metal in the harvested parts of the plants (g kg-1)
Mu=fru⋅ ⋅Y Xhpp
Since critical loads for forests are calculated for the mineral topsoil (0-10 cm), the total net uptake is multiplied by the root uptake fraction (fraction of fine roots) in this layer and the overlying humus layer as compared to the total root zone. As a first approximation, this root uptake factor, fru, could be taken equal to 0.5. For agricultural soils, where the whole root zone is considered, this factor can be set equal to 1.0.
Data on biomass removal for forests can in principle directly be derived from the S&N critical loads database. Metal contents in biomass will in principle depend on the critical limit chosen. Using the stand still principle, it refers to present concentration and using an effect-based approach it is best to use results from investigations on relatively unpolluted areas. Since those contents in most cases not normally distributed, the median value (instead of the mean) should be used. It can be expected that those values do not exceed limits or guidance values for use as food or feed, thus the export from the area can be regarded as tolerable. If in a country no content values are available from own studies, the ranges of values given in the Table 2-1 may be used. If contents are available for different harvested parts of the plants (e.g. stem and bark of forest trees), a weighted mean of both should be used.
Table 2-1: Ranges for the annual biomass removal and the contents of Pb and Cd in biomass for various land use types in a temperate climate at relatively unpolluted sites. More information on the background of these data is given in De Vries and Bakker (1998)
Land use Biomass removal Y (kg.ha-1.yr-1) Metal content in harvested parts, X
hpp(mg.kg-1) Pb Cd Grassland 5000 – 20000 1.0 - 3.0 0.05 - 0.25 Arable land 1000 – 6000 0.1 - 0.5 0.01 - 0.10 Coniferous forest 2000 – 7000 1 - 10 0.1 - 0.5 Deciduous forest 2000 – 6000 1 - 10 0.1 - 0.5
Beware that only the net uptake is calculated. For instance, for agricultural land the amount of metals in stalks or the leaves of beets remaining on the field should not be considered. The removal of heavy metals in this case is the product of the yield of grains/beets and the mean contents in these parts of the plants. For forest ecosystems, only the net increment should be considered, but not the uptake into needles, leaves, etc., which also remain in the system.
Heavy metal release by weathering in the mineral topsoil
The weathering rate of a heavy metal can be estimated by the following equation:
(3)
Where:
Mw = weathering release of heavy metals in the mineral topsoil of 10cm (g ha-1a-1)
BCw = weathering release of base cations from the parent material (molc ha-1a-1m-1)
XM = content of the heavy metal in the parent material (mg kg-1)
XBC = content of base cations in the parent material (mol kg-1)
fwe = factor to scale the weathering rate from 1 m to the depth considered (m)
M f BC X X w we w M BC = ⋅5 10−4⋅ ⋅ ⋅
The factor of 5.10-4is needed to convert the result to the appropriate units. To obtain a molar ratio
in Eq.3 one has to divide the value of XM(in mg kg-1) by its molar weight times 1000. This leads
to a metal weathering rate in molc ha-1a-1m-1, which has to be multiplied by the equivalent weight
of the metal, being equal to the molar weight divided by 2. These considerations lead to the factor
of 5.10-4. The most simple approach to estimate fwe is by assuming uniform weathering, leading to
a value equal to z, where z is the considered depth in m, resulting in, e.g., fwe=0.1 for forest soils.
For both metals and base cations, the content in parent material is used, since the total content of heavy metal M in the (top)soil may be strongly influenced by accumulation on reactive sites due to pollution.
The ratio of heavy metals and base cations in the parent material (XM/XBC) must be derived from
geological survey data. The term of weathering may vary from insignificant to several times the deposition rate in ore-rich areas. If the weathering rate of heavy metals is exceeding the outputs by harvest and the critical leaching rate (see below), the area should be excluded as being naturally polluted. An overview of typical ranges of metal contents in parent material that could be used in combination with ranges in base cation weathering rates is given in Table 2-2. Data on base cation weathering rates can in principle directly taken from the S&N critical loads database.
Table 2-2: Ranges for the base cation weathering rates and the total contents of base cations and of Pb and Cd in the parent material of major clusters of soil types (source are partly results for Dutch soils)
Critical leaching of heavy metals
The critical leaching flux of a heavy metal can be calculated according to the equation
where:
Qle = flux of leaching water leaching from the mineral topsoil (m.a-1)
[M]ss(crit)= critical limit for the total concentration of heavy metal in the percolating
soil solution (mg.m-3)
The factor of 10 in Eq.4 is needed to convert the unit from mg.m-2.a-1 to g.ha-1.a-1. The total
concentration of heavy metal in the soil solution is the most appropriate value to calculate the tolerable leaching flux. In this term both the free metal ions and the metals bound in dissolved complexes are included. Both parts are relevant to the leaching process.
Mle crit( )= ⋅10 Qle⋅[M]ss crit( )
Soil type BCwe(molc.ha-1.yr-1.m-1) XBC(mol.kg-1) Metal content in parent material (mg.kg-1)
XPb XCd
Poor sandy soil 200–400 0.2-0.4 3-7 0.007-0.013
Rich sandy soil 400–800 0.8-1.2 5-15 0.01-0.03
Loamy soil 500–1000 0.6-1.0 15-25 0.07-0.13
The water flux leaching from the mineral topsoil at steady state is calculated according to: (5) where: P = precipitation (m a-1) Ei = interception evaporation (m a-1) Ese = soil evaporation (m a-1) Et = plant transpiration (m a-1)
fru = root uptake factor (see Eq.2)
In principle, the value of Qlecan be derived from the S&N critical loads database, but one has to be
aware that if the latter value refers to the total precipitation excess, a scaling is needed to take into account the partial plant transpiration.
The critical load depends to a large extent on the critical limit used. It is assumed that for Cd and Pb, soil biota (microbial processes, soil fauna) and plants are the most sensitive receptors, while secondary poisoning and impacts on food quality (in case of agricultural soils) is not (yet) considered. This means that in the case of Cd and Pb, protection of food quality, higher fauna and ground water is not a decisive point for the derivation of the critical limits, but the conservation of the soil function to act as a biotope. The critical limit can either be included directly or has to be derived from critical limits or present values for the metal concentration in the soil, as described in more detail in the next Section.
2.2.2. Assessment of critical limits for terrestrial ecosystems
In the workshop in Schwerin (Gregor, 1999), it was decided that the critical metal load equals the load that will not lead to concentrations of heavy metals above critical limits in defined
compartments in a steady-state situation (effect-based approach). At the 18thTFM&M meeting it
was agreed that a stand-still load is a load that will not lead to accumulation of heavy metals in the upper soil layer (stand-still approach).
In the effect-based approach, the critical limits for either the soil or the soil solution are based on adverse effects on (parts of) the ecosystem. In the stand-still approach, no further metal increase is accepted, implying that the present total metal concentration in the soil is considered the critical limit. In Schwerin it was suggested to take the minimum of both the stand-still and effect-based approaches, implying that the critical load either causes a stand-still or a decrease in the present metal concentration. The “expert group on critical limits”, however, decided to calculate and present stand-still as well as critical loads, but not to take the minimum of the two (De Vries et al., 2001).
Effect-based approach
In calculating a critical load for terrestrial ecosystems, a critical metal leaching rate is derived by multiplying the flux of leaching water with a critical dissolved metal concentration. Using the effect-based approach in view of the ideas mentioned above, this limit can be related to either: • Critical reactive soil metal concentrations based on available NOEC toxicity data related to
adverse impacts on soil functioning, such as soil invertebrates, that ingest soil. The implicit assumption is that NOEC data for metals can be regarded as reactive soil metal concentrations, Qle= − −P Ei Ese− ⋅fru Et
since metal is added to the soil in the experiment and thus readily available.
• Critical metal concentrations in soil solution view of impacts on plants or microbiota, which are also relevant for soil functioning.
In the first case, one has to calculate a critical dissolved metal concentration for the critical reactive metal content, using a transfer function as described in Section 4. In the second case, the critical metal leaching rate can directly be calculated. A summary of preliminary effect-based critical limits that was agreed upon by the “expert group on critical limits” is given in Table 2-3.
Table 2-3: Recommended critical limits including ranges for uncertainty assessment (± 20 %deviation from the recommended value)
The critical dissolved metal concentrations, Mss(crit), including the range for uncertainty
assessments, are based on:
• NOEC toxicity data for soil in view of impacts on plants and microbiota, organisms from which you can be sure that the effect is only through the soil solution
• Data gathered in Germany, France and The Netherlands (Schütze and Throl, 2000; Farret and Magaud, pers.comm.; Klepper and Van de Meent, 1997); Crommentuijn et al., 1997).
• In which both NOECs and soil properties regulating metal availability (organic matter content, clay content and pH) are available
• Harmonised general transfer functions for Pb and Cd given in Section 4 to calculate related NOECs for soil solution from the soil solid phase and
• Statistical approaches, deriving limits based a log-logistic fit of the NOEC data (Aldenberg and
Slob, 1991) and applying a 95% protection level (HC5)
More information on the approach and the data sets used is given in De Vries et al. (2001). Also the uncertainties of the derivation and points to be further discussed in the future are described there. The critical reactive metal concentrations, Mre(crit), are based on the NOEC data for soil fauna data,
using all available data from Schütze and Throl (2000), Farret and Magaud , pers.comm. (in connection with an EC Technical Guidance document on risk assessment) and Klepper and Van de Meent (1997), who mainly included data from Crommentuijn et al. (1997).
It was assumed that these organisms mainly get their metal intake through soil ingestion (e.g. hard-bodied soil invertebrates). In reality, most of those organisms do take up metals both from the soil and solution. Again, more information on the approach and the data sets used is given in De Vries et al. (2001).
Stand-still approach
As an alternative to the effect-based approach a stand-still approach may be used (Gregor, 1999), which aims at avoiding any (further) accumulation of heavy metals in the soil. Note, however, that the current leaching may already imply significant effects, and is thus per se not acceptable in the long term. In the stand-still approach the critical leaching term is calculated as:
Metal Critical dissolved concentration [M]ss(crit) Critical reactive concentration Mre(crit)
(mg m-3) (mg kg-1)
Cd 0.8 (0.6 - 1) 0.9 (0.7 – 1.1)
(6) where:
[M]ss(pres) = present total concentration of heavy metal in the percolating soil solution (mg.m-3)
A limitation of the stand-still approach is that data on current concentrations of heavy metals in the leaching water are scarce, thus hampering the calculation of critical loads1on a large spatial scale.
Therefore the current leaching can be mapped only on the basis of transfer functions to transform total contents of Cd and Pb in the upper soil layers, which are often available, into concentrations of the soil solution. Calculation of stand-still loads thus implies that present soil metal concentrations need to be assessed and mapped in each country.
There are several possibilities with respect to the availability of present metal concentration data. The data might be total concentrations based on a HF destruction or “so-called” total concentrations, based on aqua regia destruction or a concentrated nitric acid destruction. It is also possible that
countries do have data sets on reactive metal concentrations based on mild HNO3(0.43N), EDTA
or DTPA extractions.
In all cases, the soil concentration has to be translated to a dissolved concentration using a certain transfer function, as discussed in the following section. To avoid confusion the following abbreviations (subscripts) are used:
• tt = total (destruction by HF plus mineral acids under pressure) • st = “so-called” total (e.g. aqua regia or other strong acids)
• re = reactive (e.g. extraction by 0.43N HNO3, other mild acids, complexing agents like EDTA,
DTPA, or mineral salt solutions)
• ss = soil solution (refers to the total dissolved metal concentration)
2.2.3 Transfer functions
Possible approachesThere are various approaches to derive total dissolved metal concentrations ([M]ss) from total soil
metal concentrations (Mtt or Mst). The simplest approach is a direct empirical approach relating both
concentrations, while accounting for the impact of major soil properties influencing the sorption relationship. This approach is, however, not suggested here, because there is no real process mechanism involved in this approach, since part of the metals extracted by e.g. HF or aqua regia do not interact with the soil solution (inert or immobile part, being equal to the total minus the reactive part). Starting from total concentrations, it is essential to (i) first derive the reactive metal concentration, Mre, from the total soil metal concentration (generally Mst) and (ii) derive the total
dissolved metal concentration, [M]ss, from the reactive metal concentration, Mre, accounting for the
impact of soil properties. The most fundamental approach is to relate the free metal ion activity to
Mre, accounting also for the impact of major ions in soil solution competing with the metals and
then calculate the total dissolved metal concentration, [M]ss, from the free metal ion activity, using
a (simple) complexation model (De Vries and Bakker, 1998). This approach does, however, require more data and is therefore not suggested yet.
Taking into account the above-mentioned aspects, the following sequence of transfer functions is considered in this guidance:
• from total (Mtt) to “so-called” total metal concentration (Mst)
• from “so-called” total metal concentration (Mst) to reactive metal concentration (Mre)
• from reactive metal concentration (Mre) to dissolved metal concentration ([M]ss)
These different transfer functions are discussed next.
Transfer functions from total to “so-called” total metal concentrations
Utermann et al. (2000) provided transfer functions to calculate “so-called” total contents of heavy metals (Mst; here aqua regia (AR)) from total contents (Mtt; HF), according to:
(7) where:
Mtt = total concentration of heavy metal M in soil (mg kg-1)
Mst = “so-called” total concentration of heavy metal M in soil (mol kg-1)
Values for a0and a1are given in Appendix 1. The correlations are depending on metal and substrate.
For back-calculations of total contents from AR different functions are to be used. These functions are not provided here, since those calculations are not needed in the present calculation procedure.
Transfer functions from “so-called” total to reactive metal concentrations
The reactive metal concentration (Mre, here: 0.43N HNO3) can be related to the so called total
concentration (Mst, here: aqua regia digestion) according to: (8) where:
Mre = reactive concentration of heavy metal M in soil (mol kg-1)
Values for the various coefficients were derived from 49 soils with a large range in metal contents and soil properties, in which the reactive metal concentration was approximated by mild (0.43N)
HNO3extraction. Results are shown in Table 2-4.
Table 2-4: Values for the coefficients ß0-ß3in the relationship between relating reactive, Mre,
and “so-called” total soil concentrations, Mst, of cadmium and lead (Eq.8).
1) The standard error of the y-estimate on a logarithmic basis
Transfer functions from reactive to dissolved total metal concentrations
Freundlich isotherms that relate the reactive metal content (Mre) to the total concentration in soil
solution ([M]ss) can be expressed as:
log M10 re= + ⋅β β0 1 log M10 st+ ⋅β2 log (%OM)10 + ⋅β3 log (%clay)10
log M10 st= + ⋅a0 a log M1 10 tt
Metal ß0 ß1 ß2 ß3 R2 se-yest1)
Cd 0.225 1.075 0.006 -0.020 0.82 0.26
(9a)
or inversely
(9b)
where:
Mre = reactive metal concentration (here 0.43 N HNO3extractable) (mol kg-1)
[M]ss = total metal concentration in soil solution (mol m-3)*
Kf = Freundlich coefficient (mol1-nm3nkg-1)
n = Freundlich exponent (-)
To obtain an equation that can be used for a range of soils, Kfcan be written as:
(10)
The values of α0, α1, α2 and α3are obtained by multiple linear regression. As stated before, more
(soil) parameters can be included, but often a lack of data on larger scale levels (national, international) limits the approach to the ones mentioned here (i.e. organic matter, clay and pH). Results of such a fit, based on two data sets of 114 soil samples and 1466 complete records of both solid phase and solution composition, are given in Table 2-5. The results are based on a regression in which the dissolved concentration is given in mol m-3. More information on the data set and the optimisation of the parameters is given in Römkens et al. (2001). Table 2-5 gives also the estimated values of the Freundlich exponent n.
Table 2-5: Values forα0, α1, α2and α3, and n in the transfer function between reactive and
dissolved cadmium and lead concentration (Eq.10).
1) The standard error of the y-estimate on a logarithmic basis
*Note: In Eqs.9,10 it is crucial to use proper units. First the molar reactive concentration has to be
derived from concentrations that are generally given in mg.kg-1, by first dividing them by 1000 and
then dividing them by the molar weight of Cd (112.4) or Pb (207.2). The resulting metal
concentration in solution in mol.m-3has to be multiplied by 1000 and then by the molar weight of
Cd or Pb to get the concentration in mg.m-3used in the critical load calculations.
log K10 f =α α0+ ⋅1 log (%OM)10 +α2⋅log (%clay)10 +α3⋅pH
[ ] ( / )/
M ss= Mre Kf 1 n
Mre Kf M ss
n
= ⋅[ ]
Metal α0 α1 α2 α3 n R2 se-yest1)
Cd -5.01 0.65 0.27 0.29 0.54 0.77 0.37
2.3.
Aquatic ecosystems
Figure 2-2: Flowchart of equations and databases required to compute the critical load of Pb and Cd for aquatic ecosystems using an effect-based approach (top) and a stand-still approach (bottom).
Computation of critical loads of Pb and Cd for aquatic ecosystems using recommended critical limits
CL(M) (equation 11) Mu (eq. 12) Y Xhpp Table 1 Mw (eq. 13) BCw XM XBC Table 2 Critical load database Mlo(crit) (eq.15) Qlo [M]tot,sw(crit) (eq.16)
=
Requires input on (from)Mret(crit) (eq. 14)
rret, Al, Ac
Database Table 6
Computation of stand-still loads of Pb and Cd for aquatic ecosystems using a stand-still approach
CL(M) (equation 11) Mu(eq. 12) Y Xhpp Table 1 Mw(eq. 13) BCw XM XBC Table 2 Critical load database Mlo(crit)(eq.17) Qlo [M]tot,sw(pres) (eq.16)
=
Requires input on (from)Mret(crit)(eq. 18) rret, Al, Ac Database Present metal content in lakes Transfer functions
2.3.1
Simple steady-state mass balance model and related input data
Steady-state mass balance modelAs with terrestrial ecosystems, the critical load is the acceptable total load of anthropogenic heavy metal inputs that now corresponds to the sum of tolerable outputs from the catchment by harvest and outflow plus the in-lake metal retention minus the natural inputs by weathering release. In the manual for aquatic ecosystems (De Vries et al., 1998) the default method presented to calculate critical loads of heavy metals for soils includes all relevant metal fluxes in or out of the considered system. The in-lake metal retention thus includes sedimentation, resuspension and exchange processes in the lake (infiltration, diffusion and bioirrigation), while assuming a steady state situation (ibid., p.28, Eq.4). To keep the present approach as simple as possible, and also to stay as close as possible to the simple mass balance approach for nitrogen and acidity, we simplified this model by lumping transient exchange processes at the sediment-water interface and the net effect of sedimentation and resuspension in one retention term according to (ibid., p.62, Eq.34):
(11) where:
Mu = removal of heavy metal by biomass harvesting or net uptake in
forest ecosystems, respectively, in the catchment (g ha-1a-1)
Mw = weathering release of heavy metal in the catchment (g ha-1a-1)
Mret(crit) = net retention of heavy metal in the aquatic system at critical load (g ha-1a-1)
Mlo(crit) = critical lateral outflow of heavy metal from the aquatic system (g ha-1a-1)
Al = lake area (ha)
Ac = catchment area (ha)
Heavy metal removal by net uptake and release by weathering in the catchment
The assessment of these data is comparable for those in forest ecosystems, but now the uptake or release refers to the complete catchment. This implies that no further reduction factors need to be applied to relate the uptake or weathering in the root zone/catchment to the mineral topsoil. The equations for net uptake and weathering thus become:
(12)
(13)
Critical output and net retention of heavy metals from the aquatic system
A major task in this approach is to get information on the (critical) net in-lake retention. The easiest way is to relate this retention to the total metal concentration in surface water (dissolved and in suspended particles) according to:
(14) where:
rret = net retention rate in the lake system (m a-1)
[M]tot,sw(crit) = critical limit for the total concentration (dissolved and in suspended
particles)of heavy metal in surface water (mg m-3)
) crit ( sw , tot ret ) crit ( ret 10 r [M] M = ⋅ ⋅ M BC X X w w M BC = ⋅5 10−4⋅ ⋅ Mu = ⋅Y Xhpp
The critical lateral outflow can be described as the product of the lateral outflow flux of water and the critical limit for the total concentration of the heavy metal in the surface water according:
(15) where:
Qlo = lateral outflow flux of water from the aquatic system (m a-1)
In the manual for aquatic ecosystems, Qlo, is denoted as the hydraulic load to comply with the
literature on this subject. The hydraulic load is often described as the ratio of the lake depth, z (m),
and the hydraulic residence time, τw (a), where the residence time equals the ratio of the lake
volume, V (m3), and the flow through the aquatic system, Q (m3a-1).
The total concentration of metals can be calculated as: (16)
where:
[M]sw = dissolved concentration of a heavy metal in surface water (mg m-3)
Msus,tot = total content of a heavy metal in suspended particles (mg kg-1)
csus = concentration of suspended particles in surface water (kg m-3)
Data on the lateral outflow of lakes can be derived from the S&N critical loads database. The critical load depends on the critical limit used. In the manual for aquatic ecosystems (De Vries et al. 1998) it is argued that directly using a critical limit for the free metal ion activity in surface water is most appropriate. For the sake of simplicity we here use only critical limits for the total dissolved concentration of heavy metal to avoid the need of using complexation reactions. Nevertheless, it is still necessary to include a transfer function to calculate the concentration in suspended particles.
Catchment characteristics
Relevant catchment characteristics are the lake and catchment area, which should be available for those lakes for which critical loads for acidity have been calculated. The net retention rate has to be derived for each lake independently. In De Vries et al. (1998) several methods are described to estimate such a retention rate from measure metal concentrations in the lateral inflow to the lake and in the lake itself (Ibid., pp.46-49). Another approximation can be derived from an annual average
net sedimentation rate. Those rates vary in general from 1-25 mm a-1.
The concentration of suspended particles in the water compartment depends on the turbulence of the water, which in turn depends on wind speed and water flow velocity. The concentration of
suspended particles may thus vary considerably and generally ranges from 1-100 g m-3. The average
concentration for Dutch surface waters, for example, is 30 g m-3.
[M]tot sw, =[M]sw +Msus tot, ⋅csus Mlo crit( )= ⋅10 Qlo⋅[M]tot sw crit, ( )
2.3.2 Assessment of critical limits for aquatic ecosystems
As with terrestrial ecosystems, a critical metal load can be derived that will not lead to:
• Concentrations of heavy metals above critical limits in surface water in a steady-state situation and/or
• Accumulation of heavy metals in the catchment.
In the first effect-based approach, the critical limits for surface water are based on adverse effects on (parts of) the ecosystem. In the second stand-still principle, no further metal increase is accepted, implying that the present total metal concentration in the lateral outflow from the lake is considered the critical limit.
Effect-based approach
A summary of preliminary effect-based critical limits, based on an EU document for Cd and on Crommentuijn et al. (1997), that was agreed upon by the “expert group on critical limits”, is given in Table 2-6. Those data were also mentioned in the manuals on terrestrial and aquatic ecosystems. Compared to terrestrial ecosystems, the values are higher for Pb and lower for Cd. The critical limits are related to the dissolved concentration, thus requiring the use of transfer functions to calculate
Table 2-6: Recommended critical limits for surface waters including ranges for uncertainty assessments (±20% deviation from the recommended value).
Stand-still approach
In the stand-still approach, the leaching and in-lake retention fluxes become (see Eqs.14,15): (17)
and
(18)
where:
[M]tot,sw(pres) = present total concentration (dissolved and in suspended particles) of a heavy
metal in surface water (mg m-3)
2.3.3 Transfer functions
There are various possible approaches to derive adsorbed metal concentrations on suspended
particles (Msus,tot) from total dissolved metal concentrations in surface water ([M]tot,sw). The
simplest approach is an empirical linear approach (Kd-value) relating both concentrations, while
accounting for the impact of major properties of the suspended particles influencing the sorption relationship. There is no good reason to assume that this relationship will differ from those derived for the soil (Eq. 9), using values for Kfand n that can be derived by using Eq.10 and Table 2-5. The
problem, however, is that total concentrations can not be obtained from the inverse of Eq.8, since Mret(crit)= ⋅10 rret⋅[M]tot,sw(pres)
Mlo(crit)= ⋅10 Qlo⋅[M]tot,sw(pres)
Metal Critical dissolved concentration (mg m-3)
Cd 0.3(0.2 – 0.4)
heavy metal analyses by acid extraction in sediment or suspended particles also includes precipitates. Consequently, there is no real relationship between dissolved metal concentrations in surface water and total concentrations in sediment or suspended particles. A pragmatic solution, used in the manual for aquatic ecosystems is to apply a linear approach, according to:
(19) where:
Kd= partition coefficient between the total concentration of a heavy metal M in in suspended
particles and the dissolved concentration in surface water (m-3kg-1)
Reported Kdvalues are 430 for Pb and 85 for Cd (De Vries et al., 1998).
2.4.
Summary of the present approach
In general, a critical load is calculated by first selecting a receptor of interest, followed by the determination of a critical limit and then calculating a critical load (see the flow charts for calculating critical loads in the two manuals). Following this approach, the above mentioned approach for terrestrial ecosystems can be summarised as presented in the flow chart given in Figure 2-3. For terrestrial ecosystems, the most important point is to derive a critical limit, either directly (Table 2-3) or indirectly using various transfer functions. If this value is available, the assessment of a critical load is simple, as summarised in the Figure 2-3. For aquatic ecosystems, the figure can be simplified since a critical dissolved concentration can directly be derived from Table 2-6. The other parts remain the same, but the various fluxes are now given by Eqs.12-15 and in-lake metal retention has to be accounted for.
Figure 2-3: Flowchart describing the assessment of a critical load for terrestrial ecosystems
[M]sus tot, =Kd⋅[M]sw
define critical limit
Table 3 Eq. (8) + Table 4
Multiply with
water leaching flux Eq. (5)
Add uptake: Eq. (2) + Table 1 Subtract weathering: Eq. (3) + Table 2 Critical dissolved
concentration
Critical dissolved concentration
Critical load
Present 'so-called total' concentration (stand still) Critical reactive
2.5. Limitations in the present approach and possible future refinements
The guidance for the calculation of critical loads for cadmium and lead in terrestrial and aquatic ecosystems provided here is based on the following assumptions:• Critical limit values for terrestrial ecosystems are derived from statistical analysis of effects data on plants, microbiological processes and soil invertebrates. Secondary poisoning, including human health aspects, is not considered. For agricultural systems, we do not include criteria with respect to food quality that can be back calculated to soil quality criteria.
• Critical and still loads can be calculated on the basis of a steady-state effect-based or stand-still approach respectively. For terrestrial ecosystems this implies that the critical load calculations will either be rather independent of the soil (the effect-based approach based on critical limits for dissolved metal concentrations) or always lead to the situation that critical loads are lower for clay and peat soils than for sandy soils (the effect-based approach based on critical limits for reactive metal concentrations and the stand-still approach), since the adsorption of metals is higher in clay and peat soils than in sandy soils. This seems counter-intuitive to the common belief of effects and is related to the fact that heavy metals in soil are far from equilibrium with metal inputs. Using a target load, however, the situation reverses. The calculation of a target load implies the use of a (simple) dynamic approach, including an acceptable net accumulation in the soil (based on the difference from background values of total contents to critical limits for total contents), according to the Eqs.7 and 8 in the Manual (De Vries
and Bakker, 1998) and considering the simplifications of this guidance5.
In general this guidance has to be further reviewed following the results of the first call for data. Also the discussions about critical limits and transfer functions are not yet finished, and an update is to be foreseen in the future (see also Annex I for an first update following the 12th CCE workshop
and the 18thTFM&M meeting in Italy (Sorrento, 14-19 April 2002).
References
Aldenberg T, Slob W (1991) Confidence limits for hazardous concentrations based on logistically
distributed NOEC toxicity data. Report 719102002, National Institute of Public Health and the
Environment, Bilthoven, The Netherlands, 21 pp.
Crommentuijn T, Polder MD, Van de Plassche EJ (1997) Maximum permissible concentrations and
negligible concentrations for metals, taking background concentrations into account. Report
601501 001, National Institute of Public Health and the Environment, Bilthoven, The Netherlands, 157 pp.
Curlík J, Sefvik P, Viechová Z (eds) (2000) Proceedings of an “Ad-hoc international expert group on effect-based critical limits for heavy metals”, Bratislava, Slovak Republic, 11–13 October 2000, 163 pp.
De Vries W, Bakker DJ, Sverdrup HU, Paces T, Tipping E (1997a) Effect-based approaches to
assess the risks of heavy metal inputs to soils. Overview of methods and models. In: Gregor et al.,
op. cit., pp.I125-I224.
5The 18thTask Force on Modelling and Mapping (Sorrento 2002) decided not to focus on the calculation of target loads


![Figure 2-3: Flowchart describing the assessment of a critical load for terrestrial ecosystems[M]sus tot,=Kd⋅[M]sw](https://thumb-eu.123doks.com/thumbv2/5doknet/3268511.21147/33.892.215.680.695.1036/figure-flowchart-describing-assessment-critical-load-terrestrial-ecosystems.webp)