PRE-OPERATIVE PLANNING FOR SHOULDER
ARTHROPLASTY
AN EVALUATION OF DIFFERENT PLANNING SOFTWARE SYSTEMS
Authors:
Tom Fourneau (01504970) Elias Van Haute (01503938)
Supervisors:
Prof. Dr. Lieven De Wilde Prof. Dr. Alexander Van Tongel Dr. Hans Van der Bracht
A dissertation submitted to Ghent University in partial fulfilment of the requirements for the degree of Master of Medicine in Medicine
Deze pagina is niet beschikbaar omdat ze persoonsgegevens bevat.
Universiteitsbibliotheek Gent, 2021.
This page is not available because it contains personal information.
Ghent University, Library, 2021.
Preface
Dear reader,
This thesis is the product of an enormous amount of work and effort. When I first read the subject of my master's thesis just over 20 months ago, I hadn't the slightest idea how immersed I would become in the field of 3D planning and 3D measurements in orthopedics, specifically in shoulder arthroplasty. However, at the end of this long period, I can say that I have achieved something special. I have not only expanded my knowledge in medicine and the orthopedic field, but in doing so, I have also contributed to an incredibly important research field with a potential huge clinical impact. After almost 5 years of studying medicine, it feels great to be able to say that I have finally done something useful, something that can impact patients in a direct way. Working on this thesis also taught me to always be assertive. Sometimes, it's important to be proactive, instead of waiting for others to act.
Now, as is the custom, I want to thank some people who supported and helped me over the past 20 months.
First and foremost, I want to thank Tom Fourneau, with whom I wrote this thesis. We both came into this project with the same amount of knowledge on the subject, being the bare minimum. We both set out to expand our knowledge. We read papers, we learned to work with 3D
reconstruction software, we attended shoulder arthroplasty procedures, ... Even though the collaboration was rough at times, I feel like we always complemented each other in a perfect way. Thank you Tom, for this whole project!
Second and equally important, I would like to thank our supervisors, Prof. Dr. Lieven De Wilde and Prof. Dr. Alexander Van Tongel. Not only did they give us an incredible opportunity when they allowed us to start this study, but they were there for us all the way. Whenever we had questions, when we did not understand parts of complex orthopedics, ... we could reach them. Furthermore, they were always open to come up with ideas to tackle problems we were having. It was great to see their enthusiasm while brainstorming and talking about this study and the progress we were making. Thank you, Prof. De Wilde and Prof. Van Tongel for always being enthusiastic about this study and our work!
Third, I would like to Thank Dr. Hans Van der Bracht, who helped us majorly in both the
theoretical and practical aspects of conducting a study. He helped us in gathering data, analyzing it and reporting it and he was always easy to reach. Thank you Dr. Van der Bracht, for being our guide!
Last but not least, I want to thank my parents, my friends and other family who supported me in these past 20 months. I could not have done this without you!
Elias Van Haute
Contents
Abstract ... 1
Samenvatting ... 2
1. Introduction ... 3
2. Materials and Methods ... 4
A. Three-dimensional reconstruction ... 4
B. Measurements by investigators ... 5
B.1. Determination of points and planes on the glenoid surface ... 5
B.2. Determination of the scapular reference plane and Cartesian coordinate system ... 6
B.3. Determination of the Spina scapular axis ... 7
C. Measurements by medical companies... 8
D. Statistical analysis ... 8
3. Results ... 8
A. Measurements by investigators ... 8
A.1. Intraobserver and interobserver variability ... 8
A.2. Descriptive statistics ... 9
B. Methods of medical companies ... 9
C. Measurements of companies ... 11
D. Comparison between investigators and companies ... 12
D.1. Inclination ... 12
D.2. Version ... 13
4. Discussion ... 14
A. Intra- and interobserver reliability ... 15
B. Inclination ... 16
B.1. IG-plane ... 16
B.2. Zimmer-Biomet ... 17
B.3. Materialise and Tornier-Wright ... 19
C. Version ... 19
D. Clinical Relevance ... 20
5. Conclusion ... 20
1
Abstract
Background: The correct placement of components in total shoulder arthroplasty and reverse shoulder arthroplasty is essential for a good outcome (optimal stability, optimal function, avoid complications, ...). In order to acquire optimal positioning of the components, previous studies have shown that preoperative planning in shoulder arthroplasty should be performed on 3D reconstructed glenoids. However, no consensus exists regarding the methods that can be used to perform these measurements. Over the past years, multiple medical companies have emerged who have each developed their own method of performing glenoid measurement.
Objectives: The purpose of this study was to compare multiple different methods used by different companies and the investigators and to determine whether or not they resulted in the same measurements for inclination and version of the glenoid.
Methods: CT-scans were made of 9 different cadavers, 17 shoulders were taken into account, 1 shoulder was excluded from this study. All CT-scans were sent to the companies who had agreed to participate in this study. Each company was expected to measure the glenoid inclination and version, using their self-developed methods. A survey was also sent to these companies, with questions regarding the method they used. Furthermore, measurements of these shoulders were performed by the researchers, using 2 different methods (IG-plane method and SM-plane method).
The measurements of inclination were then statistically analyzed, first by using a Friedman ANOVA test to determine statistically significant differences in measurements for inclination between all methods, followed by post-hoc Wilcoxon tests to determine differences in a pairwise manner. This was repeated for the version measurements.
Results: Statistical analysis of the measurements for inclination and version showed significant differences between almost all methods. However, this discrepancy was more prominent for inclination than for version. Out of 15 pairs, 10 pairs differed significantly for inclination (p<0.008). Only 4 pairs differed significantly for version (p<0.008).
Conclusion: The findings of this study did not support the hypothesis that the different methods would produce measurements that do not statistically differ. These differences were most prominent for inclination. This means however, that the components would be differently positioned in the same shoulder, depending on which company performed the pre-operative
2 measurements. This leads to believe that certain methods can be superior to others. Clinical relevance and reproducibility should be taken into account when deciding which method to use.
Samenvatting
Achtergrond: Een correcte positionering van de componenten bij TSA en RSA is essentieel voor een optimale uitkomst (optimale stabiliteit, optimale functie, vermijden van complicaties, …). Om optimale positionering van de componenten te bekomen, werd in vroegere studies aangetoond dat pre-operatieve planning moet gebeuren, gebruik makend van 3D reconstructies van het glenoid. Bij gebrek aan consensus omtrent de methodes die gebruikt moeten worden om deze metingen uit te voeren, zijn er verschillende medische bedrijven die elk hun eigen methode ontwikkeld hebben.
Doel: Het doel van deze studie bestond erin de methodes van de verschillende bedrijven met elkaar te vergelijken, met als doel het testen van de hypothese dat al deze methodes dezelfde resultaten bij meting zouden geven.
Methodes: Er werd gebruik gemaakt van 17 schouders van 9 verschillende kadavers. Elke schouder werd door elk bedrijf opgemeten, telkens gebruik makend van hun zelf ontwikkelde methode. Daarnaast werd aan elk bedrijf informatie gevraagd omtrent de methodes die ze gebruikten, om eventueel gevonden verschillen te verklaren. Bovendien werd door de onderzoekers elke schouder gemeten op twee verschillende manieren (IG-plane en SM-plane methodes).Voor statistische analyse werd gebruik gemaakt van een Friedman ANOVA test voor inclinatie en versie, gevolgd door post-hoc paarsgewijze vergelijking met Wilcoxon tests.
Resultaten: Na statistische analyse bleken er duidelijk statistisch significante verschillen te bestaan tussen de verschillende methodes. Deze waren vooral prominent voor inclinatie, maar ook opvallend aanwezig voor versie.
Conclusie: De hypothese dat de verschillende methodes geen statistisch significante verschillen zouden voortbrengen werd aldus verworpen. Rekening houdend met de belangrijke klinische gevolgen, kan er vanuit gegaan worden dat bepaalde methodes de voorkeur moeten genieten.
3
1. Introduction
TSA (total shoulder arthroplasty) and RSA (reverse shoulder arthroplasty) are both effective treatments for different types of shoulder pathology. They are useful in both pain relief as well as function repair.(1) A correct and accurate placement of the different components in both TSA and RSA is essential in achieving a good outcome. A correct positioning of the components is essential to 1) obtain good primary stability which ensures faster rehabilitation, 2) allow for optimal function and 3) avoid complications in TSA and RSA. Studies show that in TSA, an excessive retroversion and superior inclination are associated with higher frequencies of clinical failure.(2) Clinical failure is often a result of loosening of the components. This is determined by multiple risk factors, such as the implantation technique, glenoid component type, rotator cuff status and posterior subluxation of the humeral head. The latter can be explained by the eccentric force acting on the glenoid component which leads to the occurrence of “rocking horse” phenomenon.(1-5) Also, in RSA, an optimal component positioning is essential. An inferior position with slight inferior tilt (0-10°) is advised. Positioning the component too high will increase the risk of notching, instability and the occurrence of glenoid lucency.(5) Along with the insight and experience of the surgeon, they are the corner stone of the procedure, which leads to better outcome in both the short and long term.(1, 4, 6)
Multiple techniques are available to perform these measurements. Until recent years, 2 dimensional (2D) computed tomography (CT) was the standard imaging on which these measurements were performed.(2, 4, 7) The accuracy of this technique is strongly dependent on the relation between the scapular plane and the axis of the CT-scanner. This relation can vary greatly under the influence of the patient’s position and the in situ scapular orientation. This is alarming, given the fact that important preoperative decisions are made based on these measurements.(4)
Newly emerging modern imagine techniques and 3D technology that are available at present, give us the ability to convert a 2D CT-image into a 3D model. This model can be freely moved and positioned within the available software. As a consequence, the patient’s position within the CT-scanner and the in situ scapular position are no longer of any relevance. Thus, the 3D model can be oriented as such that the measurements can be performed in an accurate and reproducible manner.(1, 3, 4, 8, 9)
4 Most of the preoperative planning systems rely on the user to conduct the measurements manually on the 3D models. This process is often time-consuming and has a risk of user errors. In recent years, multiple medical companies that sell shoulder prosthesis have started to conduct this process, commissioned by the surgeon.(2) This raises the question whether or not these measurements are sufficiently accurate and whether or not they are easily reproducible. Multiple medical companies employ a self-developed technique in measuring inclination and version. The goal of this study is to make 1) a comparison between the measurements conducted by the different companies (using the same CT-scans), 2) to compare these measurements to the ones made manually by the investigators (also using the same CT-scans) and 3) try to explain possible differences based on different measurement techniques. Our hypothesis is that there will be no statistically significant differences between all the measurements (using the same CT-scans).
2. Materials and Methods
Bilateral CT-scans were acquired of 9 cadavers. No selection was performed based on the status of the shoulder joint. One shoulder was excluded based on the fact that a shoulder prosthesis was already present, bringing the total number of unique shoulder joints to 17. All 17 shoulders were considered as being completely independent from each other.
A. Three-dimensional reconstruction
A 3D reconstruction was performed for 17 unique shoulders in a commercially available program (Mimics; Materialise). The Mimics software constructs a 3D model of the imported CT-scans, with a preset range of Hounsfield Units (HU). This range had to be manually adjusted by the investigators to achieve accurate 3D models of the glenohumeral joint. After the construction of the 3D model, the wrap function in Mimics was used to smoothen out any holes or irregularities that still existed within the models. Then, all 3D models were exported to 3Matic (Materialise) to conduct the necessary measurements.
In order to determine multiple essential points, axes and planes; a variety of functions provided by the 3Matic software were utilised.
5
B. Measurements by investigators
Two methods were used by the investigators. The Inferior Glenoid circle method was chosen because it mainly uses the inferior part of the glenoid in the determination of the glenoid plane and doesn’t take the tuberculum superior into consideration. This allowed the investigators to compare methods that used different reference points to determine the glenoid plane. The Superior Max method was chosen, based on the fact that most of the companies also used this method or a method that was similar.
In addition, both methods have been proven to be reproducible with good intra- and interobserver reliabilities.(6)
B.1. Determination of points and planes on the glenoid surface
1. Inferior glenoid (IG) plane: the "mark" function was used to mark the antero-inferior glenoid rim (if necessary extended to also include the posterior rim, in case of distinct erosion of the anterior rim). The "mark"-function is used to mark all of the surface triangles that construct the 3D-structure. Subsequently the software was used to determine the mathematically best fitting circle for the marked structure. This circle was called the "inferior glenoid circle". The midpoint of the inferior glenoid circle was marked and given the name "IGm". The “Inferior glenoid plane” was defined in the software as the plane going through the midpoint “IGm”, parallel to the “inferior glenoid circle”, effectively constructing the plane that contains both the midpoint “IGm” aswell as the “inferior glenoid circle” as these two naturally lay in the same plane.(6)
2. Superior Max (SM) plane: the "mark" function was used to mark the entire glenoid surface. Subsequently the border of the marked surface was separated, and a best fitting circle was constructed on this border. This circle was called the “Superior Max circle” and its midpoint “SMm”. The “Superior Max plane” was defined in the software as the plane going through the midpoint “SMm”, parallel to the “superior max circle”, effectively constructing the plane that contains both the midpoint “SMm” as well as the “superior max circle” as these two naturally lay in the same plane.(6)
6
Fig. I
A: IG plane – best fit circle is constructed on the antero-inferior rim of the glenoid. B: SM plane – best fit circle is constructed on the entire glenoid rim
B.2. Determination of the scapular reference plane and Cartesian coordinate
system
The orientation of both the IG-plane and SM-plane is measured by using the scapular plane as a reference. The scapular plane is determined by 3 points: the centre of the glenoid circle, the most inferior point of the scapula (Sinf) and the most medial point of the scapula (trigonum scapulae). As the exact location of the trigonum scapulae is sometimes hard to determine in 3D models, the intersection between the extension of the spina scapulae and the medial border of the scapula was used. The scapular plane is unique for every type of glenoid plane, as every type of glenoid plane has its unique centre (IGm and SMm).
A Cartesian coordinate system was constructed specific for each glenoid with its origin in the midpoint (IGm or SMm for the inferior glenoid and superior max planes respectively) of the glenoid plane. The Y-axis was defined as the intersection of the glenoid plane and the scapular plane. The X-axis is constructed parallel to the glenoid plane and perpendicular to the Y-axis. The Z-axis is perpendicular to both the X-axis and the Y-axis.(6, 10)
7 Fig. II
A: determination of the 3 points constructing the scapular reference plan (Sinf, trigonum scap. and IGm/SMm). B: construction of the cartesian coordinate system with the glenoid centre (IGm/SMm) as origin. (example shown in B. uses the SM-plane method).
B.3. Determination of the Spina scapular axis
The Spina scapular axis (SSA) was defined as the line between the trigonum scapulae and the centre of the glenoid circle. As the SSA also utilises the centre of the glenoid circles, the SSA is unique for every type of glenoid circle.(6)
B.4. Measurements
Version and inclination measurements were obtained for all 17 unique shoulders, utilising both the IG- and the SM-plane. Version was defined as the angle between the Z-axis and the scapular plane. Anteversion was reported as a positive angle, while retroversion was reported as a negative angle.
Inclination was determined by calculating the complementary angle of the angle between the Y-axis and the SSA, e.g. if the angle between the Y-Y-axis and the SSA measures 84°, the complementary angle is calculated by subtracting this measurement from 90° (in this case: 90° -84° = 6° of inclination). Superior inclination was reported as a positive angle, while inferior inclination was reported as a negative angle.
8
C. Measurements by medical companies
Each company (Medacta, Materialise, Tornier-Wright, Zimmer-Biomet, Arthrex) was sent a questionnaire in which they were asked to specify the methods they used to perform the measurements. They were asked about the determination of the glenoid centre, the scapular plane, the transverse/axial plane (or SSA) and the reference points used on the glenoid plane. Arthrex was asked twice to partake in this study and they refused both times.
D. Statistical analysis
Version and inclination measurements were compared using the Friedman ANOVA test. Wilcoxon tests were applied post hoc to determine differences in a pairwise manner. Bonferroni corrections were applied to compensate for multiple comparisons.
For continuous, non-parametrically distributed outcome measures, intraobserver and interobserver reliability were assessed by intraclass correlation coefficients (ICC) based on 2-way mixed effect models, using an absolute agreement definition. Two independent investigators measured all 17 shoulders thrice, for both the IG-plane method and the SM-plane method. Statistical analysis was performed using the IBM SPSS 26 software.
3. Results
A. Measurements by investigators
A.1. Intraobserver and interobserver variability
Intra- and interobserver reliability were assessed by intraclass correlation coefficients. An ICC value <0.50 indicates a poor reliability, ICC values between 0.50 and 0.75 indicate moderate reliability, ICC values between 0.75 and 0.90 indicate good reliability and ICC values >0.90 indicate excellent reliability. These results are reported as “ICC value average measures (single measures)”.(11, 12)
The intraobserver reliability was excellent for both inclination and version using the IG-plane method, with ICC ranging from 0.901 to 0.971 (0.753 to 0.918) for inclination and from 0.942 to 0.947 (0.844 to 0.857) for version. The interobserver reliability was good for inclination and excellent for version with ICC 0.871 (0.772) and 0.930 (0.869) respectively using the IG-plane method.
9 The intraobserver and interobserver reliabilities were excellent for both inclination and version using the SM-plane method, with ICC ranging from 0.952 to 0.996 (0.936 to 0.989) for inclination and from 0.981 to 0.991 (0.944 to 0.972) for version.
A.2. Descriptive statistics
Descriptive statistics are presented as mean (95% confidence interval) and are displayed in Table II and Table III.
UGentIG: The mean inclination was 16.64° (13.28°,20°) and the mean version was -0.58° (-5.62°,4.46°).
UGentSM: The mean inclination was 6.28° (2.18°,10.38°) and the mean version was -1.24° (-6.4°,3.92°).
B. Methods of medical companies
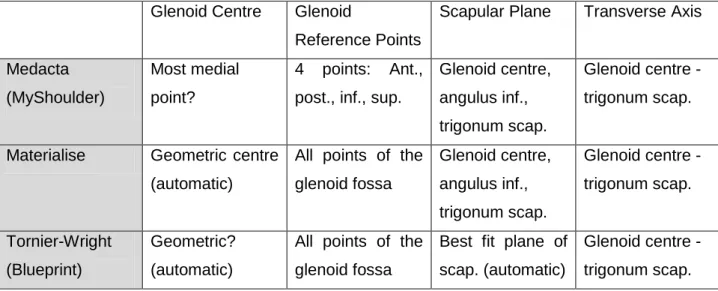
- Medacta (MyShoulder) use 4 points to determine the glenoid plane. These points are the most anterior, superior, posterior and inferior points on the glenoid. It is unclear which point is used to define the glenoid centre. Three points are used to identify the scapular plane: glenoid centre, the angulus inferior, and the trigonum scapulae. The transverse axis is defined as the axis between the glenoid centre and trigonum scapulae. This method is similar to the SM-method used by the investigators. However, the definition of the glenoid centre is different to the definition of the glenoid centre in the SM-method. This can have an influence on the position of the glenoid centre and the orientation of the transverse axis compared to the SM-method.
- Materialise: utilise an automated software to perform PSI planning. This software mathematically determines the best fitting glenoid plane based on all points included in the glenoid fossa. The glenoid centre corresponds to the geometrical centre of the glenoid and is automatically determined. The scapular plane is determined by using 3 scapular points: glenoid centre, angulus inferior and trigonum scapulae. The transverse axis is once again defined by using the glenoid centre and the trigonum scapulae. This method is similar to the SM-method used by the investigators. However, the definition of the glenoid centre is different to the definition of the glenoid centre in the SM-method. This can have an influence on the position of the glenoid centre and the orientation of the transverse axis compared to the SM-method.
10 - Tornier-Wright (Blueprint): utilise an automated software (Blueprint) to perform PSI planning. The software mathematically determines the best fitting glenoid plane based on all points included in the glenoid fossa. The glenoid centre is automatically determined by the software. It is unclear how Blueprint determines the centre, however it may be assumed that it corresponds with the geometrical centre. The scapular plane is also mathematically determined. The software uses all points of the scapula to construct a best fit plane. The transverse axis is determined by using the glenoid centre and the trigonum scapulae. This method is similar to the SM-method used by the investigators. However, the definition of the glenoid centre is different to the definition of the glenoid centre in the SM-method. This can have an influence on the position of the glenoid centre and the orientation of the transverse axis compared to the SM-method. The construction of the scapular plane is also different, as Blueprint constructs a best fitting plane on the entire scapula, while the SM-method constructs the scapular plane using 3 reference points (glenoid centre, trigonum scapulae and angulus inferior).
- Zimmer-Biomet (PSI Shoulder System): determine the glenoid plane by using 3 points: the anterior, superior and posterior points. The method used to determine the glenoid centre is unclear. It can be assumed the glenoid centre is determined by the intersection of the
anteroposterior and the inferosuperior axes. To determine the scapular plane, Zimmer-Biomet also use 3 points: the glenoid centre, the angulus inferior and the trigonum scapulae.
- Arthrex (VIP): Arthrex decided not to cooperate, thus they were not included in this study.
Table I Methods used by different companies and the investigators
Glenoid Centre Glenoid
Reference Points
Scapular Plane Transverse Axis
Medacta (MyShoulder)
Most medial point?
4 points: Ant., post., inf., sup.
Glenoid centre, angulus inf., trigonum scap.
Glenoid centre -trigonum scap.
Materialise Geometric centre (automatic)
All points of the glenoid fossa Glenoid centre, angulus inf., trigonum scap. Glenoid centre -trigonum scap. Tornier-Wright (Blueprint) Geometric? (automatic)
All points of the glenoid fossa
Best fit plane of scap. (automatic)
Glenoid centre -trigonum scap.
11
C. Measurements of companies
Descriptive statistics are presented as mean (95% confidence interval) and are displayed in Table II and Table III.
- Medacta: The mean inclination was 7.15° (2.95°,11.35°) and the mean version was -3.54° (-8.65°,1.57°).
- Materialise: The mean inclination was 5.38° (2.82°,7.94°) and the mean version was -1.15° (-6.13°,3.83°).
- BluePrint: The mean inclination was 10.31° (5.51°,15.11°) and the mean version was -1° (-6.2°,4.2°).
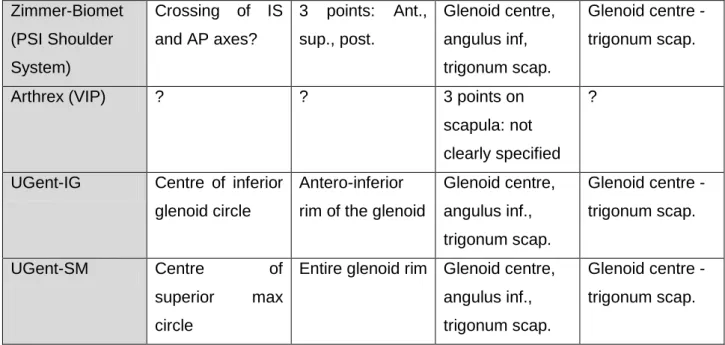
- Zimmer: The mean inclination was 0.38° 3.69°,4.45°) and the mean version was 0.54° (-3.77°,4.85°).
Table II Descriptive statistics for inclination
N
Mean
SD
Minimum
Maximum
UGent-IG
13
16,64°
3,36°
12°
22°
UGent-SM
13
6,28°
4,10°
-2°
12°
Medacta (MyShoulder)
13
7,15°
4,20°
-1°
15°
Materialise
13
5,38°
2,56°
-1°
11°
Tornier-Wright
13
10,31°
4,80°
0°
19°
Zimmer-Biomet (PSI Shoulder System) Crossing of IS and AP axes? 3 points: Ant., sup., post. Glenoid centre, angulus inf, trigonum scap. Glenoid centre -trigonum scap.Arthrex (VIP) ? ? 3 points on
scapula: not clearly specified
?
UGent-IG Centre of inferior glenoid circle
Antero-inferior rim of the glenoid
Glenoid centre, angulus inf., trigonum scap. Glenoid centre -trigonum scap. UGent-SM Centre of superior max circle
Entire glenoid rim Glenoid centre, angulus inf., trigonum scap.
Glenoid centre -trigonum scap.
12
(Blueprint)
Zimmer-Biomet
(PSI Shoulder System)
13
0,38°
4,07°
-10°
6°
Table III Descriptive statistics for version
D. Comparison between investigators and companies
D.1. Inclination
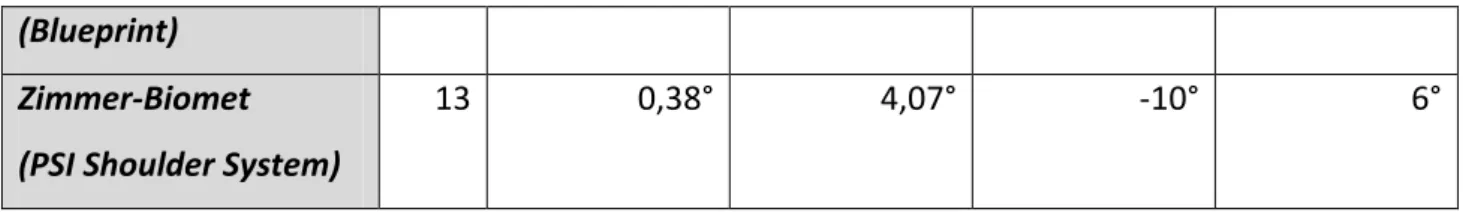
A total of 13 shoulders were taken into account when performing the Friedman ANOVA test for inclination, as 4 shoulders had incomplete data for 1 or more measurements. The Friedman test showed significant differences (P<0,001) in inclination measurements between the 6 methods used. 15 pairwise Wilcoxon post-hoc tests were performed. Bonferroni correction lowered the threshold P-value to 0,0083. P-values for each pair are displayed in Table IV.
Of the 15 pairwise Wilcoxon post-hoc tests, 10 resulted in a statistically significant outcome. A statistically significant difference was found when comparing UGent-IG pairwise with UGent-SM (p<0.001), Medacta (p<0.001), Materialise (p<0.001), Blueprint (p=0.008) and Zimmer-Biomet (p<0.001). Furthermore, comparison of UGent-SM with Zimmer-Biomet resulted in a statistically significant result (p<0.001), whereas comparison with Medacta (p=0.136), Materialise (p=0.224) and Blueprint (p=0.022) resulted in p-values > 0.0083 (thus being statistically insignificant). Comparing Medacta with Materialise (p=0.012) and Blueprint (p=0.021) also resulted in p-values > 0.0083, while the comparison with Zimmer-Biomet showed a statistically significant result
N
Mean
SD
Minimum
Maximum
UGent-IG
13
-0,58°
5,04°
-8°
9°
UGent-SM
13
-1,24°
5,16°
-9°
11°
Medacta (MyShoulder)
13
-3,54°
5,11°
-14°
7°
Materialise
13
-1,15°
4,98°
-11°
10°
Tornier-Wright
(Blueprint)
13
-1,00°
5,20°
-10°
10°
Zimmer-Biomet
(PSI Shoulder System)
13 (p<0.001). The pairwise comparison of Materialise to Blueprint and Medacta also resulted in a statistically significant difference, with p = 0.002 and p<0.001 respectively. The final pairwise Wilcoxon test compared Zimmer-Biomet and Blueprint. this also resulted in a statistically significant result with p = 0.001.
Table IV P-values obtained for inclination by performing post hoc Wilcoxon tests on 15 pairs of methods.
Method 1
Method 2
P-value
UGent-IG
UGent-SM
< 0,001Medacta (MyShoulder) < 0,001
Materialise < 0,001
Tornier-Wright (Blueprint) 0,008 Zimmer-Biomet (PSI Shoulder
System)
< 0,001
UGent-SM Medacta (MyShoulder) 0,136
Materialise 0,224
Tornier-Wright (Blueprint) 0,022 Zimmer-Biomet (PSI Shoulder
System)
< 0,001
Medacta (MyShoulder) Materialise 0,012
Tornier-Wright (Blueprint) 0,021 Zimmer-Biomet (PSI Shoulder
System)
< 0,001
Materialise Tornier-Wright (Blueprint) 0,002
Zimmer-Biomet (PSI Shoulder System)
< 0,001
Zimmer-Biomet (PSI Shoulder System)
Tornier-Wright (Blueprint) 0,001
D.2. Version
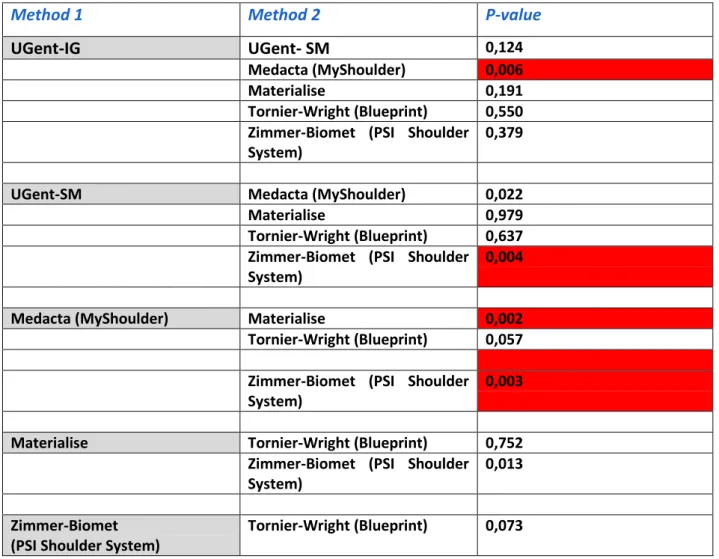
The Friedman ANOVA test for version also took 13 shoulders into account, as 4 shoulders had incomplete data for 1 or more measurements. The Friedman test showed significant differences (P=0,003) in version measurements between the 6 methods used. 15 pairwise Wilcoxon post-hoc tests were then performed to identify the pairs that presented statistically significant differences. Bonferroni correction was performed, which lowered the threshold P-value to 0,0083. P-values for each pair are displayed in Table V.
14 Of the 15 pairwise Wilcoxon post-hoc tests, 4 resulted in p-values < 0.0083. The comparisons between UGent-IG and Medacta (p=0.006), between UGent-SM and Zimmer-Biomet (p=0.004), between Medacta and Materialise (p=0.002) and between Medacta and Zimmer-Biomet (p=0.003) were the only 4 comparisons with a statistically significant outcome. All other comparisons resulted in p-values >0.0083.
Table V P-values obtained for version by performing post hoc Wilcoxon tests on 15 pairs of methods.
4. Discussion
The findings of this study did not support the hypothesis that the different methods would produce measurements that do not statistically differ. The biggest differences were observed in the inclination measurements, as the means ranged from 0,38° to 16,64°. The mean of 16,64° belongs to a method used by the investigators. Only taking the commercially available planning
Method 1
Method 2
P-value
UGent-IG
UGent- SM
0,124Medacta (MyShoulder) 0,006
Materialise 0,191
Tornier-Wright (Blueprint) 0,550 Zimmer-Biomet (PSI Shoulder
System)
0,379
UGent-SM Medacta (MyShoulder) 0,022
Materialise 0,979
Tornier-Wright (Blueprint) 0,637 Zimmer-Biomet (PSI Shoulder
System)
0,004
Medacta (MyShoulder) Materialise 0,002
Tornier-Wright (Blueprint) 0,057 Zimmer-Biomet (PSI Shoulder
System)
0,003
Materialise Tornier-Wright (Blueprint) 0,752 Zimmer-Biomet (PSI Shoulder
System)
0,013
Zimmer-Biomet (PSI Shoulder System)
15 systems in consideration, the inclination means still ranged from 0,38° to 10,31°. The differences in version measurements were more subtle, yet sometimes still statistically significant. The version means ranged from -3,54° to 0,54°.
These results can have serious implications when it comes to pre-operative planning. As many studies have shown, excessive inclination and/or retroversion in TSA results in more frequent clinical failure.(2, 13-15) Likewise in RSA, improper positioning of the glenoid components could result in worse outcome. (16, 17)
The fact that the inclination means range between 0,38° and 10,31° in commercially available systems is a cause for concern. Despite the fact that 3D measurements have proven to be more accurate than 2D measurements (4, 18), we can still observe a significant difference due to the different methods that are used.
As with all newly emerging technologies, it might be necessary to implement a worldwide standard to perform these measurements that is both easily reproducible and clinically relevant. In the meantime, it is important to take a closer look at why there is such a difference between the methods used.
A. Intra- and interobserver reliability
The intra- and interobserver reliability were excellent for almost all measurements performed. Interobserver reliability for inclination was good for the IG-plane method (0.871) and excellent for the SM-plane method (0.952).(11, 12) The slightly lower interobserver reliability for the IG-plane method can be explained by multiple factors. To determine the IG-plane, all points of the antero-inferior glenoid rim (in some cases extended to also include the posterior rim) were marked with a software function. All these points were concentrated in a relatively small area, compared to the entire glenoid rim used in the SM-plane method. Furthermore, it became apparent that 3D reconstructed CT-scans sometimes showed small artefacts on the glenoid. This is a result of the Hounsfield Unit (HU) threshold that was chosen while performing the 3D reconstructions. These small artefacts don’t have a lot of influence on the measurements when you take the entire glenoid rim into consideration (in the SM-plane method) as the entire glenoid rim is large enough to cancel out these irregularities when you construct a mathematically best fitting circle. In the IG-plane method, these artefacts can have a bigger influence on the mathematically best fitting circle, as the antero-inferior rim is a relatively small surface area. A correction for this problem was performed by extending the marked area to include the posterior glenoid rim, when necessary. Nevertheless, this method remains very reproducible.
16 The interobserver reliability for version was excellent for both the IG-plane method (0.930) and the SM-plane method (0.983). The explanation for the slightly lower interobserver reliability of the IG-plane method is completely equivalent.
B. Inclination
The results of the post hoc Wilcoxon tests for inclination measurements show a statistically significant difference between:
1) IG-plane vs. all other methods 2) Zimmer-Biomet vs. all other methods 3) Materialise vs. Tornier-Wright
The biggest culprits for the observed differences are the IG-plane method and the method used by Zimmer-Biomet. When there is a significant difference in inclination measurements, the differences can be due to a difference in the transverse axis, a difference in the glenoid plane, or both. Both methods use the same transverse axis for the inclination measurements (glenoid centre – trigonum scapulae). Thus, the observed differences can best be explained by the different methods used to determine the glenoid plane. The differences between Materialise and Tornier-Wright have to be explained differently, as they use the same method to construct the glenoid plane.
B.1. IG-plane
The IG-plane had the largest mean inclination in this study at 16,64°. It is constructed on the antero-inferior rim of the glenoid with a best fit circle. This results in a plane that isn’t influenced by the prominent bony structure that is the tuberculum superior. All other methods in this study take the tuberculum superior into account when constructing the glenoid plane. The concave shape of the glenoid has as a result that a plane constructed on the inferior half of the glenoid, naturally has more inclination than a plane constructed on the entire glenoid (Fig III). Adding the prominence of the tuberculum superior, it quickly becomes clear why the observed differences in inclination are so large.
17 Fig. III: when constructing a plane on a concave glenoid, there is an observable difference of x° in inclination between a plane constructed on the inferior half and a plane constructed on the entire glenoid. (simplified)
A second contributing factor to the differences observed, is a direct result of the methods used to construct the glenoid plane. As the tuberculum superior is left out of consideration, the centre of the glenoid circle will naturally be located a bit lower compared to the methods using the entire glenoid. The inclination measurements are performed using the transverse axis as a reference, and this axis is partly determined by the position of the glenoid centre.
A lower glenoid centre will tilt the transverse axis in such a way that the angle between the transverse axis and the glenoid plane decreases. Thus, the measured inclination will increase.
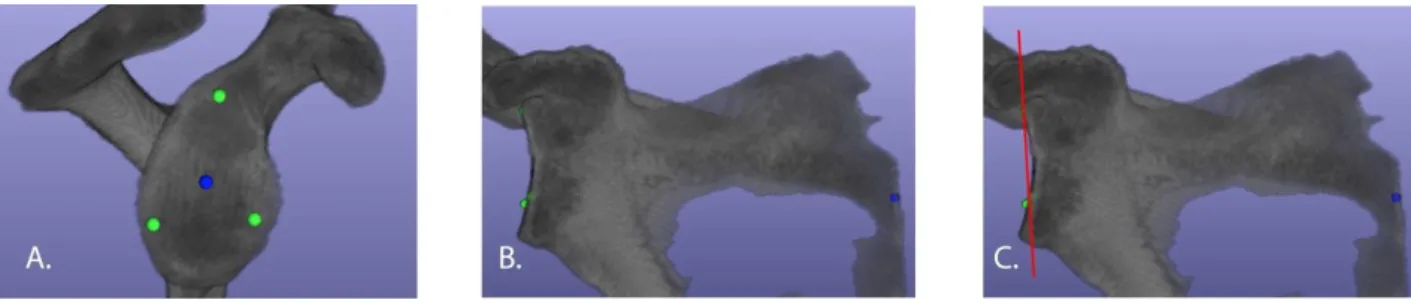
B.2. Zimmer-Biomet
Zimmer-Biomet (PSI Shoulder System) inclination was the lowest of all the methods in this study, with a mean of 0,38°. They provided the researchers with screenshots of every shoulder they performed measurements on, showcasing the method they used. 3 points are used to construct the glenoid plane: an anterior, posterior and superior point on the glenoid. While observing these
18 screenshots, it became clear that their method is the only one in which a part of the inferior glenoid rim was left out of consideration. The inferior rim however, can often times be quite prominent, much like the tuberculum superior, which Zimmer-Biomet does take in consideration.
Fig IV: screenshots provided by Zimmer-Biomet showcasing the reference points used for their measurements on the glenoid (A and B). When drawing a simplified plane through the 3 points on the glenoid rim (C), the inferior rim remains exposed and the plane has less inclination than the methods using the entire glenoid (or the inferior half of the glenoid).
Fig. V: when constructing a plane on a concave glenoid, there is an observable difference of y° between the methods used by Zimmer-Biomet and the methods using the entire glenoid. (simplified)
Similar to what was observed in the IG-plane method, we can describe a second contributing factor to the observed differences. As the inferior rim is left out of consideration, the mathematical centre of the glenoid will naturally be located a bit higher compared to the methods using the
19 entire glenoid. The inclination measurements are performed using the transverse axis as a reference, and this axis is partly determined by the position of the glenoid centre.
A higher glenoid centre will tilt the transverse axis in such a way that the angle between the transverse axis and the glenoid plane increases. Thus, the measured inclination will decrease.
B.3. Materialise and Tornier-Wright
Materialise and Tornier-Wright (Blueprint) were the only pair that showed statistically significant differences in inclination measurements, apart from pairs with Zimmer-Biomet or the IG-plane. Materialise had a mean inclination of 5,38°, while Blueprint had a mean inclination of 10,31°. This is unusual, as both companies use the same method to determine the glenoid plane and the reference transverse axis. The only difference between the two companies is that Blueprint is entirely automated. As other studies have suggested, the automatic 3D reconstruction of the glenoid can sometimes be inaccurate. The humeral head needs to be substracted from the CT scans in order to reconstruct the glenoid. Often times the humeral head is not completely substracted from the glenoid fossa, leaving extra bony fragments on the glenoid surface, which can in turn influence the measurements. Conversely, the humeral head substraction can be excessive, resulting in gaps in the glenoid surface.(2) In this study however, only 1 of 13 glenoids was found to be reconstructed improperly. The differences observed between Materialise and Blueprint might be due to the proprietary algorithms used to determine the mathematical best fitting glenoid plane and/or the transverse axis.
C. Version
After comparing all the different methods in a pairwise manner, only 4 significantly different pairs were found. Only one of these pairs (SM-plane and Zimmer-Biomet) did not include Medacta. The significant difference between SM-plane and Zimmer-Biomet may be explained by the points used in the determination of the glenoid plane. The method used by Zimmer-Biomet does not include a point on the inferior glenoid rim. This means that the glenoid plane determined by Zimmer, does not take into account the angulation of the inferior rim. This may influence the measurements of glenoid version.
All other significant results of the pairwise comparisons for version involved Medacta. Medacta differed significantly from IG-plane (p=0.006), Materialise (p=0.002) and Zimmer-Biomet
20 (p=0.003). As IG-plane, Zimmer-Biomet and Medacta use the same 3 points to define the scapular plane (glenoid centre, trigonum scapulae, inferior scapular point), it can be assumed that the explanation for these differences must lie in the way that the glenoid centre is determined. The method used by Medacta is unclear, but states that the glenoid centre corresponds to the deepest or most medial point of the glenoid fossa. In order for this method to be reproducible, a certain consistency is required regarding the position of this most medial point in the glenoid fossa. One theory states that there might be a tendency for these medial points to be positioned towards the anterior part of the glenoid, resulting in higher retroversion measurements. However, no literature on the subject of glenoid fossa morphology was found to support this claim.
D. Clinical Relevance
Given the clinical consequences of these measurements, it is equally important to look at the clinical relevance of the different methods. A very important factor in this matter, is the eventual shoulder arthroplasty performed, based on these measurements. During the procedure, the inferior part of the glenoid is used as the main anchor point for the prosthesis. Thus, it would seem logical to use methods that take into account the inferior rim of the glenoid. As a consequence, the method used by Zimmer-Biomet might be less suitable for pre-operative 3D planning, whereas the IG-plane method would be more appropriate. However, literature shows that this may vary depending on the performed procedure (TSA or RSA).(19)
5. Conclusion
This study shows that the wide variety of methods used by different companies and institutions, results in significantly differing measurements for glenoid inclination and version. The most notable differences were found in the measurement of inclination. These differences were less spectacular in the comparisons of version measurements, but still present. Given the major consequences these measurements have on the eventual arthroplasty, it is clear that a more refined and universally used method is required. Literature supports the claim that this method should be an inferior glenoid based method, given the clinical relevance of the inferior glenoid. Generally, it is clear that more research is required on this matter.
21
6. References
1. Jacxsens M, Van Tongel A, Henninger HB, Tashjian RZ, De Wilde L. The three-dimensional glenohumeral subluxation index in primary osteoarthritis of the shoulder. J Shoulder Elbow Surg. 2017;26(5):878-87.
2. Denard PJ, Provencher MT, Ladermann A, Romeo AA, Parsons BO, Dines JS. Version and inclination obtained with 3-dimensional planning in total shoulder arthroplasty: do different programs produce the same results? JSES Open Access. 2018;2(4):200-4.
3. Jacxsens M, Van Tongel A, Willemot LB, Mueller AM, Valderrabano V, De Wilde L. Accuracy of the glenohumeral subluxation index in nonpathologic shoulders. J Shoulder Elbow Surg. 2015;24(4):541-6. 4. Budge MD, Lewis GS, Schaefer E, Coquia S, Flemming DJ, Armstrong AD. Comparison of standard two-dimensional and three-dimensional corrected glenoid version measurements. J Shoulder Elbow Surg. 2011;20(4):577-83.
5. Karelse A, Van Tongel A, Verstraeten T, Poncet D, De Wilde LF. Rocking-horse phenomenon of the glenoid component: the importance of inclination. J Shoulder Elbow Surg. 2015;24(7):1142-8.
6. Verstraeten TR, Deschepper E, Jacxsens M, Walravens S, De Coninck B, De Wilde LF. Operative guidelines for the reconstruction of the native glenoid plane: an anatomic three-dimensional computed tomography-scan reconstruction study. J Shoulder Elbow Surg. 2012;21(11):1565-72.
7. Daggett M, Werner B, Gauci MO, Chaoui J, Walch G. Comparison of glenoid inclination angle using different clinical imaging modalities. J Shoulder Elbow Surg. 2016;25(2):180-5.
8. Scalise JJ, Codsi MJ, Bryan J, Brems JJ, Iannotti JP. The influence of three-dimensional computed tomography images of the shoulder in preoperative planning for total shoulder arthroplasty. J Bone Joint Surg Am. 2008;90(11):2438-45.
9. Jacxsens M, Karns MR, Henninger HB, Drew AJ, Van Tongel A, De Wilde L. Guidelines for humeral subluxation cutoff values: a comparative study between conventional, reoriented, and three-dimensional computed tomography scans of healthy shoulders. J Shoulder Elbow Surg. 2018;27(1):36-43. 10. Verstraeten TR, Deschepper E, Jacxsens M, Walravens S, De Coninck B, Pouliart N, et al. Determination of a reference system for the three-dimensional study of the glenohumeral relationship. Skeletal Radiol. 2013;42(8):1061-71.
11. Koo TK, Li MY. A Guideline of Selecting and Reporting Intraclass Correlation Coefficients for Reliability Research. J Chiropr Med. 2016;15(2):155-63.
12. Erratum to "A Guideline of Selecting and Reporting Intraclass Correlation Coefficients for Reliability Research" [J Chiropr Med 2016;15(2):155-163]. J Chiropr Med. 2017;16(4):346-.
13. Hasan SS, Leith JM, Campbell B, Kapil R, Smith KL, Matsen FA, 3rd. Characteristics of unsatisfactory shoulder arthroplasties. J Shoulder Elbow Surg. 2002;11(5):431-41.
14. Ho JC, Sabesan VJ, Iannotti JP. Glenoid component retroversion is associated with osteolysis. J Bone Joint Surg Am. 2013;95(12):e82.
15. Young AA, Walch G, Pape G, Gohlke F, Favard L. Secondary rotator cuff dysfunction following total shoulder arthroplasty for primary glenohumeral osteoarthritis: results of a multicenter study with more than five years of follow-up. J Bone Joint Surg Am. 2012;94(8):685-93.
16. Falaise V, Levigne C, Favard L. Scapular notching in reverse shoulder arthroplasties: the influence of glenometaphyseal angle. Orthop Traumatol Surg Res. 2011;97(6 Suppl):S131-7.
17. Gutierrez S, Walker M, Willis M, Pupello DR, Frankle MA. Effects of tilt and glenosphere
eccentricity on baseplate/bone interface forces in a computational model, validated by a mechanical model, of reverse shoulder arthroplasty. J Shoulder Elbow Surg. 2011;20(5):732-9.
18. Hoenecke HR, Jr., Hermida JC, Flores-Hernandez C, D'Lima DD. Accuracy of CT-based
measurements of glenoid version for total shoulder arthroplasty. J Shoulder Elbow Surg. 2010;19(2):166-71.
19. Boileau P, Gauci MO, Wagner ER, Clowez G, Chaoui J, Chelli M, et al. The reverse shoulder arthroplasty angle: a new measurement of glenoid inclination for reverse shoulder arthroplasty. J Shoulder Elbow Surg. 2019;28(7):1281-90.