Progress in the modelling of critical
thresholds, impacts to plant species diversity
and ecosystem services in Europe
CCE Status Report 2009
J-P. Hettelingh, M. Posch, J. Slootweg (eds.)
wge
of theof theWorking Group on Effects
Convention on Long-range Transboundary Air Pollution
Convention on Long-range Transboundary Air Pollution ICP M&M Coordination Centre for Effects
Progress in the modelling of critical thresholds, impacts to plant species diversity and ecosystem services in Europe :
CCE Status Report 2009 Report 500090004/2009
J-P. Hettelingh, M. Posch, J. Slootweg (eds.) Contact: karin.vandoremalen@pbl.nl ISBN: 978-90-78645-32-0
This research has been performed by order and for the account of the Directorate for Climate Change and Air Quality of the Dutch Ministry of Housing, Spatial Planning and the Environ-ment within the framework of PBL project M/500090, “Coordination Centre for Effects (CCE)”; for the account of the European Commission LIFE III Programme within the frame-work of PBL project E/555065 “European Consortium for Modelling Air Pollution and Climate Strategies (EC4MACS)” and for the account of (the Working Group on Effects within) the trust fund for the partial funding of effect-oriented activities under the Convention on Long-range Transboundary Air Pollution.
© CCE 2009
Parts of this publication may be reproduced provided that reference is made to the source. A comprehensive reference to the report reads as ‘Hettelingh JP, Posch M, Slootweg J (eds.) (2009) Progress in the modelling of critical thresholds, impacts to plant species diversity and ecosystem services in Europe : CCE Status Report 2009, Coordination Centre for Effects, ,
Contents 5
Contents
Acknowledgement 7
Context and Summary 9
Progress in the modelling of critical thresholds, impacts to plant species diversity and ecosystem services in Europe: CCE Status Report 2009 9
Rapport in het kort 11
Vooruitgang in de modellering van kritische drempels, effecten op de rijkdom van plantensoorten en ecosysteemdiensten in Europa: CCE Status Rapport 2009. 11
Part 1 Integrated assessment 13
1 Effect-oriented assessment of the 2009 PRIMES BaseLine Scenario 15
Jean-Paul Hettelingh, Maximilian Posch, Jaap Slootweg 1.1 Introduction 15
1.2 Impact assessment methodology 15
1.3 The risks of acidification and eutrophication in Europe 16 1.4 Risk of acidification and eutrophication in Natura 2000 areas 25 1.5 Uncertainty in assessments of impacts on biodiversity 26 1.6 Summary and conclusions 29
2 Status of the harmonised European land cover map 31
Jaap Slootweg, Maximilian Posch, Allard Warrink 2.1 Introduction 31
2.2 Update of the harmonised European land cover map 31 2.3 European Background Database of critical loads 33 2.4 Conclusions 33
3 Modelling recovery from soil acidification in European forests under climate change 35
Gert Jan Reinds, Maximilian Posch, Rik Leemans 3.1 Introduction 35
3.2 Methods and data 35 3.3 Results 37
3.4 Conclusions 39
4 Quantifying relationships between N deposition and impacts on forest ecosystem services 43
Wim de Vries, Maximilian Posch, Gert Jan Reinds, Jean-Paul Hettelingh 4.1 Introduction 43
4.2 Quantification of the link between nitrogen deposition and ecosystem services 44 4.3 Results 47
4.4 Conclusions and Outlook 52
Part 2 Dynamic modelling 55
5 Developing a method for estimating critical loads of nitrogen deposition
under a changing climate, based on biological indicators 57
Salim Belyazid, Daniel Kurz, Harald Sverdrup, Sabine Braun, Beat Rhim 5.1 Introduction 57
5.2 Aims of the study 57 5.3 Method 57
5.4 Results 61
5.5 Estimating a Critical Load of Nitrogen (CLN) 64 5.6 Conclusions 65
6 Dynamic modelling of effects of deposition on carbon sequestration
and nitrogen availability: VSD plus C and N dynamics (VSD+) 69
Luc Bonten, Janet Mol, Gert Jan Reinds 69 6.1 Introduction 69
6.2 C and N in the VSD model 69
6.3 Incorporating C and N dynamics in VSD 70 6.4 Application of the VSD+ model 73 6.5 Future developments 73
Part 3 Options to further quantify effect indicators 75
7 A Red-List-based biodiversity indicator and its application
in model studies in the Netherlands 77
Han van Dobben, Wieger Wamelink 77 7.1 Diversity indices 77
7.2 Biodiversity 77
7.3 Biodiversity in the context of atmospheric deposition 78 7.4 Elaboration of vascular plants in the Netherlands 79 7.5 Prediction of biodiversity in scenario studies 80 7.6 Discussion 81
8 Assessment of the effects of top-soil changes on plant species
diversity in forests, due to nitrogen deposition 83
Martin Jenssen 8.1 Introduction 83 8.2 Method 83 8.3 Data 86 8.4 Results 87 Appendix 91
9 A single metric for defining biodiversity damage using Habitats Directive criteria 101
EC Rowe, BA Emmett, SM Smart 9.1 Introduction 101 9.2 Methods 102 9.3 Results 103 9.4 Discussion 105 9.5 Conclusions 106
Part 4 Current knowledge on empirical critical loads 109
10 Empirical N critical loads for Europe: is an update and review needed? 111
Roland Bobbink 10.1 Introduction 111
10.2 Empirical N critical loads 112
10.3 Update and review of empirical N critical loads 113 10.4 Concluding remarks 115
References 115
11 New results on critical loads of nitrogen in Central Europe 117
Sabine Braun, Walter Flückiger 117 11.1 Introduction 117
11.2 Non-forest ecosystems 117 11.3 Forest ecosystems 118
11.4 Conclusions and recommendations 124 11.5 Acknowledgements 125
12 New results on critical loads of nitrogen in Northern Europe 127
Annika Nordin 127 12.1 Conclusions 128
Acknowledgement 7 The methods and results presented in this report are the
product of close collaboration within the Effects Programme of the UNECE Convention on Long-range Transboundary Air Pollution, involving many institutions and individuals throughout Europe. Participants in the Effects Programme and National Focal Centres of the ICP Modelling and Mapping are acknowledged for their commitment and contributions to the work of the Coordination Centre for Effects (CCE). In particular, the CCE acknowledges:
The Directorate for Climate Change and Air Quality of the Dutch Ministry of Housing, Spatial Planning and the Environment, and Mr J. Sliggers in particular, for their continued support,
The Working Group on Effects, Task Force of the International Co-operative Programme on the Modelling and Mapping of Critical Levels and Loads and Air Pollution Effects, Risks and Trends, in particular, for their collaboration and assistance,
The EMEP Meteorological Synthesizing Centres East and West and the EMEP Centre for Integrated Assessment at the International Institute for Applied Systems Analysis, for their collaboration in the field of atmospheric dispersion and integrated assessment modelling,
The UNECE secretariat of the Convention on Long-range Transboundary Air Pollution, for its valuable support, including the preparation of official documentations, The European Commission’s LIFE III Programme, for
co-funding the participation of the CCE in the European Consortium for Modelling Air pollution and Climate Strategies (EC4MACS),
The Nature and Biodiversity Unit of the European Commission’s Environment Directorate-General, for supporting the availability of data on Natura 2000 areas. The CCE management assistant, Karin van Doremalen, for
overseeing the institutional routing and printing and copy editing, Annemieke Righart, editor at the Netherlands Environmental Assessment Agency, for English-language editing of the chapters, Wilco de Vries and Joost van Wollingen, and Martin Middelburg of the RIVM’s graphics department for the design and lay-out of this report.
Acknowledgement
Context and Summary 9
Progress in the modelling of critical thresholds,
impacts to plant species diversity and ecosystem
services in Europe: CCE Status Report 2009
The CCE Status Report 2009 addresses the progress made in completing knowledge on effects of air pollution in Europe, with interactions involving the change in climate and biodiversity. It further strengthens the logic of the Executive Body at its 25th session (2007) with the request to the Working
Group on Effects ” to consider further quantification of policy relevant effect indicators such as biodiversity change, and to link them to integrated modelling work”.
It is useful for understanding the objective of the CCE SR 2009 report and answers to the question on how to further develop the modelling and mapping work in support of integrated modelling, to put the call of the Executive Body in the context that air pollution and the change of climate and biodiversity are interrelated.
There is a well established awareness of interactions at the starting points of the source-receptor chain, between sources and emissions of greenhouse gas and air pollution. Growing policy attention in general, and in the LRTAP Convention in particular, is paid to the fact that some particles offset, and others reinforce, global warming, while fine airborne particles have an additional and well-established adverse effects on human health (see also www.ircg.org). Other source-related linkages are established between emissions of nitrous oxide with its ozone-depleting potential which, if the emissions are left unchecked, will further increase anthropogenic forcing of the climate system (see Ravishankara, 2009, Science 326:123-125).
Interactions between climate change and air pollution are also important for the endpoints of the source-receptor chain. A well-known example of such interaction is that between nitrogen deposition, which is excessive on most of European nature, and carbon sequestration. Elevated nitrogen deposition can lead to enhanced growth of forests, and thus to increased carbon sequestration, as long as the receptors are nitrogen limited (De Vries et al., 2009, Forest Ecology and Management 258: 1814-1823). This direct link is of widely recognised importance to policies on greenhouse gas reduction to meet the target of 450 ppmv CO2. However,
the impact of nitrogen on carbon sequestration may be unfavourable for peatlands, even to the extent where it is not
unlikely that existing peatland carbon stocks are released to the atmosphere.
Knowledge needs to be strengthened of synergies and antagonisms between endpoint related processes that are relevant for policies that wish to include nitrogen deposition levels as a measure to mitigate climate change. For this, also indirect linkages need to be understood. Such policies thus involve the requirement not to affect interactions between air quality and endpoints for soil chemistry, biodiversity and ecosystem services that sustain human welfare. Atmospheric pollution in general, and nitrogen deposition in particular cause adverse effects to biodiversity. Recently, Turner et al. (Nature 462:278-279, 19 November 2009) wrote “If human adaptation to climate change compromises biodiversity, then the loss of forests and other natural ecosystems will accelerate climate change, increasing the need for adaptation even as the planet’s capacity to accommodate it diminishes”. The adverse effects of air pollution on the provisioning, regulating and supporting services of nature can only amplify this risk.
Following the request by the Executive Body a two track approach has been adopted under the ICP Modelling and Mapping, converging in robust effect-based components for integrated assessment. The first track is model based. It complements the modelling of soil chemistry and critical loads with the dynamic modelling of the change in plant-species diversity. For this the CCE draws on the collaboration with Alterra (www.alterra.wur.nl) in a project co-funded by the Netherlands Environmental Protection Agency since 2007. Other work under the ICP M&M includes the development of the ForSAFE-veg model co-funded by the Swiss Federal Office for the Environment (BAFU), the Swedish Environmental Protection Agency (Naturvårdsverket) and the CCE. The second track involves the regionalisation within the ICP M&M of empirical, site specific, knowledge about nitrogen effects on biodiversity.
Progress regarding both tracks was presented at the 18th
CCE Workshop in Berne (21-23 April 2008) and the 19th CCE
Workshop in Stockholm (11-13 May 2009).
The authors of the presentations at the Stockholm workshop kindly agreed to contribute to the present report.
The CCE Status Report 2009 consists of four parts. Parts 1 and 2 focus on modelling methodologies, while Parts 3 and 4 address empirical knowledge on the effects of nitrogen deposition.
Part 1 “Integrated Assessment” focuses on current and new effect-based contributions to integrated assessment modelling. Chapter 1 describes the analysis of the effects of emissions in 2000, 2020 and 2030 according to a draft baseline scenario, of which depositions were compiled by EMEP-CIAM in November 2009 and made available to the CCE. It includes an overview of the use of currently available methods and data under the ICP M&M for assessing the current state and future risk of acidification and
eutrophication in European nature, including Natura2000 areas. Results show that the risk of eutrophication in particular is widespread in terms of critical load exceedance, expected time delays of recovery and, tentatively, changes of species richness. The draft baseline scenario was only used in Chapter 1. In other chapters use was made of the so-called Current Legislation scenario that has been more widely available over a longer period of time. Chapter 2 describes the current state according to the land cover map which has been compiled by the CCE in collaboration with the Stockholm Environment Institute (SEI) in support of the modelling of atmospheric dispersion by EMEP and effects under the Working Group on Effects. Chapter 3 illustrates the current capability of the Very Simple Dynamic (VSD) model to analyse recovery from acidification under climate change. Results confirm that climate change can reinforce recovery of acidified forest soils in Europe. Finally, Chapter 4, provides a quantification of the impacts of nitrogen deposition on forest ecosystem services, such as the regulation of climate, water quality and quantity and soil quality. It is shown that the reduction in nitrogen deposition since 1980 has had a positive effect on biodiversity, and on the quality of soil and water, and a negative effect on global warming.
Part 2 “Dynamic Modelling” consists of two chapters that address the progress in the development of dynamic modelling to capture the interaction between nitrogen deposition and the change of climate and biodiversity. Chapter 5 presents results of a pilot study showing that it is possible to simulate the relationship between nitrogen deposition and the ensuing composition of the plant community while keeping track of the change of climate and land use. Chapter 6 focuses on the extension of the Very Simple Dynamic (VSD) model, currently widely used by National Focal Centres, to include carbon and nitrogen dynamics. This extended model, termed ‘VSD+’, is designed to limit the data requirements needed by National Focal Centres to simulate vegetation responses to changes in nitrogen deposition.
Part 3 “Options to further quantify effect indicators” includes three chapters each addressing indicators that could be suitable for capturing the change in biodiversity under the LRTAP Convention in a way that is understandable for policy makers and the general public, and that could attach to air pollution the attention it deserves in biodiversity policy. Chapter 7 proposes to generalise the criteria behind the
In Chapter 8 a distance measure between physically and potentially available plant species is discussed as possible indicator for nitrogen-induced changes of plant species diversity. In Chapter 9 an approach is explored to interpret habitat suitability predictions using lists of predefined indicators that are rare and typical as well as indicators that are untypical and invasive of a habitat.
Part 4 “Current knowledge on empirical critical loads” addresses new knowledge that confirms the need to review and revise empirical critical loads that have been established in 2002. Empirical critical loads are used to reduce the uncertainty of model assessments of areas at risk of nitrogen deposition, while improving the understanding of the role of biology. An overview of the need for revision is provided in Chapter 10 while findings focussing on central and northern Europe are described in Chapters 11 and 12 respectively. A contribution addressing nitrogen effects in southern Europe is available as powerpoint presentation for the 19th CCE workshop (www.
pbl.nl/cce).
As a result the CCE has started an international project in the autumn of 2009 in collaboration with the Swiss Federal Office for the Environment (BAFU) and the German Umweltbundesamt (UBA). Together with these international institutions, the Dutch Ministry of Housing, Spatial Planning and the Environment (VROM) and the National Institute for Public Health and the Environment (RIVM), the CCE organises in the UN international year of biodiversity 2010, a workshop under the LRTAP Convention entitled “Workshop for the review and revision of empirical critical loads and dose response relationships” (Noordwijkerhout, 23-25 June 2010) to finalize a comprehensive report to the 29th session of the
Working Group on Effects under the LRTAP Convention. Key words: Acidification, air pollution effects, biodiversity, climate change, critical loads, dose−response relationships, dynamic modelling, ecosystem services, eutrophication, exceedance, LRTAP Convention.
Rapport in het kort 11
Vooruitgang in de modellering van kritische drempels,
effecten op de rijkdom van plantensoorten en
ecosysteemdiensten in Europa: CCE Status Rapport
2009.
Het CCE Status Rapport 2009 beschrijft de vooruitgang in de analyse van effecten van luchtverontreiniging en de interacties met de verandering van het klimaat en biodiversiteit. Het rapport past in de methodeontwikkeling die nodig is om te voldoen aan het verzoek van de Executive Body van de Conventie voor Grensoverschrijdende
Luchtverontreiniging (LRTAP) tijdens zijn 25e zitting
(2007) aan de Working Group on Effects om, voor gebruik in geïntegreerde modellering, meer beleidsrelevante indicatoren te ontwikkelen voor effecten op bijvoorbeeld de biodiversiteit.
Het CCE Status Rapport 2009 sluit aan bij de toenemende bewustwording bij beleidsmakers en wetenschappers dat uitputting van het bufferend vermogen van de natuur door luchtverontreiniging gevolgen kan hebben voor de verandering van, en terugkoppelingen met, klimaat en biodiversiteit. De Verenigde Naties hebben 2010 uitgeroepen tot jaar van de biodiversiteit. De analyse van de rol van – en effecten op de ecosysteemdiensten voor het menselijk welzijn krijgt daarbij toenemende aandacht, en zo ook in dit rapport.
Het rapport bestaat uit 4 delen waarin wetenschappers die betrokken zijn bij de Working Group on Effects bijdragen leveren op het gebied van de empirie en de modellering van (in-) directe effecten van stikstofdepositie op bodemprocessen en de diversiteit van plantensoorten in Europa. Deze bijdragen zijn een weergave van de
wetenschappelijke voordrachten tijdens de 19e CCE workshop
(Stockholm, 11-13 mei 2009).
Deel 1 “Integrated Assessment” gaat ondermeer in op nieuwe modelontwikkelingen ten behoeve van effect gerichte analyses in geïntegreerde modellering.
Hoofdstuk 1 beschrijft de analyse van effecten van emissies in 2000, 2020 en 2030 van een voorlopig referentiescenario waarvan de bijbehorende deposities, berekend door EMEP-CIAM, beschikbaar zijn gesteld aan het CCE in november 2009. Dit referentiescenario is uitsluitend in Hoofdstuk 1 toegepast. In ander hoofdstukken van dit rapport is gebruik gemaakt van het breder, en sinds langere tijd, beschikbare “Current
Legislation Scenario”. Resultaten laten zien dat het risico van vooral vermesting wijdverspreid is in de Europese natuur (waaronder Natura2000 gebieden) in termen van ondermeer de overschrijding van kritische drempels, uitgestelde schade en herstel, en verandering van de diversiteit van plantensoorten. Hoofdstuk 2 beschrijft de status van de Europese landbedekkingskaart die in samenwerking met het Stockholm Environment Instituut (SEI) is ontwikkeld en is toegesneden om binnen de LRTAP Conventie de ecosysteemeffecten te schatten van luchtverontreiniging. Hoofdstuk 3 illustreert de toepassing van het Very Simple Dynamic (VSD) model om het herstel van verzuringschade te simuleren bij verandering van het klimaat. Het vermoeden dat een stijgende temperatuur het herstel van verzuurde bosbodems kan bevorderen wordt bevestigd. Hoofdstuk 4, tenslotte, geeft een kwantificering van de gevolgen van stikstofdepositie voor de diensten van bosecosystemen zoals bijvoorbeeld de regulatie van klimaat, waterkwaliteit, waterkwantiteit en bodemkwaliteit. Er wordt aangetoond dat de vermindering van de stikstofdepositie op bosgebieden sinds 1980 een positief effect heeft voor de biodiversiteit, en de kwaliteit van bodem en water maar een negatief effect op de opwarming van de aarde.
Deel 2 “Dynamic Modelling” behandelt de vooruitgang in de ontwikkeling van de dynamische modellen van de interactie tussen stikstofdepositie en de verandering van klimaat en biodiversiteit. In Hoofdstuk 5 worden resultaten van een voorbeeldstudie gepresenteerd die aantonen dat het mogelijk is om de relatie na te bootsen tussen stikstofdepositie en de daarmee samenhangende plantensamenstelling, rekening houdend met de verandering van klimaat en landbedekking. Hoofdstuk 6 beschrijft de uitbreiding met de koolstof en stikstof dynamiek van het, bij vele Nationale Focal Centra toegepaste, VSD model. Dit uitgebreide model, genaamd ‘VSD+’, is zodanig ontworpen dat de databehoefte van Nationale Focale Centra beperkt blijft om op regionale schaal de vegetatie respons van stikstofdepositie te kunnen bepalen.
Deel 3 “Options to further quantify effect indicators” bestaat uit drie hoofdstukken die elk ingaan op alternatieve indicatoren om verandering van biodiversiteit onder de LRTAP Conventie te kunnen kwantificeren. Dit op een manier die begrijpelijk is voor het publiek, en waarbij risico’s van luchtverontreiniging ook vanuit het biodiversiteitsbeleid voldoende aandacht kunnen krijgen. In Hoofdstuk 7 wordt voorgesteld om de criteria achter de IUCN rode lijst van bedreigde soorten
Rapport in het kort
te generaliseren tot alle soorten. In Hoofdstuk 8 wordt het verschil tussen feitelijk - en potentieel aanwezige plantensoorten bediscussieerd als maat voor de verandering van de diversiteit van plantensoorten door stikstof. In Hoofdstuk 9 wordt een methode beschreven waarbij de kans op het voortbestaan van een habitat worden bepaald aan de hand van zowel indicatorsoorten die zeldzaam en typisch zijn , als indicatorsoorten die invasief en a-typisch zijn voor een habitat.
Deel 4 “Current knowledge on empirical critical loads” geeft een overzicht van de nieuwe inzichten op basis waarvan het besluit wordt gerechtvaardigd om de empirische critical loads uit 2002 te herzien. Empirische critical loads worden gebruikt om de robuustheid van de gemodelleerde risico’s van stikstofdepositie voor Europese natuurgebieden te vergroten, onder een verbeterd begrip van de rol van de biologie. Hoofdstuk 10 geeft een algemeen overzicht, waarna meer specifieke informatie voor Centraal – en Noord Europa in respectievelijk de hoofdstukken 11 en 12 wordt verschaft. Een bijdrage voor Zuid Europa is als PowerPoint presentatie voor de 19e CCE workshop (Stockholm, 11-13 mei 2009) beschikbaar
op www.pbl.nl/cce. Als vervolg hierop is het CCE in de herfst van 2009 een international project gestart in samenwerking met het Zwitserse Bundes Ambt für Umwelt (BAFU) en het Duitse Umwelt Bundes Amt (UBA). In samenwerking met deze internationale instanties en met het Ministerie voor Volkshuisvesting, Ruimtelijke Ordening en Milieu (VROM) en het Rijksinstituut voor Volksgezondheid en Milieu (RIVM) organiseert het CCE in het VN jaar van de biodiversiteit 2010, een workshop onder auspiciën van de LRTAP Conventie getiteld “Workshop for the review and revision of empirical critical loads and dose response relationships” (Noordwijkerhout, 23-25 June 2010) waarna de resultaten zullen worden gerapporteerd aan de 29e vergadering van de
Working Group on Effects onder de LRTAP Conventie. Trefwoorden: Biodiversiteit, dosis-respons relaties, dynamische modellering, kritische drempels, LRTAP Conventie, ecosysteemdiensten, effecten van lucht verontreiniging, klimaatverandering, overschrijding, vermesting, verzuring
Part 1 Integrated assessment 13 This Part focuses on current and new effect-based
contributions to integrated assessment modelling. Chapter 1 describes the analysis of the effects of emissions in 2000, 2020 and 2030 according to a draft baseline scenario, of which depositions were compiled by EMEP-CIAM in November 2009 and made available to the CCE. It includes an overview of the use of currently available methods and data under the ICP M&M for assessing the current state and future risk of acidification and eutrophication in European nature, including Natura2000 areas. Results show that the risk of eutrophication in particular is widespread in terms of critical load exceedance, expected time delays of recovery and, tentatively, changes of species richness. The draft baseline scenario was only used in Chapter 1. In other chapters use was made of the so-called Current Legislation scenario that has been more widely available over a longer period of time. Chapter 2 describes the current state according to the land cover map which has been compiled by the CCE in collaboration with the Stockholm Environment Institute (SEI) in support of the modelling of atmospheric dispersion by EMEP and effects under the Working Group on Effects. Chapter 3 illustrates the current capability of the Very Simple Dynamic (VSD) model to analyse recovery from acidification under climate change. Results confirm that climate change can reinforce recovery of acidified forest soils in Europe. Finally, Chapter 4, provides a quantification of the impacts of nitrogen deposition on forest ecosystem services, such as the regulation of climate, water quality and quantity and soil quality. It is shown that the reduction in nitrogen deposition since 1980 has had a positive effect on biodiversity, and on the quality of soil and water, and a negative effect on global warming.
Effect-oriented assessment of the PRIMES Baseline Scenario 15
1.1 Introduction
This chapter describes results from an effect-oriented assessment of the so-called 2009 PRIMES BaseLine Scenario (PRIMES-BL2009). Depositions of sulphur and nitrogen compounds in EMEP grid cells were derived from this scenario to assess critical load exceedance and generate other environmental impact related results. The EMEP Centre for Integrated Assessment Modelling (CIAM) at the IIASA prepared the PRIMES-BL2009 scenario for the interim assessment of the European Consortium for Modelling Air Pollution and Climate Strategies (EC4MACS).
In summary1, this scenario was based on 2000 and 2005
emission data, calibrated to national values as were reported to the EMEP/CEIP. Draft PRIMES energy projections were included, as developed in mid-2009 for the EU27, Macedonia, Croatia, and Turkey. Projections for Norway and Switzerland did not include impacts of the economic crisis; they originated from PRIMES 2008 model runs. Projections for Albania, Bosnia and Herzegovina, Moldova, Serbia and Montenegro were based on trends from the IEA World Energy Outlook 2009. Agricultural activities included national data as reported to EUROSTAT for 2005. Projections are based on trends estimated by the CAPRI model in September 2009. Regarding the legislation on air pollution, it was assumed the implementation of EU and national legislation (if stricter), plus the EU IPPC Directive for combustion sources and Euro IV on heavy-duty vehicles.
It was assumed that national legislation related to greenhouse gas emissions would be fully implemented in all countries. In addition, for EU27 Member States, it was assumed the implementation of the EU CAP reform and Directives on landfill, waste, Fluorocarbon gas, motor vehicles, and the Emission Trading Scheme (EU ETS) for controlling carbon dioxide emissions. The latter assumes 1 Source: Chris Heyes of IIASA
adoption of mitigation options by ETS sectors at marginal costs, under carbon price levels of 15 €/t CO2 in 2015, 20 €/t
CO2 in 2020, 25 €/t CO2 in 2025, and 30 €/t CO2 in 2030 (in 2008
prices).
1.2 Impact assessment methodology
Air pollution impacts on the environment vary in time and space. A number of phases can be distinguished whereby excessive exposure propagates changes in biodiversity, finally reaching an endpoint expressed as a risk to human welfare. Biodiversity is not, as many believe, only about rare flora and fauna. Biodiversity plays an important role in human welfare, including health. Biodiversity and human welfare are related through ecosystem services, including those of support (e.g. nutrient cycling, soil formation), provision (e.g. food, fresh water), regulation (e.g. climate regulation) and finally culture (e.g. education, recreation). The World Health Organization (WHO) prepared a report as a contribution to the Millennium Ecosystem Assessment to address the issue of ecosystems and human well-being (Corvalan et al. 2005). The report states that ‘ecosystems are essential to human well-being and especially to human health – defined by the World Health Organization as a state of complete physical, mental and social well-being’ (Corvalan et al. 2005, p.12).
Under the Effects Programme of the Convention on Long-range Transboundary Air Pollution (LRTAP) and EC4MACS, the objective of the CCE Environmental Impact Assessment (CCE-EIA) methodology is to establish protection levels against adverse effects of eutrophication and acidification of air pollution on ecosystems in European countries, thereby diminishing the risk of adverse effects to ecosystem services. These protection levels are the ‘critical loads’, which were modelled and mapped for European ecosystems in support of air pollution abatement policies (see Hettelingh et al. 1995, 2001, 2007a), and under EC4MACS also include Natura
Effect-oriented assessment
of the 2009 PRIMES
BaseLine Scenario
Jean-Paul Hettelingh, Maximilian Posch, Jaap Slootweg2000 areas and methods for including biodiversity indicators. Regarding uncertainty, a method was developed under EC4MACS which combines IPCC approaches with ensemble modelling (Hettelingh et al. 2007b).
Input data to compute critical loads were submitted by the network of collaborating National Focal Centres operating under the Effects Programme of the LRTAP Convention. For countries that do not collaborate in this CCE network, critical loads are derived from European soil and vegetation databases.
However, knowledge on biological effects of these
exceedances is limited, as they vary as function of a number of elements including soil type, meteorology, land cover and species occurrence. This is especially important from the viewpoint of risks caused by excessive deposition of nitrogen. The risks due to nitrogen inputs to the environment are increasing and are well documented (Galloway et al. 2008). Despite the lack of operational vegetation models on a European scale, improved knowledge is urgently required on the relationship between excessive nitrogen deposition and effects on biodiversity in Europe. Therefore, CCE has extended the European application of computed critical loads to also include empirical critical loads of nutrient nitrogen. Empirical critical loads are not based on mathematical models but on nitrogen addition experiments, both in the field and in the laboratory (Achermann and Bobbink 2003). First results (included in this interim report) are now available, using tentative relationships between nitrogen doses and impacts on the species richness. Methods and models to quantify the dynamics of changes in vegetation caused by air pollution under climate change are currently being developed for use under the LRTAP Convention (see De Vries et al. 2007, Reinds et al. 2009).
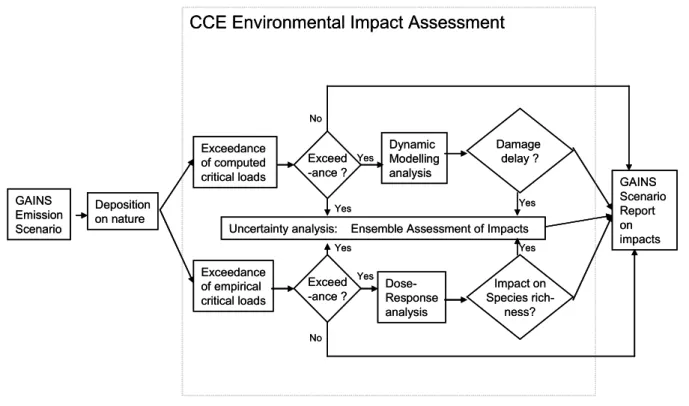
A summary of the CCE-EIA methodology is illustrated in Figure 1.1 (also see Hettelingh et al. 2008a) Two kinds of critical loads, that is, computed and empirical, are available to identify European regions which are at risk according to emission reduction scenarios that are simulated with the GAINS model. The availability of two kinds of critical loads is used in a method called Ensemble Assessment of Impacts, to establish the likeliness of the distribution of exceedances over European ecosystems. The Ensemble Assessment of Impacts methodology was documented in the CCE Progress Report 2007 (Hettelingh et al. 2007b).
In addition, impacts of changes in exceedances to biological and bio-geochemical endpoints can be further analysed in terms of (a) the dynamics of geochemistry (using dynamic models), and (b) impacts to species richness (using dose–response curves). The latter two kinds of endpoint assessments can be used for extending application possibilities of the Ensemble Assessment of Impacts in GAINS scenario analysis of impacts (see Figure 1.1).
Figure 1-1 shows that environmental impacts of excess nitrogen deposition can be analysed in two ways. The first (upper pathway) is to compute exceedances of modelled critical loads for acidification and eutrophication, and to
For reasons of simplification, Figure 1.1 illustrates the case of analysing Damage Delay Times only. The second (lower pathway) focuses on the analysis of effects of nutrient nitrogen, illustrating how exceedances of empirical critical loads can be used in conjunction with the analysis of impacts on species richness. Empirical critical loads have been reported in Achermann and Bobbink (2003), while regionalisation to Europe is conducted by the CCE on the basis of the European land-cover map.
The remainder of this chapter presents a review of the impacts of the PRIMES-BL2009 scenario for the risk of acidification and eutrophication, following the scheme shown in Figure 1.1. For this, computed and dynamic modelling, as well as empirical critical loads and tentative dose–response curves, were applied to European ecosystems including Natura 2000 areas. When possible and appropriate, a distinction between forest, vegetation and surface water systems was made. Finally, the chapter presents an assessment of uncertainty.
1.3 The risks of acidification and
eutrophication in Europe
An overview of ecosystem areas at risk of acidification and excessive nutrient N deposition in countries within the domain of EMEP is given in Table 1.1. Results were computed by using the 2008 critical load database (Hettelingh et al. 2008a). Depositions were based on the PRIMES-BL2009 scenario for 2000, 2020 and 2030.
Table 1.1 shows that the European area at risk of acidification decreases from 10% in 2000 to 3% by 2020 and 2030. In the EU27, the area at risk of acidification under the CLE decreases from 19% in 2000, to 5% by both 2020 and 2030. From Table 1-1 can be seen that the computed European area at risk of eutrophication decreases from 51% in 2000 to 35 and 34% by 2020 and 2030, respectively. In the EU27, the areas at risk of eutrophication are 74% in 2000, 56% by 2020 and 54% by 2030. In addition to the ecosystem area at risk, Table 1.1 also lists Average Accumulated Exceedances (AAE), computed as the area weighted average of the difference between deposition and critical loads. The objective is to reduce the AAE to zero, from the point of achieving biodiversity protection in Europe from the risks of acidification and eutrophication. As long as the AAE stays above zero, damage is likely to occur at some point in the future.
From Table 1.1 can be seen that the PRIMES-BL2009 scenario does not meet the objective of a zero AAE. The AAE of critical loads for acidification in the EU27 was 105 eq ha–1yr–1 in 2000,
which is reduced to 17 and 15 eq ha–1yr–1 by 2020 and 2030,
respectively. For eutrophication, the AAE in EU27 countries was 331 eq ha–1yr–1 in 2000, and estimated at 152 and 144 for
2020 and 2030, respectively.
The continued exceedance of critical loads for acidification and eutrophication warranted a closer geographical view of the locations of these exceedances in Europe. Dynamic
Effect-oriented assessment of the PRIMES Baseline Scenario 17 recovery – in regions with no exceedance – as well as
damage for regions in which the AAE remains above zero. Results from these geographic analyses are presented in the following sections.
It should be noted that the protection levels achieved with the PRIMES-BL2009 scenario 2009 were generally higher than those presented in 2007, following Current Legislation (see Slootweg et al., 2007). For example, the total area at risk of acidification by 2020 was computed to be 6% using emissions under Current Legislation scenario, and 3% under the PRIMES-BL2009 scenario. For eutrophication, the risk is 42 and 35%, under the respective scenarios. The reason for the different outcomes is a difference between the scenarios in the spatial distribution and magnitudes of the emissions – and therefore also of depositions and of critical load exceedances – of sulphur and nitrogen compounds.
1.3.1 Risk of acidification to forests, vegetation and surface waters
Figure 1.2 shows the location of areas at risk and the magnitude of the exceedance of critical loads. Comparing the critical loads of all ecosystems (top row maps) in 2000 (left) to those by 2030 (right) shows that the area with high exceedances (red shaded areas) diminishes. The area changes from covering large areas in the United Kingdom, the Netherlands, Germany and Poland in 2000, to smaller areas remaining in the Netherlands and Poland by 2030. Areas with relatively low exceedances in 2000 (blue shaded) are shown to increase, also covering Germany, by 2030.
Note that not all countries with a National Focal Centre have submitted data for all ecosystem types. However, most of the countries that participated in the modelling and mapping of air pollution effects (see Hettelingh et al. 2008a) included forests. For countries which did not provide national data, critical loads were computed by the CCE using a background database (Posch et al. 2003a, Posch and Reinds 2005) for forests and (semi-)natural vegetation.
The location of the areas most at risk did not alter much, when we looked at forested areas only (second row of maps). Areas with (semi-)natural vegetation with relatively low exceedances (blue shading) by 2030, remain in some scattered grid cells in the United Kingdom, the Netherlands, Germany and France. Relatively low exceedances of critical loads for surface waters can be seen in the United Kingdom and northern European countries.
As illustrated in Figure 1.1, an exceedance requires the use of dynamic modelling (Posch et al., 2003b, 2007) to answer the question of how long it would take before chemical soil criteria are violated. This so-called ‘Damage Delay Time’ (DDT) may cover any time span, depending on the buffer capacity and other bio-geochemical conditions. Conversely (not illustrated in Figure 1.1), non-exceedance does not imply that recovery of the buffer capacity would be instantaneous. The ‘Recovery Delay Time’ (RDT) may also take a considerable time. This can be seen in many, but not all, lakes in northern Europe, where both the buffer capacity and fauna have started to recover due to decreasing acidification since the 1980s. Therefore, it was important to complement the analysis of critical load exceedance with an exploration of
Figure 1.1 A simplified flowchart of the framework for the assessment of impacts of excess nitrogen deposition, in the context of integrated assessment modelling (e.g., the GAINS model) (Hettelingh et al. 2008a).
GAINS Emission Scenario Deposition on nature Exceedance of computed critical loads Exceedance of empirical critical loads Exceed -ance ? Exceed -ance ? Dynamic Modelling analysis Dose-Response analysis Damage delay ? Impact on Species rich-ness?
CCE Environmental Impact Assessment
Uncertainty analysis: Ensemble Assessment of Impacts
GAINS Scenario Report on impacts Yes Yes Yes Yes Yes Yes No No GAINS Emission Scenario Deposition on nature Exceedance of computed critical loads Exceedance of empirical critical loads Exceed -ance ? Exceed -ance ? Dynamic Modelling analysis Dose-Response analysis Damage delay ? Impact on Species rich-ness?
CCE Environmental Impact Assessment
Uncertainty analysis: Ensemble Assessment of Impacts
GAINS Scenario Report on impacts Yes Yes Yes Yes Yes Yes No No
the dynamics of the risk of acidification, as described in the following section.
1.3.2 Dynamics of the risk of acidification
Assuming that the depositions under the PRIMES-BL2009 scenario by 2020 remain constant in the future, we analysed the question about delay times of both recovery (RDT) and damage (DDT).
Figure 1.3 shows recovery delay times (using data from the background database) for the areas where critical loads will no longer be exceeded by 2020, according to the PRIMES-BL2009 scenario. The shadings in the left map indicate the minimum recovery year in each grid cell, that
recovers first. Areas that are shaded grey, blue or green indicate that at least one ecosystem will recover before or in the year corresponding to the colour, other ecosystems in such a grid cell may recover at later dates. Finally, white-shaded areas indicate that there is either no data or that geo-chemical recovery has already taken place for all ecosystems. The right map indicates the latest recovery delay time of an ecosystem in a grid cell. For example, in a yellow-shaded grid cell, there is at least one ecosystem that will recover between 2050 and 2100. Other ecosystems may exist in that grid cell, which recover earlier. Finally, pink-shaded grid cells imply that none of the ecosystems in that grid cell are expected to recover (either because exceedances remain or because they have already recovered).
Table 1.1 Percentage of ecosystem areas at risk of acidification (left) and eutrophication (right) for countries within the EMEP modelling domain, the EU27 in 2000, and for the PRIMES-BL2009 scenario for 2020 and 2030
Country
Acidification Eutrophication
2000 2020 2030 2000 2020 2030
AAE Ex% AAE Ex% AAE Ex% AAE Ex% AAE Ex% AAE Ex%
Albania 0 0 0 0 0 0 317 99 219 95 212 95 Austria 3 1 0 0 0 0 427 100 126 70 92 60 Belarus 52 18 4 4 4 4 382 100 257 94 260 94 Belgium 490 29 72 12 66 12 927 100 331 78 316 77 Bosnia & Herzegovina 46 13 0 0 0 0 260 88 114 68 101 65 Bulgaria 0 0 0 0 0 0 229 94 51 50 44 41 Croatia 26 4 2 2 2 2 513 100 276 97 254 97 Cyprus 0 0 0 0 0 0 120 68 125 68 158 69 Czech Republic 275 27 68 18 53 16 1058 100 648 100 601 100 Denmark 376 50 6 4 6 4 1084 100 532 100 542 100 Estonia 0 0 0 0 0 0 87 69 21 28 21 28 Finland 5 3 1 1 1 1 57 48 14 23 13 22 France 55 12 7 3 6 2 577 98 233 80 220 79 Germany 398 58 54 17 44 15 632 85 276 61 256 59 Greece 15 3 0 0 0 0 256 98 138 88 134 90 Hungary 113 23 6 3 5 3 540 100 301 99 273 94 Ireland 100 23 10 5 7 4 634 88 381 78 384 78 Italy 0 0 0 0 0 0 345 69 135 43 117 41 Latvia 40 19 3 3 3 3 269 99 136 90 133 89 Liechtenstein 150 52 0 0 0 0 590 100 311 100 274 100 Lithuania 211 34 70 29 67 29 489 100 365 100 363 100 Luxemburg 160 15 27 12 17 12 1091 100 610 99 577 99 Macedonia FYR 22 11 0 0 0 0 325 100 170 99 158 95 Moldova 0 0 0 0 0 0 413 100 356 98 361 98 Netherlands 2012 76 821 66 794 66 1427 93 844 84 839 84 Norway 47 16 8 6 7 6 30 21 5 7 5 7 Poland 665 77 143 35 124 33 738 100 471 98 455 97 Portugal 50 9 4 2 3 2 183 97 49 60 49 60 Romania 189 46 1 3 1 2 16 18 1 2 1 1 Russia (European part) 1 1 1 1 1 1 30 26 10 9 9 9 Serbia & Montenegro 44 16 0 0 0 0 291 96 161 83 154 81 Slovakia 103 16 10 7 6 6 672 100 370 100 329 99 Slovenia 39 7 0 0 0 0 363 98 61 59 38 43 Spain 19 3 0 0 0 0 342 95 170 87 170 87 Sweden 22 16 2 3 1 3 133 56 49 34 51 34 Switzerland 36 9 7 3 5 2 581 99 201 81 163 72 Ukraine 14 6 0 1 1 1 503 100 318 100 319 100 United Kingdom 246 39 24 12 20 11 139 25 36 14 35 14 EU27 105 19 17 5 15 5 331 74 152 56 144 54 All 53 10 8 3 7 3 184 51 86 35 82 34
Effect-oriented assessment of the PRIMES Baseline Scenario 19
Figure 1.2 Exceedance of critical loads of acidification in 2000 (left), 2020 (middle) and 2030 (right) for all
ecosy-stems (top row), forests (2nd row), vegetation (3rd row) and surface waters (bottom row). The size of a coloured
grid cell is proportional to the fraction of the ecosystem area in the cell in which critical loads are exceeded.
eq ha-1a-1 no exceedance 0 - 200 200 - 400 400 - 700 700 - 1200 > 1200
Exceedance Acid BaseLine 2000
Depositions: EMEP MSC-WCCE
eq ha-1a-1 no exceedance 0 - 200 200 - 400 400 - 700 700 - 1200 > 1200
Exceedance Acid BaseLine 2020
Depositions: EMEP MSC-WCCE
eq ha-1a-1 no exceedance 0 - 200 200 - 400 400 - 700 700 - 1200 > 1200
Exceedance Acid BaseLine 2030
Depositions: EMEP MSC-WCCE
eq ha-1a-1 no exceedance 0 - 200 200 - 400 400 - 700 700 - 1200 > 1200
Exceedance Acid BaseLine 2000 forests
Depositions: EMEP MSC-WCCE
eq ha-1a-1 no exceedance 0 - 200 200 - 400 400 - 700 700 - 1200 > 1200
Exceedance Acid BaseLine 2020 forests
Depositions: EMEP MSC-WCCE
eq ha-1a-1 no exceedance 0 - 200 200 - 400 400 - 700 700 - 1200 > 1200
Exceedance Acid BaseLine 2030 forests
Depositions: EMEP MSC-WCCE
eq ha-1a-1 no exceedance 0 - 200 200 - 400 400 - 700 700 - 1200 > 1200
Exceedance Acid BaseLine 2000 vegetation
Depositions: EMEP MSC-WCCE
eq ha-1a-1 no exceedance 0 - 200 200 - 400 400 - 700 700 - 1200 > 1200
Exceedance Acid BaseLine 2020 vegetation
Depositions: EMEP MSC-WCCE
eq ha-1a-1 no exceedance 0 - 200 200 - 400 400 - 700 700 - 1200 > 1200
Exceedance Acid BaseLine 2030 vegetation
Depositions: EMEP MSC-WCCE
eq ha-1a-1 no exceedance 0 - 200 200 - 400 400 - 700 700 - 1200 > 1200
Exceedance Acid BaseLine 2000 waters
Depositions: EMEP MSC-WCCE
eq ha-1a-1 no exceedance 0 - 200 200 - 400 400 - 700 700 - 1200 > 1200
Exceedance Acid BaseLine 2020 waters
Depositions: EMEP MSC-WCCE
eq ha-1a-1 no exceedance 0 - 200 200 - 400 400 - 700 700 - 1200 > 1200
Exceedance Acid BaseLine 2030 waters
Figure 1.4 shows the location and the earliest year by which at least one ecosystem in the respective EMEP grid cell will have its acidification chemical criterion violated.
The Damage Delay Time according to country submissions (left map in Figure 1.4) reveals that large areas in, for example, the United Kingdom and Germany show damage occurring after 2100 (grey shading). The background database computations are more pessimistic, indicating damage already occurred (pink shading) in these areas. Polish submissions indicated shorter minimum damage delay times
Figures 1.3 and 1.4 show that ecosystems that may or may not recover are in the same grid cells in western and central Europe. This raises the question of what deposition would be required to ensure recovery of the most sensitive ecosystem in each grid cell. This deposition is called a ‘target load’ (Posch et al. 2003), which is lower than, or equal to the critical load of any ecosystem for which a target load exists. Target loads are calculated using dynamic models for a particular ‘implementation year’ (here: 2020), subject to the constraint that this deposition should yield recovery in a specified target year (> 2020). Figure 1.5 shows target loads for achieving
Figure 1.4 Damage Delay Times for acidification calculated using NFC data (left) and using the CCE background data base (right). A grid cell is shaded according to the earliest damage year (=violation of chemical criterion) for an ecosystem in that grid cell. Red shading implies that the earliest damage is expected before 2030.
Effect-oriented assessment of the PRIMES Baseline Scenario 21 recovery is required to occur early. For example, ecosystems
in the northern central part of France require depositions below 100 eq ha-1yr-1 to achieve recovery by 2050. When
recovery is only required to occur in 2100, target loads in that area can be between 400 and 700 eq ha–1yr–1. Figure 1.5 also
shows that 95% of the ecosystems in a large area covering parts of the United Kingdom and central western Europe cannot recover before 2100.
1.3.3 Risk of nutrient nitrogen to biodiversity
As is shown in Figure 1.1, the risk of nutrient nitrogen can be analysed via its effects on soil chemistry (top pathway of Figure 1.1) using exceedances of computed critical loads (Figure 1.6) and dynamic modelling (Figures 1.9 and 1.10), or (bottom pathway) via exceedances of empirical critical loads (Figure 1.7) and impacts on plant species diversity (Figure 1.8). From Figure 1.6 it can be seen that the areas with high risks to all ecosystems (red and yellow shadings) in 2000 are
located in central and western Europe. Nitrogen depositions according to the PRIMES-BL2009 scenario would be hardly capable of reducing the area and magnitude of the exceedances in 2030, in comparison to 2000 (the red and yellow shaded areas are only slightly smaller). Critical loads for eutrophication have hardly been computed for surface waters.
Empirical critical loads of ecosystems were established as ranges, for classes that have been distinguished in the European Nature Information System (EUNIS). Empirical critical load ranges include values that may be higher than computed critical loads, which are mostly based on soil chemical information. This is one of the reasons why the exceedances that were calculated for critical loads for forests, vegetation and surface waters in Figure 1.7 are different from those in Figure 1.6.
Figure 1.5 Target loads to achieve recovery of acidification in 95% of the ecosystems by 2030 (top left), 2050 (top right), 2100 (bottom left), in comparison to the critical loads map that would protect 95% of the ecosystems in the long run (bottom right).
Figure 1.6 Exceedance of critical loads for eutrophication in 2000 (left), 2020 (middle) and 2030 (right) for all ecosystems (top row), forests (2nd row), vegetation (3rd row) and surface waters (bottom row). The size of a coloured grid cell is proportional to the fraction of the ecosystem area in the cell where critical loads are exceeded.
Effect-oriented assessment of the PRIMES Baseline Scenario 23
Figure 1.7 Exceedance of the minimum empirical critical loads in 2000 (left), 2020 (middle) and 2030 (right) for
all ecosystems (top row), forests (2nd row), vegetation (3rd row) and surface waters (bottom row). The size of a
Nitrogen depositions cannot only be used for computing critical load exceedances, but also tentatively in dose– response relationships, established by Bobbink (2008), to assess impacts on species richness of (semi-natural) vegetation, and species similarity of forests (Hettelingh et al. 2008b). The result is shown in Figure 1.8.
Figure 1.8 does not show much difference between 2020 and 2030 in the pattern of the biodiversity indicator (species richness or similarity). Comparing species similarity in forests for 2030 (Figure 1.8, lower right map) with the exceedance of empirical critical loads (Figure 1.7, lower right map), showed that species similarity, for example in France, will be relatively high, although empirical critical loads will be exceeded. This could have many reasons, including the inappropriateness of extrapolating dose–response functions over Europe. To
establish empirical critical loads, there is also a need to review the influence of background deposition.
1.3.4 Dynamics of the risk of nutrient nitrogen
Figure 1.9 shows the Damage Delay Time (DDT), that is, the year in which the concentration of nitrogen in the soil solution violates the critical limit for ecosystems. According to country submissions of dynamic modelling data (left map), large areas in the Netherlands and Germany include at least one ecosystem which will be damaged before 2030. Using the background database (right map) indicates that in many regions in Europe damage is already occurring, that is, the critical limit of nitrogen concentration is already being violated. The background database yields shorter Damage Delay Times, because a precautionary low critical limit of 0.3 mg N l-1 has been used throughout Europe.
Figure 1.8 Percentage of species richness in 2000 (left), 2020 (middle) and 2030 (right) in grasslands (top), and scrubs (centre), and of species similarity in forests (bottom). Red-shaded areas indicate that the estimated biodiversity indicator percentages are lower than 80%, while green shadings indicate areas where this percentage is between 95 and 100%.
Effect-oriented assessment of the PRIMES Baseline Scenario 25 Figure 1.10 illustrates the nitrogen deposition that would
be needed to achieve recovery of 95% of the ecosystems. In central and western Europe, rather wide areas require a nitrogen deposition between 400 and 1000 eq ha-1yr-1 by 2030,
2050 and 2100. For the Netherlands, no target loads were computed because no critical concentrations were submitted. The CCE does not use the background database for countries that submit only critical loads data and no (complete) dynamic modelling data set. Finally, note that target loads exist for all natural ecosystems in Europe, if recovery is not required before 2100.
1.4 Risk of acidification and eutrophication
in Natura 2000 areas
As comprehensively described by Whitfield and Strachan (2009), the legal basis for the Natura 2000 network comes from the EU Birds Directive, which dates back to 1979, and the Habitats Directive from 1991 (EC 2009). The focus of the use of critical loads addresses effects on (plant species diversity and soil chemistry of) ecosystems, that is, for which the Habitats Directive can be more appropriate than the Birds Directive. The implementation of the Habitats Directive requires measures to be taken to maintain and restore the threatened natural habitats listed in the directive at ‘Favourable Conservation Status’ (FCS). The FCS of a habitat is defined as when (a) its natural range and areas within that range are stable or increasing, (b) the specific structure and functions which are necessary for its long-term maintenance exist and are likely to continue to exist in the foreseeable future, and (c) the conservation status of its typical species is favourable, as defined in Article 1(i) which addresses FCS for a species. The last is summarised as when (i) population dynamics data indicate that the species is maintaining itself, (ii) the natural range of the species is not (likely) to be reduced in the foreseeable future, and (iii) there is a
sufficiently large habitat to maintain its population on a long-term basis.
The focus of the impacts of air pollution on Natura 2000 areas assumes that the deposition of acidifying and eutrophying compounds is likely to affect FCS. An overview of approaches to assess and report nitrogen deposition impacts on
conservation status in EU Member States can be found in Whitfield and Strachan (2009).
Figure 1.11 shows the exceedance of acid deposition and nitrogen deposition in Natura 2000 areas. For the latter, both computed and empirical critical loads were used. Natura 2000 areas are sensitive to acidification, in particular, in the Netherlands, Germany and Poland. The sensitivity to nitrogen deposition is more widespread, and also includes Natura 200 areas in southern France and Spain. Natura 2000 areas are not mapped for Ireland and Italy, because these countries did not submit data for their Natura 2000 areas. For the CCE, to use Natura 2000 data from the background database requires a change in current consensus between the CCE and NFCs, according to which the background database is only used for countries that did not submit any data.
Figure 1.12 shows the result from applying dynamic modelling to Natura 2000 areas, to answer the question of which deposition (target load) would be required to reach recovery in 2030. For acidity, the results are given in the right-hand maps (top), and for nutrient nitrogen (bottom). The results show that non-achievement2 of acidity target loads is low
(light blue), but evident, particularly in Germany. Non-achievement is highest in Natura 2000 areas in the south of the Netherlands, close to the border with Germany. Non-2 Deposition which exceeds target loads is called ‘non-achievement’ or ‘non-attainment’. The term ‘exceedance’ is reserved to the difference between deposition and critical loads.
Figure 1.9 Damage Delay Times for eutrophication calculated by using data from country submissions (left), and by using CCE background data (right). A grid cell is shaded according to the earliest year of ecosystem damage in that grid cell. Red shading implies that the earliest possible damage will occur before 2030.
achievement of nitrogen target loads in Natura 2000 areas is more widespread, mostly ranging from zero to 700 eq ha–1
yr–1.
1.5 Uncertainty in assessments of
impacts on biodiversity
The main aim of the critical load approach is the identification of the geographical location of an ecosystem of which the critical load is exceeded by atmospheric deposition. At the end of the day, it is the exceedance that matters, not the critical load as such. For the design of air pollution abatement policies it is important to know where (in Europe or in a country) adverse impacts can be expected to occur as a result of the dispersion of national emissions and resulting excessive regionalised depositions. Moreover, policy analysts also wish
assumed that an adverse effect may occur ‘sooner’ when the exceedance is higher. Therefore, when addressing ecosystem impacts, integrated assessment modellers and policy analysts are primarily interested in the likelihood of (the occurrence of) an exceedance, and its emission scenario-dependent trend.
Of course, we know that the uncertainty in exceedances depends on variables and data in the chain from emissions to depositions, and their spatial and temporal resolution. These include data and emission factors behind national emission reports, input data, meteorology and climate conditions behind atmospheric dispersion models and input data, soil-vegetation characteristics and modelling methods behind critical loads. Elements that are relevant to uncertainty analyses, in this context, have been conducted and reported under the LRTAP Convention (e.g., Hettelingh and Posch 1997,
Figure 1.10 Target loads as of 2020 for achieving recovery of eutrophication in 95% of the ecosystems by 2030 (top left), 2050 (top right), 2100 (bottom left), in comparison to the critical loads map that would protect 95% of the ecosystems in the long run (bottom right).
Effect-oriented assessment of the PRIMES Baseline Scenario 27 assessment is concerned with scenario analysis, that is, with
the change in important indicators when comparing one scenario to another. Model and data uncertainty, to a certain extent, is ‘cancelled out’ when comparing one scenario to another. More important is the uncertainty caused by false positives, for example, not taking climate change into account when actually one should. The impacts of climate change on target loads and delay times have recently been investigated in Reinds et al. (2009).
Ensemble Assessment of Impacts (EAI) is presented to explore the robustness of exceedances on a scale that ranges from ‘exceptionally unlikely’ to ‘virtually certain’, in analogy to the manner in which uncertainties are proposed to be addressed in the IPCC Fourth Assessment Report (IPCC 2005) (see also Hettelingh et al. 2007). The result is shown in Figure 1.13. The area where exceedance is ‘virtually certain’ (red
shading) covered most of Europe in 2000. The area where exceedance is ‘likely’ will increase by 2030.
Once exceedance occurs, the Damage Delay Time is subject to the uncertainty in the chosen critical limit of the nitrogen concentration in soil solution. Figure 1.14 illustrates the variation in Damage Delay Time between reaching a critical limit of 0.3 mg N l–1 (left) and 3 mg N l–1. The results show that
areas in central Europe that include at least one ecosystem for which the Damage Delay Time is almost instantaneous, with a low critical limit (pink shaded in the left map), get some leeway until 2030, when a high critical limit is used (red shaded in the right map).
Figure 1.11 Exceedance, for Natura 2000 areas, of acidification (top), eutrophication (centre) and empirical critical loads (bottom) in 2000 (left), 2020 (centre) and 2030 (right).
Figure 1.13 The likelihood that the Average Accumulated Exceedance (AAE) of nutrient nitrogen in an EMEP grid cell exceeds zero in 2000 (left), 2020 (middle) and 2030 (right), that is, that it contains at least one ecosystem for which the critical load of nutrient N is exceeded under the PRIMES-BL2009 scenario. Red shaded areas indicate that exceedance is ‘virtually certain’, whereas blue shaded areas indicate that exceedance is ‘as likely as not’ to occur. Figure 1.12 Non-achievement of 2030 target loads of acidification (top) and eutrophication (bottom) for all ecosy-stems (left), in comparison to Natura 2000 areas (right).
Effect-oriented assessment of the PRIMES Baseline Scenario 29
1.6 Summary and conclusions
Depositions of sulphur and nitrogen compounds under the 2009 PRIMES BaseLine Scenario (PRIMES-BL2009) are based on patterns and magnitudes of emissions that are different from integrated assessments made in the past. This leads to a total European area at risk, under PRIMES-BL2009, which is smaller than obtained from results in 2007 under the then available ‘Current Legislation’ scenario.
The total European area at risk of acidification, under
PRIMES-BL2009, is 3% by 2020 and 2030. While the total area at risk of acidification is small, recovery of some areas, in which critical loads are no longer exceeded, may take a long time for. Eutrophication is a risk for 35 and 34% of the total European ecosystem area by 2020 and 2030, respectively. Following a method which combines an approach developed under the IPCC with ‘ensemble assessment’ (using more methods to analyse a single phenomenon), the robustness of the total European area at risk is confirmed.
The pertinent risks of eutrophication are confirmed by dynamic modelling, showing that it will be a challenge for many ecosystems to recover, and tentative assessments of the impact on plant species abundance and diversity. Computations are confirmed when the analysis is focused on Natura 2000 areas.
References
Achermann B, Bobbink R, 2003. Empirical critical loads for nitrogen. Proceedings of an Expert Workshop, Berne, 11-13 November 2002, SAEFL, Environmental Documentation164
Bobbink R, 2008. The derivation of dose-response relationships between N load, N exceedance and plant species richness for EUNIS habitat classes. In: Hettelingh et al. (eds), op.cit., pp.63-72
Corvalan C, Hales S, McMichael A, 2005. Ecosystems and Human Well-being: health synthesis. Report prepared by WHO as contribution to the Millenium Ecosystem Assessment, www.millenniumassessment.org, printed by WHO, Geneva, ISBN 9241563095, 53 pp
De Vries W, Kros H, Reinds GJ, Wamelink W, Mol J, Van Dobben H, Bobbink R, Emmett B, Smart S, Evans C, Schlutow A, Kraft P, Belyazid S, Sverdrup H, Van Hinsberg A, Posch M, Hettelingh J-P, 2007. Development in deriving critical limits and modelling critical loads of nitrogen for terrestrial ecosystems in Europe. Alterra-CCE Report, Alterra Report 1382, www.pbl.nl/cce
EC, 2009. Nature and Biodiversity, http://ec.europa.eu/environment/ nature/index_en.htm
Galloway JN, Townsend AR, Erisman JW, Bekunda M, Cai Z, Freney JR, Martinelli LA, Seitzinger SP, Sutton MA, 2008. Transformation of the nitrogen cycle: recent trends, questions, and potential solutions. Science 320: 889-892
Hettelingh J-P, Posch M, De Smet PAM, Downing RJ. 1995. The use of critical loads in emission reduction agreements in Europe, Water, Air an
Soil Pollution 85:2381-2389
Hettelingh J-P and Posch M, 1997. An analysis of the critical load and input data variability. In: M Posch, J-P Hettelingh, PAM de Smet, RJ Downing (eds), Calculation and mapping of critical thresholds in Europe, CCE Status Report 1997. RIVM Report 259101007, pp.29-39, www.pbl.nl/cce Hettelingh J-P, Posch M, De Smet PAM, 2001. Multi-effect critical loads
used in multi-pollutant reduction agreements in Europe. Water, Air and
Soil Pollution 130: 1133-1138
Figure 1.14 Damage Delay Times before the concentration of nutrient nitrogen in soil moisture exceeds 0.3 mg
N l–1 (left) or 3 mg N l–1 (right). The chosen level of N concentration is of crucial importance to both the value of
the critical load (higher with high concentrations) and time horizons of damage or recovery, and, therefore, to uncertainty.
Hettelingh J-P, Posch M, Slootweg J, Reinds GJ, Spranger T, Tarrason L, 2007. Critical loads and dynamic modelling to assess European areas at risk of acidification and eutrophication. Water, Air and Soil Pollution:
Focus 7:379-384
Hettelingh J-P, Posch M, Slootweg J, 2007. Tentatively exploring the likelihood of exceedances: Ensemble Assessment of Impacts. In: Slootweg et al.(eds), op.cit., pp. 53-58
Hettelingh J-P, De Vries W, 2008. Examples of links between (excessive nitrogen deposition and ecosystem services affecting human well being. In: J-P Hettelingh et al. (eds), op.cit., pp. 229-231
Hettelingh J-P, Posch M, Slootweg J (eds), 2008a. Critical loads, dynamic modelling and impact assessment in Europe, CCE Status Report 2008. PBL Report 500090003, Bilthoven, www.pbl.nl/cce
Hettelingh J-P, Posch M, Slootweg J, Bobbink R, Alkemade R, 2008b. Tentative dose-response function applications for integrated assessment. In: Hettelingh et al. (eds), op.cit., pp.83-89 Posch M, Reinds GJ, Slootweg J, 2003a. The European Background
Database. pp 37-44 in M Posch, J-P Hettelingh, J Slootweg, R J Downing (eds) CCE Status report 2003, Bilthoven, Netherlands
Posch M, Hettelingh J-P, Slootweg J (eds.), 2003b. Manual for dynamic modelling of soil responses to atmospheric deposition. RIVM report 259101012, CCE, Bilthoven, www.pbl.nl/cce
Posch M, Reinds GJ, 2005. The European Background Database. In: M Posch, J Slootweg, J-P Hettelingh (eds) CCE Status Report 2005, CCE, RIVM Report 259101016, Bilthoven, Netherlands, pp 63-69
Posch M, Hettelingh J-P, Slootweg J, 2007. Critical loads and dynamic modelling of nitrogen. In: Slootweg J et al. (eds), op.cit., pp.41-51 Reinds GJ, Posch M, Leemans R, 2009. Modelling recovery from soil
acidification in European forests under climate change. Science of the
Total Environment 407: 5663-5673
Slootweg J, Posch M, Hettelingh J-P (eds), 2007. Critical loads of nitrogen and dynamic modelling, CCE Progress Report 2007. MNP Report 500090001, Bilthoven, www.pbl.nl/cce
Suutari R, Amann M, Cofala J, Klimont Z, Posch M, Schöpp W, 2001. From economic activities to ecosystem protection: an uncertainty analysis of two scenarios of the RAINS integrated assessment model, IIASA/CCE Report 1/2002, IIASA, Laxenburg, Austria
Townsend AR, Howarth RW, Bazzar FA, Booth MS, Cleveland CC, Collinge SK, Dobson AP, Epstein PR, Holland EA, Keeney DR, Mallin MA, Rogers CA, Wayne P, Wolfe AH, 2004. Human health effects of a changing global nitrogen cycle. Frontier of Ecological Environment 1(5): 240-246 UBA 2004. Manual on methodologies and criteria for modelling and
mapping critical loads & levels and air pollution effects, risks and trends. UNECE Convention on Long-range Transboundary Air Pollution, Federal Environmental Agency (Umweltbundesamt), Berlin
Van Breemen N, De Vries W, 1998. Criteria and indicators of acceptable atmospheric deposition of sulphur and nitrogen on forests in Western Europe, in: The contribution of soil science to the development of and implementation of criteria and indicators of sustainable forest management, Soil Science Society of America, Special Publication, no 53, Madison, USA, pp. 99-111
Van Hinsberg A, Hettelingh J-P, Posch M, Slootweg J, 2009. Effects of acidification. In: Buijsman et al. (eds), Acid Rain according to current insights: An analysis of Dutch acidification issues over the past 30 years (in Dutch) (in prep)
Whitfield C, Strachan I, 2009. Assessing nitrogen deposition impacts on conservation, background paper presented for topic 2, Cost 729 Workshop on nitrogen deposition and Natura 2000, Brussels, 18-20 May 2009, http://cost729.ceh.ac.uk/webfm_send/7