PBL-WORKING PAPER 13 MAY 2013 LESSONS FROM 15 YEARS OF EXPERIENCE WITH THE DUTCH TAX
ALLOWANCE FOR ENERGY INVESTMENTS FOR FIRMS1
Arjan Ruijsa en Herman Vollebergha,b
a PBL Netherlands Environmental Assessment Agency, P.O. Box 303, 3720 AH Bilthoven, The
Netherlands. Arjan.Ruijs@pbl.nl
b CentER and Tilburg Sustainability Centre, Tilburg University, Herman.Vollebergh@pbl.nl.
Abstract
Since 1997 the Netherlands has a tax allowance scheme introduced to promote investments in energy saving technologies and sustainable energy production. This Energy Investment Tax Allowance (EIA in Dutch) reduces up-front investment costs for firms investing in the newest energy saving and sustainable energy technologies. The basic design of the EIA has remained the same over the past 15 years. Firms investing in technologies listed in the annually updated ‘Energy List’ may deduct some of the investment costs from their taxable profits. The EIA may also reduce search costs by investors to find particular technologies because of the Energy List which is used to consider eligibility for the subsidy. This Energy List contains generic technologies that meet a certain energy-saving standard or a selection of novel, but proven, technologies with a higher energy-saving potential than conventional technologies. Over the past 15 years, the use of the EIA has been affected by a number of changes, mainly due to exogenous factors, such as interactions with other policy instruments, rising oil and gas prices, and the economic crisis since 2007. Despite this turbulence and changes in government focus, the EIA is still part of the Dutch energy policy mix.
Our evaluation of the EIA contains four lessons. First, the use of tax revenues to subsidise investment in energy-efficient technologies and renewable energy is not very different from using on-budget subsidies if budgetary rules require sufficient accountability of such tax expenditures. At the beginning of the scheme, a lack of accountability of tax expenditures contributed to budgetary turbulence. A number of budget overruns in later periods were not related to budget accountability issues, but to changes outside the EIA. Second, incentive compatibility problems of the EIA are of concern but seem to be manageable. The main weakness of the tax allowance is the difficulty to prevent free-riders from receiving subsidies, even though subsidy effectiveness has improved considerably over the years. Third, the use of a dynamic technology list makes the regulation flexible, allowing policy to refocus and apply tighter standards if necessary. The list also reduces the information asymmetry between supply and demand of new technologies and helps suppliers of energy-saving or sustainable energy technologies to overcome the well-known ‘valley of death’. Finally, the design of a subsidy scheme should pay sufficient attention to the likely interaction with other policy instruments, in particular other subsidy schemes aimed at complementary objectives. The turbulence with the EIA over the 2001–2007 period was mainly caused by fluctuations in the application of other instruments.
Key-words: Energy efficiency, renewable energy, investment, tax, tax preference, policy evaluation.
JEL Codes: H23; H25; H32; O33; Q48.
1This paper was originally prepared for the OECD Joint Meeting of Tax and Environment Experts of 16 November 2012. The paper is also published as OECD Environment Working Paper No. 55.
1. Introduction
Energy efficiency is quickly becoming a key ingredient in the energy and environmental policy mix (Convery, 2011). In many OECD countries, firms and households are entitled to government subsidies if they adopt certain energy-efficient technologies or appliances. Such technologies and appliances not only provide benefits to the owner, but also to society at large. This certainly holds for energy-efficient technologies such as double glazing, insulation, and high-efficiency diesel engines. These technologies all reduce their owner’s energy bill, but also mitigate the emission of environmentally hazardous pollutants, such as greenhouse gases.
Already back in 1997, the Dutch Government introduced a unique tax allowance scheme that aimed to promote investments in energy-efficient appliances by firms. The tax deduction scheme was originally part of a broader energy tax policy package that was initiated in the Netherlands following the failure to implement a European-wide carbon tax in the early 1990s (Vermeend and Van der Vaart, 1998). This package included, first of all, the taxation of small-scale energy use in order to reduce CO2 emissions
(large-scale energy use was exempted for reasons of competitiveness) (see Vollebergh, 2008). The second element of the package was the introduction of tax deductions for investments in energy saving appliances and renewable energy, as a compensation mechanism for the additional tax burden. This so called Energy Investment Tax Allowance (EIA in Dutch) aims to stimulate investments in energy saving technologies and sustainable energy production, with a special emphasis on small and medium-sized enterprises (SME) and those having a covenant with the government to improve energy efficiency. The scheme reduces up-front investment costs related to energy saving and sustainable energy technologies through an income tax deduction.
Over the past 15 years, the EIA has been one of the pivotal instruments of Dutch energy policy. The EIA generates an average of 15,000 applications each year, most of which are actually granted (see Figure 1). Annual investments amount to around EUR 1 billion, which represent approximately 1% of overall Dutch industrial investments. The relative importance of the EIA, however, varies considerably across sectors. Not surprisingly, the energy sector is at the top of the list, with on average 30% of their overall investment expenditures supported by the EIA, and with a peak of 93% in 2006.2 The agricultural
sector has also received a great deal of support, although, on average, only 7% of their investments were supported through the EIA. In 2010, the budgetary impact of this scheme totalled EUR 100 million in tax revenues foregone by the Dutch Government, which equalled 0.07% of total tax revenues. Small and medium-sized enterprises make up 80% to 95% of the annual applications, representing 50% to 80% of the total in accepted investments (in euros). Furthermore, 24% to 40% of applications come from companies that have a covenant with the government.3 Finally, the regulating agency
responsible for administering this scheme has calculated that the EUR 893 million in investments in 2010 have saved 21 PJ of energy. This amount corresponds to an annual reduction in greenhouse gas emissions of 1,200 kilotonnes of CO2 equivalents and in
overall energy use in the Netherlands of 0.75% (NL Agency, 2011). This implies a cost-effectiveness of the EIA of between EUR 4 and 7 in tax expenditure per tonne of CO2
2.The energy sector consists of firms that produce and transport electricity, gas and heat. Electricity producers are responsible for most of the energy sector's EIA investments .
avoided, taking into account the differences in life expectancy of the different technologies (Senter, Senter Novem, NL Agency, 2003–2009).
Figure 1. Main indicators of the EIA tax expenditure scheme in the Netherlands
Source: Senter, Senter Novem, NL Agency 1999–2012.
Subsidies often meet with scepticism from economists; in particular, in the environmental field (Van Soest and Vollebergh, 2011). For instance, subsidies would have adverse effects on the entry or exit decisions of firms, require distortionary taxes at the margin, and typically create ineffective incentives and therefore inefficiency due to asymmetric information. Although the instrument of subsidies is not popular among economists, it is used quite often in actual practice. Subsidies appear in many forms, including explicit investment transfers and tax deductibility schemes. The latter include investment credits, accelerated depreciation, partial expensing, and exemptions (Jenkins and Lamech, 1992; Price et al., 2005; OECD, 2006). This popularity may be explained in part by the fact that subsidies temper average cost increases for firms associated with environmental policies, and hence have a less detrimental effect on the international competitiveness of domestic industry, as compared to, for example, environmental taxes or quotas (Dietz and Vollebergh, 1999).
This paper reviews the Dutch experience with the EIA, with a special emphasis on these political-economy aspects. The review first presents a discussion on the motivation for the introduction of the EIA in relation to some widely held views on the implementation of subsidies and their budgetary impacts. This is followed by a discussion on the influence of policy effectiveness issues, in particular the debate on free riding and on policy design over time. Finally, it evaluates a somewhat neglected issue of the EIA scheme, namely that of the use of a dynamic technology list to define eligibility for the EIA. The paper ends with a brief discussion on the lessons learned.
Box 1. Investment incentives through the Energy Investment Tax Allowance (EIA)
The objectives of the Dutch EIA are to improve energy efficiency and increase the share of sustainable energy by stimulating investments in energy-saving or sustainable energy technologies. The basic principles of the EIA have remained the same over the past 15 years.
The EIA stimulates the adoption of energy-saving or renewable energy technologies by lowering up-front investment costs and is conditional on investments that are screened, ex ante, by the regulating agency. If (for profit) firms invest in technologies listed in the annually updated ‘Energy List’, they can deduct some of the investment costs from their taxable profits or taxable income in the year of the investment. With investment level I, (corporate or income) tax rate t and EIA rate s, firms can deduct an amount s*I from their taxable profits or taxable income. In case profits or income are positive, the taxes paid decrease by t*s*I. As Dutch corporate and income taxes are progressive, the more profit you make, the more you benefit from the EIA. In 2011, the net tax reduction, on average, was 10% of the investment costs.
The following examples relate to 2012, when 41.5% of the invested amount I could be deducted from taxable profits or income.
Firms with a taxable profit of more than EUR 200 000 faced a corporate tax rate of 25%, which implied a corporate tax reduction of EUR 0.104*/.
Firms with a taxable profit of less than EUR 200 000 paid a corporate tax rate of 20%, implying tax savings that would equal EUR 0.083*I.
Entrepreneurs paying personal income tax with a taxable income of more than EUR 55 695 faced an income tax rate of 52% which implied a tax reduction of EUR 0.216*I.
Compared to investments in conventional reference technologies, the EIA increases the net present value (NPV) (decreasing the payback period) and reduces the need of financing for energy saving investments. Thus, the EIA improves the odds for the adoption of energy-saving or sustainable technologies (see Van Soest and Vollebergh, 2011). Note that annual savings due to the use of more energy-efficient technologies depend on the reduction in energy use compared to that of a conventional, reference technology and on the energy price. Annual savings increase with rising energy prices and, as a result, so does the NPV of energy-saving technologies. This also means that less EIA support will be needed to bridge the NPV gap when energy prices rise – via market price or energy tax increases. Similarly, investments in sustainable energy sources often lead to lower variable costs, even though the up-front investments costs may be higher compared to those of conventional technologies. If energy prices increase, differences between the variable costs of conventional and sustainable energy technologies may become substantial. When net adoption costs are defined as the actual adoption costs minus the investment subsidy provided, technologies with lower net adoption costs are likely to rank higher in the order of available alternative technologies. Therefore, energy-saving technologies, which usually have higher actual adoption costs than traditional technologies, will be adopted more readily when subsidised than in the absence of subsidy. If firms are heterogeneous, for instance with respect to currently used technology or capital (or borrowing) constraints, the adoption of a particular technology is likely to follow a gradual pattern over time – a so-called penetration curve (see Figure 2). A subsidy will shift this penetration curve to the left, whereas the overall penetration might be lifted somewhat due to lower net costs of a particular technology. Note that this line of reasoning holds even if firms belong to different risk classes, that is, if they differ with respect to the discount rate applied to their investment decision.
The EIA may also reduce search costs by investors to find particular technologies because of the annually updated Energy List which is used to consider eligibility for the subsidy. This Energy List contains generic technologies that meet a certain energy-saving standard or a selection of novel, but proven, technologies with a higher energy-saving potential than conventional reference technologies. Therefore, the list itself may also have an important attention value that may contribute to reduce information failures in the adoption market.
Apart from its effect on adoption decisions, the EIA is likely to also stimulate new inventions in the fields of energy-saving and sustainable energy technologies (OECD, 2010; Vollebergh, 2012) The EIA offers innovators a stimulus to develop new technologies that have a better energy efficiency performance than reference technologies, as these investors could propose their new inventions to be added to the Energy List, which in turn would likely increase sales and profitability of those new inventions. In annual updates, technologies with a sufficient level of market penetration (thus having become conventional themselves), are removed from the list. This dynamic element not only reduces the problem of free riding on the demand side (see also Section 3), but also reduces the risk for innovators of not surviving the market-introduction phase for new technologies. In this way, the EIA indirectly stimulates particular research avenues and therefore directs R&D investments into specific directions.
Figure 2. Penetration curve of new innovations
Source: Van Soest and Vollebergh (2011).
2. The Energy Investment Tax Allowance in the national budget
In the second half of the 1990s, Dutch energy policies went through a period of change, inspired by a left-liberal political wind that blew throughout Europe, an increased concern over climate change and the European discussions on the liberalisation of energy markets. In 1994, a left-liberal coalition government came into power in the Netherlands for the first time in Dutch history. One year later, they presented ambitious goals for the saving of energy, production of sustainable energy and reduction of greenhouse gas emissions in the ‘Third Energy Plan’ (Dutch House of Representatives, 1995). A diverse set of energy policies was agreed upon, characterised by a shift towards the use of more market-based instruments. Most of these instruments combined objectives of promoting energy saving, sustainable energy production and greenhouse gas emission reduction.4
Furthermore, the Dutch Government also started to experiment with covenants in environment and energy policies. In the 1990s, several energy covenants were entered
4. For most instruments, however, it was not clearly described which of the three objectives would be leading and to what extent the instrument had to contribute to the overall objective of an annual 2% improvement in energy efficiency (which was reduced later), achieving a share of sustainable energy of 14% in total energy production and a greenhouse gas emission reduction of 20% by 2020, compared to the 1990 level.
into in which a number of economic sectors voluntarily promised to reduce their energy use in exchange for a government contribution to facilitate investments in new technologies. Moreover, the government introduced a Regulatory Energy Tax (REB) for small-scale energy users (in particular electricity and gas), to be implemented at the beginning of 1996, following a failure to introduce a CO2 tax on a European level. To
compensate small firms for the additional tax burden of the REB, the corporate tax rate was reduced. In addition, to stimulate investments in energy saving technologies and sustainable energy, the Dutch Government also granted rebates to refund part of these tax revenues in the form of a tax allowance: the EIA.5
The EIA subsidy scheme was explicitly designed as a tax allowance. Because the coalition aimed to reduce overall government expenditure, the design of such a fiscal instrument had the advantage that the subsidy would be regarded as a so-called off-budget expenditure that would not be subject to the usual government budget rules of that time. Indeed, the combined use of a tax on small-scale energy use and a fiscal allowance scheme to compensate for the reduced after-tax income of small firms enabled the government to implement their plans without further budgetary consequences.6 During
the first years, the EIA was targeted at Small and Medium-sized Enterprises (SMEs) and at sectors with energy-saving covenants, in order to compensate them for the REB. This Dutch policy mix, combining a tax on (small-scale) fossil-fuel-related energy use (electricity and gas) with an abatement subsidy (adoption of energy-saving technologies or renewable energy) is a two-part instrument ‘avant la lettre’. The subsidy stimulates adoption of cleaner production technology, and therefore makes the 'dirtier' inputs relatively more expensive, causing substitution away from this dirty input. However, the abatement or investment subsidy is also likely to be responsible for (excessive) entry of new firms into the industry (Baumol and Oates, 1988). This classic objection against using environmental-related subsidies could be solved by using an additional policy instrument, such as taxation of dirty input or output (Eskeland and Devarajan, 1996). As demonstrated by Fullerton and Wolverton (1999), a properly designed two-part instrument could exactly match the incentive effects of a direct tax on pollution or waste. Note that these taxes also raise revenues that finance the subsidies and therefore reduce the negative effect of the marginal costs of public funds.
From the start, the EIA attracted a large number of applications. Despite only a modest promotion campaign, there were over 10,000 applications per year, instead of the expected 3,000 (Van der Lande and De Vries, 2001). The number of applications grew rapidly up to 2001, and total EIA investments almost tripled (see Figure 1). Not surprisingly, the budget implications were considerable. Between 1997 and 2002, the overall amount of taxes foregone rose from EUR 45 million to EUR 198 million. Despite its success, compensation for the introduction of the energy tax through the EIA was initially rather weak. The share of EIA expenditure as a percentage of tax revenues from the REB from firms (mainly SMEs) was only 10% to 15% in the 1990s. This percentage increased after 2000, with a peak of 35% in 2002, and then gradually declined. Compensation through the EIA was only implicit and part of a package of compensation measures
5. In the same period, several small-scale and sometimes short-lived subsidy schemes were introduced, focusing on particular sectors, energy sources or technologies, such as subsidies related to R&D, pilot projects in renewable or energy-saving technologies, and investments in wind, solar or biomass technologies.
(including changes in corporate and income taxes). The compensation was never explicitly laid down in budgetary rules or other types of agreement.
The initial strong growth in tax expenditure induced considerable budget concerns. At that time, tax expenditures, such as the EIA and related fiscal measures, such as the MIA (tax allowance for investments in environmentally friendly technologies), VAMIL (accelerated depreciation of investments in environmentally friendly technologies), and the income tax allowance related to investments in shares of environmentally friendly firms, together created a large, uncontrolled burden on the overall budget of the Dutch Government. Between 1997 and 2002, overall tax expenditure in relation to these instruments rose from EUR 150 million to EUR 429 million (CBS et al, 2008). Not surprisingly, the EIA also posed an increasing risk of overrunning the preliminary budget. Clearly, the set of tax expenditures on investment in energy saving, environmental equipment and renewable energy created an off-budget risk to the general budget because of its open-ended structure: any application considered eligible for subsidy automatically would be accepted. Thus, regardless of whether the number of applications grew and/or the amount of investment involved increased, the tax authority had to grant every single application. This characteristic of the tax expenditure schemes in the Netherlands induced a fundamental debate on how to gain more control over tax expenditure in general. A first step was that of making expenditures transparent to the Dutch Parliament and, thus, ultimately, also to the tax payer. From 2001 onwards, tax expenditures were to be accounted for in the Annual Tax Plan. This plan was to be submitted to parliament, together with the annual budget (Ros, 2003). Moreover, the new budget system ‘From Policy Budget to Policy Accountability’ (VBTB) required that ministries provide more insight into their policy objectives, the instruments implemented and their effects. Tax expenditure also had to be evaluated every five years.
Despite these measures, tax expenditures such as the EIA still posed a considerable risk to the overall national budget. This is illustrated in Figure 3. The initial rise in applications was clearly accommodated in the beginning. The EIA budget grew steadily up to 2001, when the scheme was first evaluated and a number of adaptations were proposed. But even though in 2002 the number of applications started to decline rapidly due to the changes made to the EIA Energy list, the total amount in investments under EIA subsidy still showed a remarkable increase (see Figure 1). Subsidy applications for relatively expensive renewable energy installations concerned far higher amounts than in all the previous years. Therefore, tax expenditures were threatening to exceed their ex ante estimate, which is why in that year the Dutch Minister of Finance closed the EIA earlier than planned. The same happened in 2006 and 2007, when the EIA also closed early to avoid too large a burden on the national budget.7
Apparently, the budgetary tensions did not lead to the decision to stop providing this tax allowance altogether or switch to a different type of subsidy. The EIA is part of a set of subsidy schemes provided by the Dutch Government, which – together – are aimed to induce firms to invest in energy-saving, environmentally friendly and renewable energy technologies. This set of schemes was set up gradually and shows a clear pattern of trial and error (Roosdorp, 2012). Also, the early closures of the EIA made the government look unreliable and created a great deal of additional uncertainty among the
7. The temporary expansion of the budget in 2006 was due to the closure of another subsidy scheme for renewable energy investments. The EIA was used to bridge the gap between this closure and the take-off of its successor (Roosdorp, 2012).
entrepreneurs. Therefore, the budget system for the EIA was changed, in 2009, in a way that allowed for a longer term budget equilibrium. Thus, underspending in one year can be used to compensate for overspending in another year.
Finally, the EIA has been used to stimulate investment in the construction sector after the start of the economic crisis in 2008. The impact on the budget has been quite limited, however. The sharp decline in tax expenditure, as seen since 2006, clearly reflects the underutilisation of the EIA budget since 2008.
Figure 3. Ex ante budget estimates and actual tax expenditures of the EIA
Despite of all changes in Dutch energy policies, in general, and the earlier-than-planned closure in 2002, 2006 and 2007, the EIA was never abrogated, in contrast with several other instruments to stimulate energy saving or the production of sustainable energy that were (Noailly et al., 2010).8 First of all, its policy objectives remained high on the agenda
throughout the last 15 years. Second, the budgetary turbulence was at least partly due to perfectly explicable problems or flaws in the different subsidy schemes used in the Netherlands (see also Section 3). Third, it was widely believed that several options were available to prevent budget overruns and to increase the effectiveness of the EIA (energy saved (in PJ)) and its efficiency (amount of PJ per euro saved). The following section provides a detailed discussion on this assumption. Whatever the reasons, a number of measures have been taken since 2002 to improve the performance of the EIA and to minimise its budgetary impact; for example a reduction of the amount of overlap between subsidies (with MIA, VAMIL and MEP), lower tax-deduction percentages, higher energy-saving standards and regular updates of the Energy List. In that respect, the EIA is another example of an instrument that is being improved through 'learning by doing'.
3. Subsidy effectiveness and efficiency: free riding and more
This section concentrates on the response by the Dutch regulator to well-known incentive compatibility issues of subsidy schemes. Shortly after 2000, when the budgetary impacts of the EIA and some of the other subsidy schemes started to grow very fast, the Dutch Government evaluated the effectiveness and efficiency of those schemes through an interdepartmental commission (IBO commission) chaired by independent experts (De
8. For instance, a similar measure like the EIA for non-profit firms was terminated in 2002. The Energy Investment Subsidy for Non-profit firms used a similar Energy List, but provided direct support instead of tax deduction because non-profit firms do not pay corporate or income taxes.
Beer et al., 2000).9 The available empirical evidence on the effectiveness and efficiency
of comparable subsidies seemed to support the conviction of economists that subsidies are inefficient. Some studies reported that the number of free riders, i.e. the number of economic agents whose behaviour was not affected by any such subsidy, tended to be very high (e.g., Malm, 1996; Wirl and Orasch, 1998; Wirl 2000).10 Following free-rider
issues related to comparable support schemes reported in literature, such as the Demand-Side Management scheme in the United States in the 1990s, the Dutch commission raised similar concerns.
The weak point of such schemes is that subsidies are usually not only applied for by firms for whom the investment opportunity would otherwise not be profitable, but also by those who would invest in such technology anyway, even without being subsidised (Wirl and Orasch, 1998; Wirl 2000). Indeed, for some firms, the costs of purchasing an energy-saving technology may be smaller than the benefits it provides (e.g. in terms of reduced energy bills). For these firms, such a subsidy would just be a windfall profit. For other firms, the subsidy would not be high enough to offset their net investment costs and, therefore, would not induce them to adopt the energy-saving technology. Their behaviour, thus, also would remain unaffected by the scheme. The only firms that would change their behaviour and decide to adopt such new technology are those for which the costs would exceed the benefits by an amount that is lower than the awarded subsidy. However, depending on the cost structure of the firms, this third type of firm may actually represent only a small fraction of all firms. The first type of firm may be the dominant category. According to this assumption, a large amount of money would be spent in subsidies without inducing much additional investment. In combination with the observation that public funding of subsidies is costly to society, the welfare effects associated with subsidies may even be negative.
The IBO-commission carried out a policy study to evaluate the effectiveness and efficiency of the EIA scheme (see De Beer et al., 2000, IBO, 2001). This study reported also a substantial amount of free riders. Using results from a survey among a sample of EIA applicants between 1998 and 2001, De Beer et al. (2000) asked respondents whether or not they would have made the same investment if the EIA had not been available; 52% of them answered affirmative and, therefore, could be considered ‘free riders’. This percentage, however, varied strongly between subsidised technologies (see also Aalbers et al., 2011). The study also showed that considerable overlap existed between different subsidy schemes, as a particular investment could be eligible to enter into different subsidy programmes at the same time. Finally, bottom-up estimates of investments in specific reference technologies – technologies that would have been used in the absence of the scheme – still revealed substantial energy savings, even when taking the technology-specific numbers of free riders into account.
9. These interdepartmental commissions were used to critically assess government expenditures in different fields by independent experts. Although the government had no obligation to embrace the conclusions by these commissions, their evaluations were quite influential.
10.The evidence, however, was mainly confined to this Demand Side Management (DSM) programme by electric utilities in the United States. Although Hassett and Metcalf (1995) provided some counterevidence, showing that energy-conservation credits given to households were effective in stimulating the penetration of modern energy-saving technologies, the overall impression of such schemes was very negative.
Figure 4. Estimated energy savings due to EIA investments
Source: Senter, Senter Novem, NL Agency, 1999-2012. Statline CBS.
Figure 4 illustrates bottom-up estimates of annual energy savings and annual energy savings per granted application (in PJ).11 According to these estimates, 29 PJ of energy
was saved in 2001 due to the EIA, representing about 1% of overall energy use in the Netherlands around that time. Although the estimated effective energy savings for 2001 would be much lower if the ‘free-rider’ effect would have been taken into account (see De Beer et al., 2000, p.60–61), these numbers are still substantial. These reported effects are likely to have contributed to the continuation of the scheme. Moreover, De Beer et al. (2001) also concluded that several measures could be implemented to improve the effectiveness and efficiency of the scheme and the IBO Commission (2001) subscribed to these conclusions. Several of these measures are described below.
First, relatively simple administrative measures related to the introduction of specific preconditions that were to be met by applicants to be eligible for the subsidy, such as already having approved construction licenses (in 2003) or environmental permits (in 2007). These measures reduced the inflow of applications for substantial investments for which construction and environmental licenses were not yet certain. In this way, the budget would be spent on projects with the best prospects of fast realisation. Large projects for which licenses were not yet certain, especially those related to wind energy, had previously claimed large parts of the EIA budget and thus caused budget overruns and premature closure of the subsidy scheme. As a consequence, several promising applications were unable to apply for tax deduction, whereas a number of the projects that had in fact been accepted (and accounted for in the EIA accounts) did not proceed for years after their acceptance. The additional application requirements created more certainty about the acceptance of a particular application and therefore about the realisation of the energy saving in a given budget year.12
11.These numbers do not account for losses associated with free-riding or with rebound effects as revealed by the study by De Beer et al. (2000). According to the estimates of NL Agency, energy savings represent reductions in energy use compared to less energy-efficient alternatives prevailing in the market. Investments in renewable energy equipment are assumed to ‘save’ energy in the form of fossil-fueled power generation (measured against the Dutch energy mix) or consumption of an equivalent amount of gas (e.g. with biogas).
A second measure consisted of reducing the considerable amount of overlap between subsidy schemes. Until 2002, investments quite often were eligible for subsidies under a number of different subsidy schemes, such as the VAMIL. The VAMIL scheme provides entrepreneurs a liquidity and interest advantage by allowing them the flexibility to decide when to depreciate the costs of energy-saving or environmental investments. The VAMIL also uses a so-called Technology List from which firms can select technologies that are granted subsidy. Originally, the lists used for the EIA and VAMIL contained considerable overlap of technologies. From 2003 onwards, this overlap ended because of the removal of the energy technologies from the Technology List of the VAMIL; thus, it was no longer possible to apply for subsidy for the same investment under both EIA and VAMIL. Interestingly, the strain on the EIA budget of 2002 can be explained largely by applicants anticipating these upcoming restrictions to prevent multiple subsidies being awarded to the same investment. Over 55% of the subsidies applied for in that year were related to wind turbines (Senter, 2002).
A third measure was that of improving the screening of the types of technologies presented on the Energy List. Initially, in their subsidy applications, firms could only select technologies from this public list. Whether or not to include technologies in the list depended on the estimated payback period for industrial investments (this had to be within 5 years, including tax deductions), with a somewhat longer period being allowed for investments in construction (see also Section 4). Therefore, the Energy List reflected technologies that were especially interesting for SMEs. In anticipation of possible criticism from the European Commission about the EIA discriminating in favour of specific market participants, and thus running the risk of being considered state aid, from 1999, a generic category was added which allowed all investments in energy saving technologies that would meet a certain minimum energy-saving standard, measured in the amount of energy saved per euro invested (Nm3 gas equivalents per euro).13 As this made the EIA
open to all firms on an equal basis without the possibility of discretionary government intervention, the regulation could not be considered to be inadmissible on the grounds of being state aid.
Table 1. Share of free-riders per technology in 2001
Technology Share of free-riders
(%) Technology Share of free-riders (%)
Energy Blinds 66 Heat pumps 59
Lightweight semi-trailers 36 Wind Turbines 17
Condensers 49 Combined Heat and Power 48
High Efficiency Boilers 58 Energy-efficient Lighting 30 Source: De Beer et al. (2000).
However, an evaluation of the numbers of ‘free-riders’ in 2000 showed that certain technologies should not be on the list at all. The cost-recovery period for some technologies already would be very short because of their market-based energy-saving performance, and relative to the critical payback period used in the particular sector. Additional financial support was likely to increase the overall number of ‘free-riders’ (see Aalbers et al., 2011).14 The regulating agency's response to the outcome of this
evaluation was to update the Energy List and apply maximum saving standards per euro
13.Normal m3 gas equivalents; 1 Nm3 gas eq = 31.65 MJ.
14.For instance, lightweight trailers accounted for 21% of the total EIA credits in 1997, even though they had a negative cost-recovery period (when taking energy saving into account).
invested to all the listed technologies, as well as to generic investments eligible for
subsidy since 2002.
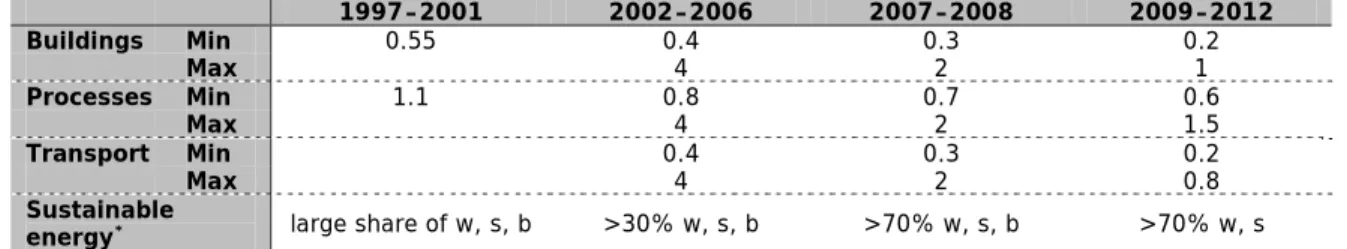
Table 2. Saving standards for different investment categories (in Nm3 gas equivalents per euro invested)
1997–2001 2002–2006 2007–2008 2009–2012 Buildings Min 0.55 0.4 0.3 0.2 Max 4 2 1 Processes Min 1.1 0.8 0.7 0.6 Max 4 2 1.5 Transport Min 0.4 0.3 0.2 Max 4 2 0.8 Sustainable
energy* large share of w, s, b >30% w, s, b >70% w, s, b >70% w, s
* The standard for sustainable energy refers to a minimum share for hydropower (w), solar power (s) and biomass (b) in total. Source: Senter, Senter Novem, NL Agency, 1999–2012.
Under maximum standards, technologies that are highly energy-efficient (compared to available alternatives) are no longer eligible for subsidy. These maximum energy-saving standards originally had been set at 4 Nm3 gas eq per euro invested. Table 2 shows that
these standards were subsequently made more stringent and category-dependent. The standard for investments in processes, construction and transport was reduced in 2007 to 2 Nm3 gas eq per euro invested and in 2009 to 1.5 Nm3, 1 Nm3 and 0.8 Nm3,
respectively. The Energy List also was updated more rigorously, which meant that technologies were removed from the list more stringently than before. Currently, rules have changed in such a way that only those technologies are included in the Energy List for which the EIA reduces the subsidy inclusive payback period to 4 years and in some cases to a maximum of 12 years. This also resolves a more formal overlap between the EIA and the Dutch Environmental Management Law (Wet Milieubeheer), which, in principle obliges entrepreneurs to invest in energy-saving technologies if the cost-recovery period is less than 5 years.15
In addition, specific provisions were implemented for the category of sustainable energy technologies in the period 2001 – 2006 (see also last row in Table 3). As noted before, EIA investments have gradually increased since the regulation was first implemented. In 2001 and 2002, applications for sustainable energy projects began to make up a much larger share of total investments than before. Where in the year 2000 only 12% of investments related to sustainable energy, this increased to 60% only 2 years later (the number of applications in sustainable energy only increased from 1.7% in 2000 to 4.3% in 2002, implying that investments per application were substantially larger than for other investment categories). In 2002, over 55% of the total in accepted investments was related to only one technology – that of wind turbines (see Table 3). A similar imbalance occurred in 2006. In a response to the large focus on only a few, expensive technologies, the regulating agency explicitly made the standard for sustainable energy more stringent, and only included technologies that would use at least a minimum share of hydropower, solar power or biomass. Moreover, since 2009, subsidy applications for biomass no longer are approved. Finally, maximum investment caps on wind turbines were introduced in 2005 and became more stringent in 2008.
15 Enforcement of this law is notoriously difficult and depends on (subjective) judgment by lower authorities
Table 3. Top 10 of the main technologies subsidised in 2002 and 2006
2002 2006
Technology % of total
investment Technology investment % of total
Wind turbines 55 Wind turbines 22
Generic existing processes 3 Generic existing processes 13 Heat pumps or heat pump boilers 3 Generic sustainable energy 12 Cogeneration plants >60kW and <2MW 3 Cogeneration plants >2 MW 8 Energy shields in greenhouses 4 Cogeneration plants >60 kW and <2
MW 5
Biomass pre-treatment plants 2 Biomass-burning plants 5
Insulation 2 Generic existing buildings 3
Heat/cold buffer systems 1 Anaerobic fermentation plants 4
Generic existing buildings 1 Generic new processes 3
High efficiency gas-fired fryers 1 Energy-saving freezers and
refrigerators 1
Source: Senter, 2002; Senter Novem, 2006.
A final instrument used for increasing the effectiveness of the EIA was the reduction in the rate at which investments were subsidised. The EIA started with a regressive tax deduction system, ranging from 40% to 52%, depending on company profit level. In 2001, however, the deduction percentage was set to a flat rate of 55%. In 2005, new, experimental research initiated by the Dutch Ministries of Economic Affairs and Environment had shown that the adoption of new technologies was not very dependent on the rate of subsidisation (Aalbers et al., 2005). A large number of participants in these research experiments still invested in technologies for which adoption was inefficient from their own perspective, i.e. had a payback period of below zero. These findings were reported for both students and managers of firms that had been granted the EIA subsidy before (Aalbers et al., 2009). On the basis of these results, the regulator decided to lower the deduction rate to 44% in 2005 and once again in 2011 to 41.5%. These changes, together with those in corporate and income tax rates, resulted in a reduction in the average tax benefit from 18% in 2001 to 10.5% in 2007.16
These measures all have been introduced by the regulating agency to improve the incentive compatibility of the subsidy scheme and, therefore, its overall effectiveness and efficiency (Arguedas and Van Soest, 2009; Aalbers et al., 2011). Several indicators suggest that the performance of the allowance scheme indeed strongly improved after these measures became effective (since 2002). Figure 5 shows that, in particular, the annual amount of energy saved per invested euro clearly increased following a gradual decline since 1999, and, even more importantly, since 2002, per euro of tax expenditure (i.e. per euro in tax deducted by the investing firms). Also, the average amount of energy saved per application increased faster than the total, despite the fact that technologies with a high saving potential (per euro invested) were excluded from the list because of the more stringent maximum energy-saving standards.
16.The average deduction percentage depends on the number of applicants paying corporate or personal income tax in a given year and their profit and income levels. As corporate and income taxes are progressive, entrepreneurs with higher profits benefit more from the EIA than those that make lower profits. Moreover, personal income tax payers usually benefit the most, as their tax rates are higher than those of corporations.
Figure 5. Annual amounts of energy saved due to EIA investments
Source: Senter, Senter Novem, NL Agency, 1999–2012. Statline CBS.
Also the number of free riders has decreased as reflected in the five-year evaluations of the EIA. Aalbers et al. (2007), using the same survey as De Beer et al. (2000), report an average free-rider share of 47% for the year 2005, which is exactly the same as in another study around that time (2007). Given the changes to the regulation and the Energy List, the share of free-riders is expected to have continued to decrease since then. The slow pace of the decrease in the percentage of free-riders illustrates the difficulty of creating incentive-compatible contracts in actual practice; for instance, because a subsidy scheme should be non-discriminatory on legal grounds. The extent to which the (exogenous) rise in energy prices between 2001 and 2007 has influenced the number of free-riders is still unclear,17 as is the question of whether the more stringent
standards for technologies to be included in the Energy List were sufficiently reformed to compensate for this factor.
Despite the improvements in subsidy effectiveness since 2002, the EIA scheme remains vulnerable to dynamic changes in the types of technologies that may be subsidised (which is closely related to the scheme's interaction with other policy instruments) as well as to certain exogenous developments (e.g. changes in energy prices net of tax, which affect the payback period of investments). For instance, the EIA budgetary problems of 2002 were mainly due to a sudden strong increase in the subsidy applications by electricity producers for wind turbines and biomass installations, something that was closely linked to the reform of the VAMIL subsidy. In contrast, the inflow in 2006, causing the large spike in investments accepted for subsidy (Figure 1) as well as in energy saving (Figure 4), was intentional (see also the spike in budget allocation in Figure 3). In that particular year, the EIA became available to technologies for which subsidies could no longer be obtained through another national subsidy scheme for renewable energy investments: the ‘Environmental quality Energy Production’ (MEP),
17. In the Netherlands, the gas price is closely linked to the oil price. This also contributes to an upward shift in the electricity price. Rising energy prices also shorten the cost-recovery periods for the subsidised technologies, which, in turn, may increase the number of free-riders. This potential impact requires a more careful elaboration. The rise in energy prices is exogenous and will impact the various technologies differently (e.g. technologies with long versus short cost-recovery periods, and those requiring large or small investments). The exogenous changes in energy prices will impact these technologies differently, depending on the cost-recovery periods and investment levels of before these changes.
which was introduced in 2003. The popularity of the MEP scheme also induced its sudden closure in early 2006, but its successor did not start before 2007 (Roosdorp, 2012). The EIA was also used for stimulating investments in the construction sector after the start of the economic crisis in 2008, as explained before.
The renewable energy technologies appear to create much more turbulence than the energy-saving technologies. Figure 5 presents the main performance indicators, when controlling for the difference between the two main categories that the EIA aims to support. Interestingly, sustainable energy investments were indeed shown to be responsible for the spikes in the EIA budget of 2002 and, in particular, 2006, but not for the spike in the budget of 2004. Also, investments in sustainable energy contributed relatively less to the saving objective (per euro of subsidy) than those in energy-saving technologies – with 2006 being the main exception. Despite the fact that wind turbines covered a large part of the investments in those years, the spikes were mainly caused by investments in biomass installations and generic sustainable energy technologies.18
Figure 6. Energy savings for investments in sustainable energy and energy-saving technologies (Million EUR and Nm³)
Source: Own calculations using data from Senter, Senter Novem, NL Agency, 1999–2012a, b.
A final issue is the overlap of the EIA with the EU Emissions Trading System (EU ETS) (Aalbers et al., 2007). Even though the EIA has no explicit objective to reduce CO2
emissions, the overlap of the EIA with the ETS reduces its potential contribution to the overall reduction of the amount of CO2 emissions. This is particularly the case if EIA
subsidy is used for CO2 reduction investments by firms that also participate in the ETS;
for example, by investing in wind turbines. Such an investment reduces demand for permits, which – given the overall cap – enables emissions by other installations or firms to be covered by ETS permits. This problem applies in particular to renewable energy investments by large ETS firms, but also by firms investing in CHP, such as those in the horticultural sector in the Netherlands, because they also fall under the ETS. Subsidising CHP even has perverse effects. CHP saves on electricity without a reduction in CO2
18. The amount of energy saved per euro invested is relatively small for wind turbines (about 0.55 Nm3 of gas
equivalents per euro invested), whereas for biomass and generic technologies, the saving potential is much greater (exceeding 3 Nm3 of gas equivalents per euro).
emissions but also allows others to increase their CO2 emissions as the delivery of the
saved electricity is subject to the ETS (Aalbers et al., 2007). Finally, also the subsidisation of energy-saving equipment by the EIA contributes indirectly to a reduction in the ETS permit price. If less electricity is generated due to energy savings, the firms participating in the ETS can sell more ETS permits and thus cause a price decrease. With all costs being fully passed on, this price reduction may also reduce the electricity price, thus increasing energy demand, which, in turn, may cancel out the initial energy savings.19 The impact on the ETS carbon price is unknown (Aalbers et al., 2007), but
likely to be very limited, as the subsidy scheme is rather small. Compared with, for instance, the Dutch SDE+ subsidy scheme or the funds generated with the feed-in tariff used in Germany, the EIA can only have a minor effect on the ETS carbon price.
4. Energy list, technology adoption and lobbying
A crucial element of any subsidy scheme is the decision to make some specific type of investment eligible for subsidy. Interestingly, the Dutch tax allowance scheme is not only characterised by its upfront payment of subsidies, thus lowering the initial investment costs and therefore also the financing costs, but also and even more so by its use of an explicit Energy List.20 This list is updated once a year, at the request of firms supplying
energy-saving or sustainable energy production technologies. To be eligible for inclusion, a technology must result in a substantial reduction in energy consumption, and the should not (yet) be in common use. This last characteristic causes this tax allowance scheme to be quite different from subsidy schemes that preselect technologies or provide feed-in tariffs (e.g. per unit of electricity produced). For this reason, the EIA subsidy could also be perceived as a technology adoption programme aimed at the penetration of new, hardly adopted energy-saving or sustainable energy production technologies. Even though this is not the direct objective of the EIA, this characteristic also partly explains its success and survival. Moreover, a dynamic impact may also be expected, such as on the supply of new technologies (‘inventions’).
The idea behind a technology adoption programme is to establish or re-establish a social optimum in the context of technology adoption spillovers. Instead of representing a fine for generating pollution, the tax expenditure provides a bonus for performing more of the ‘good’ activities, because they have positive ‘spillover’ effects. Indeed, diffusion of new technologies is less likely to be instantaneous across a heterogeneous population because of all sorts of information failures (see also Popp et al., 2010; Vollebergh, 2012). From this perspective, a tax allowance for specific technologies is likely to lower the net adoption costs – i.e. the actual adoption costs minus the investment subsidy provided – of the subsidised technologies, causing them to rank higher among the available alternative (reference) technologies (Van Soest, 2005). Therefore, the subsidised technology will be adopted more readily than in the absence of such a tax allowance, and the overall penetration will be increased somewhat due to its lower net cost (see also Box 1).21
19. According to CPB (2001), the rebound effect of the EIA due to the demand effect would range between 0% and 20%. This implies that 0% to 20% less energy will be saved than calculated on the basis of investments related to EIA investments.
20. Such a technology list is used by three of the most enduring subsidy programmes in the Netherlands; the VAMIL, the MIA and the EIA. The MIA is similar to the EIA, but focuses on investments in environmentally friendly technologies. The VAMIL has been discussed above.
21. Note that this line of reasoning holds even if firms belong to different risk classes; that is, if they differ with respect to the discount rate they apply to their investment decision (DeCanio and Watkins, 1998).
Clearly, the EIA’s Energy List is the focal point for both the demand and supply of new energy-saving and sustainable energy technologies. Therefore, the discussion first looks at its role on the demand side and subsequently, on that of inducing new inventions on the supply side. Finally, an elaboration explains how the list provides interesting opportunities for the regulating agency to reduce rent-seeking behaviour on both sides, even if inventing firms are likely to lobby for their technologies to become eligible.
The role of the list on the demand side – i.e. on firms investing in new equipment – concerns the so-called attention value (De Beer et al., 2000). The list contains state-of-the-art proven and existing technologies that can readily be implemented in industrial processes, buildings or transport. The list provides information to entrepreneurs about feasible technologies they may not yet know about. In this way, firms save on the costs related to their searches for new technologies that would reduce their energy costs or increase their production of sustainable energy. The list thus acts as an information device that reduces search costs for entrepreneurs and corrects for information failures. De Beer et al. (2000) conclude that it is difficult to determine the attention value of the Energy List. Only 4% of respondents in their survey indicated that the list had affected their investment decisions. The attention value did not play a role for 40% of respondents and the other 56% remained undetermined. This may have been because this list also had a considerable overlap with the VAMIL, at that time, and also because especially SMEs use intermediaries to manage their bookkeeping system, tax declarations and subsidy applications. In such cases, the attention value would run through a third-party channel but no questions to explore this link were included in that survey.
On the supply side, the list may also contribute to the development of new inventions by providing innovators with a platform that eases the introduction of the newly invented technologies. Even though the tax allowance only aims to speed up market penetration for existing and proven innovations that have not yet penetrated the market, new inventions are likely to be stimulated as well (Popp et al., 2010; Acemoglu et al., 2012; Vollebergh, 2012). The list makes particular innovations more widely known and shortens the market-introduction phase, which is likely to increase incentives for inventors to invest in these types of technologies (‘directed technological change’). The most popular technologies also provide direction for the types of inventions and innovations for which entrepreneurs are looking. Moreover, the annual update of the technology list could, in principle, also contribute to increased competition among inventors and innovators. As long as the list is updated on a regular basis and the number of suppliers is large enough, inventors and innovators are stimulated to continually improve their technologies and lobby to be included in or remain on the list, preferably before their competitors do so. This also reduces the risk of exploitation of asymmetric information by the suppliers of innovations,.
However, the extent to which these dynamic incentives work in actual practice, so far, has not been fully established. A survey by the EIM (2007) reports that marketing and growth policies of many suppliers indeed depend on the types of technologies on the list. These suppliers argue that their sales are positively affected by changes in the EIA. Also Figure 7 provides some evidence that the list is quite dynamic. No information is available about the speed at which energy saving aspects of individual technologies improve over time.22 Nevertheless, the large number of modified technologies suggests
22. This assessment would require detailed information on actual savings for the listed and reference technologies; something that has been left for future research.
high dynamics even though the numbers for entirely new and removed technologies are relatively small.
Figure 7. Changes in technologies that are included in the Energy List
Source: Senter, Senter Novem, NL Agency, 1998–2012.
Finally, the use of the technology list facilitates regulatory responses from the regulating agency. The annual update allows the agency to quickly adapt standards, remove free-rider technologies or reformulate the focus of the technologies eligible for subsidy. The previous section already illustrates the importance of the screening of the Energy List in order to improve the effectiveness and efficiency of the subsidy scheme, and to react to unforeseen changes in regulatory or other circumstances. The best example is the radical shift in applications for sustainable energy within the EIA in the 2002–2006 period (see Figure 7). This major shift in applications, reaching a peak of 60% of all investments in 2002 and 2006, is mainly due to the incoherence and trial and error process of finding proper subsidy schemes for sustainable energy in the Netherlands (Roosdorp, 2012). In this turbulent period, old instruments were reformed to reduce overlap (e.g. VAMIL), but also new instruments were introduced and abolished, such as the MEP between 2002 and 2006.
One potential risk of the Energy List is related to the information that would be required to judge whether a particular technology is eligible to be included. This information would need to contain a large degree of technical detail to enable calculation of the payback period and energy savings per invested euro. In addition to the differences in technology-specific (bottom-up) payback periods per sector and even per firm, there are also differences in critical payback periods that are used by firms to evaluate their investments.23 As a result, a technology that seems to meet the standards for one sector
may still be considered a free-rider technology for another. The difficulties related to this selection process became especially clear in the first years of the EIA.
23. According to Aalbers et al. (2011), half of the firms applying for subsidies do not even use traditional finance evaluation schemes, such as those involving critical payback periods.
Figure 8. Share of investments in different types of technology
Source: Senter, Senter Novem, NL Agency, 1999–2012.
Selecting technologies also makes the regulating agency susceptible to lobbying by firms seeking subsidies for certain technologies as well as by firms supplying new energy-saving technologies. In the first years of the EIA, technologies listed were especially focused on SMEs and the sectors with which the government had covenants. These firms had an important vote in the set-up of the first list. They were explicitly consulted about the technologies they planned to invest in. In later years, the influence of these firms was reduced and the standards for being included in the Energy List were applied more strictly. Each year, a number of technologies are removed, accepted or reformulated. Moreover, the introduction of the generic technologies even further reduced this influence. All energy-saving technologies are eligible, and new inventions may receive immediate EIA support instead of only after the new list is published. Because of these generic technologies, the Energy List is no longer a necessary element of the subsidy scheme. In principle, all technologies that meet the energy-saving standards are eligible for the EIA. So, even without the Energy List, subsidising investments in energy-saving or sustainable energy technologies would also be feasible. To what extent this may put a burden on its likely attention value remains to be determined.
A final risk of regulations such as the EIA is that high administrative costs may reduce its efficiency. For the EIA, we can distinguish between administrative costs made by government and compliance costs made by firms. Administrative costs are those made by government and its regulating agency to implement the regulation (i.e. to handle requests, check firms’ tax payments, update the Energy List and maintain contact with the different ministries and agencies involved). Compliance costs by firms refer to the internal or outsourcing costs necessary to apply for the EIA (i.e. the costs related to time spent by own employees or external support hired specifically for the subsidy application).
The time spent on an application differs substantially between generic and specified technologies on the Energy List. For a generic technology, firms have to specify several
details and the regulating agency has to monitor potential energy savings. These details have been pre-specified for the specified technologies on the Energy List. Data from the regulating agency show that, in the last couple of years, firms have spent an average of about 1.5 hours on the application for a specified technology and 6 hours on the application for a generic technology.
For the EIA, total handling costs for the government generally range between EUR 3.5 and EUR 4.4 million. This implies that handling costs range between 3% and 4% of overall tax expenditures. Data from NL Agency show that, in the last couple of years, the costs and time spent per application have reduced. In the early years of the EIA, execution costs per application were lower, however, because generic technologies were less popular and the Energy List still contained several cheap and popular technologies which were easy to administrate.24 In 2007, compliance costs for firms were estimated to
be EUR 3.87 million (Capgemini et al., 2008). Compared with the total in accepted investments of EUR 1 530 million this represents 0.25% of investment costs. However, relatively speaking, the administrative costs for small applications are higher than those for large applications. Because of a simplification of the administrative procedure in 2007, administrative costs are likely to have decreased.
5. Conclusions
Even though the basic principles and objectives of the EIA have remained the same over the last 15 years, the use of the EIA went through a number of changes, mainly due to exogenous factors, such as interaction with other policy instruments, rising oil and gas prices, and the economic crisis since 2007. In particular the use of tax instruments to stimulate sustainable energy production varied considerably in the Netherlands throughout the last 15 years. Despite this turbulence and changes in government focus, the EIA apparently remained attractive enough for politicians and survived. Its flexibility allowed for adaptations where necessary and its role as a technology adoption subsidy is likely to also have contributed to its legitimacy.
The evolution of the EIA over the past 15 years also contains interesting lessons. First, the use of tax revenues to subsidise investment in energy-efficient technologies and renewable energy is not very different from using on-budget subsidies if budgetary rules require sufficient accountability of such tax expenditures. This is nicely illustrated by the struggle at the beginning of the scheme when this lack of accountability seems to have contributed to the budgetary turbulence. A number of budget overruns in later periods were mainly caused by changes outside the EIA, such as policy reforms to prevent using multiple subsidies and the choice to prematurely close related instruments.
Second, well-known concerns about incentive compatibility issues of subsidy schemes for consumers also clearly apply to firm-specific subsidies, such as the EIA. Indeed, periodic evaluations of the EIA reveal that the main weakness of the tax allowance is the difficulty to prevent free-riders from receiving subsidies. By the same token, however, more stringent eligibility rules and standards, and evaluation processes to update the Energy List, together with reductions in the tax deduction percentage, improved subsidy effectiveness considerably. Still, a substantial welfare loss due to free-riding remains, something that may be partly explained by the difficulties in making completely separable incentive contracts. Another related concern is the interaction of the scheme
24 Aalbers et al. (2007) evaluated that handling costs for the EIA were marginally higher than for comparable
with ETS. Even though reductions in CO2 emissions are not its direct concern and the
scheme mainly aims to support SMEs, its indirect impact may not be negligible here, and in some cases may even be counterproductive. These problems are mainly related to renewable energy and CHP technologies on the list. Finally, administrative costs seem to be reasonable small, in particular, for pre-specified technologies.
Third, one of the most innovative design elements of the Dutch EIA is the use of a dynamic technology list. This list pre-eminently makes the regulation flexible, allowing policy to refocus and apply tighter standards if necessary. More importantly, however, the list enables the regulating agency to reduce the information asymmetry between the supply and demand of new technologies. Because of the unfamiliarity of new energy-saving or sustainable energy technologies, suppliers may have difficulties to overcome the well-known ‘valley of death’. The technology list may contribute considerably to reducing this type of information failure. Using the technology list only – without the additional benefit of receiving a subsidy – may not be sufficient for companies to switch to these new energy-saving technologies. These subsidies need not be large, as some laboratory experiments have shown, as they mainly contribute by signalling that a particular technology would be financially attractive. The experience with the EIA indeed seems to confirm that reductions in corporate taxes or tax deduction percentages have not had a negative impact on the amount of energy saving achieved through the EIA, but, so far, what would be the optimal rate of subsidy remains unclear.
This evaluation has shown that, over the 2001–2007 period, the EIA regulation was dominated by investments in sustainable energy. Moreover, many of the budget overruns were related to sustainable energy investments. The same is true for issues related to the overlap with the ETS. Promoting sustainable energy has been an important government objective over the last 15 years, and for good reason. However, creating a balanced package of (subsidy) instruments has proven to be quite difficult in the Netherlands. It is not entirely clear whether the sustainable energy goal within the EIA has been sufficiently supportive to the overall energy policy objectives, while it is responsible for the main (budgetary) shocks in the use of the EIA. Whether the dual objective of promoting energy-saving and sustainable energy production technologies is efficient would be a legitimate question, because also other instruments are already implemented to help new renewable technologies. However, the extent to which this lesson has already been taken sufficiently serious is not entirely clear. The more stringent requirements for sustainable energy technologies to be eligible for subsidy through the EIA, applied since 2007, clearly have reduced the number of subsidy applications, although recently their numbers have risen again (see Figure 8).
Acknowledgements
We gratefully acknowledge the contributions, comments and suggestions by Nils-Axel Braathen (OECD), Jan Haverdings (AgentschapNL), Rob Aalbers (CPB), Frank Dietz (PBL) and Pieter Boot (PBL).
References
Aalbers, R.F.T., van der Heijden, E.C.M., van Lomwel, A.G.C., Nelissen, J.H.M., Potters, J.J.M., van Soest, D.P. & Vollebergh, H.R.J. (2005). Naar een Optimaal Design voor Investeringssubsidies in Milieuvriendelijke Technieken. OCFEB studies in Economic Policy nr. 15.
Aalbers, R.F.T., Baarsma, B., Berkhout, P., Bremer, S., Gerritsen, M. & de Nooij, M. (2007). Ex-post evaluatie Energie Investeringsaftrek (EIA), in opdracht van het Ministerie van Economische Zaken. SEO-report nr. 999, SEO, Amsterdam. Aalbers, R.F.T., van der Heijden, E., Potters, J., van Soest, D.P. & Vollebergh, H.R.J.
(2009). Technology adoption subsidies: An experiment with managers. Energy Economics, 31, 431–42.
Aalbers, R.F.T., de Groot, H.L.F. & Vollebergh, H.R.J. (2011). Rents from Energy Technology Subsidies. CentER Working Paper, 2011-109, Tilburg.
Acemoglu, D. Aghion, P., Bursztyn, L. & Hemous, D. (2012). The environment and directed technical change. American Economic Review, 102(1), 131-66.
Arguedas, C. & van Soest, D.P. (2009). On Reducing the Windfall Profits in Environmental Subsidy Programs. Journal of Environmental Economics and Management, 58, 192– 205.
Baumol, W.J. & Oates, W.E. (1988). The Theory of Environmental Policy. Cambridge University Press, Cambridge.
CBS, PBL and Wageningen UR (2008), Fiscale faciliteiten op milieugebied, 1991-2007 (indicator 0361, versie 08, 14 november 2008).
www.compendiumvoordeleefomgeving.nl. CBS, Den Haag; Planbureau voor de Leefomgeving, Den Haag/Bilthoven en Wageningen UR, Wageningen.
CapGemini, EIM, Deloitte and Ramboll Management (2008). Nulmeting administratieve lasten bedrijven 2007. Onderzoek voor de Regiegroep Regeldruk. Den Haag. CPB (2001). Neveneffecten van het verlenen van subsidies voor energiebesparing.
Commissie Interdepartementaal Beleidsonderzoek (IBO) energiesubsidies, Den Haag.
Convery, F. (2011), Reflections on the Energy Efficiency Literature for those in the Policy Process. Review of Environmental Economics and Policy, 5(1), 172-191.
De Beer, J.G. Kerssemeeckers, , M.M.M., Aalbers, R.F.T., Vollebergh, H.R.J., Ossokina, J., de Groot, H.L.F., Mulder, P. & K. Blok (2000). Effectiviteit energiesubsidies –
onderzoek naar de effectiviteit van enkele subsidies en fiscale regelingen in de period 1988-1999. Ecofys, OCFEB, EUR, VU, IVM.
DeCanio S.J. & Watkins, W.E. (1998). Information processing and organizational structure. Journal of Economic Behavior & Organization 36(3), 275-294.
Dietz, F.J. & Vollebergh, H.R.J. (1999). Institutional Barriers for Economic Instruments. In J.C.J.M. van den Bergh (ed.), Handbook of Environmental Economics. Edward Elgar, Cheltenham.
Dutch House of Representatives (1995). Derde energienota, TK 24 525, Vergaderjaar 1995-1996.
EIM (2007). Neveneffecten van de EIA. Onderzoek voor het Ministerie van Economische Zaken en SenterNovem.
Eskeland, G. & Devarajan, S. (1996). Taxing Bads by Taxing Goods: Towards Efficient Pollution Control with Presumptive Charges. In: Bovenberg, L. & Cnossen, S. (eds.), Public Economics and the Environment in an Imperfect World. Kluwer, Boston.