CLIMATE CHANGE
Scientific Assessment and Policy Analysis
WAB 500102 031
Balancing the carbon market
Analysing the international carbon market and abatement
costs in 2020 for low-concentration targets: policy choices
CLIMATE CHANGE
SCIENTIFIC ASSESSMENT AND POLICY ANALYSIS
BALANCING THE CARBON MARKET
Analysing the international carbon market and abatement costs in 2020 for
low-concentration targets: policy choices and uncertainties
Report
500102 031
Authors
M.G.J. den Elzen M.A. Mendoza Beltran
P. Piris-Cabezas D.P. van Vuuren
August 2009
This study has been performed within the framework of the Netherlands Research Programme on Scientific Assessment and Policy Analysis for Climate Change (WAB), Balancing the Carbon Market
Page 2 of 55 WAB 500102 031
Wetenschappelijke Assessment en Beleidsanalyse (WAB) Klimaatverandering
Het programma Wetenschappelijke Assessment en Beleidsanalyse Klimaatverandering in opdracht van het ministerie van VROM heeft tot doel:
• Het bijeenbrengen en evalueren van relevante wetenschappelijke informatie ten behoeve
van beleidsontwikkeling en besluitvorming op het terrein van klimaatverandering;
• Het analyseren van voornemens en besluiten in het kader van de internationale
klimaatonderhandelingen op hun consequenties.
De analyses en assessments beogen een gebalanceerde beoordeling te geven van de stand van de kennis ten behoeve van de onderbouwing van beleidsmatige keuzes. De activiteiten hebben een looptijd van enkele maanden tot maximaal ca. een jaar, afhankelijk van de complexiteit en de urgentie van de beleidsvraag. Per onderwerp wordt een assessment team samengesteld bestaande uit de beste Nederlandse en zonodig buitenlandse experts. Het gaat om incidenteel en additioneel gefinancierde werkzaamheden, te onderscheiden van de reguliere, structureel gefinancierde activiteiten van de deelnemers van het consortium op het gebied van klimaatonderzoek. Er dient steeds te worden uitgegaan van de actuele stand der wetenschap. Doelgroepen zijn de NMP-departementen, met VROM in een coördinerende rol, maar tevens maatschappelijke groeperingen die een belangrijke rol spelen bij de besluitvorming over en uitvoering van het klimaatbeleid. De verantwoordelijkheid voor de uitvoering berust bij een consortium bestaande uit PBL, KNMI, CCB Wageningen-UR, ECN, Vrije Univer-siteit/CCVUA, UM/ICIS en UU/Copernicus Instituut. Het PBL is hoofdaannemer en fungeert als voorzitter van de Stuurgroep.
Scientific Assessment and Policy Analysis (WAB) Climate Change
The Netherlands Programme on Scientific Assessment and Policy Analysis Climate Change (WAB) has the following objectives:
• Collection and evaluation of relevant scientific information for policy development and
decision–making in the field of climate change;
• Analysis of resolutions and decisions in the framework of international climate negotiations
and their implications.
WAB conducts analyses and assessments intended for a balanced evaluation of the state-of-the-art for underpinning policy choices. These analyses and assessment activities are carried out in periods of several months to a maximum of one year, depending on the complexity and the urgency of the policy issue. Assessment teams organised to handle the various topics consist of the best Dutch experts in their fields. Teams work on incidental and additionally financed activities, as opposed to the regular, structurally financed activities of the climate research consortium. The work should reflect the current state of science on the relevant topic. The main commissioning bodies are the National Environmental Policy Plan departments, with the Ministry of Housing, Spatial Planning and the Environment assuming a coordinating role. Work is also commissioned by organisations in society playing an important role in the decision-making process concerned with and the implementation of the climate policy. A consortium consisting of the Netherlands Environmental Assessment Agency (PBL), the Royal Dutch Meteorological Institute, the Climate Change and Biosphere Research Centre (CCB) of Wageningen University and Research Centre (WUR), the Energy research Centre of the Netherlands (ECN), the Netherlands Research Programme on Climate Change Centre at the VU University of Amsterdam (CCVUA), the International Centre for Integrative Studies of the University of Maastricht (UM/ICIS) and the Copernicus Institute at Utrecht University (UU) is responsible for the implementation. The Netherlands Environmental Assessment Agency (PBL), as the main contracting body, is chairing the Steering Committee.
For further information:
Netherlands Environmental Assessment Agency PBL, WAB Secretariat (ipc 90), P.O. Box 303, 3720 AH Bilthoven, the Netherlands, tel. +31 30 274 3728 or email: wab-info@pbl.nl.
Preface
This report was commissioned by the Netherlands Programme on Scientific Assessment and Policy Analysis for Climate Change (WAB). The steering committee of this project consisted of Gerie Jonk (Ministry of Environment), Marcel Berk (Ministry of Environment), Joelle Rekers (Ministry of Economic affairs), Maurits Blanson Henkemans (Ministry of Economic Affairs), Bas Clabbers (Ministry of Agriculture) and Remco vd Molen (Ministry of Finance).
The authors used emission baseline and MAC data from the three land-use models, and thank Georg Kindermann and Michael Obersteiner (IIASA, Austria), Brent Sohngen (Ohio State University, USA), and Jayant Sathaye (Lawrence Berkeley National Laboratory, Berkeley, USA) for their cooperation. Finally we would also like to thank our colleagues at the Netherlands Environmental Assessment Agency, in particular Jasper van Vliet and Paul Lucas.
Page 4 of 55 WAB 500102 031
This report has been produced by:
Michel den Elzen, Angelica Mendoza Beltran, Detlef van Vuuren Netherlands Environmental Assessment Agency
Pedro Piris-Cabezas,
Environmental Defense Fund, New York NY and University of Madrid-Rey Juan Carlos
Name, address of corresponding author:
Michel den Elzen
Netherlands Environmental Assessment Agency Global Sustainability and Climate
P.O. Box 303 3720 AH Bilthoven The Netherlands
E-mail: michel.denelzen@pbl.nl
Disclaimer
Statements of views, facts and opinions as described in this report are the responsibility of the author(s).
Copyright © 2009, Netherlands Environmental Assessment Agency
All rights reserved. No part of this publication may be reproduced, stored in a retrieval system or transmitted in any form or by any means, electronic, mechanical, photocopying, recording or otherwise without the prior written permission of the copyright holder.
Contents
Executive Summary 9 Samenvatting 11 List of acronyms 15 1 Introduction 17 2 Methodological issues 21 2.1 Analytical framework 21 2.2 Choice of scenarios 223 The significance of the Annex I and non-Annex I reduction ambition 25
3.1 Background 25
3.2 Results 26
4 The importance of including the forestry sector in the carbon trading system 31
4.1 Background 31
4.2 Results 31
5 The impact of scientific uncertainties 39
5.1 Background 39
5.2 Results 39
6 Conclusions 45
7 References 47
Appendices
A The baseline scenario 51
B Datasets assumptions and extrapolation of the REDD and AR data of GTM and
GCOMAP towards the 26 IMAGE regions 53
Page 6 of 55 WAB 500102 031
List of Tables
1. Default assumptions for the policy and scientific choices as explored in this report
for the default scenario by 2020 and levels of variation used for the uncertainty analysis of Section 6, leading to higher and lower costs compared to the costs for the default case. 18
2. Assumed reduction levels (in %) below baseline or business as usual scenario
emissions in 2020 for the Annex I and non-Annex I countries. 22
3. The emission reductions and abatement costs of the Annex I and non-Annex I
reduction cases in 2020 (Annex I 25% and 40% cases assume Annex I emissions 25% and 40% below 1990 levels by 2020; non-Annex I 10% and 20% cases assume non-Annex I emissions 10% and 20% below baseline emission levels). 27
4. Compliance costs and trading gains at the global scale and for Annex I and
non-Annex I, by 2020 for the default scenario. 27
5 The emission reductions and abatement costs by 2020 of the carbon-market
participation cases (the Full Participation DCs case assumes that all non-Annex I or developing countries (DCs) participate in IET; the Only CDM case assumes that non-Annex I countries participate in CDM and the US Only domestic case assumes that US commits to a domestic target of returning to 1990 levels by 2020) 29
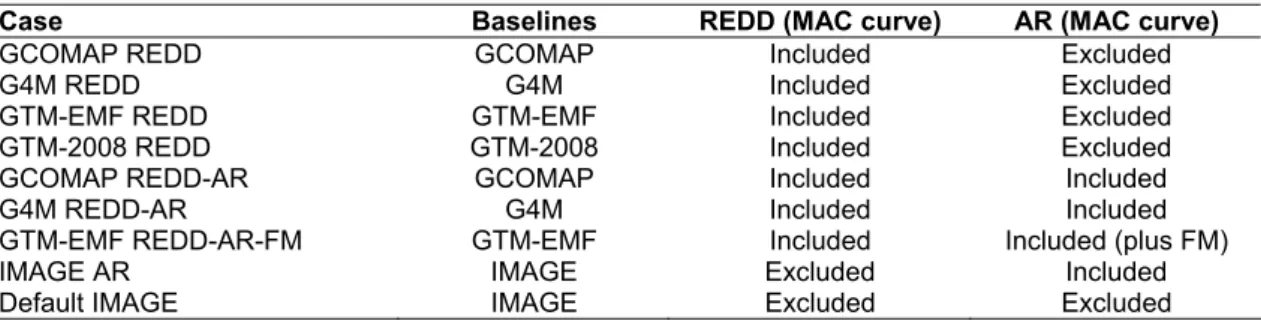
6. The REDD and AR cases 34
7. The emission reductions and abatement costs in 2020 of the REDD and AR cases,
including the default IMAGE case and the default cases of the other land use models for comparison. 36
8. The reductions from REDD and AR and the resulting CO2 emissions from
deforestation and LULUCF in 2020. 37
9. The emission reductions and abatement costs in 2020 of the Annex I and
non-Annex I reduction cases using POLES-Enerdata MAC curves. 39
10. The costs in the world, and in the Annex I and non-Annex I counties, and trade in
emission rights in 2020 for the default scenario for the POLES MAC curves. 40
11. Global population, GDP per capita and anthropogenic GHG emissions for 1990,
2000 and 2020 for the ADAM baseline 51 12. Allocation of the GTM regions to the IMAGE regions. 54 13. Allocation of the GTM regions to the IMAGE regions. 54
List of Figures
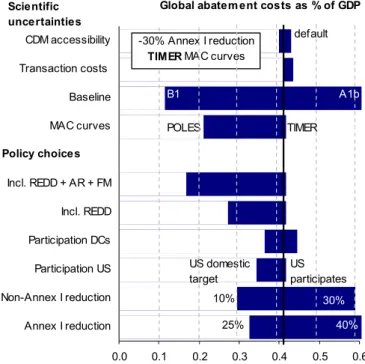
ES.1. The impact of the key factors on the global abatement costs in 2020. The impact
on the carbon price is about the same. 9
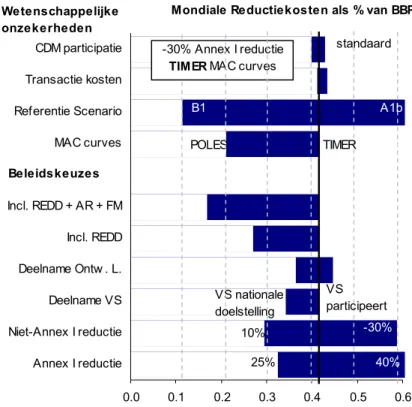
ES.1. De impact van de belangrijkste factoren voor de mondiale reductiekosten in 2020.
De impact op de koolstofprijs is ongeveer gelijk. 12
1. Overview of the Annex I and non-Annex I abatement by 2020 for the Annex I and
non-Annex I reduction cases compared to the default case. Note that the IET & JI and CDM are only the transfers between Annex I and non-Annex I countries, and that not all transfers are on the carbon market, including the transfers between the Annex I countries and between non-Annex I countries. 27
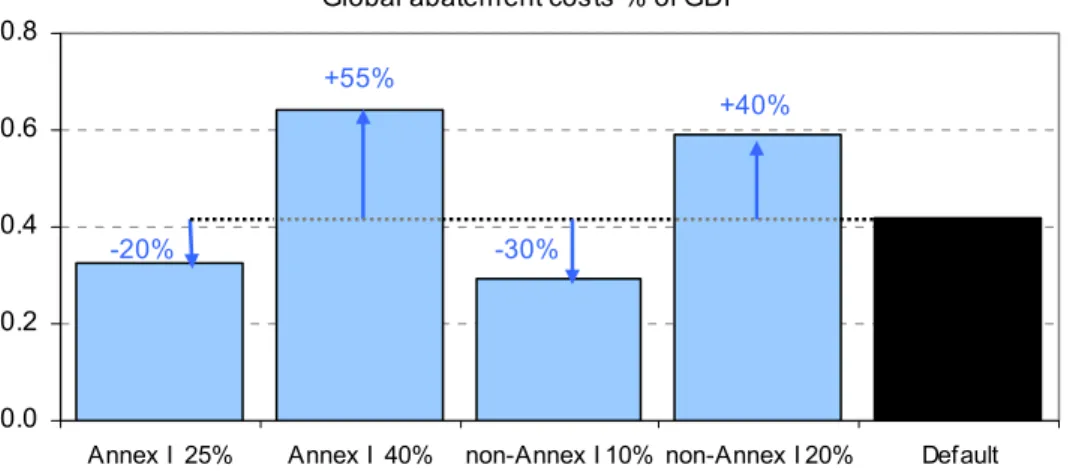
2. Global abatement costs as a percentage of the GDP for 2020 for the Annex I and
non-Annex I reduction cases, compared to the default case. 28
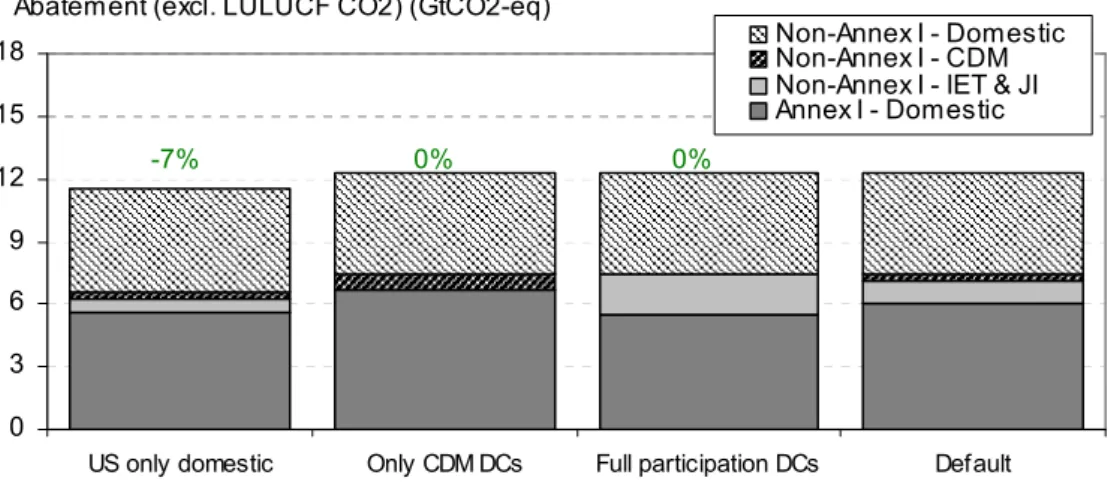
3. Overview of the Annex I and non-Annex I abatement in 2020 for the participation
cases compared to the default case. 30
4. Global abatement costs as a percentage of the GDP for 2020 for the participation
cases compared to the default case. 30
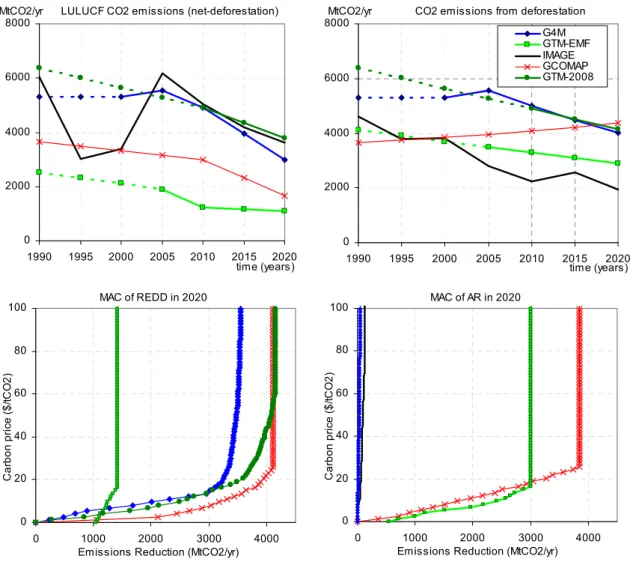
5. Baseline LULUCF CO2 or net deforestation emissions (left upper figure), and CO2
emissions from deforestation (right upper figure) for the time period 1990-2020 (left) and global MAC curves of REDD (left lower figure) and ARD (right lower figure) of the three models (GTM, GCOMAP and G4M) and IMAGE model in 2020. 33
6. Global abatement costs as a percentage of GDP for 2020 for the REDD and AR
cases, compared to the default case. The error bar in the default case gives the range of outcomes from the default cases from the three land-use models. 35
7. Overview of the Annex I and non-Annex I abatement in2020 for the REDD and AR
8. Overview of the Annex I and non-Annex I abatement in 2020 for the Annex I and non-Annex I reduction cases compared to the default case using POLES MAC curves. 40
9. Global abatement costs as a percentage of the GDP for 2020 for the Annex I and
non-Annex I reduction cases compared to the default case using POLES MAC curves. 41
10. The impact of the key factors on the Annex I (upper) and non-Annex I (lower)
abatement costs by 2020 for the TIMER MAC curves (default calculations) (left-hand figure) and POLES MAC curves (right-(left-hand figure). Note: for the POLES model no alternative baseline was available. 42
11. The impact of the key factors on the Annex I (upper) and non-Annex I (lower)
abatement costs by 2020 for the TIMER MAC curves (default calculations) (left-hand figure) and POLES MAC curves (right-(left-hand figure). Note: for the POLES model no alternative baseline was available. 43
C.1. Overview of the Annex I, non-Annex I and global marginal abatement cost curves
Executive Summary
This report describes our analysis of the impact of various policy choices and scientific uncertainties on the price of tradable emission units on the global carbon market in 2020 and the associated abatement costs. Our analysis was done under the assumption that the overall goal is to stabilise long-term greenhouse gas concentrations at 450 ppm CO2-eq. To meet these stabilisation targets on the long-term, Annex I countries as a group need to reduce by 25-40% below 1990 levels by 2020, and non-Annex I countries as a group need to keep emissions substantially below baseline (about 15 to 30%). The integrated modelling framework FAIR 2.2 is used for our analysis. The main findings of this study are: the degree of ambition for reductions of Annex I and non-Annex I countries is the most important policy choice influencing the price and abatement costs. Other less important policy choices include the ambition of US climate policy and the participation of the developing countries in the global carbon market. By allowing the use of forest-based options – including avoiding deforestation – for compliance in a well-designed carbon trading system, the global abatement costs could be reduced by between 25% and 65%. This would also make ambitious mitigation targets more feasible. In addition to the policy choices, important scientific uncertainties, in particular the baseline emissions (i.e. emissions in the absence of climate policy) and the assumed marginal abatement costs, strongly influence the carbon market.
Main findings of this study (in more detail):
− The level of ambition for reductions by the Annex I and non-Annex I countries, in a future
international agreement on climate change, is one of the most important policy choices influencing the carbon price on the carbon market and abatement costs in 2020. For the
default case, assuming a 30% emission reduction below 1990 levels for Annex I in 2020 and a 15% reduction below baseline emissions for non-Annex I, compatible with stabilising GHG concentration at 450 ppm CO2-eq, the global abatement costs are about 0.4% of GDP, and the permit price is about 75US$/tCO2-eq (Figure ES.1: vertical line). A higher Annex I and non-Annex I reduction of 40% and 30% increases the global costs by about half (see Figure ES.1). Reducing the Annex I and non-Annex I reduction lowers the global abatement costs by 20-30%, but leads to global emissions in 2020 at the upper limit of emission corridors that can still attain the 450 ppm CO2-eq target in the long term.
Global abatement costs as % of GDP
0.0 0.1 0.2 0.3 0.4 0.5 0.6 Annex I reduction Non-Annex I reduction Participation US Participation DCs Incl. REDD Incl. REDD + AR + FM MAC curves Baseline Transaction costs CDM accessibility default -30% US participates US domestic target 25% -25% Policy choices Scientific uncertainties 10% 40% -30% Annex I reduction
TIMER MAC curves
POLES TIMER
B1 A1b
POLES B1
Figure ES.1. The impact of the key factors on the global abatement costs in 2020. The impact on the carbon price is about the same.
Page 10 of 55 WAB 500102 031
− Including REDD (reducing emissions from deforestation and forest degradation) in the
carbon market could decrease the global abatement costs significantly (by 25 to 40%). This could lead to low costs or even net gains for the non-Annex I countries. With the addition of AR (afforestation and reforestation), the global abatement costs could even be reduced by 40-65% in 2020. The inclusion of the forest sector in the global carbon market could lower
the abatement costs of meeting stringent reduction targets. Emission credits from REDD can offset part of the Annex I reduction, and increase the financial flows from Annex I to non-Annex I countries. ADCs, like Brazil, would also use REDD to meet their own reduction targets. The final abatement costs for non-Annex I decline, and may even turn into gains. It also has the benefit of reducing deforestation by 30-70% in 2020. It should be noted, however, that it is uncertain to what extent REDD, AR and FM measures can actually be implemented.
− The main policy choices determining the abatement costs are: 1. Annex I and non-Annex I
reduction targets; 2. including the forestry sector in the carbon market; 3. the participation of developing countries or the USA in the carbon market. This finding is robust for other MAC curves. The most important scientific uncertainty by far concerns the baseline emissions, followed by the MAC curves. Important scientific uncertainties are the baseline emissions
and the MAC assumptions. The baseline emissions have a high impact on the carbon price and abatement costs; a high baseline doubles the price and costs. The MAC assumption can also double the costs, i.e. the TIMER MAC curves lead in 2020 to abatement costs that are twice as high as the POLES MAC curves. Another aspect is that the TIMER curves are more similar across regions, so they lead to a lower incentive for emission trading. The Annex I costs are mainly influenced by the baseline and Annex I reduction target. The non-Annex I costs are also mainly influenced by the non-Annex I reduction target, the MAC curves and including REDD in the global market. More optimistic assumptions concerning these factors can convert the costs of non-Annex I countries into gains.
− A gradual participation of non-Annex I or developing countries in the carbon market can lead
to benefits for both Annex I and non-Annex I. Emission trading and CDM can decrease the
costs of meeting the reduction targets considerably. The global benefits can be on the order of 100-150 billion US$ by 2020. IET and CDM also lower the actual reduction targets of Annex I to about 20-25% below 1990 levels (from the Annex I reduction ambition of 30%). The remaining 5-10% is achieved through offsetting mechanisms that generate credits for reductions in Annex I countries. Non-Annex I countries need to reduce their emissions compared to baseline by around 15-20%, of which 5% can be sold through the carbon market via CDM and IET. This would take place under gradual participation of the developing countries in the global market, i.e. ADCs (advanced developing countries) would participate via IET and the other developing countries via CDM. With full participation of the developing countries via IET, the benefits would be even higher.
Samenvatting
Dit rapport beschrijft een modelanalyse van de impact van de verschillende beleidskeuzes en wetenschappelijke onzekerheden op de koolstofprijs van verhandelbare emissie-eenheden op de mondiale koolstofmarkt in 2020 en de bijbehorende reductiekosten. De analyse veronderstelt op de lange termijn stabilisatie van de concentraties van broeikasgassen op 450 ppm CO2-eq. Om wereldwijde broeikasgasemissies op een dergelijk laag stabilisatieniveau te brengen, wat de kansen vergroot om de gemiddelde temperatuurtoename wereldwijd te beperken tot 2ºC, zouden Annex I of geïndustrialiseerde landen hun emissies moeten reduceren met 25-40% ten opzichte van hun 1990 emissieniveaus rond het jaar 2020, terwijl niet-Annex I of ontwikkelingslanden 15-30% moeten afwijken van hun referentie-emissies. Voor de analyse gebruiken we het geïntegreerde model FAIR 2.2. De analyse toont aan dat de reductie-doelstelling van broeikasgas emissies van de Annex I en niet-Annex I landen in 2020 de meest belangrijkste beleidskeuze is, welke in belangrijke mate de toekomstige koolstofprijs en reductiekosten beïnvloedt. Andere minder belangrijke beleidskeuzes zijn de reductiedoelstelling van de Verenigde Staten en de deelname van de ontwikkelingslanden in de mondiale koolstofmarkt. Door het toestaan van het gebruik van de mitigatie opties voor land-gebruikemissies – met inbegrip van het vermijden van ontbossing – in een goed ontworpen systeem van verhandelbare emissie-eenheden, kunnen de mondiale reductiekosten worden verminderd met 25% en 65%. Hierdoor worden ook meer ambitieuze reductiedoelstellingen haalbaar. In aanvulling op de beleidskeuzes, zijn er ook belangrijke wetenschappelijke onzekerheden, in het bijzonder de referentie-emissies (d.w.z. emissies in de afwezigheid van klimaatbeleid) en de veronderstelde marginale reductiekosten, die een sterke invloed hebben op de koolstofprijs op de koolstofmarkt en de reductiekosten.
De belangrijkste conclusies (in meer detail):
- Het ambitieniveau van de broeikasgas reductiedoelstellingen van de Annex I en niet-Annex I
landen in 2020 in een toekomstige internationale klimaatovereenkomst is een van de meest belangrijke beleidskeuzes, welke in belangrijke mate de koolstofprijs en reductiekosten in 2020 beïnvloedt. De standaardberekeningen veronderstellen voor de Annex I landen als
groep een emissiereductie van 30% onder 1990-waarden voor 2020. Voor de niet-Annex I landen als groep nemen we emissiereducties aan van rond de 15% onder de referentie-emissies binnen dezelfde tijdspanne. Deze reducties in 2020 zijn in overeenstemming met het stabiliseren van de broeikasgas concentraties op 450 ppm CO2-eq op de lange termijn. De resulterende mondiale reductiekosten kosten zijn ongeveer 0,4% van het BBP, en bedraagt de koolstofprijs ongeveer 75US$/tCO2-eq (Figuur ES.1: verticale lijn). Een hogere Annex I en niet-Annex I reductiedoelstelling van 40% (t.o.v. 1990 emissies) en 30% (t.o.v. referentie-emissies), resp. leiden tot een stijging van de totale kosten met ongeveer de helft (Figuur ES.1). Vermindering van de Annex I en niet-Annex I reductiedoelstelling verlaagt de wereldwijde reductiekosten met 20-30%, maar leidt tot een stijging van mondiale broeikasgas emissies in 2020 tot aan de bovengrens van het emissiebereik, die nog in overeenstemming is met lange termijn stabilisatie op 450 ppm CO2-eq.
Page 12 of 55 WAB 500102 031
Mondiale Reductiekosten als % van BBP
0.0 0.1 0.2 0.3 0.4 0.5 0.6 Annex I reductie Niet-Annex I reductie Deelname VS Deelname Ontw . L. Incl. REDD Incl. REDD + AR + FM MAC curves Referentie Scenario Transactie kosten CDM participatie standaard -30% VS participeert VS nationale doelstelling 25% -25% Beleidskeuzes Wetenschappelijke onzekerheden 10% 40% -30% Annex I reductie
TIMER MAC curves
POLES TIMER
B1 A1b
POLES
B1
Figuur ES.1. De impact van de belangrijkste factoren voor de mondiale reductiekosten in 2020. De impact op de koolstofprijs is ongeveer gelijk.
- Het opnemen van het vermijden van ontbossing, i.e. REDD in de koolstofmarkt kan leiden tot
een aanzienlijke daling van de mondiale reductiekosten (met 25 tot 40%). Dit kan leiden tot lage kosten of zelfs nettowinsten voor de minst ontwikkelde niet Annex I landen. Met de toevoeging van herbebossing, kunnen de mondiale reductiekosten zelfs worden verlaagd met 40-65% in 2020. De opname van REDD in de wereldwijde koolstofmarkt kan de
reductiekosten voor het halen van ambitieuzere reductiedoelstellingen verminderen. Emissiekredieten uit het vermijden van ontbossing kunnen een deel van de Annex I reducties compenseren en leiden tot verhoging van de financiële stromen van Annex I naar niet in Annex I. De zogenoemde ’opkomende economieën’, zoals Brazilië, zouden ook het vermijden van ontbossing kunnen gebruiken om aan hun eigen reductiedoelstelling te voldoen. De uiteindelijke reductiekosten voor de niet-Annex I landen als groep kunnen hierdoor aanzienlijk worden verminderd, en zelfs omslaan in winst. Daarnaast leidt het opnemen van REDD tot een 30-70% reductie van het huidige ontbossingtempo in 2020. Hierbij moet worden opgemerkt dat het onzeker is in hoeverre REDD, herbebossing en bosmanagement maatregelen ook daadwerkelijk kunnen worden uitgevoerd.
- De belangrijkste beleidskeuzes, die de toekomstige koolstofprijs en reductiekosten bepalen,
zijn: 1. Annex I en niet-Annex I reductiedoelstellingen, 2. opnemen van het vermijden van ontbossing, i.e. REDD in de koolstofmarkt; 3. de deelname van ontwikkelingslanden in de koolstofmarkt of de VS reductie-inspanning. Deze bevindingen zijn robuust voor andere aannames voor de marginale broeikasgasreductie-kostencurves (MACs). De belangrijkste
wetenschappelijke onzekerheid betreft veruit de referentie-emissies, gevolgd door aannames voor de MACs. De baseline-emissies hebben een grote impact op de koolstofprijs en kosten, en hoge referentie-emissies kunnen zelfs leiden tot een verdubbeling van de prijs en kosten. Andere MAC aannames bv. die van het POLES energie model in plaats van het TIMER energiemodel leiden tot 50% lagere reductiekosten. Daarnaast leiden de POLES MACs tot meer handel in emissierechten. De Annex I kosten worden vooral beïnvloedt door de referentie emissies en Annex I reductiedoelstelling. De niet Annex I kosten worden ook hoofdzakelijk beïnvloedt door de niet Annex I reductiedoelstelling, de MACs en het opnemen van REDD in de koolstofmarkt. Meer optimistische aannames met betrekking tot deze factoren kunnen leiden tot winsten i.p.v. kosten voor de niet-Annex I landen.
- Een geleidelijke deelname van de niet-Annex I of ontwikkelingslanden in de koolstof-markt
kan leiden tot voordelen voor zowel de Annex I als niet-Annex I landen. Emissiehandel en
CDM kunnen de kosten voor het halen van de reductiedoelstellingen aanzienlijk verminderen. Het voordeel kan zelfs 100 tot 150 miljard US$ in 2020 bedragen. Het kan ook de daadwerkelijke reductieniveaus van Annex I na handel en CDM verlagen tot ongeveer 20-25% onder 1990 niveaus (t.o.v. de Annex I reductiedoelstelling van 30%). De afname van 5-10% wordt bereikt door middel van koolstofkredieten vanuit de niet-Annex I landen. De niet-Annex I landen moeten hun emissies met ongeveer 15-20% reduceren ten opzichte van het referentiescenario, waarvan 5% kan worden verkocht via de koolstofmarkt via CDM en emissiehandel. Dit gebeurt onder een geleidelijke toename in de deelname van de ontwikkelingslanden in de mondiale koolstofmarkt, i.e. opkomende economieën doen mee via emissiehandel en de andere ontwikkelingslanden via CDM. Met een volledige participatie van de ontwikkelingslanden via emissiehandel zouden de voordelen nog hoger kunnen zijn.
List of acronyms
ADC Advanced Developing Countries
AR Afforestation and Reforestation
AWG-KP Ad Hoc Working Group on Further Commitments for Annex I Parties under the
Kyoto Protocol
CDM Clean Development Mechanism
CO2 Carbon Dioxide
COP Conference of the Parties
CER Certified Emission Reduction
DC Developing Countries
ERU Emission Reduction Unit
FAIR Framework to Assess International Regimes for the differentiation of
commitments
FM Forest Management
GCOMAP Generalized Comprehensive Mitigation Assessment Process Model
GDP Gross Domestic Product
GHG Greenhouse gas
GtCO2-eq Giga tons of Carbon Dioxide Equivalent
GTM Global Timber Model
IMAGE Integrated Model to Assess the Global Environment
IPCC Intergovernmental Panel on Climate Change
JI Joint Implementation
JRC Joint Research Centre of the European Commission
LDC Least Developed Country
LULUCF Land-Use, Land-Use Change and Forestry
NAI Non-Annex I
MAC Marginal Abatement Costs
MtCO2-eq Mega tons of Carbon Dioxide Equivalent
OECD Organisation for Economic Cooperation and Development
POLES Prospective Outlook on Long-term Energy Systems
REDD Reducing Emissions from Deforestation and Degradation
TIMER Targets Image Energy Regional model
1
Introduction
The ultimate goal of the United Nations Framework Convention on Climate Change (UNFCCC) is to stabilise atmospheric concentrations of greenhouse gases (GHG) at a level that prevents dangerous human interference with the climate system (UNFCCC 1992). The European Union
(EU) has interpreted this goal as a maximum temperature increase of 2oC compared to
pre-industrial levels (European-Council 1996; 2005). Such a target requires stabilising greenhouse gas concentrations at low levels. The Fourth Assessment Report (AR4) of the Intergovernmental Panel on Climate Change (IPCC) showed that scenarios that aim to stabilise atmospheric GHG concentrations at the lowest level assessed by the IPCC (around 450 ppm CO2-eq), typically have a peak in global emissions before 2015 and a reduction of emissions to
well below half of the 2000 level by the middle of the 21st century (IPCC 2007). In addition, the
IPCC indicated that in order to achieve low stabilisation targets, Annex I or developed countries as a group need to reduce their emissions to within a range of 25% to 40% below 1990 levels by 2020 (Gupta et al. 2007), even if emissions in non-Annex I or developing countries deviate substantially from baseline – i.e. no climate policy (Box 13.7). In August 2007, the Parties to the Ad Hoc Working Group on Further Commitments for Annex I Parties under the Kyoto Protocol (AWG-KP) agreed that a reduction in GHG emissions by Annex I countries in a range from 25% to 40% below 1990 levels by 2020 would provide a practical basis for further consideration. Currently, however, this range has not been accepted by the UNFCCC as the guiding level for the determination of mid-term Annex I reduction targets.
The IPCC authors responsible for Box 13.7 elaborated further on the issue of substantial deviation from the baseline by analysing the underlying studies and the literature obtained after the completion of the IPCC report (den Elzen and Höhne 2008). They concluded that in addition to the Annex I emission reduction of 25-40%, a deviation from the baseline emission levels by the entire group of non-Annex I countries of 15-30% by 2020 would be needed to meet 450 ppm CO2-equivalent. These non-Annex I reductions would have to be achieved domestically in their entirety and should be fully additional to the reductions achieved by Annex I countries. However, Annex I countries may support the non-Annex I countries in meeting their reductions through a mixture of financing, carbon trading or other mechanisms. The EU has accepted these findings as input for the climate negotiations at the Fourteenth Conference of the Parties (COP 14) in Poznan, Poland and the COP 15 in Copenhagen, Denmark (see EU Council conclusions (2008) and submissions to the AWG-KP on long-term cooperative action).
Presently, the Clean Development Mechanism (CDM) is the only international climate policy instrument that leads to measured, verified and quantified emission reductions in non-Annex I countries. However, since Certified Emission Reductions (CERs) from CDM projects are used for Annex I country compliance, they cannot be counted towards the reductions in non-Annex I countries noted above. According to the Bali Action Plan (UNFCCC, COP 13), developed countries should support developing countries in achieving their reduction actions through additional technology, financing and capacity building. Emission trading schemes (between countries with binding emission targets) are thought to be important instruments for implementing the emission reduction targets. This is expected to create a large international carbon market. However, it is unclear how reductions by non-Annex I countries will affect the carbon market. The question is, to what extent would participation in the carbon market of non-Annex I countries affect non-Annex I mitigation costs?
In the context of the ambitious Annex I and non-Annex I reductions required under a 2oC target,
our report evaluates the price of tradable emissions units on the international carbon market (hereafter known as carbon price) and abatement costs in 2020. It focuses on a default scenario, assuming a 30% reduction target below 1990 levels for Annex I and a 15% reduction target below baseline for non-Annex I. More specifically, our report addresses the following central questions: what is the impact of the scientific uncertainty and a range of policy-related
Page 18 of 55 WAB 500102 031
choices1 (see Table 1 for an overview) that are part of the negotiation process on the supply
and demand side of the carbon market? Does this also involve the resulting carbon price and the total abatement costs?
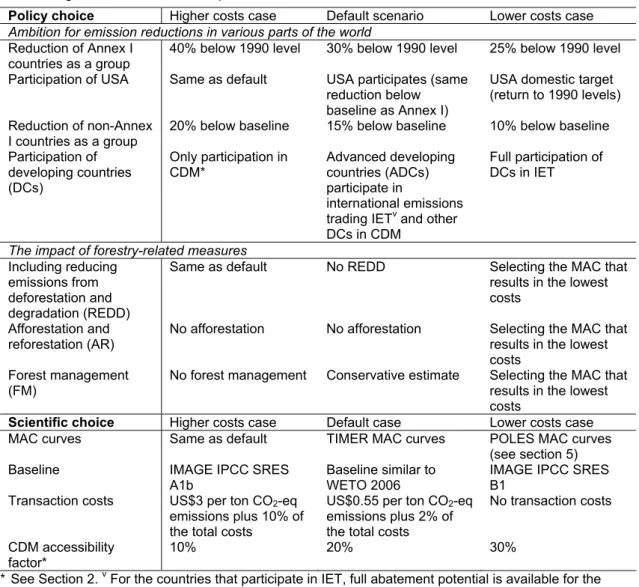
Table 1. Default assumptions for the policy and scientific choices as explored in this report for the default scenario by 2020 and levels of variation used for the uncertainty analysis of Section 6, leading to higher and lower costs compared to the costs for the default case.
Policy choice Higher costs case Default scenario Lower costs case
Ambition for emission reductions in various parts of the world
Reduction of Annex I countries as a group
40% below 1990 level 30% below 1990 level 25% below 1990 level Participation of USA Same as default USA participates (same
reduction below baseline as Annex I)
USA domestic target (return to 1990 levels) Reduction of non-Annex
I countries as a group 20% below baseline 15% below baseline 10% below baseline Participation of
developing countries (DCs)
Only participation in
CDM* Advanced developing countries (ADCs) participate in
international emissions trading IETv and other DCs in CDM
Full participation of DCs in IET
The impact of forestry-related measures
Including reducing emissions from deforestation and degradation (REDD)
Same as default No REDD Selecting the MAC that results in the lowest costs
Afforestation and reforestation (AR)
No afforestation No afforestation Selecting the MAC that results in the lowest costs
Forest management
(FM) No forest management Conservative estimate Selecting the MAC that results in the lowest costs
Scientific choice Higher costs case Default case Lower costs case MAC curves Same as default TIMER MAC curves POLES MAC curves
(see section 5) Baseline IMAGE IPCC SRES
A1b
Baseline similar to WETO 2006
IMAGE IPCC SRES B1
Transaction costs US$3 per ton CO2-eq
emissions plus 10% of the total costs
US$0.55 per ton CO2-eq
emissions plus 2% of the total costs
No transaction costs
CDM accessibility
factor* 10% 20% 30%
* See Section 2. v For the countries that participate in IET, full abatement potential is available for the market. MAC: Marginal abatement curve. For forestry-related measures, several MACs are available (see Section 4).
The policy-related choices analysed here are the following:
• the level of ambition in terms of emission reductions by Annex I and non-Annex I countries,
• the emission reduction target of the USA,
• the participation of developing countries in the carbon market, and
• the inclusion of the forest sector into the future carbon market, in particular including reducing
emissions from deforestation and degradation (REDD), afforestation and reforestation (AR) and forest management (FM).
The scientific uncertainties include:
• the assumed Marginal Abatement Cost (MAC) curves
• the baseline emission scenarios
1 The term ‘policy choice’ or ‘policy-related choice’ refers to variables in the calculation, the values of
• the transaction costs and implementation factors for CDM and/or tradable units from non-Annex I.
In our analysis, we mainly focused on Annex I and non-Annex I as a group, or the world, assessing the above-mentioned impacts in a global carbon market.
2
Methodological issues
2.1
Analytical framework
We used the integrated modelling framework FAIR2 (den Elzen and van Vuuren 2007; den
Elzen et al. 2008b) for the quantitative analysis of emission reductions and abatement costs at the level of 26 regions (Table 2). We calculated the abatement costs (in 2005 US$) by assuming full use of the flexible Kyoto mechanisms such as international emissions trading (IET) and CDM, and calculated the cost-effective distribution of reductions for different regions, gases and sources. The model used baseline emissions of GHG emissions from the IMAGE land-use model and TIMER energy model. The aggregated emission credits demand-and-supply curves were derived from marginal abatement costs (MAC) curves for the different regions, gases and sources, i.e. the energy and industry-related CO2 emissions from the TIMER energy model (van Vuuren et al. 2007). This was done by imposing a carbon tax and recording the induced reduction of CO2 emissions, and the non-CO2 GHG emissions based on Lucas et al. (2007). The emission credits demand-and-supply curves were used to determine the carbon price in the international trading market, its buyers and sellers, and the resulting domestic and external abatements for each region. The abatement costs for each scenario were calculated based on the marginal abatement costs and the actual reductions. They represent the direct additional costs due to climate policy, but do not capture the macro-economic implications of these costs.
We assumed that emissions could be traded freely between all of the regions that had accepted emission reduction targets. The transaction costs associated with the use of the Kyoto mechanisms were assumed to consist of a constant US$0.55 per tonne CO2-eq emissions plus 2% of the total costs (Michaelowa et al. 2003; Michaelowa and Jotzo 2005). For countries that only participated in CDM, a limited amount of the abatement potential was assumed to be operationally available on the market, because of the project basis of the CDM and implementation barriers such as properly functioning institutions and project size (small projects are economically less viable due to the relatively higher transaction costs). Consistent with earlier studies (Criqui 2002; den Elzen and de Moor 2002; Jotzo and Michaelowa 2002), this so-called CDM accessibility was set at 20% in 2020, which is twice as high as under the Kyoto commitment period. This meant that only 20% of the total supply would be available for offsetting reductions not achieved in Annex I countries.
The model calculations did not allow banking and/or borrowing for or from future commitment
periods.3 We did not account for the expectations of the market participants in the carbon
market results in 2020 (i.e., no intertemporal optimisation was considered in this analysis).4 The baseline emission scenario in this analysis was a ‘median’ baseline scenario developed for the ADAM project (van Vuuren et al. 2009). The ADAM baseline is a high economic growth scenario, based primarily on optimistic growth assumptions for China and India, and medium growth projections for the other regions. The population projection used was the UN medium scenario. The short-term developments for energy were calibrated against the WETO reference scenario of the World Energy Outlook (European-Commission 2007). The baseline GHG
emission projection for the year 2020 was about 58 GtCO2 including land use, land-use change
and forestry (LULUCF) CO2 emissions, and about 54 GtCO2 excluding LULUCF CO2 emissions.
2 The model names in this section are acronyms. FAIR = Framework to Assess International Regimes for
the differentiation of commitments; IMAGE = Integrated Model to Assess the Global Environment; TIMER = The IMage Energy Regional model.
3 As for previous commitment periods, we assumed that all banked excess emission allowances during
the first Kyoto Protocol commitment period (2008 to 2012) are fully used in the second commitment period (2013 to 2018).
4 Under a stable climate policy with long-term commitments, such long-term optimisation may occur.
Theoretically, in such cases the carbon price should increase at a rate near the discount rate. In addition, the increase could include a premium reflecting, among other things, the regulatory risks.
Page 22 of 55 WAB 500102 031
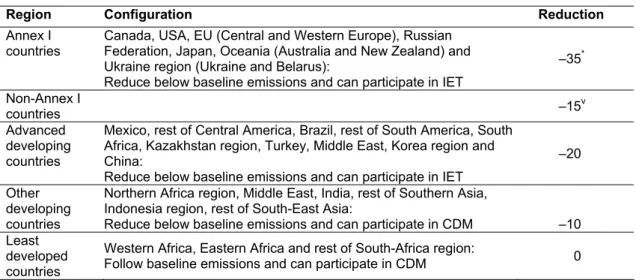
Table 2. Assumed reduction levels (in %) below baseline or business as usual scenario emissions in 2020 for the Annex I and non-Annex I countries.
Region Configuration Reduction
Annex I countries
Canada, USA, EU (Central and Western Europe), Russian Federation, Japan, Oceania (Australia and New Zealand) and Ukraine region (Ukraine and Belarus):
Reduce below baseline emissions and can participate in IET
–35* Non-Annex I countries –15 v Advanced developing countries
Mexico, rest of Central America, Brazil, rest of South America, South Africa, Kazakhstan region, Turkey, Middle East, Korea region and China:
Reduce below baseline emissions and can participate in IET
–20 Other
developing countries
Northern Africa region, Middle East, India, rest of Southern Asia, Indonesia region, rest of South-East Asia:
Reduce below baseline emissions and can participate in CDM –10 Least
developed countries
Western Africa, Eastern Africa and rest of South-Africa region:
Follow baseline emissions and can participate in CDM 0 Note: * corresponds to 30% below 1990 levels; v corresponds to approximately 120% above 1990 levels. For the default mitigation scenario we aimed at stabilising long-term GHG concentrations at 450 ppm, after an overshoot in concentrations to 500 ppm, which had a reasonable chance (about
50%) of meeting the 2oC temperature increase target. This means that global GHG emissions
(excluding LULUCF CO2) could increase by 2020 to 15-30% below 1990 levels (den Elzen et al. 2007). For the scenario, we assumed a 30% reduction target below 1990 levels for the Annex I countries as a group in 2020 and a 15% reduction target below baseline for non-Annex I as a group. For the allocation of the emission reductions among all Annex I countries (including the USA) we assumed an equal reduction below the baseline emissions (i.e. about 35%). For the non-Annex I countries, in accordance with den Elzen et al. (2008a), we assumed differentiated reductions following on the common-but-differentiated responsibilities and capabilities principle of the UNFCCC (1992) (see Table 2). The global emission reduction in 2020 of all GHGs excluding LULUCF CO2 was about 12 GtCO2, or about 20% below baseline emissions, leading to approximately 46 GtCO2 GHG emissions. The LULUCF CO2 emissions followed the baseline, which showed a decreasing trend (see also Section 4).
2.2
Choice of scenarios
In order to explore possible scenarios for the international carbon market, we looked into a set of crucial policy choices and scientific uncertainties (see Table 1), as described briefly below. Most of these are discussed more extensively later on (in the discussion on the results of our analysis).
Ambition for emission reductions in various parts of the world – A critical factor for the future of
the carbon market is the ambition for emissions reduction in different parts of the world. The EU has actively promoted the adoption of the Kyoto Protocol – and has recently put forward a set of proposals to further strengthen international climate policy, notably a 30% overall reduction target below 1990 levels for Annex I and a 15-30% reduction below baseline for non-Annex I for meeting the low concentration targets (referred to in Section 1). Obviously, broadening participation is a key priority for the EU to achieve its long-term climate objectives. For its domestic reductions, the EU has indicated that it is willing to commit to a 30% reduction (compared to 1990 levels) in 2020 as part of an international agreement if other parties commit to comparable reduction targets. If not, the EU would unilaterally still commit to a 20% reduction. So far, the response of most other parties has not been very concrete – and a wide range of outcomes still seems possible as a result of the COP-15 negotiations. Focusing on scenarios aiming at 450 ppm CO2-eq, we therefore explored the lower and upper limit of the 25-40% range of Annex I reduction. For the reduction allocation, we assumed an equal reduction below the baseline.
In addition, we also looked at reduction rates for the USA, as this is a very significant political variable in climate negotiations, and is likely to influence the level of ambition for the entire agreement. We specifically focused on the proposal by US president Obama. According to this proposal, the USA would reduce its domestic emissions to 1990 levels by 2020. For the participation of developing countries, two issues play a key role: the emissions reduction ambition from baseline and the nature of the commitments applying to developing countries. Both are also related to participation in the global carbon market. For the former, we explored the 15-30% reduction from baseline for non-Annex I, consistent with the 25-40% reduction for Annex I, and assumed differentiated reductions for the individual non-Annex I countries. For the latter (the type of commitment), we explored two extreme alternatives. The first was that all developing countries would participate via the CDM mechanism or via full emission trading (based on binding caps), and the second was an intermediate variant for the default scenario,
where only the more advanced developing countries (ADCs) participate in emission trading.5
The impact of forestry-related measures – A second set of critical factors in our analysis
involved the contribution of forestry-related measures. Here, we specifically looked into the impact of including measures to reduce deforestation and degradation (REDD), and to promote AR and FM. In the various runs, these options were either included (based on the MACs of three different forestry and land-use models, which were all used in the IPCC 4th Assessment Report), or excluded. For the default case, REDD and AR were excluded, and for FM a conservative, a low estimate was used (den Elzen and de Moor 2002). More specifically, for the Annex I regions, credits were assumed to remain constant after Kyoto on the basis of FAO data and Appendix Z of the Marrakesh Accords. For the non-Annex I regions, we applied the lowest Annex I forest management credit per area unit, and multiplied this by the forest area. This led to total sinks of about 550 MtCO2.
Scientific uncertainties – In terms of scientific uncertainties we focused on four issues: 1) the
MAC curves, 2) baseline emissions, 3) transaction costs and 4) the CDM accessibility factor. For the MAC curves, the results of using the TIMER versus the POLES MAC curves were explored. For baseline emissions, we compared results against high and low-emission scenarios. For transaction costs, we looked into the impact of high and low estimates in the literature. Finally, for CDM accessibility, we explored a 10-30% range.
5 In reality, there are some policy uncertainties concerning the participation of countries in the global
3
The significance of the Annex I and non-Annex I reduction ambition
3.1
Background
The reduction targets for Annex I and non-Annex I countries relate both to the demand and supply side of the international carbon market and have a major impact on the functioning of the carbon market.
In addition to the question of the overall reduction target of Annex I countries, a key political factor that has bearing on this aspect is the level of action that might be taken by the USA. In the current climate negotiations, this is likely to influence the level of ambition for the entire agreement. A stronger level of action by the USA would likely lead to more action from others, and a lower level of action to less action from others. The USA committed to reduce its emissions by 7% relative to the 1990 level in Kyoto, but ultimately did not ratify the Protocol. In the meantime, US GHG emissions increased to around 15% above 1990 levels in 2005 (UNFCCC 2008). Still, both the US Senate and House of Representatives have been actively engaged in a thorough debate on climate change legislation (e.g., Paltsev et al. 2007). Important elements included in most proposals that are debated are an economy-wide cap-and-trade system and a long time horizon (2050). Although the proposed US targets do not seem as ambitious as the EU targets, they involve significant emissions reductions relative to the business-as-usual scenarios.
On 18 November 2008, President Elect Barack Obama (USA) declared during a taped speech for the Bi-Partisan Governors Climate Summit, that he had the intention to establish an economy-wide cap-and-trade system with stringent annual targets that would set the USA on a course to reduce emissions to their 1990 levels by 2020, and to 80% below the same reference by 2050. Although the debate on climate change policy in the US Congress is primarily focused on the US, most of the bills also allow limited emission trading and project-based offsets in line with the current flexibility mechanism under the Kyoto Protocol. The most relevant bills also include provisions on REDD, which together with international trading, would link the US carbon market to the international carbon markets. A relevant issue to bear in mind is the potential difficulties at the time of ratifying an international climate change agreement in the US Senate. Such problems appeared before and after the ratification of the Kyoto Protocol. However, the debate on the climate issue has evolved considerably over the last two years, and both the new Administration and the Congress majority leaders are committed to dealing with it. Nevertheless, the time constraints imposed under the Bali roadmap and current economic crisis might make it difficult for the USA to get onboard in the near term.
The Bali Action plan calls for nationally appropriate mitigation actions by DC Parties in the context of sustainable development, supported and enabled by technology, financing and capacity-building in a measurable, reportable and verifiable manner. However, the key issue for non-Annex I countries is the mitigation ambition and its relationship to their participation on the carbon market. Currently, voluntary participation in the carbon market through the CDM provides a way to engage non-Annex I countries. For the default scenario we assumed that emission credits could be traded freely between all Annex I and all advanced developing countries (ADCs) that had accepted emission reduction targets and participated in IET. For the other developing countries we assumed no reduction targets and the possibility of participating in CDM. However, the question was how to achieve the emission reduction of 15-30% compared to baseline. At this point it appeared interesting to distinguish between the ADCs and the rest of developing countries. The latter would probably need to be engaged through an enhanced project-based crediting mechanism like the CDM. However, engaging the ADCs to take on caps in the near term is going to require a proper burden sharing and the opening of developed countries’ carbon markets to emission allowances from the ADCs.
Page 26 of 55 WAB 500102 031
3.2
Results
Table 3 presents the results for the default scenario (Table 1), and the first set of alternative scenarios. It shows emission reductions relative to 1990 levels for Annex I and relative to baseline for non-Annex I, and carbon price and abatement costs in terms of change in GDP for the global carbon market. The emission reductions are expressed in terms of anthropogenic
CO2-equivalent emissions of the six Kyoto GHGs, excluding LULUCF CO2 emissions.6
In the default scenario, the global abatement costs in 2020 are around 0.4% of the world GDP. The abatement costs of Annex I are significantly higher than those of non-Annex I, and are obviously affected by the reduction commitments adopted by the non-Annex I countries and the related availability of carbon credits from flexibility mechanisms outlined in the Kyoto Protocol (i.e. CDM and emissions trading). Figure 1 shows the abatement by origin for Annex I and non-Annex I. It depicts domestic abatement, IET and Joint Implementation (JI), and CDM. For non-Annex I most of the abatement (approximately 75-80%) takes place domestically. It should be noted that in these scenarios we assumed that non-Annex I countries finance their own reduction commitments. Overall, the Annex I countries as a group act as net buyers in the market, while the ADCs (via the IET) and other developing countries (via the CDM) are net sellers. Some 80-90% of the total traded amount in the IET comes from the ADCs and among them, the largest supplier is China.
Table 3 also shows the reductions after trading and CDM for the default scenario. The Annex I reduction levels after trade and CDM are lowered to about 23% below 1990 levels (from 30%). Consequently, Annex I countries need to acquire an amount of emission credits through offsetting mechanisms equal to 7% of their 1990 emissions. Non-Annex I countries reduce their emissions by around 20% compared to baseline, 5% of which can be sold through the carbon market (5% of 2020 baseline emissions of developing countries is equal to 7% of 1990 emissions in developed countries). This means that 15% of reductions in non-Annex I countries would still need to come from autonomous actions that are not directly supported by the carbon market.
Table 3 presents net abatement costs consisting of the domestic abatement costs and the financial revenues or expenditure for carbon trade or CDM. The contribution of these elements and the benefits of carbon trading are shown in Table 4. Column (1) in Table 4 gives the domestic reduction costs to countries for meeting their own reduction target (therefore 15% for non-Annex I, about 93 billion US$) and column (2) the total domestic costs for meeting their reduction level after trade and CDM (therefore −20% for non-Annex I, about 155 billion US$). Column (3) gives the transfers on the carbon market (including transaction costs for Annex I): 104 billion US$ for non-Annex I (for 5% reduction below baseline).
Consequently, non-Annex I countries do implement additional domestic reductions to offset reductions in Annex I in the order of 155−93= 62 billion US$, for which they receive 104 billion US$, a gain of 42 billion US$. The price paid for the additional domestic reduction is assumed to be equal to the highest experienced marginal abatement cost for the non-Annex I countries that are selling credits. This is still below the carbon price in Annex I countries. In conclusion, emissions trading and CDM creates a gain of 42 billion US$ for non-Annex I countries, which can be used to pay part of their emission reduction costs (93 billion US$).
Annex I countries also benefit substantially from this trade and CDM with non-Annex I countries. Even though the acquisition of the credits costs them 113 billion US$, they reduce their domestic costs by 179 billion US$ from 342 billion US$ – in case of no trade – to 163 billion US$ – in case of trade. This represents a net gain of 66 billion US$.
6 Emissions from these LULUCF sources are highly uncertain and emission estimates from various
Comparing Table 4 with Figure 1 also shows that although the emission credits traded in tonnes form a relatively small part of the total abatement (Figure 1), these represent rather significant financial flows (column (3) in Table 4). This has much to do with the fact that these emissions credits are traded against the carbon price on the market, which is well above the highest MAC within the non-Annex I countries.
Table 3. The emission reductions and abatement costs of the Annex I and non-Annex I reduction cases in 2020 (Annex I 25% and 40% cases assume Annex I emissions 25% and 40% below 1990 levels by 2020; non-Annex I 10% and 20% cases assume non-Annex I emissions 10% and 20% below baseline emission levels).
Case Annex I emissions compared to 1990 levels Non-Annex I emissions compared to baseline Global emissions compared to 1990 Carbon price Annex I costs Non-Annex I costs Global costs %* (%)v %* (%)v %* (%)v US$/ tCO2-eq % of GDP % of GDP % of GDP Default case −30 (23) −15 (19) 28 (28) 77 0.54** 0.19** 0.42** Annex I 25% −25 (21) −15 (17) 31 (31) 65 0.37 0.24 0.33 Annex I 40% −40 (24) −15 (20) 22 (26) 89 0.93 0.11 0.64 Non-Annex I 10% −30 (19) −10 (17) 32 (32) 61 0.49 −0.06 0.29 Non-Annex I 20% −30 (26) −19 (21) 23 (24) 112 0.61 0.55 0.59
* Excluding LULUCF CO2 emissions; v Values in parenthesis show the reductions after trade and CDM. **
In terms of billion US$: Annex I: 275, non-Annex I: 50 and world: 325.
Table 4. Compliance costs and trading gains at the global scale and for Annex I and non-Annex I, by 2020 for the default scenario.
Case (1) Total domestic costs (no trade)
(2) Total domestic costs (after trade & CDM) (3) Total revenues or expenditure for carbon trade (4) Total costs taking into account revenues or expenditure for carbon trade (= (2) + (3)) Gains from trade (= (1) − (4))
Billion US$ Billion US$ Billion US$ Billion US$ Billion US$
World 435 326 0 326 109
Annex I 342 163 −113* 275 66
Non-Annex I 93 155 104 51 42
• Including transaction costs
Abatement (excl. LULUCF CO2) (GtCO2-eq)
0 3 6 9 12 15 18
Annex I 25% Annex I 40% non-Annex I 10% non-Annex I 20% Default
Non-Annex I - Domestic Non-Annex I - CDM Non-Annex I - IET & JI Annex I - Domestic
-8%
+6%
-11%
+12%
Figure 1. Overview of the Annex I and non-Annex I abatement by 2020 for the Annex I and non-Annex I reduction cases compared to the default case. Note that the IET & JI and CDM are only the transfers between Annex I and non-Annex I countries, and that not all transfers are on the carbon market, including the transfers between the Annex I countries and between non-Annex I countries.
Page 28 of 55 WAB 500102 031
We will now explore the alternative scenarios with different Annex I reduction targets and demand, i.e. a 25% and 40% reduction below 1990 levels (cases: Annex I 25% and Annex I
40%). These alternative targets correspond with the upper and lower limits of the Annex I
reduction range under consideration by the AWG-KP, which are consistent with the Annex I reduction range for meeting the 450 ppm CO2-eq stabilization target (lowest category) suggested by the IPCC in its latest report.
Increasing the reduction objective to 40% for Annex I countries slightly decreases the domestic abatement fraction (Figure 1). It increases the carbon price by around 15%, due to the higher demand for emission credits from the Annex I countries. The abatement costs increase by 55% (Figure 2).
Decreasing the Annex I reduction target to 25% below 1990 levels lowers the global abatement costs by 20%. However, as Table 5 shows, this translates into global emissions around 30% above 1990 levels by 2020, which would hit the upper limit of the 15% to 30% global emissions range that is consistent with stabilisation at 450 ppm CO2-eq (den Elzen et al. 2007). As noted previously, this 450 ppm profile already allows a temporary overshoot of the concentration target. A further overshoot increases the necessary effort afterwards, shifting the burden into the future. Finally, the Annex I reductions after trade and CDM for the Annex I 25% and Annex I
40% cases show a much smaller range, only 21% to 24% below 1990 levels, instead of 25% to
40% before trade (Table 3).
Regarding non-Annex I reduction, we looked at two alternative cases: a 10% and 20% reduction below baseline levels (cases: non-Annex I 10% and non-Annex I 20%), leading to reductions below the baseline of 15% and 25%, respectively, for the ADCs, and 0% and 15% for the other developing countries. We did not explore higher non-Annex I reduction ranges here, as this would lead to higher abatement costs for the non-Annex I countries at almost the same level as Annex I (Table 3). Increasing the non-Annex I reduction target also leads to less CDM and emissions trading with Annex I, and increases the carbon price and the Annex I costs (see Figure 1). For the 10% non-Annex I reduction case, we saw an opposite pattern, i.e. lower costs for non-Annex I, a lower carbon price, more emissions trading between Annex I and ADCs, and lower Annex I costs.
In both cases, the resulting global emissions fall within the range consistent with meeting the 450 ppm CO2-eq target. The Annex I reductions, after trade and CDM for both non-Annex I cases, show an even wider range (19-26% below 1990 levels) than in the earlier Annex I cases (21-24% below 1990 levels), indicating that other non-Annex I reduction targets have an even higher impact on the Annex I reductions after trade.
Global abatement costs % of GDP
0.0 0.2 0.4 0.6 0.8
Annex I 25% Annex I 40% non-Annex I 10% non-Annex I 20% Default
-20%
+55%
-30%
+40%
Figure 2. Global abatement costs as a percentage of the GDP for 2020 for the Annex I and non-Annex I reduction cases, compared to the default case.
Regarding the participation of the USA, we explored the case in which only the USA would adopt a domestic target aiming at 1990 levels by 2020 (US only domestic), and all other Annex I and non-Annex I countries would adopt the same reduction target as under the default scenario.
The resulting global emissions are still compatible with meeting 450 ppm (Table 5).7 Compared
to the default scenario with a USA reduction target of −15% below 1990 levels, a return to 1990 levels is less stringent, and cuts the abatement costs for the USA in half. The global abatement costs decrease by 18% (Figure 4).
Next we explored the impact of the two extreme cases, i.e., all developing countries participating in CDM (Only CDM DCs) or participating in the international carbon market via IET (Full participation DCs). Note that for both cases in this sensitivity analysis, the developing
countries adopt the same reduction target.8 The global abatement costs decrease by 12%
under Full Participation DCs and increase by 5% under the Only CDM DCs scenario (Figure 4 and Table 5). The carbon price for the only CDM DCs case is much higher than the other scenarios (Table 3). Interestingly, for the developing countries the higher carbon price compensates the lower traded volumes, as the net revenues (carbon price times traded volumes) are higher under the CDM case than under the default case. As a result, in the CDM case the costs for non-Annex I countries are lower. The full participation case also leads to lower costs for non-Annex I than the default case, but for the opposite reason: the increased traded volumes compensate the lower carbon price.
The cases do affect the Annex I reduction after trade, up to 20% below 1990 levels for the full participation case instead of −23% for the default case. In Section 5 we will analyse the robustness of these results using POLES MAC curves.
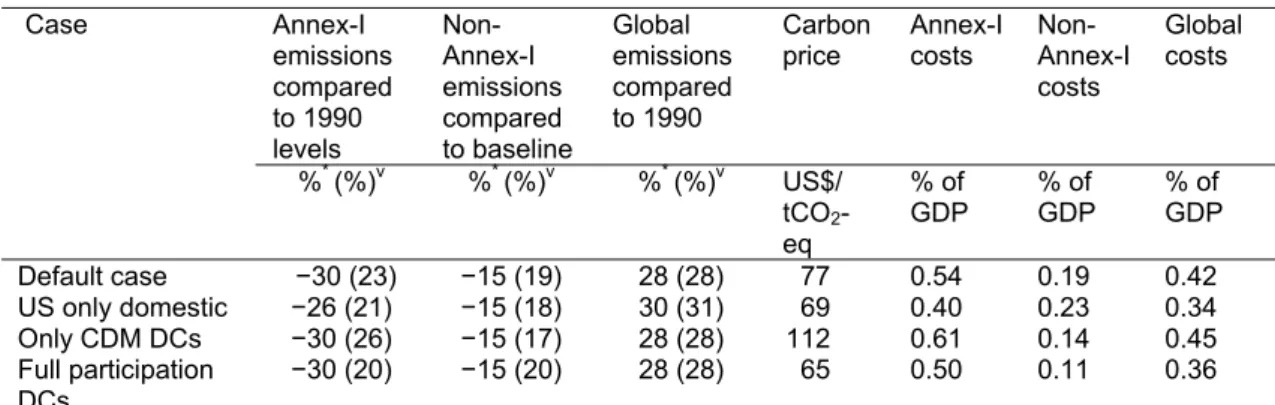
Table 5 The emission reductions and abatement costs by 2020 of the carbon-market participation cases (the Full Participation DCs case assumes that all non-Annex I or developing countries (DCs) participate in IET; the Only CDM case assumes that non-Annex I countries participate in CDM and the US Only domestic case assumes that US commits to a domestic target of returning to 1990 levels by 2020) Case Annex-I emissions compared to 1990 levels Non-Annex-I emissions compared to baseline Global emissions compared to 1990 Carbon
price Annex-I costs Non-Annex-I costs Global costs %* (%)v %* (%)v %* (%)v US$/ tCO2 -eq % of GDP % of GDP % of GDP Default case −30 (23) −15 (19) 28 (28) 77 0.54 0.19 0.42 US only domestic −26 (21) −15 (18) 30 (31) 69 0.40 0.23 0.34 Only CDM DCs −30 (26) −15 (17) 28 (28) 112 0.61 0.14 0.45 Full participation DCs −30 (20) −15 (20) 28 (28) 65 0.50 0.11 0.36 * Excluding LULUCF CO2 emissions; v Values in parenthesis show the reductions after trade and CDM.
7 Hare et al. (2009) has also analysed this US reduction target scenario in the context of meeting the 2-
degree target.
8 In reality this is less likely; in general only countries that adopt a more stringent reduction target may
Page 30 of 55 WAB 500102 031
Abatement (excl. LULUCF CO2) (GtCO2-eq)
0 3 6 9 12 15 18
US only domestic Only CDM DCs Full participation DCs Default
Non-Annex I - Domestic Non-Annex I - CDM Non-Annex I - IET & JI Annex I - Domestic
0%
-7% 0%
Figure 3. Overview of the Annex I and non-Annex I abatement in 2020 for the participation cases compared to the default case.
Global abatement costs % of GDP
0.0 0.2 0.4 0.6 0.8
US only domestic Only CDM DCs Full participation DCs Default
-12% +5%
-18%
Figure 4. Global abatement costs as a percentage of the GDP for 2020 for the participation cases compared to the default case.
4
The importance of including the forestry sector in the carbon
trading system
4.1
Background
The current Kyoto Protocol takes a somewhat fragmented approach to emissions and removals from forestry and other land use. So far, net removals, like those from AR and FM, can be used to offset emissions from other sectors, but the LULUCF sector is not an integral part of the “quantified emission limitations or reduction commitments” to which Annex I Parties have committed themselves (Trines et al. 2006).
However, the LULUCF CO2 emissions are significant (15-20% of the global anthropogenic GHG emissions) and are predominantly located in non-Annex I countries. Reducing emissions from deforestation and forest degradation (REDD) could therefore significantly avoid emissions. In order to effectively reduce all greenhouse gas emissions, it would be helpful to include the forestry sector in a possible post-2012 mitigation regime. It could also create opportunities to deliver substantial funding for forest conservation and management while preventing irreversible loss of biodiversity and soil degradation.
REDD – There are different options in terms of the design and implementation to include REDD
in a post-2012 climate agreement, e.g. more indirectly through a fund or fully integrated, via a market-based mechanism (e.g., Trines et al. 2006; Benndorf et al. 2007; Höhne et al. 2007; Karousakis and Corfee-Morlot 2007; Schlamadinger et al. 2007a; 2007b). In the case of fund-based mechanisms, it is often difficult to assess whether proposed sources of funding would be sufficient, especially because existing estimates of financing needs vary widely and pledges for funding (e.g. voluntary contributions) are not always fulfilled. Under the right conditions, a market-based mechanism (such as cap-and-trade) would be able to mobilise the financial resources necessary, including resources from the private sector as emphasised by Karousakis and Corfee-Morlot (2007). However, given the high uncertainty surrounding available emissions estimates from deforestation in developing countries, Karousakis and Corfee-Morlot concluded that the creation of markets for REDD by 2013 would be premature in the absence of significantly more effort to establish reliable systems for monitoring, reviewing and verifying performance. The Eliasch Review (Eliasch 2008) recommended that the inclusion of deforestation credits in carbon markets should be matched by more stringent reductions targets for Annex I countries in order to achieve a good balance between supply and demand. It should also not lead to leakage of emissions elsewhere (e.g. forestry companies relocating), and the reductions should be additional to those that would have occurred in the absence of intervention. A linking mechanism between deforestation and global carbon trading should be
institutionalised as part of a wider global carbon market framework.9
AR and FM – Other ways to reduce forestry greenhouse gas emission are through
afforestation-reforestation (AR) and forest management (FM). Currently, such activities can lead to offsets of emission reductions, thereby also influencing the functioning of the carbon market.
4.2
Results
In this section we will further analyse the costs savings of inclusion of emission credits from REDD, AR and FM in the carbon market (for earlier analysis see Rose et al. 2007; Anger and
9 The EU stated that deforestation credits could only become a realistic option if the conditions
mentioned above are met. Presently, the EU is proposing a voluntary fund-based approach for REDD, i.e. the development of an international mechanism under the UNFCCC – the Global Forest Carbon Mechanism – through which developing countries will be rewarded for emission cuts achieved by REDD. The EU aims to cut global deforestation emissions by 50% (compared to present levels) by 2020, as also analysed in Kindermann et al. (2008).