Indirect effects of biofuels:
intensification of agricultural production
Indirect effects of biofuels: intensification of agricultural production © Netherlands Environmental Assessment Agency (PBL), Bilthoven, March 2010 PBL publication number 500143005
Corresponding Author: Elke Stehfest; elke.stehfest@pbl.nl
Parts of this publication may be reproduced, providing the source is stated, in the form: Netherlands Environmental Assessment Agency, March 2010, Indirect effects of biofuels: intensification of agricultural production.
This publication can be downloaded from our website: www.pbl.nl/en.
The Netherlands Environmental Assessment Agency (PBL) is the national institute for strategic policy analysis in the field of environment, nature and spatial planning. We contribute to improving the quality of political and administrative decision-making by conducting outlook studies, analyses and evaluations in which an integrated approach is considered paramount. Policy relevance is the prime concern in all our studies. We conduct solicited and unsolicited research that is both independent and always scientifically sound.
Office Bilthoven PO Box 303 3720 AH Bilthoven The Netherlands Telephone: +31 (0) 30 274 274 5 Fax: +31 (0) 30 274 44 79 Office The Hague PO Box 30314 2500 GH The Hague The Netherlands Telephone: +31 (0) 70 328 8700 Fax: +31 (0) 70 328 8799 E-mail: info@pbl.nl
Indirect effects of biofuels: intensification of agricultural production 3
Summary
Indirect land-use change caused by the cultivation of energy crops on agricultural land is an important issue in the discussion on the sustainability of bio-energy. Displacement of agriculture and the resulting conversion of natural areas lead to additional greenhouse gas emissions, potentially outweighing any reductions in greenhouse gas, and to a further loss of biodiversity. Intensification of agricultural production is often suggested as the most important solution to this problem; biofuel crops could be placed on existing agricultural land, and any losses in production of other crops would be compensated not by expanding agriculture, but by increasing the yield on existing agricultural land. However, intensification can also cause additional greenhouse gas emissions, due to increased fertiliser use and related N2O emissions. Merely increasing the quantity of nitrogen fertiliser – probably the simplest way to produce higher yields – could lead to additional emissions of up to 150 kg CO2 eq per GJ of fuel. If higher yields would be achieved by simultaneous improvement of management, crop varieties and fertiliser input, additional emissions could stay below 5 kg CO2 eq per GJ of fuel. As large yield increases will also be necessary to feed a larger and wealthier future world population, yield improvements that limit the indirect effects of biofuels need
to be higher than they would have been under a business-as-usual scenario, that is, additional improvements need to be made apart from any business-as-usual development.
Introduction
In recent years, the sustainability of bio-energy has been widely discussed, and sustainability criteria that have been introduced mainly focus on direct effects from the production chain of bio-energy products. But the potential impact of bio-energy crops reaches further. Bio-energy has been recognised to possibly cause significant indirect effects in other production systems (Searchinger et al. 2008, Ros et al. 2010). In the public debate, much attention has been given to greenhouse gas emissions and biodiversity loss, especially resulting from indirect land use change.
If energy crops are cultivated on agricultural land previously used in the production of food crops, one of two things is likely to happen: either the food crop is grown elsewhere, or there will be less food available for consumption (Figure 1). In case of the latter, no additional emissions occur, but there may be impacts on food security.
Indirect effects of biofuels:
intensification of agricultural
production
Figure 1 Direct land use for bio-energy and its indirect effects
Demand for land for the cultivation of biomass Use of currently productive land (managed land) Intensification of agriculture Conversion of unproductive land (unmanaged land) Change in consumption Direct effects Indirect effects Conversion of unproductive land (unmanaged land)
In case of the former, a shift in the location of food production might lead to land conversion elsewhere. This is normally described as the indirect land-use change effect of biofuels. Vegetation and soils contain carbon and, when natural land is converted to agricultural land, much of that carbon is released, leading to indirect greenhouse gas emissions. However, an expansion of agricultural area is not the only way to replace the loss in food crops; this could also be done by increasing the yields on existing agricultural land via improved agricultural management and technology. Therefore, intensification of food production has been suggested as a possible measure for reducing or avoiding the indirect land-use conversion and greenhouse gas emissions related to biofuels. However, intensification mostly relies on or is driven by increased mechanisation, and the use of agrochemicals and fertilisers. Machinery and agrochemical production require energy and therefore lead to additional CO2 emissions, and nitrogen fertiliser application causes emissions of the potent greenhouse gas N2O.
The objective of this policy brief is to provide an estimation of indirect emissions from intensification. We have focused on N2O emissions due to N-fertiliser use, and on the relationship between fertiliser use and yields. Finally, the policy brief presents a discussion of the preconditions under which agricultural intensification could successfully reduce the total indirect effects of biofuels.
Greenhouse gas emissions from crop production
There are two major sources of greenhouse gas emissions from crop production on existing agricultural land: CO2 emission from fossil energy used for operating machinery and for producing agrochemicals, and N2O emissions from N-fertiliser application.1Worldwide, energy use in agriculture varies widely. In developed countries, the total energy input is about 4 - 15 GJ/ha. The contribution from fertiliser production can be over 50% from the total energy use, but varies from crop to crop. CO2 emissions caused by modern farms with high mechanisation are of the order of 200 to 1000 kg/ha per year, including those from agrochemical production.
Agricultural N2O emissions from fertiliser and manure application are a significant contribution to climate change. 1 CHemissions from wetland rice form a very special case and are
Increased NH4+ and NO3- concentrations in the soil are used in the microbial processes of nitrification and denitrification, whereby the greenhouse gas N2O is formed as a by-product. Both nitrification and denitrification strongly depend on small-scale soil parameters, especially water content and oxygen concentration. They vary largely in time and space, and N2O emissions are difficult to estimate. The default IPCC emission factor for direct N2O emission (as N) is 1% of the applied nitrogen, plus another 0.325% due to indirect emissions, occurring elsewhere from nitrogen that has been leached or emitted (IPCC 2006). N2O emissions may actually be more strongly related to N surplus (N applied minus N uptake by plants) than to N input, and may increase exponentially. However, the IPCC still applies this linear relationship to N input, and so have we in this policy brief.
N2O emissions also occur at industrial N-fertiliser production sites. The applied emission factor is 0.0074 kg of N2O per kg N in fertiliser.
With a typical fertiliser application rate of 100 kg N/ha in intensive agriculture, N2O emissions would amount to about 300 kg CO2 equivalent/ha. However, measurements have shown that, depending not only on fertiliser application, but also on soil type, crop type and other circumstances, actual emissions can range from 50 to as much as 2000 kg CO2 equivalent/ha.
Measures to increase productivity on arable
land and their greenhouse gas emissions
Yield increases can be realised in several ways. Table 1 gives an overview of the most important measures and their potential impact on greenhouse gas emissions.
As mentioned above, a substantial amount of energy used in fertiliser production and management is related to intensive agricultural systems. In contrast, low-input systems in developing countries work (almost) without mechanisation and with low fertiliser use. Although land use under these conditions may be called inefficient because of the low yields and possible soil degradation, the energy efficiency (measured as energy output in products versus energy input) is relatively high, and greenhouse gas emissions related to energy use are relatively low. In general, with increasing agricultural intensity and mechanisation, energy use per crop unit also increases.
Measures to increase productivity on arable land and their effects on emissions
Measure(s) Impact on energy use and greenhouse gas emissions
Increase of NPK-fertiliser use Increased energy use for fertiliser production
Increased N2O emissions from N-fertiliser production and application
Better management to increase fertiliser use efficiency Decreased N2O emissions from fertiliser application
Improved control of pest and diseases Increased energy use in production of agrochemicals More efficient, i.e. less use of inputs
Irrigation Small increase in fossil-fuel use for infrastructure and water transport
Mechanisation Increase in energy use by agricultural machinery
Improved crop varieties Energy use in plant breeding
Indirect effects of biofuels: intensification of agricultural production 5
Relation between yields and fertiliser use
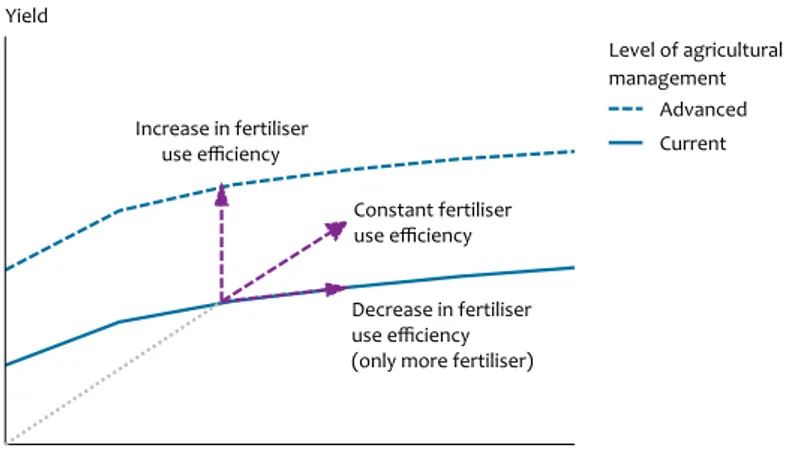
Increase in fertiliser use has been and will be a major cause of yield increases. The efficiency of fertiliser application (measured as kg yield per kg N applied) is strongly dependent on agricultural management practices and crop varieties. Figure 2 gives a schematic overview of the relationships between fertiliser input, management efficiency, crop varieties and yields, which can be found in the literature. As these relationships show, yields can be improved by increasing fertiliser inputs, or by increasing the efficient use of fertiliser through better management and improved crop varieties. The relation between fertiliser input and yield shows that ever-increasing amounts of fertiliser need to be applied to achieve yield increases. In such cases, the efficiency of fertiliser use decreases as yields increase. However, higher yields could also be obtained to a certain extent without increasing the N input, and thus fertiliser efficiency would also increase. As can be expected, in actual practice, a mixture of both processes occurs.
Relationship between yield increase and N
2O emissions
Below, we present an estimation of the increase in fertiliser use and N2O emissions, related to an increase in yields. For the estimation, we applied three different approaches: (1) yield increases, caused only by N input, (2) yield increases, caused only by efficiency, and (3) an estimated realistic mix between these two.
Approach 1. Increased N input
Figure 3 shows the relationship between N fertiliser input, yields and yield increases, based on specific field trials, whereby all parameters except N input were kept constant. As stated above, yield increases obtained by increasing fertiliser inputs become smaller as fertiliser levels go up (Figure 3, right panel).
What consequences would follow from these relationships if one hectare of cropland normally used for food would be used for the production of biofuels, while the loss in food crop would be compensated by yield increases elsewhere? For any given situation, with a specific yield and fertiliser application rate for a certain agricultural area, we could derive the amount of fertilizer needed to achieve a certain yield increase (Figure 3, right panel), thus also showing the amount of fertilizer needed to compensate for the loss in food crops. Applying the IPCC N2O-emission factor, the resulting additional N2O emissions could also be calculated (Figure 4). The higher the rate of fertiliser used in the starting situation, the higher is the amount of extra fertiliser needed to realise the extra yield (Figure 3), and the higher are the indirect N2O emissions. As can be expected, indirect emissions strongly depend on cereal yield and fertiliser input.
Indirect emissions can be expressed as emissions per energy unit, under certain assumptions on the energy yield of the biofuel crop. Assuming 100 or 200 GJ/ha, indirect emissions could amount to more than or almost 100 kg CO2 equivalent/ GJ (Figure 4, right panel), which would be more than the emissions from the fossil fuel that the biofuel is intended to substitute (84 kg CO2 eq/GJ ).
Approach 2. Increase in fertiliser use efficiency
As shown in Figure 2, yield increase can also be realised, to a certain extent, through improved management and crop varieties, while keeping the N input constant. This means that more can be produced with the same amount of fertiliser. So, per unit of product, fertiliser use and N2O emissions will be lower. Therefore, if intensification could be realised through other measures than by increasing N input, its emissions would actually decrease (which might then be called an indirect emission reduction). However, such methods for increasing yields are restricted by biophysical crop and soil characteristics, and the efficiency in fertiliser use cannot be increased indefinitely. In addition, such measures require Schematic diagram of the relation between yields, fertiliser input and other management factors, for two different management situations (solid and dashed curve). Figure 2 N-application rate Yield Level of agricultural management Advanced Current Theoretical relation between fertiliser use and yields
Constant fertiliser use efficiency Increase in fertiliser use efficiency Decrease in fertiliser use efficiency (only more fertiliser)
agro-technological knowledge and suitable equipment, which are not (yet) available to all farmers in all world regions.
Approach 3. FAO statistics on fertiliser use and yields
Both of the processes described in approach 1 and 2 occur in actual practice. For an analysis of the simultaneous improvements through inputs, technology and crop varieties, long-term statistical data provide the best source of information. Looking at historical fertiliser inputs and the total production per world region provides a very diverse picture, based on data for the period 1970-2000 (Figure 5).
On the global level, fertiliser application rates and agricultural yields have increased over time (Figure 5). Across all world regions, yield values and fertiliser input show a wide range. This is caused by several factors, such as yield levels and management, use of animal manure, and degree of biological N2 fixation. In Europe, yields and fertiliser input are high, with increasing yields in the last years, and a slightly decreasing fertiliser input (Figure 5, right panel). In China, yields and fertiliser input, generally, are even higher than in Europe (partly caused by the number of harvests per year). However, the increasing use in fertilizer has hardly led to a further increase in yields, in recent years (Figure 5, right panel).
Yields and yield increases depending on the N-fertiliser dose (Cassman et al. 2003).
Figure 3
0 50 100 150 200
N-application rate (kg N / ha) 0 2 4 6 8 10
12 Yield (thousand kg / ha]
Impact on yield
Fertiliser-use efficiency for cereals
0 50 100 150 200
N-application rate (kg N / ha) 0
20 40 60
80 Δ yield (kg) / Δ N (kg)
Impact on yield increase
Indirect emissions due to biofuel cropping on 1 ha of existing cropland, assuming that the lost cereal production is compensated by yield increases elsewhere via increased fertiliser input. The x axis shows the starting situation for fertiliser input (with yields as depicted in Figure 3). Figure 4 0 50 100 150 200
N-application rate (kg N / ha) 0
4 8 12 16
20 Indirect emissions (thousand kg CO2 eq)
Land-related emissions
Indirect greenhouse gas emissions due to increase in fertiliser use
0 50 100 150 200
N-application rate (kg N / ha) 0
40 80 120 160
200 Indirect emissions (kg CO2 eq) / GJ
Biofuel yield 100 GJ / ha 200 GJ / ha
Indirect effects of biofuels: intensification of agricultural production 7 Eastern Africa, with low yields and low fertiliser input (Figure
5), is an example of extensive agriculture, where even with low fertiliser input certain yields are achieved. This can partly be attributed to N deposition, N fixation, manure input, or N from soil pools (called ‘nutrient mining’, leading to soil depletion, in the long term). In such a situation, the calculated efficiency in fertiliser use would be very high, but not due to very efficient management practices, but because of nitrogen input from other sources, such as the soil, in turn, causing soil depletion.
At the global scale, yield increases are likely to be achieved through a combination of increased N applications in regions with low N fertiliser use, such as Africa and parts of Asia and South America, and improved N fertiliser efficiency in industrialised countries where current N application rates are already high. As a result, we see higher yields with either constant or declining N use (Western Europe). Data on cereal yields and fertiliser use in 80 countries, over the 1960-1997 period, show a similar picture. While fertiliser use efficiency initially declined, it has stabilised in recent years in developed countries, at around 20 kg grain/kg N (Cassman et al., 2003). A constant fertiliser use efficiency would mean that, even under increasing N input and yields, the specific fertiliser use per unit of product would stay the same (a linear relationship between fertiliser application rate and yield, starting from the zero point of the diagram; see Figure 2). Therefore, when applying a fixed N2O emission factor, the N2O emissions per unit of product would be the same. As a consequence, the effects of indirect emission from biofuels, if completely caused by yield increases, would be zero, theoretically. The
situation is only slightly different, in actual practice, because there is still some yield in the absence of fertiliser (Figure 5, left panel).
Using the linear relationship between yields and fertiliser input (Figure 5, left panel), as well as the result from a similar analysis by Dobermann (2006), a (relatively small) indirect emission factor of 200 to 400 kg CO2 eq/ha can be derived. In case of 100% intensification (no land conversion), the indirect emissions would reduce the greenhouse gas emission reduction from biofuels by 1 to 10%.
Discussion
Above, we have presented three possible approaches for estimating additional fertiliser application associated with agricultural intensification. While historical relationships between fertiliser input and yields (approach 3) might apply to long-term development, the short-term response from farmers to higher crop prices might be that of using additional inputs, resulting in immediate yield gains. The situation in real life will be somewhere between these two extremes, and strongly depends on prices and the rate at which they change.
Agricultural assessments show that future population growth and increasing wealth will strongly increase the demand for agricultural commodities. Therefore, strong improvements in agricultural productivity are required to fulfil this demand, against reasonable prices and without any large expansions of agricultural areas. When intensification is suggested as a
Average agricultural production [t/ha] versus average N fertiliser input [kg/ha], in five-year time steps, from 1970 to 2000. Arrows indicate development over time.
Figure 5
0 40 80 120 160 200
N-application rate (kg N / ha) 0
1000 2000 3000
4000 Yield (kg dry matter / ha)
All regions China region Western Europe Eastern Africa World average Lineair trend Observed values
Relation between fertiliser use and yields, 1970 – 2000
0 40 80 120 160 200
N-application rate (kg N / ha) 0
1000 2000 3000
4000 Yield (kg dry matter / ha)
China region Western Europe World average
Constant fertiliser-use efficiency
possible way of avoiding the effects from indirect land-use change, it would have to be stronger than under business-as-usual development, that is, it would have to be additional. From experiences with other climate policy measures (e.g., CDM (clean development mechanism), and recently REDD (reduction of emissions from deforestation and forest degradation)), it is known that additional developments are very hard to monitor and estimate, and can easily be overestimated.
Conclusions
Indirect land conversion due to the displacement of food crops by energy crops, might be restricted or even prevented by global agricultural intensification. However, this intensification is not climate neutral. Especially the use of fertiliser and related N2O emissions are likely to increase greenhouse gas emissions.
The additional fertiliser input needed for achieving a certain increase in productivity, varies largely between world regions, and depends strongly on the relative contribution of technology and improved management. If only additional N-fertilizer input is used for increasing
agricultural yields, the additional indirect emissions related to biofuels could range from 10 to more than 150 kg CO2 eq/GJ (comparable fossil-fuel emissions would be about 84 kg CO2 eq/GJ).
Statistics from the FAO show a combination of increasing fertiliser use and improving fertiliser efficiency, with an indirect emission factor in the range of 1 to 8 kg CO2 eq/ GJ for biofuels, based on world average values. However, there are important differences between world regions. In many world regions, there is potential for increasing or
maintaining yields without increasing fertiliser input, in effect increasing fertiliser use efficiency.
In developing regions, additional fertiliser is required to increase yields in a sustainable manner, but good management and monitoring of fertiliser use efficiency is needed to avoid excess fertiliser application and N2O emissions.
In general, it can be concluded that agricultural intensification as a method of reducing the indirect effects of biofuels is certainly preferred over expansion of agricultural areas, if fertiliser use efficiency is also increased or at least kept constant.
If agricultural intensification is to decrease the amount of indirect land-use change caused by biofuels, it must be stronger than in business-as-usual development, that is, it should be in addition to this development.
References:
Cassman K, Dobermann A, Walters DT, Yang H (2003) Meeting cereal demand while protecting natural resources and improving environmental quality. Annual Review of Environmental Resources 28:315-358
Doberman A (2006) Nitrogen Use Efficieny in Ceral Systems (invited paper) http://www.regional.org.au/au/asa/2006/plenary/soil/ dobermannad.htm (downloaded 4-11-2009)
IPCC (2006) IPCC Guidelines for National Greenhouse Gas Inventories, Vol. IPCC NGGIP Programme, IPCC-TSU/IGES. Published by the Institute for Global Environmental Strategies (IGES), Hayama, Japan on behalf of the IPCC, Hayama, Japan
Ros JPM, Overmars KP, Stehfest E, Prins AG, Notenboom J, Oorschot Mv (2010) Identifying the indirect effects of bio-energy production Searchinger T, Heimlich R, Houghton RA, Dong F, Elobeid A, Fabiosa J,
Tokgoz S, Hayes D, Yu T-H (2008) Use of U.S. Croplands for Biofuels Increases Greenhouse Gases Through Emissions from Land-Use Change. 319:1238 - 1240
Colophon
Responsibility
Netherlands Environmental Assessment Agency
Authors
E. Stehfest, J.P.M. Ros, L. Bouwman
Graphics
M. Abels, F. de Blois, K. Klein Goldewijk
Editing
A. Righart
Design and layout
Uitgeverij RIVM
Corresponding Author