TRENDS IN
GLOBAL CO
2
EMISSIONS
Trends in Global CO
2
emissions:
2016 report
About this publication
This publication can be downloaded from: http://edgar.jrc.ec.europa.eu or http://www.pbl.nl/en/trends-in-global-co2-emissions. Parts of this publication may be reproduced, providing the source is stated, in the form: Olivier J.G.J., Janssens-Maenhout G., Muntean M. and Peters J.A.H.W. (2016), Trends in global CO2 emissions; 2016 Report, The Hague: PBL Netherlands Environmental Assessment Agency; Ispra: European Commission, Joint Research Centre.
This CO2 report 2016 is one in a series of annual publications by PBL Netherlands Environmental Assessment Agency and the European Commission’s Joint Research Centre (JRC). After publishing web reviews in 2007 and 2008, the CO2 report series started in 2009, providing up-to-date knowledge on the trend in global CO2 emissions from fossil fuels and cement. CO2 emission estimates were made by PBL and the JRC on the basis of energy consumption data for the 1970–2013 period, published by the International Energy Agency (IEA), and on 2014–2015 trends, published by BP. The estimations are also based on production data on cement, lime, ammonia and steel, as well as on emissions per country, from 1970 to 2012, from the Emissions Database for Global Atmospheric Research (EDGAR) version 4.3.2, which was developed jointly by the JRC and PBL. The greenhouse gas emissions of the EDGAR 4.2 FT2012 dataset have also been used for the global emissions overviews in the Emissions Gap Reports of the United Nations Environment Programme (UNEP) (2012–2016). All reports are available from http://edgar.jrc.ec.europa.eu/whats_new.php and http://www.pbl.nl/en/trends-in-global-co2-emissions.
PBL Netherlands Environmental Assessment Agency is the national institute for strategic policy analysis in the field of environment, nature and spatial planning. We contribute to improving the quality of political and administrative decision-making by conducting outlook studies, analyses and evaluations in which an integrated approach is considered paramount. Policy relevance is the prime concern in all our studies. We conduct solicited and unsolicited research that is both independent and scientifically sound.
As the European Commission’s science and knowledge service, the Joint Research Centre’s mission is to support EU policies with independent evidence throughout the whole policy cycle. Its work has a direct impact on the lives of citizens by contributing with its research outcomes to a healthy and safe environment, secure energy supplies, sustainable mobility and consumer health and safety. Working in close cooperation with policy Directorates-General, the JRC addresses key societal challenges while stimulating innovation through developing new methods, tools and standards, and sharing its know-how with the Member States, the scientific community and international partners. Trends in global CO2 emissions: 2016 Report
©PBL Netherlands Environmental Assessment Agency The Hague, 2016
PBL publication number: 2315
European Commission, Joint Research Centre, Directorate Energy, Transport & Climate JRC Science for Policy Report: 103428 Corresponding author
jos.olivier@pbl.nl Authors
Jos G.J. Olivier (PBL), Greet Janssens-Maenhout (EC-JRC), Marilena Muntean (EC-JRC), Jeroen A.H.W. Peters (PBL) Responsibility
PBL Netherlands Environmental Assessment Agency European Commission, Joint Research Centre (EC-JRC) Acknowledgements
This report was drafted with input from many colleagues, gathered over several years. The authors would like to
thank P. Boot (PBL), M.E. den Elzen (PBL), W.T. van Ierland (EC-DG CLIMA), J. Talkop (EC-DG CLIMA), F. Dentener (EC-JRC), M. Crippa (EC-JRC), B. Koffi-Lefeivre (EC-JRC), S. Calsamiglia-Mendlewicz (EC-JRC), R. Quadrelli (IEA), A. Jones (IEA), G.P. Peters (CICERO), Y. Meijer (ESA) and A. Iancu (EC-JRC) for their review and suggestions and E. Schaaf (EC-JRC) and M. Duerr (EC-JRC) and D. Guizzardi (EC-JRC) for support on the data. We thank the IEA, USGS and WSA for providing recent statistics.
Editing PBL and EC-JRC Graphics
PBL Beeldredactie
Production coordination and English-language editing PBL Publishers
Layout
Contents
Summary and main findings 4
1 Introduction 8
1.1 Methodology and data sources used 8
2 Results 12
2.1 After a slowdown in growth, global CO2 emissions stalled in 2015 12
2.2 Different trends in the largest emitting countries and regions 19 2.2.1 China 19 2.2.2 United States 23 2.2.3 European Union 26 2.2.4 India 30 2.2.5 Russian Federation 31 2.2.6 Japan 32 2.2.7 South Korea 33 2.2.8 Canada 33 2.2.9 Brazil 33 2.2.10 Indonesia 33 2.2.11 Saudi Arabia 34 2.2.12 G20 countries 34
2.2.13 Other remaining countries 34
2.3 Comparison of emissions in the various countries 34
3 How to mitigate CO2 emissions from energy supply and consumption 46 3.1 Introduction 46
3.2 Trends in global fossil-fuel consumption and fuel mix 47 3.3 Trends in renewable energy sources 50
3.4 Trends in nuclear energy 55
Annex 1 Methodology and data sources 60
A1.1 Methodology and data sources over the 2012–2015 period 60 A1.2 Dataset on biofuel use in road transport 62
A1.3 Other sources of CO2 emissions: forest and peat fires and post-burn decay 63
Annex 2 Other trends and CO2 results 64
A2.1 CO2 emissions from oil and gas production 64
A2.2 CO2 emissions from cement production (non-combustion) 64
A2.3 CO2 emissions from iron and steel production 67
A2.4 CO2 emissions from other industrial sources 67
Annex 3 Data quality and uncertainty 68
Annex 4 Global and regional temperatures 72
List of abbreviations and definitions 74
Summary and main findings
The year 2015 was a historic year. First, 2015 was the hottest year since records began in 1880. Moreover, the 16 warmest years recorded are in the 1998-2015 period. Second, top emitter China started to curb its carbon dioxide (CO2) emissions in 2015. China and the United States reduced their emissions by 0.7% and 2.6%, respectively, compared to 2014. Emissions in the Russian Federation and Japan also decreased, by 3.4% and 2.2%, respectively. However, these decreases were counter-balanced by increases in India of 5.1%, in the European Union, where emissions increased by 1.3%, and by increased emissions in a large group of the smallest countries. Third, 2015 closed with the adoption of the landmark Paris Agreement on Climate Change by 194 countries and the European Union.
As a result of these changes in national emission totals, global CO2 emissions from fossil fuel combustion, cement production and other processes decreased in 2015 by 0.1%. Taking into account the uncertainty in the trend we conclude that, in 2015, global CO2 emissions for these sources stalled. This conclusion confirms that the slowdown in the growth in global CO2 emissions from fossil fuel combustion in the last years was not random, but due to structural changes in the economy, global energy efficiency improvements and in the energy mix of key world players, as anticipated in previous CO2 reports by Olivier et al. (2015, 2014). It also is in line with the assessments of the Global Carbon Project (GCP, 2016) and IEA announcement (2016a).
Stalling of global emissions in 2015
The stalling of global emissions is no surprise as the declining growth in annual emissions continued over the past three years: 2.0% in 2013; then 1.1% in 2014, and further down to -0.1% (±0.5%) in 2015. In 2013 and 2014, the slower emission growth was not so much a reflection of slower global GDP growth, which continued to increase by about 3%, but rather was associated with lower annualGDP growth in China of about 7%, down from a decade of official annual GDP growth figures of about 10%, on average, until 2013. However, in 2015 global CO2 emissions became decoupled from GDP, as global GDP continued to grow by 3.0%. A more structural shift away from carbon-intensive activities, particularly in China but also in the United States and other countries, contributed considerably to this trend.
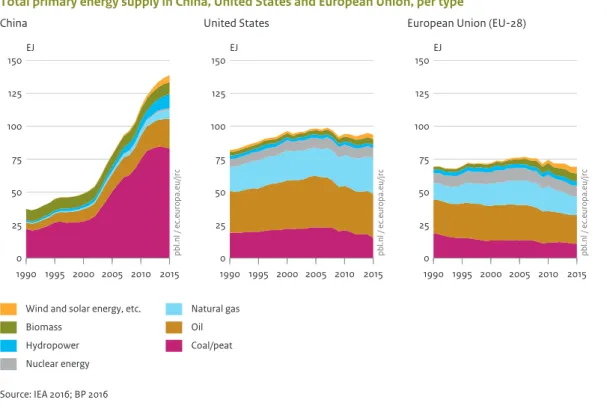
Changes in fossil fuel mix and
renewable energy
Global primary energy consumption increased in 2015 by 1.0%, which was similar to 2014 but well below the 10-year average of 1.9%, even though fossil fuel prices fell in 2015 in all regions. In 2015, coal consumption decreased, globally, by 1.8%, while global oil and natural gas consumption increased by 1.9% and 1.7%, respectively. These shifts in fossil fuel consumption also affected the fuel mix. The largest decreases in coal consumption were seen in the United States and China, partly counterbalanced by increases in India and Indonesia. For oil consumption, the largest increases were in China, India and United States. The global increase in the use of natural gas was mainly due to increased consumption in the United States and the European Union, with smaller increases seen in Iran and China.
The production of nuclear energy increased by 1.3% and hydroelectricity by 1.0%; resulting in respective shares of 10.7% and 16.4% in total global power generation, and 4.4% and 6.8% in global primary energy consumption. In 2015, significant increases of 15.2% were observed in other renewable electricity sources, notably wind and solar energy. With double-digit growth for the 12th year in a row, these now provide almost 6.7% of global power generation, close to a doubling over the past five years (3.5% in 2010). Their share in 2015 increased to 2.8% of total global primary energy consumption, also doubling their share since 2010.
The remaining two thirds of global power generation was generated by fossil-fuel-fired power stations, which is 1 percentage point down from 2014 and the lowest share since 2002. The share of fossil fuel in global energy consumption was 86% in 2015.
The G20 and the six largest emitting
countries (including the European
Union)
In 2015, the five largest emitting countries and the European Union, which together account for two thirds of total global emissions, were: China (with a 29% share in the global total), the United States (14%), the European Union (EU-28) (10%), India (7%), the Russian Federation (5%) and Japan (3.5%). The 2015 changes within the group of 20 largest economies (G20), together accounting for 82% of total global emissions, varied widely, but, overall, the G20 saw a decrease of 0.5% in CO2 emissions in 2015.
Coal-fired power plants caused one
third of global emissions
Recent trends in the fossil-fuel mix, with shifts from coal to natural gas or vice versa, in the United States, China and European Union, are very relevant for the overall trend in CO2 emissions. Globally, coal combustion was responsible for about 46% of CO2 emissions from fossil-fuel combustion, with 31 percentage points emitted from coal-fired power plants. Among the top 4 emitting countries (including the European Union), coal-fired power plants also had large but variable shares in national CO2 emissions: 48% for China, 31% for the United States, 28% for the European Union and 47% for India.
The energy industry continues to build new coal-fired power plants, at a relatively fast pace, even in countries that already have an overcapacity of electricity
production. Utilisation rates decreased since 2005 in the top 4 countries (including the European Union) to around 50% to 55% and in India around 65%. In China, the average coal plant ran at about 49% of its capacity in 2015. Over the course of 2015, coal power plant construction activities in China increased by 21.7 GW, while this decreased overall in the rest of the world by 13.7 GW.
Structural changes towards less
carbon-intensive activities in China
An important reason for the stalling of global CO2emissions is the change in the world’s fossil-fuel use due to the structural change in the economy and in the energy mix of China. For the first time since 2000, China’s CO2 emissions decreased, by 0.7%, and its per capita CO2 emissions went down by 1.2%. Although China, generally, in total, emits twice as many CO2 emissions as the United States, its per capita CO2 emissions (7.7 tonnes CO2/cap) remain below half of those in the United States (16.1 tonnes CO2/cap). While China’s emissions over the 2002–2011 period, on average, increased by 10% per year, the recent average annual growth (between 2011 and 2015) was 3% per year. This reduced growth rate and even decline in emissions in 2015, was mainly due to a 1.5% decrease in coal consumption and a 1 percentage point increase in the share of non-fossil fuel in primary energy consumption. The latter was achieved by substantial increases, in 2015, in nuclear energy (29%), hydropower (5%) and other renewables, such as wind and solar energy (21%).
Decreasing CO
2emissions in the
United States
CO2 emissions in the United States decreased considerably, in 2015, with 2.6%, which was mainly caused by a drop of 13% in coal consumption, representing the largest relative decrease in any fossil fuel in the United States over the past five decades. For the first time ever, the total kWhs produced by gas-fired plants in 2015 was almost equal to those produced by coal power in the United States. The 12% decrease in energy-related CO2 emissions over the last 10 years was mostly in the power sector, due to a shift from coal to natural gas used for electricity generation, whereas the demand for electricity has remained rather constant, since 2005. In addition, over the last decade, fuel consumption decreased also in other sectors, albeit to a lesser extent, contributing to the decline in CO2 emissions since 2005.
Stagnating emission reduction in the
European Union
After four years of decreasing annual emissions (on average by 3.1%), the European Union´s CO2 emissions increased again, by 1.3%, in 2015. This was mainly due to an increase of 4.6% in natural gas consumption, mainly used in power generation and space heating, and an increase of 4% in diesel consumption in transport. Although power generation increased by 1.3% in 2015, the related CO2 emissions decreased by 0.6%. This was due to a much larger share of 29% renewable electricity in total power generation in 2015 (mainly hydropower, wind and solar energy) and a decline of 1.8% in coal consumption in the European Union, where it was mainly used in the power sector. Coal consumption decreased in 2015 for the third consecutive year, renewable energy in the European Union increased by 15% (excluding hydropower). Although, in 2015, the amount of hydropower in the European Union declined by 10% due to less favourable weather conditions, the share of total renewable electricity increased by 7 percentage points to 29% of total electricity production.
Trends over the past decades
The annual growth rates of global CO2 emissions continued to decrease between 2012 and 2015, after which they have levelled out. On a global level, there are also signs of an increased decoupling of CO2 emissions and GDP growth. In 2015, global CO2 emissions no longer increased without being coupled to a global economic recession, reflecting the emission reduction efforts of the major emitting countries, in particular China. After four years of relatively low growth rates, China’s growth in energy consumption and physical industrial production has stalled over the first three quarters of 2016, while the share of renewable energy continued to increase. Thus, the slowdown of China’s CO2 emissions since 2012 reflects structural changes in the Chinese economy towards a less energy-intensive service and high value-addedmanufacturing industry, as well as towards a more low-carbon energy mix.
On a global scale, there has been a slowdown since 2012, which also reflects structural changes in the global economy, such as improvements in energy efficiency and the energy mix of the key global players. However, further mitigation of fossil-fuel use, and in particular of coal use, will be needed for large absolute decreases in global greenhouse gas emissions, which are necessary to substantially mitigate anthropogenic climate change, as was concluded in the Paris Agreement. Technically, these
reductions are still feasible, but would need to be widely implemented very soon to be on a pathway under which global warming by the end of this century would remain limited to 2 oC above preindustrial global mean temperature.
How do these CO
2trends relate to the
Paris Agreement on climate change
mitigation?
Further analysis may show the extent to which the recent national CO2 trends estimated in this report are in keeping with the total national greenhouse gas emission trends as expected from analyses of the Cancun pledges for 2020, Intended Nationally Determined Contributions (INDCs) and Nationally Determined Contributions (NDCs) under the Paris Agreement and other country pledges for 2025 or 2030. By 15 December 2015, 187 countries and the European Union had submitted their INDCs, summarising their climate-related efforts after 2020 within the context of the Paris Agreement.
ONE
Introduction
This report presents the results of a trend assessment of global carbon dioxide (CO2) emissions from fossil fuel and cement up to 2015, and updates last year’s assessment (Olivier et al., 2015). This assessment focuses on the changes in annual CO2 emissions from 2014 to 2015, and includes not only fossil-fuel combustion on which the BP (2016) reports are based, but also incorporates other relevant CO2 emissions sources, including flaring of waste gas during gas and oil production, cement clinker production and other limestone uses, feedstock and other non-energy uses of fuels, and several other small sources. The report clarifies the CO2 emission sources covered, and describes the methodology and data sources. For the years 2013 to 2015, more details are provided in Annex 1.
This assessment excludes CO2 emissions from
deforestation and logging, forest and peat fires, from the post-burn decay of remaining above-ground biomass, and from decomposition of organic carbon in drained peat soils. The latter mostly affects tropical non-OECD countries. These sources could add from 10% to 20% of CO2 to global emissions, according to different authors (Van der Werf et al., 2009; Harris et al., 2012). However, these percentages are highly uncertain and show a large annual variability. Such variability is also one of the reasons why emissions and sinks from land use, land-use change and the forestry (LULUCF) sector are kept separate when reporting under the UN Framework Convention on Climate Change (UNFCCC) and the Kyoto Protocol. This explains also that the emissions from the LULUCF sector are not included in this assessment. Information on recent emissions from forest and peat fires and post-burn emissions is being assessed by the Global Carbon Project (GCP), which has published comprehensive assessments of the global carbon budget, including all CO2 sources and sinks (GCP, 2016; Le Quéré et al., 2015).
Chapter 2 presents a summary of recent CO2 emission trends, per main country or region, including a comparison
between emissions per capita and per unit of Gross Domestic Product (GDP), and of the underlying trend in fossil-fuel use and the use of non-fossil energy such as renewable energy. For a summary of recent trends in CO2 emissions from fossil fuel production and other non-combustion sources of CO2 we refer to Annex 2. Chapter 3 focuses on the energy trends and shifts in the energy mix, with a special focus on fossil fuels, renewable energy and nuclear energy.
1.1 Methodology and data sources
used
This report assesses the trend in global CO2 emissions of fossil fuel use and industry processes but not from land-use change and forestry.
For global CO2 emissions from 1970 to 2012, we use the EDGAR 4.3.2 dataset (EC-JRC/PBL, 2016) for greenhouse gases, because it covers all countries with a detailed sectorial breakdown and consistent time series. This dataset provides greenhouse gas emissions per country for all anthropogenic sources identified by the IPCC (2006) (EC-JRC/PBL, 2016). The CO2 emissions from fuel combustion in EDGAR are based on the International Energy Agency (IEA) energy statistics for fossil fuel consumption released in 2014 (IEA, 2014). However, for China we updated the energy statistics of China with IEA (2016) data because of the recently completed important revision, in particular of coal statistics (NBS, 2015c). The core EDGAR 4.3.2 dataset on CO2 emissions was extended to 2015 using a fast-track approach. For each country, the trend from 2012 onwards has been estimated with the trend in the appropriate activity data or with the approximating trend using related statistics as the estimator.
For the fuel combustion emissions that account for about 90% of total global CO2 emissions, excluding those from forest and peat fires and related emissions, emissions per country for 2012 were divided into four main fuel types for
ONE ONE
use as trend indicators. These fuel types are coal and coal products, oil products, natural gas, and other fuels (e.g. fossil-carbon containing waste oils). For each sector, the 2013–2015 trend was based on BP fossil fuel consumption data released in June 2016 (BP, 2016). In addition, these national oil consumption data were completed with biofuel and other fossil waste fuels, and with international shipping &aviation fuel from IEA bunker statistics with the BP (2016) oil consumption trend.
For the other emissions the CO2 process emissions of each activity (production of steel and coke, of non-ferrous metals, of cement and lime) were estimated mainly with United States Geographical Survey (USGS, 2016), World Steel Association (WSA, 2016) trends. The USGS (2016) commodity statistics were also used for the trends in feedstock use and ammonia production. Only for the urea production data from IFA (2016) were used. For flaring we used the updated data of the US National Oceanic and Atmospheric Administration (NOAA, 2016b) for 2012-2014, whereas for 2015 we kept emissions equal to 2014. EDGAR 4.3.2 includes CO2 emission factors for cement production per tonne of cement produced, taking into account the decreasing share of clinker in cement. These shares have been updated from 1990 onwards and extended from 2008 to 2012 with country-specific data for all countries annually reporting their emissions inventories to the United Nation Framework Convention on Climate Change (UNFCCC) (mostly OECD countries, Eastern European countries and Russia) and six other large countries, whereas regional estimates were used for the remaining countries. This is particularly significant for
China where the clinker fraction continues to decline. In addition to cement production, EDGAR 4.3.2 also includes other non-combustion industrial processes, such as the production of lime and soda ash and carbon used in metal production. All sources of CO2 related to non-energy/feedstock uses of fossil fuels were estimated using the Tier 1 methods and data recommended by the 2006 IPCC guidelines for national greenhouse gas inventories (IPCC, 2006). Collectively, the other carbonate sources added about 30% to CO2 emissions from global cement production in 2010. These process emissions are here addressed with more details than in the other global CO2 data sets (CDIAC, GCP).
More details on the methodology and data sources are presented in Annex 1. Data quality and uncertainty in the data are discussed in Annex 3. The resulting CO2
emissions for 2012 per country and for international transport have also been spatially distributed on a 0.1o x o.1o grid using specific grid maps for various source types (e.g. locations of power plants, iron and steel plants, oil refineries, urban and rural population, oil and gas production, etc.) (see Figure 1.1). Gridded data can be used for verification, e.g. with inverse modelling.
For a comprehensiv assessment of the trends in all greenhouse gas emissions up to 2010, including CO2 from forest fires and other land-use change and the non-CO2 greenhouse gases such as methane and nitrous oxide, which contribute about one quarter to the global total CO2 eq. greenhouse gas emissions, we refer to the
Box 1.1 Major changes compared to the trend report last year
This 2015 report largely follows the structure of last year’s 2014 report. The main methodological changes are: − This year, specifically for China, we used the latest detailed energy balances for the 2000–2014 period, because these
include the detailed NBS revisions for fossil fuels as implemented by the International Energy Agency (IEA, 2016c). Last year, we estimated the changes due to the major revision by China’s National Bureau of Statistics (NBS, 2015c), notably in coal data for China, for the years 2000 to 2013. Moreover, we updated the statistics for
cement clinker production in China, through 2014, affecting the emission factor for cement production. − For gas flaring, we updated the amounts flared from 2012 to 2014, with new satellite data from NOAA (2016b),
which includes more countries than NOAA’s previous satellite data set, which covered 1994 to 2012 (NOAA, 2012b). − The main textual changes can be found in the following sections:
− We updated the group of top-25 CO2 emitting countries with a more recent ranking of both CO2 emissions and GDP (on a Purchasing Power Parity (PPP) basis). We now use the G20 (group of twenty countries including the European Union), and the group of currently 35 member countries of the Organisation for Economic Co-operation and Development (OECD), thus including newer members such as Mexico, Hungary, Czech Republic, Poland, South Korea, Chili, Slovenia, Israel, Estonia, Latvia, and the Slovak Republic.
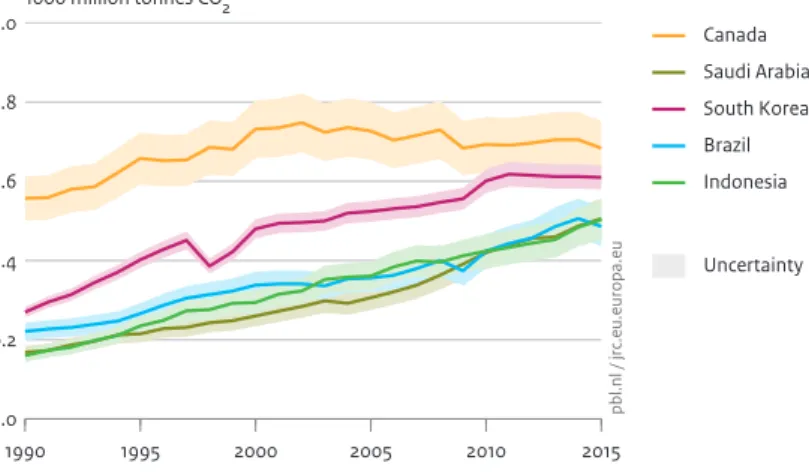
− Section 2.2, apart from the top-5 countries, now also discusses more details on the top 6 to 10 countries: South Korea, Canada, Brazil, Indonesia and Saudi Arabia.
This study provides CO2 time series for the 1990–2015 period, per country, which are also available on http://edgar.jrc.ec.europa.eu/overview.php?v=CO2ts1990-2015
ONE
Box 1.2 Why do CO
2emissions in this report differ from those in other data sets?
There are four main reasons why our CO2 emissions from fossil fuel combustion and industrial processes differ from those reported by countries or from other international data sets:
− Different activity data sources, different release dates and different sources for the conversion factors used. Each of them may have different revisions included. For example, this year we incorporated the recent major revisions of China’s fossil fuel statistics for 2000-2013, in particular coal, in our data set by using the latest IEA energy statistics (IEA, 2016c). Most of the current international datasets on energy use will not have included these revisions yet.
− Different conversion factors used (the heat content to convert e.g. from tonne to ktoe or to TJ). Sometimes, physical activities in statistics are converted to another unit for the application of preferred emission factors, for example from tonnes of coal to energy units (terajoules) for which conversion factors are established, such as TJ energy content per tonne of anthracite or per cubic metre of natural gas.
− Country-specific emission factors for key sources, versus international default factors, such as those
recommended by the IPCC. Also, countries may use default values when representative country-specific data are missing or for small sources. The IPCC guidelines recommend for fuels to use emission factors expressed per unit of energy since these have less uncertainty than factors related to physical units (such as tonnes and m3). − In cases where the fraction of fuel carbon that is not oxidised during combustion is not very small, where
representative country-specific values based on measurements are available, these fractions should be used, according to the IPCC guidelines (IPCC, 2006).
− Different definitions for specific emission sources. For fossil-fuel combustion, for example, CO2 emissions related to coal and coke inputs in blast furnaces and coke ovens and carbon losses in these processes may be partly or fully reported under industrial processes or fugitive sources or under fuel combustion.
Also, the level of detail of the methodology used can be different: detailed fossil-fuel types or only aggregated ones (e.g. coal, oil products and natural gas), corrections made for non-energy uses of fuels (e.g. natural gas for ammonia production), and fuels used for international transport.
Another example is that of CO2 emissions from the use of oil and gas for non-energy use, for example as chemical feedstock, which may be calculated with different methods and may be included under fossil-fuel combustion instead of under industrial processes. For example, BP does not make this distinction and includes these feedstock uses implicitly in their CO2 emissions. Also the U.S. EIA (Energy Information Administration) includes these emissions in fossil-fuel CO2 emissions.
Some international data sets, notably those of the EIA and BP, do not separate the use of so-called ‘bunker’ oil for international shipping and international aviation from a country’s oil consumption and report those emissions as part of total national emissions.
Differences between official national CO2 emissions are generally within 5% for OECD countries and around 10% for countries with less well-developed statistical systems (for details see Annex 3).
ONE ONE
Figure 1.1
Note: Lines across oceans and continents represent emissions from international shipping and aviation.
Source: EDGAR 4.3.2 (EC-JRC/PBL, 2016), notably for fossil-fuel combustion: IEA, 2014
Global CO2 emissions from fossil-fuel use and cement production, 2012
Fifth Assessment report of Working Group III ‘Mitigating of Climate Change’ of the IPCC (2014a) and the Emissions Gap Reports of UNEP (2014, 2015, 2016), for which data from EDGAR 4.2FT2010 and EDGAR 4.2FT2012, respectively, were provided. In addition, Part III of the IEA’s energy statistics book on CO2 emissions from fossil fuel combustion describes the greenhouse gas emissions data of EDGAR 4.2 FT2012, documented with references to data sources and methodologies (Olivier and Janssens-Maenhout, 2015).
TWO
Results
2.1 After a slowdown in growth, global
CO
2emissions stalled in 2015
The year 2015 was a historic year, which ended with the signing of the landmark Climate Change Agreement in Paris by 194 countries and the EU, at the COP21
(EC-CLIMA, 2016). In preparation of the Paris Agreement, countries submitted their Intended Nationally
Determined Contributions (‘INDCs’), outlining their post-2020 climate actions, and top emitters China and the United States set an example by effectively reducing their CO2 emissions over 2015 by 0.7% and 2.6%, respectively, compared to 2014 levels. Also, emissions in the Russian Federation and Japan decreased by 3.4% and 2.2%, respectively. However, these decreases were compensated for by increases in India and the European Union of 5.1% and 1.3%, respectively, and in a large group of almost 200 smaller countries that, together, accounted for 9% of global CO2 emissions. In 2015, this yielded a total amount in globally emitted CO2 emitted of 36.2 billion tonnes – virtually the same level as in 2014 (Figure 2.1).
The calculated trend in the global total is -0.1%. Since global population growth is 1.2% per year, stalling of global emissions means per definition a 1.2% annual decrease in global per capita CO2 emissions; 4.9 tonnes CO2/cap in 2015 and 5.0 tonnes in 2014.
Stalling of global emissions
The stalling of global emissions is no surprise, as this is in line with the slowing trend in annual emission growth over the past three years, starting from 2.0% in 2013 to 1.1% in 2014 and further down to -0.1% in 2015. A similar trend of declining growth in global emissions could also be seen from 2010 to 2012, starting from 5.7% down to 0.7%. It is debatable whether the plateaued emission level will continue and results from structural changes (Jackson et al., 2016; Qi et al., 2016; Green and Stern, 2016). In 2009, a stronger global downward trend of -1.0% was recorded, compared to 2008 levels, but this was due to the global economic downturn. Now the
stalling in emissions is not coupled with the GDP trend, as global GDP kept up with an annual growth of 3.0% in 2015 compared to 2014. A more structural change with a shift away from carbon-intensive activities, particularly in China but also in the United States, contributed
considerably to this trend. The IEA estimates that in 2015 global investment in energy efficiency increased by 6% (IEA, 2016d). For more details see Section 3.1.
Changes in fossil fuel mix and renewably energy Global primary energy consumption increased in 2015 by 1.0%, which was similar to 2014 but well below the 10-year annual average of 1.9%, even though fossil fuel prices fell in 2015 in all regions (BP, 2016). Coal
consumption, globally, decreased in 2015 by 1.8%. Apart from the recession in 2009, these global annual changes represented the lowest growth levels since 1998. Global oil and natural gas consumption increased by 1.9% and 1.7%, respectively. These shifts in energy production and consumption had major effects on the fuel mix. The shift in the fossil fuel mix from coal to oil and natural gas, in part, resulted from lower regional fuel prices. The largest decreases in coal consumption were seen in the United States and China, partly counterbalanced by increases in India and Indonesia. For oil consumption, the largest increases were in China, India and United States. The global increase in the use of natural gas was mainly due to increased consumption in the United States and the European Union, with smaller increases in Iran and China, partly compensated for by decreased natural gas use, in particular in the Russian Federation and the Ukraine, as well as in Japan and South Korea (BP, 2016). Of the non-fossil fuel energy sources, nuclear energy increased by 1.3% and hydropower by 1.0%, resulting in respective shares of 4.4% and 6.8% in global primary energy consumption and 10.7% and 16.4% in total global power generation. Considerable efforts to increase other renewable power generation, notably wind and solar energy, resulted in a 15.2% increase in 2015, for the 12th consecutive year with double-digit growth, now providing almost 6.7% of global power generation,
TWO TWO
up from 3.5% in 2010. In 2015 their share increased to 2.8% of the total primary energy consumption, a doubling since 2010 (BP, 2016).
Still, the remaining two thirds (66.2%) of global electricity are generated by fossil-fuel-fired power stations, which is a 0.9 percentage point down from 2014 and the lowest share since 2002. The share of fossil fuels in global primary energy consumption was 86% in 2015, calculated by using a substitution method for nuclear and renewable energy, assuming a 38% conversion efficiency (the average for OECD thermal power generation). 2015 by far the warmest year on record
As for the weather, the US National Oceanic and
Atmospheric Administration (NOAA) recorded 2015 as the hottest year since records began in 1880. In addition, the 16 warmest years ever recorded are in the 1998–2015 period. The year 2015 was characterised by one of the strongest El Niños in history, and with record high ocean temperatures, globally (with annually averaged ocean surface temperature around the world of 0.74 °C higher than the average over the 20th century). The global land temperature for 2015 was 1.33 oC above the 20th century average, surpassing the previous records of 2007 and 2010 by 0.25%, the largest margin by which an annual global land surface temperature has been broken (NOAA, 2016a). Most regions experienced record high temperatures. Europe experienced relatively mild winter months in 2015, but saw 3% more so-called Heating Degree Days than the very mild winter in 2014. Heating Degree Days (HDDs) are
an indicator of the demand for space heating (see Annex 4 for details) (EIA, 2016f). The United States and Russia benefited from a milder winter in 2015 than in 2014, and recorded 9% fewer HDDs that year (NOAA, 2016a). A drop in natural gas consumption can be associated with the 9% drop in demand for space heating in the United States and Russia, as well as in many other countries such as Canada, Japan and South Korea.
Changes in largest emitting countries
In summary, the six largest emitting countries/regions in 2015 were: China (with 29% share in the global total), the United States (14%), the European Union (EU-28) (10%), India (7%), the Russian Federation (5%) and Japan (3.5%) (Figure 2.2). Regional CO2 emission trends differed strongly between countries, in particular, between the top six emitting countries and the European Union, which accounted for two thirds of total global emissions. In China and the United States, emissions decreased (by 0.7% and 2.6%, respectively) after a slight increase (0.9%) in 2014, compared to 2013, whereas the European Union saw an increase (1.3%) in 2015, compared to 2014, after the large decrease in the previous year (5.4%). India’s emission growth continued, with 5.1% in 2015, compared to 2014, while emissions continued to decrease in Russia and Japan (by 3.4% and 2.2%, respectively).
Of particular importance are large countries with emerging economies, such as India, which is still characterised by relatively low per capita CO2 emissions of 1.9 tonnes CO2/cap per year (17% higher than the
Figure 2.1 1970 1975 1980 1985 1990 1995 2000 2005 2010 2015 0 10 20 30 40 1000 million tonnes CO2
Source: EDGAR v4.3.2 FT2015 (JRC/PBL 2016: IEA 2014 (suppl. with IEA 2016 for China, BP 2016, NBS 2016, USGS 2016, WSA 2016, NOAA 2016)
pb l.n l / e c. eu ro pa .e u/ jrc International transport Non-G20 Other countries Other large countries G20
Other G20 countries Other OECD countries G20 Japan
Russian Federation India
European Union (EU-28) United States China
Global CO2 emissions per region from fossil-fuel use and cement production
Note: Other OECD countries G20 include Australia, Canada, Mexico, South Korea and Turkey.
Other G20 countries include Argentina, Brazil, Indonesia, Saudi Arabia and South Africa, Turkey. Other large countries include Egypt, Iran, Kazakhstan, Malaysia, Nigeria, Taiwan, Thailand and the Ukraine.
TWO
average per capita CO2 emissions of the nearly
200 smallest and poorest countries, but still 60% below the global annual average of 4.9 tonnes CO2/cap), in combination with a large population and relatively rapidly increasing human activities (also carbon-intensive ones). If India and the European Union were to continue their average annual change (6.8% increase per year for India and a decrease of1.9% per year for the European Union (averaged rates for 2006–2015)), then India would surpass the European Union by 2020. Indonesia (currently with a share of 1.4% of the global total) showed a 4.0% increase in emissions in 2015, compared to 2014.
Coal-fired power plants cause one-third of global CO2 emissions
Recent trends in the fossil fuel mix with shifts from coal to natural gas, and vice versa, in the United States, China and Europe, are very relevant for the overall trend in CO2 emissions. IEA data for 2013 show that global coal combustion was responsible for 46% of CO2 emissions from fossil fuel combustion, with 31 percentage points emitted from coal-fired power plants. Since coal emits more CO2 per unit of energy than do oil and natural gas, many NGOs promote phasing out coal use in power generation, because of its large share in global CO2 emissions and since coal-fired power plants have long technical lifetimes of several decades. Among the top 4 emitting countries and the European Union, coal-fired power plants also have high but variable shares in national CO2 emissions: 48% for China, 31% for the United States, 28% for the European Union and 47% for India. However, the industry continues to build new coal-fired power plants, at a rapid pace, also in countries with an overcapacity. Utilisation rates decreased since 2005 in the
top 4 emitting countries and the EU-28, to around 50% to 55%, and in India to around 65%. In China, the average coal-fired power plant ran at about 49% of its capacity in 2015. Over the course of 2015, coal-fired power plant construction activities were very different in China, compared to those in the rest of the world. In China there was an increase of 21.7 GW, whereas all other countries collectively decreased construction activities by 13.7 TW. A similar difference could be observed for the pre-construction coal plant pipeline. Since 2010, new coal-fired power plants have been built in 33 countries, totalling about 473.4 TW, of which in China and India 208 TW and 102 TW, respectively. These two countries now account for 85% of all new coal-fired power plants. Other countries, each with additions of more than 1 TW in 2015, were in decreasing order: Germany, Vietnam, Indonesia, the Netherlands, Turkey, Malaysia and the Russian Federation (Shearer et al., 2016).
Structural changes towards less carbon-intensive activities in China
The main reason for the curbing of global CO2 emissions is the change in the world’s fossil-fuel use due to the structural change in the economy and in the energy mix of China. For the first time since 2000, China’s CO2 emissions
decreased by 0.7% in 2015 and its per capita CO2 emissions by 1.2%, compared to 2014. Even though this relative change seems small, the difference corresponds to the total emissions in a country such as Greece.
Several recent papers suggest coal consumption and CO2 emissions in China peaked in 2014 or 2015 (Qi et al., 2016; Korsbakken et al., 2016). The amount of Chinese CO2 emissions in this report were calculated using the full revision of China’s fuel statistics over the 2000–2014 Figure 2.2 1990 1995 2000 2005 2010 2015 0 2 4 6 8 10 12 1000 million tonnes CO2
Source: EDGAR v4.3.2 FT2015 (JRC/PBL 2016: IEA 2014 (suppl. with IEA 2016 for China, BP 2016, NBS 2016, USGS 2016, WSA 2016, NOAA 2016)
pb l.n l / jr c. eu .e ur op a. eu China United Sates European Union (EU-28) India
Russian Federation Japan
Uncertainty
TWO TWO
period (amounts consumed and the energy content) announced last year and implemented in IEA (2016c). This data set shows small decreases in coal consumption of 0.8% in 2014 and 1.5% in 2015 (in energy units). China’s CO2 emissions still increased by 2.0% in 2014, in particular due to increasing consumption of oil products and natural gas, and then decreased again by 0.7% in 2015.
Although emissions in China, are double those of the United States, the Chinese per capita CO2 emission level (7.7 tonnes CO2/cap) remains below half that in the United States (16.1 tonnes CO2/cap). Even though China’s
emissions increased extraordinarily rapidly, due to China’s fast industrialisation path during the first decade of the 21st century (on average, 10% per year between 2002 and 2011), the average annual increase over the 2012–2015 period amounted to only 3%. This – and the even
decreasing emissions in 2015 – was mainly due to a decrease in coal consumption of 1.5% (BP, 2016) and increase in the share of non-fossil fuel in primary energy consumption from 10.9% to 11.8%. The latter was achieved through substantial increases in nuclear energy (29%), hydropower (5%) and other renewable energy such as wind and solar energy (21%), in 2015, compared to 2014 levels.
Apart from the latter, China has an energy strategy aiming at reducing coal consumption and improving air quality. Among other things, it has put a cap on new coal mines and coal consumption, and has started country-wide carbon trading, initially with coal-fired power generation, encouraging hybrid and full electric cars as well as more energy-efficient cars and buildings (Adler, 2016). Moreover, China is also reducing excess capacity in industry (Xinhua, 2016).
Decreasing CO2 emissions in the United States CO2 emissions in the United States decreased considerably with 2.6%, in 2015. This mainly resulted from a 13% drop in coal consumption (BP, 2016), which in percentage was the largest annual decrease in any fossil fuel in the United States, over the past five decades. The 12% decrease in energy-related CO2 emissions during the past decade mostly occurred in the power sector, due to a shift from coal to natural gas used for electricity generation, whereas the demand for electricity has remained rather constant since 2005 (EIA, 2016c). The large number of recent closures of coal-fired power plants have mainly been due to the new air pollution standards, which came into effect in 2015. Some operators decided that retrofitting certain coal-fired plants would be too costly and, instead, opted to shut these plants down permanently. In addition, over the last decade, fuel consumption decreased in the transport sector and, to a lesser extent, also in the residential and industrial sectors, all contributing to the decrease in CO2 emissions since 2005.
In addition, focusing on the last years, while electricity consumption increased in 2013 and 2014, the demand fell in 2012 and 2015 due to relatively warm winter
temperatures. As the warmer winters also significantly decreased the consumption of natural gas for space heating, it also lowered natural gas prices. The drop in gas prices and very efficient gas-fired power plants increased the appeal of natural gas for base load power production. As a result, in 2015, for the first time ever, the total in kWhs produced by gas-fired power plants was almost equal to those produced using coal.
Figure 2.3 1990 1995 2000 2005 2010 2015 0.0 0.2 0.4 0.6 0.8 1.0 1000 million tonnes CO2
Source: EDGAR v4.3.2 FT2015 (JRC/PBL 2016: IEA 2014 (suppl. with IEA 2016 for China, BP 2016, NBS 2016, USGS 2016, WSA 2016, NOAA 2016)
pb l.n l / jr c. eu .e ur op a. eu Canada Saudi Arabia South Korea Brazil Indonesia Uncertainty
TWO
The European Union facing stagnation in emission reduction
After four years of decreasing emissions (by an average of 3.1% per year during 2011–2014), emissions in the European Union increased by 1.3% in 2015, compared to 2014 levels. Total EU emissions in 2015 reached 3.5 Gt CO2, about 50 Mt CO2 (the size of Sweden’s inventory) more than in 2014. In particular, in the southern European countries, Spain and Italy, emissions increased considerably (by 7% and 5%, respectively), mainly because of a 24% increase in coal consumption in Spain and an 8% increase in oil and natural gas consumption in Italy. In other countries, such as United Kingdom, Finland and Denmark emissions decreased between 4% and 10% in 2015, compared to 2014 levels. Renewable energy resources in the European Union were further supported and increased by 15% (excluding hydropower), yielding a share of 8.3% in primary energy consumption in 2015. Although, in 2015, the amount of hydropower in the European Union declined by 10% - mainly in Italy, Spain, France, Portugal and Romania - due to less favourable weather, the share of total renewable electricity increased by 7 percentage points to 29% of total electricity production.
Trends over the last decades
Annual growth rates of global CO2 emissions continued to decrease from 2012 until they plateaued in 2015. Globally, there are also signs of a partial decoupling between CO2 emissions and GDP, which continued to increase in 2015 at 3%. Reports of previous years in this series on trends in Global CO2 emissions (Olivier et al., 2013, 2014, 2015) suggest that the small increases in annual CO2 emissions
registered in 2012, 2013 and 2014, and currently estimated at 0.7%, 2.0% and 1.1%, could be signs of a permanent slowdown in the increase in global CO2 emissions. The 2015 stalling of global CO2 emissions confirms this and is evidence of emission levels being no longer coupled to a global economic recession. Moreover, after four years of relatively low growth rates, China’s growth in energy consumption and industrial production in the first three quarters of 2015 has been stalling under a continued increase in the share of renewable energy. Thus, it can be concluded that the slowdown of China’s CO2 emissions since 2012 has not been a temporary effect, but a more permanent trend, reflecting structural changes in the Chinese economy towards a less energy-intensive service and high value-added manufacturing industry, as well as a more low-carbon energy mix.
On a global scale, the slowdown since 2012 is also not a temporary, short-term effect, but has so far already lasted for four years. It may also reflect structural changes in the global economy, such as improvements in energy efficiency and the energy mix of the key global players. However, further mitigation of fossil-fuel use, and in particular of coal use, will be needed for large absolute decreases in global greenhouse gas emissions, which will be necessary to substantially mitigate anthropogenic climate change, as was concluded by both the IPCC (2014a,b) and the Paris Agreement (UNFCCC, 2015) (see Boxes 2.1 and 2.2). Technically, these reductions are still feasible (IPCC, 2014b; UNEP, 2014), but would need to be widely implemented very soon, if future global
greenhouse gas emission levels need to remain
compatible with pathways that could limit global warming to 2 oC, or even 1.5 oC, by the end of the 21st century,
Figure 2.4 1990 1995 2000 2005 2010 2015 0 5 10 15 20 25
tonnes CO2 per capita
Source: EDGAR v4.3.2 FT2015 (JRC/PBL 2016: IEA 2014 (suppl. with IEA 2016 for China, BP 2016, NBS 2016); UNPD 2015 (WPP, Rev. 2015)
pb l.n l / jr c. eu .e ur op a. eu United States Russian Federation Japan China
European Union (EU-28) India
Global average Uncertainty
CO2 emissions per capita from fossil-fuel use and cement production in the top 5 emitting countries and European Union
TWO TWO
compared to the pre-industrial global mean temperature (Rogelj et al., 2016; Van Vuuren et al., 2016).
Uncertainties in emissions
It must be noted that all national emission inventories are subject to uncertainty. The level of uncertainty in national CO2 emissions varies between countries. In this report, they range from 5% to 10% (95% confidence interval), with the largest uncertainties concerning the data on countries with rapidly changing or emerging economies, such as Russian Federation data on the early 1990s and data on China since the late 1990s, based on Marland et al. (1999), Tu (2011), Andres et al. (2012), Guan et al. (2012), Liu et al. (2015) and Korsbakken et al. (2016). Moreover, in general, the most recent statistics are also somewhat more uncertain for every country, since first published statistics are often subject to subsequent revisions when more detailed data become available (Olivier and Peters, 2002). For China, Wang and Chandler (2011) give a good description of the revision process for energy and GDP statistics, also in response to the two National Economic Censuses. Korsbakken et al. (2016) built on and extended the study by Wang and Chandler (2011) and compared the impact of various revisions of coal statistics by the NBS, following each of the three National Economic Censuses. For China, the Russian Federation and most other
non-OECD countries, we assumed 10% uncertainty, whereas for the European Union, the United States, Japan India and other OECD countries, a 5% uncertainty was assumed. Our preliminary estimate of total global CO2 emissions in 2015 is believed to have an uncertainty of about 5%, and our estimated emission decrease of 0.1% may be accurate to within ±0.5%. For more details, see Annex 3.
Importance of other sources of greenhouse gas emissions for mitigating climate change
This report assesses the trend in global CO2 emissions from fossil-fuel use and industrial processes. For a comprehensive assessment of the trends in all
greenhouse gas emissions up to 2010, including CO2 from forest fires and other land-use changes, and the non-CO2 greenhouse gases such as methane and nitrous oxide (which account for about one quarter of the global total in CO2 eq. greenhouse gas emissions), we refer to the Fifth Assessment Report (AR5) of the IPCC Working Group III ‘Mitigation of Climate Change’ (IPCC, 2014a).
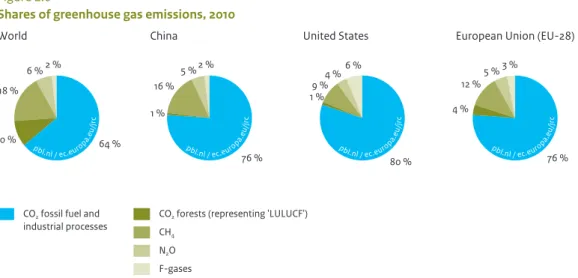
Although CO2 emissions from fossil-fuel and carbonate use are key to greenhouse gas mitigation, other sources also contribute significantly, as shown in Figure 2.4. CO2 emissions as discussed in this report cover about two-thirds of global total greenhouse gas emissions.
Box 2.1 Linking economic trends with CO
2emissions, GHG trends, atmospheric CO
2concentrations
and global warming
Gross Domestic product (GDP) can be considered the total value added achieved by all economic sectors, which greatly differ in terms of energy intensity, such as the power sector, energy-intensive basic materials industry, other industries, service sectors and agriculture. Moreover, household energy consumption for heating, electrical appliances and private transport is not directly coupled to GDP. Annual growth rates often greatly vary between sectors. Therefore, annual trends in GDP and total energy consumption are generally only very weakly related. Since the energy mix generally varies per sector and country, the link between global GDP and global CO2 emissions is even weaker.
The relationship between the increase in annual global CO2 emissions and the annual increase in atmospheric CO2 concentrations (not included in this study) is also rather weak. This is because the net annual increase in CO2 concentrations is affected by the large inter-annual changes in CO2 emissions from forest fires and deforestation and in the amount of CO2 absorbed by vegetation, in particular by growing forests, which vary substantially depending on temperature and the amount of sunshine and precipitation. Moreover, the large absorption of atmospheric CO2 by the oceans also varies over time. These changes are larger in ‘El Nino years’, such as 2015.
The IPCC’s Fifth Assessment Report (IPCC, 2014a,b) concluded that the effects of anthropogenic greenhouse gas emissions have been detected throughout the climate system and are extremely likely to have been the dominant cause of the observed warming since the mid-20th century. Cumulative emissions of carbon dioxide will largely determine global mean surface warming by the late 21st century and beyond. It would be possible, using a wide array of technological measures and changes in behaviour, to limit the increase in global mean temperature to 2 °C above pre-industrial levels. There are multiple mitigation efforts that in addition to those in place today required to reduce CO2 emissions to near zero and so limit the increase in global mean temperature to 2 °C above pre-industrial levels.
TWO
However, for individual countries their share can vary between more than 90% in most OECD countries, whereas it varies more widely in non-OECD countries (even lower than 10% in some African, Latin American and Asian countries). In many non-OECD countries deforestation emissions and emissions from rice production can be major emission sources. More information on recent trends in other sources can be found, for example, in national reports to the UNFCCC and in the EDGAR v4.3.2 dataset (EC-JRC/PBL, 2016), available at country and source level. In this report, CO2 emissions are provided for fossil fuel + industrial processes (‘FF+IP emissions’), including some small other CO2 sources (in Figure 2.4 shown in blue). Other sources in these pie charts: CO2 emissions from forest fires and deforestation (‘Forests’) (shown in red) (excluding CO2 sinks/removals of mainly living carbon stock change), methane (CH4), nitrous oxide (N2O) and the F-gases HFCs, PFCs, and SF6 as shares in total greenhouse gas emissions (using GWP-100 values from the Fourth IPCC Assessment Report). The source used for these other emission sources is EDGAR v4.2FT2010 (PBL/EC-JRC, 2012).
How do these CO2 trends relate to the Paris Agreement on climate change mitigation?
Further analysis may show the extent to which the recent national CO2 trends estimated in this report are in keeping with the total national greenhouse gas emission trends as expected from analyses of the Cancun pledges for 2020,
Intended Nationally Determined Contributions (INDCs) and
Nationally Determined Contributions (NDCs) under the Paris Agreement and other country pledges for 2025 or 2030. By 15 December 2015, 187 countries and the European Union had submitted their INDCs, summarising their climate-related actions after 2020 within the context of the Paris Agreement.
Den Elzen et al. (2016) assessed the mitigation policies described in the INDCs of 105 countries (covering
approximately 91% of global greenhouse gas emissions in 2012), with a special focus on the G20 economies. Their analysis included all greenhouse gases and all anthropogenic emissions, including CO2 emissions from forest fires and other land-use change and non-CO2 greenhouse gases. They estimated the required reduction effort by comparing the greenhouse gas emission targets implied in the INDCs against the projected levels resulting from current mitigation policies. Despite these
reductions, the global and G20 emission level is still projected to be higher by 2030 than it was in 2010. UNEP will also update their Emissions Gap Report (UNEP, 2016). The assessment on the 105 countries is also summarised in the interactive PBL Climate Pledge INDC tool, in which, per country, the trend in total greenhouse gas emissions since 1990 is shown, and the impact of aggregated emission reductions compared to business-as-usual and current policies scenarios, assuming that INDCs will be fully achieved (PBL, 2015). In the same way, the trend in global CO2 emissions as presented in this report is also summarised in another infographic (PBL, 2016).
In a recent article in Nature, Rogelj et al. (2016) assess the effect of current INDCs on reducing aggregate greenhouse gas emissions, their implications for achieving the temperature objective of the Paris Agreement (holding global warming to well below 2 oC and to ‘pursue efforts’ to limit it to 1.5 oC), and potential options for
overachievement. From a different angle, Van Vuuren et al. (2016) provide insights into how different carbon budgets relate to typical values for the peak year of global emissions, the decarbonisation rate and the deployment Figure 2.5 1990 1995 2000 2005 2010 2015 0 5 10 15 20 25 30
tonnes CO2 per capita
Source: EDGAR v4.3.2 FT2015 (JRC/PBL 2016: IEA 2014 (suppl. with IEA 2016 for China, BP 2016, NBS 2016); UNPD 2015 (WPP, Rev. 2015)
pb l.n l / jr c. eu .e ur op a. eu Canada Saudi Arabia South Korea Brazil Indonesia G20 Global average Uncertainty
TWO TWO
of low-carbon technology, using the recently compiled IPCC scenario database, and discuss how these vary as a function of non-CO2 forcing, energy use and policy delay. The INDCs do not always cover all sectors and all greenhouse gases. In order to assess their contribution to the total trend in greenhouse gas emissions, it is essential to comprehensively monitor total national emissions in order to assess the effectiveness of emission reduction measures. Such a monitoring system must have a measurable and verifiable structure, and be compatible with an international data assimilation system that uses atmospheric measurements of greenhouse gases.
2.2 Different trends in the largest
emitting countries and regions
2.2.1 China
China’s CO2 emissions, in 2015, decreased by about 0.7%, compared to 2014. This was mainly due to a 1.5% decline in coal consumption, partly compensated for by increases in oil consumption of 6.3% and natural gas of 4.7% (all percentages in energy units, e.g. in PJ) (BP, 2016). Coal is
the dominant fossil fuel in the non-transport sectors: power generation, industry, residential and services (Table 2.1) (IEA, 2015b, 2016c).
China’s CO2 emissions from fossil fuel combustion, which account for about 85% of total national CO2 emissions, originated in 2013 for 83% from coal, 14% from oil products and 3% from natural gas (Table 2.4). Although the shares of oil and natural gas are on the rise, the reliance of China on coal is one of the highest of all countries. To calculate the CO2 emissions for China from all fossil-fuel-related activities, we used IEA’s revised energy balance statistics on China (TJ with fuel consumed in each sector) for the 1990–2014 period (IEA, 2016c), which includes all detailed revisions published in May 2015 by the National Bureau of Statistics of China (NBS) for the 2000–2013 period on an aggregate level only (NBS, 2015c). For more information on how the IEA included the revised detailed energy balances of NBS, see IEA (IEA, 2016f). The very large share of coal combustion emissions in the national total was due to the large amount of coal used in the manufacturing industry (28% of the national total), whereas coal-fired power generation accounted for 48% of the national total (see Table 2.4).
Box 2.2 Key elements on emissions under the Paris Agreement (UNFCCC, 2015; EC-CLIMA, 2016)
The Paris Agreement, which was adopted on 12 December 2015, is a global milestone for enhancing collective action and accelerating the global transformation to a low-carbon and climate-resilient society. The Paris Agreement entered into force in October 2016, after having been ratified by 55 countries, and accounts for at least 55% of global emissions.
The Paris Agreement includes both mitigation and adaptation actions and the countries agreed, among other things, on the following key elements:
On reducing global emissions:
− The target to keep the global average temperature well below 2 °C above pre-industrial levels;
− To pursue efforts to limit the temperature increase to 1.5 °C above pre-industrial levels, since this would significantly reduce risks and the impacts of climate change;
− The need for global emissions to peak as soon as possible, recognising that this will take longer for developing countries;
− To undertake rapid reductions thereafter, in accordance with best available science. On transparency, NDCs and global stock-take:
− Countries shall submit national climate action plans (Nationally Determined Contributions, NDCs) as contributions to the global response to climate change;
− Each successive NDC will represent a progression beyond the then current NDC and reflect its highest possible ambition;
− Countries shall report to each other and the public on how well they are doing on the implementation of their targets;
− Countries shall track their progress towards the long-term goal, using a robust transparency and accountability system;
TWO
Of the remaining 15% in CO2 emissions, 9% stemmed from cement clinker production and other carbonate consumption, 4% from other non-combustion processes in the manufacturing industry, such as the production of crude steel and chemicals, and the remaining 2% from cokes production, gas flaring and such. (EDGAR v4.3.2, EC-JRC/PBL, 2016). CO2 emissions from cement clinker production decreased by 4.5% in 2015, whereas total CO2 emissions from, for example, the global production of steel and chemicals, remained constant in 2015.
Table 2.1 shows that the annual growth in coal production (in tonnes and in PJ), thermal power production (almost all from coal) and cement and steel production all slowed down since 2012, compared to the growth levels in the previous decade. This is in line with the lower annual increases in Gross Domestic Product (GDP) over the past four years. In fact, several of the physical indicators – for coal, thermal power, cement and steel – showed negative growth in 2015. Coal production, in tonnes, already showed a negative growth rate in 2014. Many of these changes appear to continue into 2016, as the 6 and 8 month statistics show.
With 10.7 billion tonnes in CO2 emissions in 2015, China is by far the largest CO2 emitting country, with a share in total global CO2 emissions of almost 30%, followed by the United States, with 14% and the European Union with almost 10%. China’s share in total global emissions was estimated at 15% in 2001, and the country surpassed the United States in 2005 as the largest emitting country
(IEA, 2014; IEA, 2016c). This high ranking is mainly due to the size of its population and current economy (see Figures 2.3 and 2.4), but also because of the large share of coal in its energy mix, as it is has far greater coal reserves than those of oil and gas.
Moreover, after China became a member of the World Trade Organization (WTO) in 2001, its economy started to expand very rapidly. Although the share of value added (VA) of total industry in GDP decreased from 45% in 2001 to 41% in 2015, the share of its manufacturing industry in GDP remained at about 30% (World Bank, 2016), which together with South Korea’s share of 29%, is the highest among the G20 countries. In contrast, most OECD countries of the G20 have manufacturing shares in the range of 10% to 15%, with the exception of Germany with 23% and South Korea with 29%. Also most non-OECD countries of the G20 have manufacturing industry shares of less than 20% (apart from Indonesia with 21%): India (16%), Russia (6%), Turkey (18%), Brazil (11%). The share of services in total GDP increased from 40% in 2000, first slowly but in the last four years rapidly, to 50% in 2015. India and Saudi Arabia have similar service sector shares, whereas most OECD countries of the G20 have shares ranging from 70% to 75%. Although the share in GDP of China’s manufacturing industry did not change much, the amount of value added doubled from 2002 to 2010 and in 2015 it was even 2.5 times the value of 2002 (World Bank, 2016). In comparison, in 2002, the value added of China’s manufacturing industry was only half that of the United States and about 40% that of the European Union. Figure 2.6
2 % 6 % 18 %
10 % 64 %
CO2 fossil fuel and
industrial processes
CO2 forests (representing 'LULUCF')
CH4
N2O
F-gases
World
Shares of greenhouse gas emissions, 2010
2 % 5 % 16 % 1 % 76 % China 6 % 4 % 9 % 1 % 80 % United States 3 % 5 % 12 % 4 % 76 %
European Union (EU-28)
pbl.nl / ec.europa.e u/jr c pbl.nl / ec.europa .eu/ jrc pbl.nl / ec.europa .eu/ jrc pbl.nl / ec.europa .eu/ jrc
Source: CO2 fossil fuel and industrial processes: EDGAR 4.3.2 (JRC/PB, 2016, notably IEA, 2014); others: EDGAR 4.2 FT2010 (JRC/PBL 2012)
Note: storage/removal of emissions (also known as ‘sinks’) are not shown here.
This figure differs from CO2 emissions in this report: it includes CO2 emissions from forest fires and deforestation (‘Forests’) (shown in red), but excludes CO2 sinks/removals of mainly living carbon stock change. For the latter see GCP (2016). Moreover, 2010 was chosen as this is the most recent year for which EDGAR data on non-CO2 sources are presently available.
TWO TWO
In 2014, China’s value added was on a par with that of the European Union, and 30% larger than that of the United States. Apart from the domestic demand for consumer goods, the products of China’s industrialisation served the rapid development of buildings and other domestic infrastructure as well as the export of goods.
With 7.7 tonnes of CO2 per person in 2015, the per capita emissions were somewhat (13%) higher than the EU-28 average and at about the same level of per capita emissions of Poland and South Africa (see Table 2.8). When comparing CO2 emissions per USD of GDP (in PPP units), although decreasing over time, in 2015, China still had one of highest values among the G20 countries, about 13% higher than that of the Russian Federation and 7% higher than South Africa. However, the emissions per unit of GDP at PPP basis of China are decreasing faster than in other countries (see Section 2.3 and Figures 2.13 and 2.14). After many years of annual increases in CO2 emissions, on average, of 9.9% in the 2002–2011 period, the last four years showed a slowing down of annual emission increases, with consecutive growth rates of 2.1% in 2012,
4.4% in 2013, 2.0% in 2014 and a decrease of 0.7% in 2015 (IEA, 2016c; BP, 2016). The decrease in the annual trend of 2015 is unprecedented and is a sign of decoupling from economic growth. Annual GDP growth was also slowing down, but remained still positive (from 10% per year before 2012 to about 7% per year in 2013–2015). A key factor for this change in CO2 emissions was the decline in coal consumption (in energy units) in 2015 of 1.5%, as estimated by BP (2016) based on data from NBS China. Although the Chinese energy statistics are more uncertain compared to those of most OECD countries, the slow-down and shift from manufacturing to a more service-oriented economy is corroborated by the recent trends in other indicators, such as electricity generation, thermal power generation, cement and steel production, and aluminium production (see Table 2.2). For a more detailed analysis of these phenomena, see Qi et al. (2016) and Green and Stern (2016).
This emission decrease of 0.7% in 2015 is consistent with the decrease of 2.7% in fossil-fuel fired power generation (predominantly coal-fired power plants) reported by the National Bureau of Statistics of China (NBS, 2016b). Table 2.1
Annual growth rates in 2012 to 2015, according to selected energy trend indicators in China, compared to the previous decade and the first part of 2016 (%)
Indicator Average annual
growth rate 2002–2011 (±1SD*) 2012** 2013 2014 2015 2016 H1 2016 M1-8 CO2 emissions 9.9%±4.1% 2.1 4.4 2.0 -0.7 - -GDP 10.4%±1.8% 7.6 7.6 7.2 6.8 6.7 -VA Industry 11.7%±1.9% 8.2 7.9 7.3 6.0 - -VA Services 11.2%±2.2% 8.0 8.3 7.8 8.3 -
-Coal production (tonnes) 9.9%±4.2% 4.8 0.7 -2.5 -3.2 -5.8 -10.2
Thermal power production 12.7%±5.1% 1.5 9.1 2.7 -2.7 -3.1 -0.5
Coal consumption (PJ) 10.0%±5.8% 1.4 2.0 0.1 -1.5 -
-Oil product consumption (PJ) 7.1%±5.1% 5.1 4.3 2.2 6.3 -
-Natural gas consumption (PJ) 17.1%±6.1% 8.4 14.5 9.9 4.7 -
-Power consumption (PJ) 12.3%±3.3% 5.8 8.9 6.7 0.3 0.6 3.0
Cement production (tonnes) 12.3%±3.8% 5.3 9.3 2.3 -5.3 -5.3 2.5
Steel production (tonnes) 16.5%±7.4% 4.6 8.7 5.6 -2.3 -1.3 -0.1
Aluminium production (tonnes) 19.3%±11/2% 12.2 8.9 10.3 11.8 -1.7 -1.8
* Standard deviation
** Leap year, so 0.3% higher than normal
H1 First half year of 2016; compared with H1 of 2015 M1-8 First eight months of 2016; compared with M1 to M8 of 2015 Sources:
2002-2015: GDP (constant prices), VA (value added) (World Bank, 2016);
2002-2014: production of coal. thermal power, cement, steel and aluminium production (NBS, 2016b); electricity consumption (NBS, 016c); consumption of coal, oil, gas (NBS, 2016d);
2015: production of coal, thermal power, cement, steel and aluminium (NBS, 2016a); 2016 H1: NBS (2016e), except for steel (WSA, 2016) and aluminium (IAI (2016); 2016M1-8: NBS (2016f), except for steel (WSA, 2016) and for aluminium (IAI (2016).