Abstract
Historical trends and levels of nitrogen (N) budgets and emissions to air and water in the European Union and the United States are markedly different. Agro-environmental policy approaches also differ, with emphasis on voluntary or incentive-based schemes in the United States versus a more regulatory approach in the European Union. This paper explores the implications of these differences for attaining long-term policy targets for air and water quality. Nutrient surplus problems were more severe in the European Union than in the United States during the 1970s and 1980s. The EU Nitrates and National Emission Ceilings directives contributed to decreases in fertilizer use, N surplus, and ammonia (NH3) emissions, whereas in the United States they stabilized, although NH3 emissions are still increasing. These differences were analyzed using statistical data for 1900–2005 and the global IMAGE model. IMAGE could reproduce NH3 emissions and soil N surpluses at different scales (European Union and United States, country and state) and N loads in the Rhine and Mississippi. The regulation-driven changes during the past 25 yr in the European Union have reduced public concerns and have brought agricultural N loads to the aquatic environment closer to US levels. Despite differences in agro-environmental policies and agricultural structure (more N-fixing soybean and more spatially separated feed and livestock production in the United States than in the European Union), current N use efficiency in US and EU crop production is similar. IMAGE projections for the IAASTD-baseline scenario indicate that N loading to the environment in 2050 will be similar to current levels. In the United States, environmental N loads will remain substantially smaller than in the European Union, whereas agricultural production in 2050 in the United States will increase by 30% relative to 2005, as compared with an increase of 8% in the European Union. However, in the United States, even rigorous mitigation with maximum recycling of manure N and a 25% reduction in fertilizer use will not achieve the policy target to halve the N export to the Gulf of Mexico.
Losses of Ammonia and Nitrate from Agriculture and Their Effect
on Nitrogen Recovery in the European Union and the United States
between 1900 and 2050
Hans J. M. van Grinsven,* Lex Bouwman, Kenneth G. Cassman, Harold M. van Es, Michelle L. McCrackin, and Arthur H. W. Beusen
I
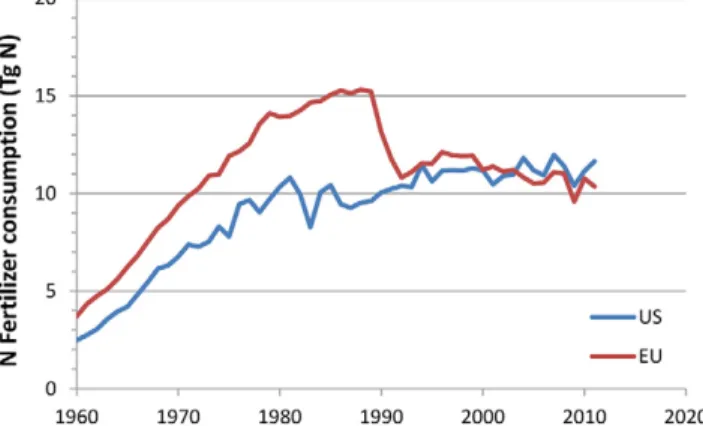
ncreasing agricultural production while reducing nitro-gen (N) losses to the environment is a major challenge for the European Union and the United States. Increasing crop N use efficiency can reduce N losses. Increasing crop yield per hectare is of paramount importance to compensate for trans-formation of agricultural land to urban use and infrastructure and to meet the increasing demand for agricultural products by a growing and more affluent world population. There are many parallels between the European Union and the United States regarding the development of the agro-food sector and associ-ated livestock, fertilizer, and environmental issues since 1950. There are also some marked differences. For example, N fertil-izer consumption in the European Union significantly dropped in the late 1980s and continued to decrease after that, whereas consumption in the United States has remained fairly constant over the same period (Fig. 1).There are several reasons why patterns of consumption differ between the United States and the European Union. First, after the breakup of the Soviet Union in 1991, the transition of a centrally planned system of large collective state farms to a market-based system in Eastern European countries ended subsidies for the purchase of fertilizer. Second, for the Western countries the MacSharry reform in 1992 of the EU Common Agricultural Policy cut commodity support for cereal production and introduced mandatory land set-asides, which reduced fertilizer demand (Stouman-Jensen et al., 2011). Third, regulatory approaches to address nitrate (NO3−) pollution
from agriculture in the 1970s differed substantially between the United States and Europe. Whereas the European Union imposed strict regulations on N use in agriculture, the United States relied mostly on voluntary or incentive schemes. At issue is whether the difference in N fertilizer consumption between
Abbreviations: CAFO, concentrated animal feeding operation; FUE, fertilizer use efficiency; IMAGE, Integrated Model to Assess the Global Environment; IPNI, International Plant Nutrition Institute; NEC, European Union National Emission Ceilings Directive; NiD, Nitrates Directive; REN, nitrogen recovery efficiency.
H.J.M van Grinsven, A.F. Bouwman, and A.H.W. Beusen, PBL Netherlands Environmental Assessment Agency, PO box 303, 3720AH, Bilthoven, The Netherlands; K.G. Cassman, Dep. of Agronomy and Horticulture, Univ. of Nebraska, Lincoln, NE 68583-0915; H.M. van Es, Dep. of Crop and Soil Sciences, Cornell Univ., 1005 Bradfield Hall, Ithaca, NY 14853-1901; M.L. McCrackin, Baltic Sea Centre, Stockholm University, 106 91 Stockholm, Sweden. Assigned to Associate Editor Eric Davidson.
Copyright © American Society of Agronomy, Crop Science Society of America, and Soil Science Society of America. 5585 Guilford Rd., Madison, WI 53711 USA. All rights reserved. No part of this periodical may be reproduced or transmitted in any form or by any means, electronic or mechanical, including photocopying, recording, or any information storage and retrieval system, without permission in writing from the publisher.
J. Environ. Qual.
doi:10.2134/jeq2014.03.0102
Supplemental material is available online for this article. Freely available online through the open-access option. Received 4 Mar. 2014.
Accepted 17 Nov. 2014.
*Corresponding author (hans.vangrinsven@pbl.nl).
Journal of Environmental Quality
IMPROVING NITROGEN USE EFFICIENCY IN CROP AND LIVESTOCK PRODUCTION SYSTEMS
SPECIAL SECTION
the United States and the European Union (Fig. 1) resulted from different N policy approaches or other factors of equal or greater importance.
European Union Policies
In 2012 the EU Common Agricultural Policy budget was 56 billion euro, of which 41 billion euro was decoupled direct payments to farmers (not related to production but to land area), 12 billion euro was for rural development, and the remainder was used for export subsidies and market support (European Parliament, 2014).
Environmental policies for nitrogen in the European Union are mostly established by means of directives (Oenema et al., 2011). These impose environmental objectives to be achieved by the Member States and provide flexibility to meet them (e.g., regarding timing, monitoring, and enforcement of measures). Nitrogen loss from agriculture is mostly in the form of diffuse emissions of ammonia (NH3) and nitrous oxide (N2O) to air and of NO3− to groundwater and surface water. Pollution of water
bodies by NO3− is regulated by the Nitrates Directive (NiD)
established in 1991 and which has the aim of reducing water pollution caused or induced by NO3− from agricultural sources.
The NiD is the most important EU regulation for reducing the environmental impacts of fertilizer and manure (van Grinsven et al., 2012) and for increasing N use efficiency, defined here as the N recovery efficiency (REN: the ratio of N removal over N input). The NiD restricts the use of fertilizer and manure in situations with a high risk of leaching and runoff, and it sets limits to the use of N in manure per hectare of agricultural land. Furthermore, it promotes the concept of balanced fertilization, where inputs of N and P are in balance with plant demand and inevitable nutrient losses.
Two other important EU directives to protect aquatic ecosystems against eutrophication are the Water Framework Directive (established in 2000) and the Marine Strategy Framework Directive (established in 2008), which apply to all sources of nutrients (Oenema et al., 2011). The focus of these directives is to maintain or establish the ecological integrity of aquatic ecosystems without imposing direct restrictions on the use or losses of N from agricultural sources. In addition, there are multilateral agreements to protect the marine environment (Oenema et al., 2011) of, among others, the Northeast Atlantic (OSPAR Convention; established in 1992) and the Baltic Sea
(HELCOM Convention; established in 2000). Protection strategies include targets and programs to reduce emissions of N and phosphorus (P). For OSPAR (2014), this target is a reduction of N and P loadings by 50% relative to 1985 levels; for HELCOM (2014), the targets are 13 and 41% reductions relative to 1997–2003 inputs for N and P, respectively.
Emissions of NH3 are regulated by the EU National Emission
Ceilings Directive (NEC; established in 2001) with the purpose of protecting the environment and human health against risks from acidification, eutrophication, and ground-level ozone contamination of air quality (Oenema et al., 2011). The current national ceilings of NH3 are a result of political negotiation
rather than being derived from the critical N deposition loads for ecosystems. Total emissions by the European Union in 2010 were 3.6 Tg NH3, which is 0.7 Tg below the policy ceiling of 4.3
Tg NH3.
Although generally applied across the entire European Union, the NEC and NiD effectively focus on concerns in the northwestern region where highly intensive livestock-based agriculture dominates. European Union policies currently minimally address concerns in other regions where loss and deposition of nutrients also occur through erosion.
More details on EU policies are provided in the supplemental material.
United States Policies
The history of the US Farm Bill goes back to the 1920s with the Grain Futures Act that regulated trade in cereals. The 2014 Farm Bill includes a subsidy of US$6.1 billion per year for commodity support, US$9.8 billion for crop insurance and US$7.3 billion for conservation (USDA, 2014b). Efforts related to improve the use of N on US farms occur through voluntary adoption and incentives payments, starting in the late 1980s.
The principal federal regulatory authority pertaining to N is derived from the 1970 Clean Air Act, the 1972 Clean Water Act, and the 1974 Safe Drinking Water Act and subsequent amendments. The USEPA sets regional standards for pollutants that have detrimental effects on human health and the environment. The USEPA sets these standards for N when there is adequate scientific evidence to do so, but enforcement occurs at the state level (USEPA, 2011).
Recent national assessments have found that 45% of rivers and streams, 46% of lakes, and 70% of estuaries in the United States have been degraded by excess nutrients (Bricker et al., 2007; USEPA, 2009a; USEPA, 2013a), often with a large (20– 70%) influence of agricultural sources (Alexander et al., 2008). Efforts to adopt nutrient water quality standards have progressed slowly, and half of the US states have no numeric nutrient criteria (USEPA, 2009b). There are also regional policies to reduce N pollution of marine systems, such as the Gulf Hypoxia Action Plan, in which the 2008 goal is a 45% reduction in riverine N and P load through voluntary adoption of best management practices (Mississippi River/Gulf of Mexico Watershed Nutrient Task Force, 2008).
Ammonia and ammonium are not regulated by the Clean Air Act. Ammonia is considered in concentrated animal feeding operation (CAFO) guidelines as a water quality issue in effluent. As a result, some manure management systems in CAFOs enhance NH3 volatilization to lower the N content of manure.
Fig. 1. Nitrogen fertilizer consumption in the United States and the European Union (Fertilizers Europe, 2012; USDA, 2014a).
www.agronomy.org • www.crops.org • www.soils.org
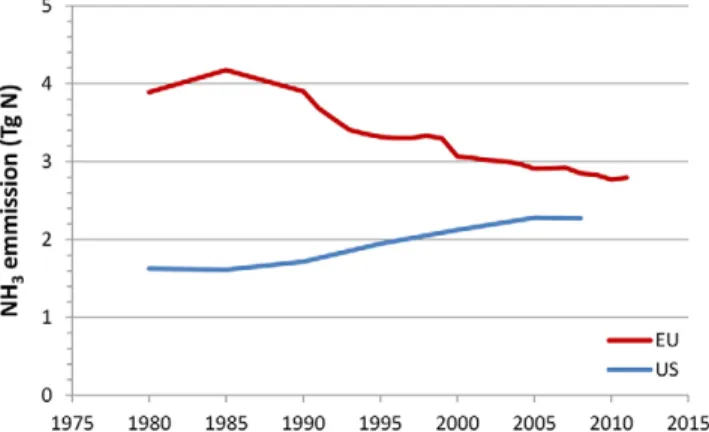
Between 1990 and 2012, emissions of NH3 from agricultural
sources in the European Union have decreased, whereas those in the United States have increased (Fig. 2), which in part reflects the different policy approaches.
More details on US policies are provided in the supplemental material.
Objective and Approach
There are marked differences in current trends in fertilizer use and NH3 emission and the policy approaches in the United
States and the European Union. A relevant question is whether these differences have implications for attaining long-term policy targets for air and water quality. To answer this question, we analyze trends of N use, crop yield, REN, and emission between
1900 and 2010 in the context of differences in climate, soils, crops, production practices, and policies. For this we apply and validate the global model IMAGE (Integrated Model to Assess the Global Environment) (Stehfest et al., 2014). Next we use IMAGE to explore the effects of a 2050 scenario of food demand and agricultural production on the N cycle and to analyze options to increase REN, building on Bouwman et al. (2013), focusing on
improved management of synthetic fertilizers and manures to reduce N losses from agriculture (e.g., by implementing the “4R” concept of right time, rate, form, and placement of N inputs) (Davidson et al., 2012).
Materials and Methods
IMAGE Model
We used the nutrient budget and emission module (Supplemental Fig. S2) of the IMAGE integrated global assessment model (Supplemental Fig. S1) to run scenarios to increase the REN and reduce N losses. The IMAGE framework (Supplemental Fig. S1) analyzes current global environmental issues and sustainability challenges, such as climate change, land use change, biodiversity loss, modified nutrient cycles, and water scarcity (Stehfest et al., 2014), by modeling the key processes in the interaction of human development and the natural environment. Concepts and applications of the IMAGE model haven been extensively published in peer-reviewed papers since the 1980s. Integrated assessment models like IMAGE draw on functional relationships between activities (e.g., the provision of food, water, and energy) and the associated impacts. Using spatially explicit integrated assessment models for global or regional scenario studies into the environmental effects of changes of agriculture production and practices are more internally consistent and can be more informative than when using dedicated models. Integrated assessment models allow incorporation of the broader socio-economic and bio-physical context of scenarios and include key feedback and feed-forward mechanisms. Examples include the interaction of population and diet with demand for agricultural products or of climate change with agricultural productivity. IMAGE application for this study focuses on the impact of food provision on the N cycle in the past (1900–2005) and future (2050). IMAGE is a spatially explicit global model (0.5° resolution, roughly equivalent to 50 × 50 km2) (Bouwman et al., 2006). Basic input data regarding land
use, crop type and yields, and fertilizer consumption are from FAO statistics combined with national census data (Bouwman
et al., 2013). For US states, we obtained state-specific data for synthetic fertilizer use from AAPFCO/TFI (2006). For further details, see the supplemental material and the IMAGE website (http://themasites.pbl.nl/models/image/index.php).
Representative empirical data on the use of fertilizer and particularly of manure in arable agriculture are scarce (Dobermann and Cassman, 2005). Therefore, schemes have been developed for N-balance models to allocate manure to various land use types. In the United States, IMAGE distributes livestock production over mixed, landless, and pastoral systems. Roughly 12% of beef cattle are raised in pastoral (range) systems, with exceptions for some US states. In the United States, rangeland constitutes more than 40% of total agricultural grassland. In Europe this share is about 1%, and livestock production on these unfertilized pastoral systems is negligible. Animal manure production is estimated from numbers of animals and excretion rates (Table 1). For each animal category, the amount of manure that is not recycled to agricultural land is estimated. That includes, for example, part of the manure that is stored in lagoons in the United States. The fraction of the manure for mixed/landless systems that is not available for recycling is quantified by state (USEPA, 2006). For pastoral systems, recycling of manure N is close to 100%. The fractions of manure deposited in meadows are available by state and animal category for mixed and landless systems. About 20% of the manure N in the animal houses and storage systems is lost to the atmosphere as NH3. The remaining manure N is applied to cropland (50%) and grassland (50%).
Removal of N is obtained from the N content of the harvested parts and has been described elsewhere (Bouwman et al., 2005). The country or regional estimates are distributed over states and countries on the basis of the projections of FAO for 2030 (Bruinsma, 2003) for European countries and on the basis
Fig. 2. Trend of ammonia emission from agricultural sector in the United States (EDGAR database) and the European Union (EMEP database).
Table 1. Nitrogen excretion rates in the United States and Europe in the IMAGE baseline scenario.
Category United States Europe
——— kg N per animal ———
Beef cattle 60 50
Dairy cattle 130 100
Swine 11 11
Poultry 0.5 0.5
Sheep and goats 10 10
of N fertilizer use by state for the United States. The IMAGE approach implies that fertilizer use and N removal are directly related at the country and state level.
For the historical years 1900, 1950, 1970, 1980, 1990, 1995, 2000, and 2005, crop yields and fertilizer use in IMAGE are imposed; for future scenarios they are modeled. Global demand and trade of agricultural products is translated to crop demand in 26 global regions (Stehfest et al., 2014). Crop production is allocated to IMAGE spatial 0.5 × 0.5 grids by a land use allocation submodel (Supplemental Figure S1; SI). To calculate crop production to meet the demand for agricultural products in 2050, the IMAGE model distinguishes eight crop groups (Table 2), and for each group a productivity increase is projected for the baseline scenario in International Assessment of Agricultural Knowledge, Science, and Technology for Development (IAASTD, 2008). The partial factor productivity or agronomic efficiency for N fertilizer, also referred to as fertilizer use efficiency (FUEN) (Ladha et al., 2005), is an input parameter for
IMAGE that determines the synthetic fertilizer requirement for a given crop production in future scenarios (Eq. [1]); FUEN is
defined as the dry matter production in kg (YN) per kg of applied
synthetic fertilizer N (FN).
FUEN = YN/FN [1]
When total N supply is used as the denominator in Eq. [1], the outcome could be referred to as NUE. Animal manure is not considered for the calculation of the synthetic fertilizer requirement with FUE because manure N accounts for a small portion of the total N inputs (10–20%) for crop production systems in the United States and Europe.
IMAGE results for gaseous emissions of NH3 and the gross
soil N budget (Eq. [2]) were generated for individual countries and states and for the United States and the European Union as a whole.
N budget = Nfix + Ndep + Nfert + Nman – Nrem [2]
where Nfix is biological N fixation by crops (cBNF); Ndep is
atmospheric deposition; Nfert is application of synthetic N
fertilizer; Nman is application of animal manure, which is derived
from N excretion corrected for gaseous N losses from livestock housing and manure storage; and Nrem is N removal from
the field through crop harvesting, hay, and grass cutting and
grass consumed by grazing animals (for further definition, see Eurostat [2014a]; also referred to in the literature as “N surplus”; see Bouwman et al. [2005]).
The value of REN, also referred to as “recovery efficiency”
(Ladha et al., 2005), is an IMAGE result that is defined as:
REN = (UN - U0)/FNt [3]
where UN is plant N removal (kg ha-1), U0 is N removal without
fertilizer and manure N application, and FNt is total N input (kg
ha-1) defined as the sum of N
fert, Nman, Nfix, and Ndep. However,
data for U0 are only available for field trials and not at the scale
of countries. Therefore, for the present study, we must assume that U0 is zero, which biases the present estimates of REN toward
higher values than those reported in most field studies (Ladha et al., 2005).
Data regarding N delivery to rivers and coastal areas of the United States and the European Union and the contribution of N runoff and leaching from agricultural fields were taken from Beusen (2014), who coupled the hydrological model PCR-GLOBWB and an N retention model with the nutrient delivery module from the IMAGE model for the period 1900 to 2000. In 2000, agricultural inputs to rivers through runoff and erosion in Beusen (2014) were 5% of N inputs from fertilizer and manure, and agricultural inputs from groundwater infiltration were 15% of the gross N soil budget for the United States and Europe. These percentages were used to obtain estimates of N delivery by agriculture to rivers for the scenarios.
IMAGE is a global model and is not regularly used for specific world regions, as in this study. For validation, we compared IMAGE-derived N budgets for the European Union and the United States with budgets based on census data by OECD (2013), Eurostat (2014b), and Fertilizers Europe (2008; 2012) for the European Union and by International Plant Nutrition Institute (IPNI) (Fixen et al., 2012) and USDA (2014a) for the United States.
Baseline Scenario
We used the IMAGE model to analyze the impact of changes in land use and of management of livestock and crop production systems on the fate of N for the year 2050 for a baseline scenario based on Alcamo et al. (2006), which is similar to the baseline scenario in the IAASTD (2008) study. In the baseline scenario,
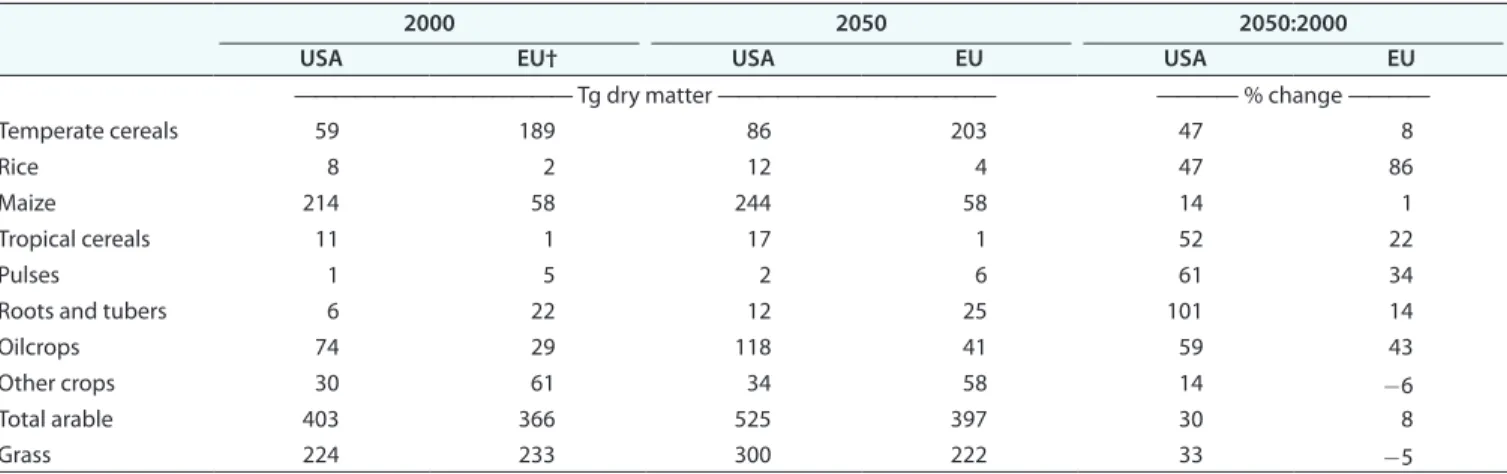
Table 2. Food crop production in 2000 and 2050 for IMAGE baseline scenario for eight crop groups and grass.
2000 2050 2050:2000
USA EU† USA EU USA EU
—————————————— Tg dry matter —————————————— ———— % change ————
Temperate cereals 59 189 86 203 47 8
Rice 8 2 12 4 47 86
Maize 214 58 244 58 14 1
Tropical cereals 11 1 17 1 52 22
Pulses 1 5 2 6 61 34
Roots and tubers 6 22 12 25 101 14
Oilcrops 74 29 118 41 59 43
Other crops 30 61 34 58 14 -6
Total arable 403 366 525 397 30 8
Grass 224 233 300 222 33 -5
www.agronomy.org • www.crops.org • www.soils.org
food and feed production by agriculture increases 60% globally between 2000 and 2050. Using Eq. [1], we project that this increase is achieved by a 40% increase in fertilizer use (Bouwman et al., 2013). We assume that FUE in the United States and the European Union converge toward similar values in 2030 and 2050, reflecting convergence of agricultural N practices and N policies. To achieve convergence and to account for yield gap closure, FUE in 2050 is calculated from the 2030 value projected by FAO (Bruinsma, 2003) by multiplying by 0.9 for all US states, by 0.8 for all Western Europe countries, and by 1.0 for Eastern European countries. A 60% increase in production with a 40% increase in fertilizer reflects the effects of improved agricultural practices that contribute to yield gap closure and the effects of climate change on global yields that are generally positive in temperate zones and negative in tropical zones (Stehfest et al., 2014). Yield gaps for major cereals can amount to 20% in the European Union and the United States, but the causes are different. For the European Union, yield gaps are largest in Eastern Europe due to nutrient limitation, whereas large yield gaps in southern parts of the Great Plains of the United States are due to colimitation with water (Mueller et al., 2012).
Mitigation Scenarios
We analyzed four scenarios to increase the apparent N recovery efficiency for applied N (REN) as in Bouwman et al.
(2013).
The scenarios from Bouwman et al. (2013) that we consider here are as follows: (i) Integrated manure management (IM): 100% increase in recycling of manure to agriculture and replacement of synthetic fertilizer. Nitrogen in manure is accounted for to calculate demand for synthetic fertilizer (Eq. [1]), assuming a fertilizer N equivalency of 60%. (ii) Improved manure storage (ST): 20% reduction in NH3 emission from
housing and manure storage. (iii) Extensification (EX): a shift of 10% ruminant production in mixed and industrial systems to pastoral systems. (iv) Increased feed efficiency (FE): reduced N and P excretion for industrial livestock systems by improved feed conversion due to improved genetic potential, feed composition, and phase feeding.
Two additional measures were analyzed: (i) Reduced fertilizer input (RF): a reduction in the fertilizer equivalent N rate by 25% in arable agriculture. Ribaudo et al. (2011) estimate that 37% of the maize acreage in the United States receives more N than the recommended rate and that 20% is in excess by 10 to 100%. The economic feasibility of a 25% overall reduction in maize N fertilizer rates was inferred from the findings of Moebius-Clune et al. (2013) and the Iowa State University Science Team (2013). These studies show that with the 4R N management approach, including the use of the concept of Economical Optimal N Rate and precision management tools such as sensors, site-specific applicators, and weather-based simulation models, such a reduction could maintain or improve farm income with limited or no yield penalty. (ii) Replacement of NH3–type
fertilizer by NO3−–type fertilizer (UN): All urea and anhydrous
NH3 fertilizer is substituted with CAN
(calcium-ammonium-nitrate) to decrease NH3 emissions and to increase REN. In 2000
in the United States and the European Union, about 20% of N fertilizer was in the form of urea. In the United States, about 55% of N fertilizer is applied as anhydrous NH3 and other types
of ammonia-based fertilizers, as compared with <13% in the European Union. Ammonia losses from surface application of urea can be as high as 20% (depending on incorporation depth), as compared with only 3% for CAN. In this scenario, N fertilizer application was reduced to account for increased N efficiency from replacing NH3–type fertilizer by CAN. Losses of NH3
from NH3–type fertilizer can also be reduced by the use of urease
inhibitors or better placement methods.
For the IM scenario, the manure stored in lagoons is assumed to be completely available for recycling and is added to fertilizer used at the country or state level, assuming no manure transport across country or state borders. In future years, the total nutrient availability is calculated (fertilizer + manure), whereby the N in manure is assumed to be equivalent to 60% of N added as synthetic fertilizer. For the United States in 2050, manure N is 13% of total fertilizer equivalent N input; consequently, we reduced synthetic fertilizer use in the IM scenario by 13% as compared with the baseline scenario (by increasing FUE to 1.13).
Results and Discussion
Validation and Assessment of N Rates
Around 2005, the N intensities of arable agriculture in the European Union and the United States are fairly comparable (Table 3; Supplemental Table S2). Total agricultural land in the United States is more than twice that in the European Union, mainly due to the much larger area of extensive pasture (range) land. Total use of N fertilizer and animal excretion of N are also similar. However, cBNF rates are much greater in the United States because almost one third of arable land is used for soybean cultivation. The United States and the European Union are fairly self-sufficient in terms of food production, but the European Union is a large net importer of N embedded in soybean products from South America.
Trends and levels of total input of synthetic N fertilizer between 1970 and 2005 used for IMAGE and based on FAOSTAT compare reasonably well with data by Fertilizers Europe (2012) and USDA (2014a) (Fig. 3; Supplemental Fig. S1; Supplemental Table S2). Most synthetic fertilizer is applied to arable land where N use is far more intensive than on pasture
Table 3. Some features of the N cycle for agriculture in the United States and the European Union around 2005.†
United States European Union
Population 304 × 106 497 × 106 Agricultural area, km2 4.2 × 10⁶ 1.9 × 10⁶ Cropland 1.7 × 10⁶ 1.2 × 10⁶ Pasture 2.5 × 10⁶ 0.7 × 10⁶ Fertilizer use, Tg N 11.4 10.5 cBNF,‡ Tg N 7.7 0.7 Feed/food import, Tg N 4.6 3.5 Manure production,§ Tg N 8.7 8.9
† Data about land use for the United States are from USDA (2014); data for European Union are from Eurostat (2014). Nitrogen cycle data for the United States are from Davidson et al. (2012), Houlton et al. (2012), and USEPA (2011); N cycle data for the European Union are from Leip et al. (2011) and Bouwman et al. (2013).
‡ Biological N fixation by crops.
land. The mean partial productivity of N in synthetic fertilizer (FUEN) in 2000 for all arable crops is just above 50 kg dry matter per kg N for the United States and Europe (Bouwman et al., 2013) (Supplemental Table S3). This FUEN corresponds to a crop N content just under 2% and agrees with Dobermann and Cassman (2005) for cereals.
IMAGE-derived mean annual N input to arable agriculture from fertilizer for 2005 is 63 kg N ha-1 in the United States
(Table 4) is somewhat lower than the mean value of 75 kg N ha-1
for the years 2002 and 2007 as reported by the USDA (USDA, 2014a).
For the European Union, the average synthetic fertilizer input by IMAGE to arable land in 2005 is 63 kg N ha-1 (the same as for
the United States), compared with 69 kg ha-1 according to the
MITERRA model (Velthof et al., 2014) and 111 kg ha-1 from
data from the fertilizer industry (Fertilizers Europe, 2008; only for N intensive arable land).
Average N input of synthetic fertilizer and manure per hectare of arable agriculture in the United States is 25% lower than in the European Union (Table 5) (USDA, 2014a; Ribaudo et al., 2011; Fertilizers Europe, 2008, combined with modeled manure data from Velthof et al., 2014). Whereas winter wheat is the dominant crop in the European Union, maize and soybean are the dominant crops in the United States. High N fertilization rates are common in maize, whereas N application rates in soybean are small. As a result, average annual soil N input under maize–soybean rotations is 70% of that used in continuous maize cultivation (Iowa State University Science Team, 2013).
Fig. 3. Average application rates of fertilizer N and manure N on arable land in IMAGE.
Table 4. Nitrogen budget for 2005 by IMAGE.
Total agriculture Arable agriculture
USA EU USA EU
————————————————— kg N ha-1 —————————————————
A: Fertilizer 27 54 63 63
B: Total manure applied 16 42 13 18
C: N fixation 14 6 24 2
D: N deposition 9 13 9 13
E: N removal 40 68 77 67
F: NH3 loss 7 14 15 18
F1: NH3 loss in housing and storage 3 5 6 8
F2: NH3 loss during application and grazing 2 5 5 5
F3: NH3 loss in fertilizer 2 4 4 5
G: Gross soil N budget (A+B+C+D-E) 27 47 25 21
Table 5. Synthetic N fertilizer use per crop from census data, 2005–2008.†
Crop USAPercentage of arable areaEU USA N rate EU
—————— % —————— ————— kg N ha-1 ————— Barley 1 19 76‡ 88 Maize§ 32 19 148 92 Cotton 6 79 Oilseeds 8 148 Oats¶ 2 12 84‡ 64 Soybeans 31 5 Wheat 24 36 68 113 Total coverage/fertilizer N 96 94 83 111
Total N including manure 90‡ 133#
† Data for commercial fertilizer use in the European Union are from Fertilizers Europe (2008) and are presented as mean for 2005–2008. Data for com-mercial fertilizer use in the United States are from USDA for 2007 (maize, cotton, soybean, wheat) or Agricultural Resource Management Survey data for 2006–2007 (barley and oats, including manure N) (Ribaudo et al., 2011).
‡ Including manure N.
§ Sum of grain maize and silage maize for the European Union. ¶ Including rye, triticale, and rice for the European Union.
www.agronomy.org • www.crops.org • www.soils.org
Validation and Assessment of Manure N
and Biological N Fixation
The use of manure on arable land is less common in the United States than in the European Union. In the United States, about 10% of cropland receives manure (Ribaudo et al., 2011), whereas in the European Union (Eurostat, 2014b), data indicate that about 55% of cropland receives manure (derived from percentage of total agricultural land assuming that only permanent grassland receives manure). Higher rates of manure N in the European Union are a result of farm measures to implement the NiD.
For the United States, IMAGE input of manure for 2005 is 13 kg N ha-1, compared with an estimated 7 kg N ha-1 for
2006 inferred from comparing USDA’s Agricultural Resource Management Survey (Ribaudo et al., 2011), USDA census data, and USEPA (2011).
For the European Union, IMAGE manure N input to arable land is 18 kg N ha-1, compared with 23 kg N ha-1 reported
by Velthof et al. (2014). IMAGE total manure N rate in the European Union is 2.6 times higher than in the United States for total agricultural land (grazing and application) and 1.4 times higher for arable land (Table 4). In 2005, the proportion of N in total manure that is recycled to agricultural land in IMAGE is 75% for the United States, which is consistent with estimates for 2004 inferred from USEPA (2011). For the European Union, this IMAGE-derived proportion is larger (almost 90% of manure N is recycled) and similar to an estimate inferred from Velthof et al. (83% for 2008 and 2014).
For the United States, about 3 to 5 Tg cBNF is from soybean, and 2 to 4 Tg cBNF is from alfalfa (Houlton et al., 2012; USEPA, 2011). The IMAGE value for N fixation by soybean in 2005 is 100 kg N ha-1 in the United States, using a dry mass N content in
soybean grains of 6.2%, and is consistent with empirical data by Salvagiotti et al. (2008), ranging between 60 and 150 kg N ha-1
(25th and 75th percentile). Total N fixation in crops and fodder by IMAGE in 2005 was 6 Tg.
Validation and Assessment of Ammonia Emission
For the United States, IMAGE reproduces the increasing trend in Emissions Database for Global Atmospheric Research (EDGAR, 2014) between 1970 and 2005 (Supplemental Fig. S4). Emission levels by IMAGE are about 15% lower than in EDGAR when excluding NH3 emission from animal housing because the EDGAR database does not include this emission source. IMAGE estimates that NH3 emissions increased by 25% between 1980 and 2005 (Fig. 4) as compared to 40% according to EDGAR (2014) (Fig. 2; Supplemental Fig. S4).
IMAGE reproduces decreasing trends of NH3 emission in the European Union from agricultural sources between 1980 and 2005 reported by EMEP (2014), but modeled levels are 10 to 15% lower than reported levels (Supplemental Fig. S4). At the EU country level, the linear regression between total NH3 emission from agriculture by IMAGE and EMEP for the year 2005 is (Supplemental Fig. S5):
NH3 emission-IMAGE = NH3 emission-EMEP × 0.81 + 14.04 (Gg; R2 = 0.90; n = 27)
According to IMAGE, NH3 emissions in the European Union decreased by 15% between 1980 and 2005, whereas EMEP (2014) data show a reduction of 25% (Fig. 2). For the European Union, the NEC directive is the major cause of this reduction, whereas the contribution of the NiD is minor (Velthof et al., 2014).
Validation and Assessment of Soil N Budget
For the United States, IMAGE net soil N budgets (“net” meaning that NH3, N2O, and NO losses from housing and storage are subtracted) for arable land are about 10% higher than results based on IPNI data (Fixen et al., 2012) (Supplemental Fig. S6). For this comparison, N input by atmospheric deposition was omitted from IMAGE N budgets (Eq. [2]) because this input is also not considered by Fixen et al. (2012). The N budgets from IMAGE and IPNI for arable agriculture show no clear trend between 1985 and 2005 (Fig. 5; Supplemental Fig. S6).
The N budget for arable land in the United States in 2005 is 4 kg N ha-1 higher than in the European Union. The effect
of higher inputs by N fixation in the United States (22 kg N ha-1) is compensated by lower N inputs of N from manure and
atmospheric deposition (9 kg N ha-1) and higher rates of N
removal, particularly by soybeans.
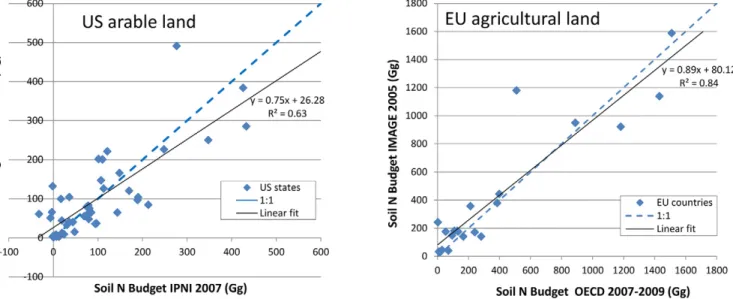
At the US state level, the relation between absolute N budgets by IMAGE for 2005 and IPNI for 2007 (Fixen et al., 2012) is (Fig. 6):
N-Budget-IMAGE = N Budget-IPNI × 0.75 + 26.28 (Gg; R2 = 0.63; n = 48)
Fig. 4. Loss of NH3 to air and N delivery to rivers by agriculture by IMAGE.
Fig. 5. Development of soil N budget (Eq. [2]) for agricultural land by the IMAGE model.
For some US states, N budgets by IMAGE and IPNI can differ by more than a factor of 2. Whereas IPNI reports negative N budgets for 2007 (e.g., for Montana, New Hampshire, Pennsylvania, and Tennessee), IMAGE does not give negative N budgets for 2005.
For the European Union, net soil N budgets calculated with IMAGE for total agricultural land (Fig. 5) are about 20% higher than data reported by Eurostat (2014b) (Supplemental Fig. S7). IMAGE does reproduce decreasing trends between 1995 and 2005.
At the country level in the European Union, the linear regression between the absolute N budgets (Gg) by IMAGE for 2005 and the average values for 2007 to 2009 as reported by OECD (2013) is (Fig. 6):
N Budget-IMAGE = N-Budget-OECD × 0.89 + 80.12 (Gg; R2 = 0.84; n = 21)
These moderate regressions, particularly for the United States, and the considerable differences for some individual states and countries are acceptable considering that IMAGE is a global model with various model inputs for Eq. [3] applying to larger scales than countries or states.
Validation and Assessment of Total N Load to Rivers
IMAGE estimates of N loss per hectare of agricultural land to rivers show a strong increase after 1950 in the United States and the European Union but show a reduction only in the European Union after 1980 (Fig. 4). IMAGE estimates of total N delivery to rivers for 2000 are 4.1 Tg for the United States and 4.7 Tg for Europe (Beusen, 2014). The contribution of agriculture was 72% for the United States (68% from arable) and 62% for Europe (52% from arable). This 62% for Europe is similar to a contribution of 55% of diffuse agricultural sources to total marine N loading for the European Union (van Grinsven et al., 2012) and 60% to N export to the northeast Atlantic in 2005 (OSPAR, 2014). Beusen (2014) estimated retention of N in US and EU rivers at about 40%; the remaining 60% of N
delivery to rivers is exported to coastal regions. Resulting export of agricultural N by rivers in 2000 by IMAGE was 1.3 Tg for the United States and 1.7 Tg for the European Union. Seitzinger et al. (2010) estimated an N export of 1.1 Tg for the United States and the European Union, and Alexander et al. (2008) reported 1.2 Tg for the United States in 2002. McCrackin et al. (2014), using the NEWS model, report 1.0 Tg for total riverine dissolved N export from agriculture to US coastal regions in 2005.
Validation using observed nutrient concentrations or loads for major rivers is a good option for global nutrient models like IMAGE because large rivers integrate the impact of the N budget for a number of countries or states. Beusen (2014) compared total N (TN) concentrations based on river loads from IMAGE with observations for the river Rhine in Europe and the Mississippi River in the United States for the period 1970 to 2000. Observations and time trends of TN concentration were reproduced for both rivers (Fig. 7). The concentration of TN for the Mississippi was systematically overestimated by 30%. Both for the Rhine and Mississippi Rivers, concentration based on IMAGE correlated fairly well with annual observations (Supplemental Fig. S8 and S9):
N-Mississippi-IMAGE = N-Mississippi_obs × 0.61 + 1.42 (mg N L-1; R2 = 0.52; n = 54)
N-Rhine-IMAGE = N-Rhine_obs × 0.85 + 0.48 (mg N L-1; R2
= 0.62; n = 24)
The estimated TN load for the river Rhine in 2000 was 0.3 Tg, with 60% of loads from agriculture (Supplemental Fig. S10). Total N load for the Mississippi River in 2000 was estimated at 1.6 Tg, with 80% from agricultural sources (Supplemental Fig. S11), as compared with 1.1 Tg and 70% for the year 2005 by McCrackin et al. (2014). USEPA (2013b) reported basin-wide contributions of agriculture to TN export to the Gulf of Mexico of 65 to 70%. In the European Union, decreases in fertilizer use and increases in REN reduced modeled N delivery to rivers by 35% between 1980 and 2005, whereas N delivery to US rivers
Fig. 6. Comparison of IMAGE output for the N budget for arable agriculture in the United States in 2005 with data for 2007 provided by the International Plant Nutrition Institute (Fixen et al., 2012) and IMAGE output for the N budget for total agriculture in the EU27 in 2005 with average data for 2007 to 2009 provided by the Organisation for Economic Cooperation and Development (OECD, 2013).
www.agronomy.org • www.crops.org • www.soils.org
did not decrease over the same period (Fig. 4). Overall, N concentrations for the Rhine basin remain higher than for the Mississippi basin (Fig. 7). Velthof et al. (2014) estimated that the NiD reduced the N load to water bodies by 16% between 2000 and 2008, indicating the effectiveness of this measure.
Apparent Recovery Efficiency
The increase in the use of N fertilizers does not necessarily imply a decrease in REN because crop yield also increased.
IMAGE results for trends and levels of REN for the United States
and the European Union are similar for both total agriculture and arable agriculture (Fig. 8). The values for REN (Eq. [3])
decreased sharply in the 20th century, stabilizing around 1970 and increasing afterward. In 2005, REN was 60% for total
agriculture and 66 and 69% for arable land for the European Union and the United States, respectively. The close match of REN for both regions is remarkable considering that the structure
of agriculture in the United States and the European Union are quite different, with N-fixing soybean covering one third of the US crop area and the feed cultivation and livestock operations being more spatially separated than in the European Union.
Effects of Policies and Fertilizer Prices
Concerns about eutrophication and NO3− pollution of
drinking water by agricultural sources led the old European Union member states (EU15) to implement the NiD in the late
1990s, limiting the annual use of manure N to 170 kg ha-1. The
NiD had consequences not only for N-intensive regions in The Netherlands, Denmark, Belgium, France, Germany, and Ireland but also at the EU level, where a modest reduction of manure N inputs can be observed after 1990 (Fig. 3). The continued modest decrease in the use of synthetic fertilizer after 1990 (Fig. 1) is not likely an effect of after the introduction of the NiD in 1992 because national implementations were not in place until after 1998 and the Directive does not limit the use of synthetic N fertilizer. However, increased awareness of farmers and their advisors of N overdosing relative to crop demand could have had an effect on the use of synthetic N fertilizer (van Grinsven et al., 2012). The decrease of N inputs in European arable agriculture is amplified in the N budget and N leaching loss. IMAGE simulations show that the N budget in the European Union decreased after 1980 while remaining fairly constant in the United States, suggesting that regulations in the European Union are effective (Fig. 5).
The increase in N fertilizer prices compared with crop prices in the United States (Fig. 9) also occurred in the European Union. This could explain part of the decreasing trends in fertilizer consumption since the mid-1990s (Fig. 1). In principle, the concept of Economical Optimal N Rate accounts for price effects in N recommendations. Whether farmers behave as “homo economicus” is an issue of debate. Regarding fertilizer
Fig. 7. Comparison of observed total N concentration at the river mouth of the river Mississippi and Rhine and modeled concentrations based on the IMAGE output for the catchment N budget (Beusen, 2014).
Fig. 8. Soil N recovery calculated by IMAGE for total and arable agriculture.
Fig. 9. Ratio of price indices of N fertilizer and crops for the United States (1982 = 1). Source: Agricultural Prices, National Agricultural Statistics Service (USDA, 2014a).
use, farmers can be both risk-averse regarding crop failure in dry or otherwise unfavorable years and risk-taking to provide enough N to obtain a bumper crop in favorable years (Sheriff, 2005). Both attitudes would lead to un-economical N fertilizer use. Indeed, we postulate that farmers generally manage perceived and real risks in N fertilization in the absence of tools that allow for more precise N management, which is therefore a focus of current research efforts (Graham et al., 2010; Scharf et al., 2011). Moebius-Clune et al. (2013) estimate that for maize cultivation in the United States (New York and Iowa), farmers could reduce their N fertilizer rate on average by 60 kg ha-1 yr-1 (about 30%)
while saving 66 US$ ha-1 yr-1 by accounting for soil and crop
management and seasonal weather effects.
Scenario Results
The primary aim of the validation is to demonstrate that IMAGE is a suitable tool for analysis of N scenarios at the scale of the European Union and the United States. IMAGE captures trends of fertilizer use, N budgets, NH3 emissions, and
N river loads for the United States and the European Union as a whole, as well as the variation at the scale of countries and states. IMAGE underestimates the absolute values of N budgets for the European Union and NH3 emissions in the United States and the
European Union by 10 to 20%. Because capturing the relevant change of N losses and environmental loads between 2005 and 2050 is most relevant for our scenario analysis, we conclude that IMAGE is adequate.
Annual increases of dry matter yield per hectare between 2000 and 2050 are 0.9% (United States) and 0.5% (European Union) for temperate cereals, 0.2% (United States) and 0.3% (European Union) for maize, and 0.7% (United States) and 0% (European Union) for oil crops (which include soybean). Arable (crop) area in the United States increases by 3%, whereas in the European Union it decreases by 5%. The resulting increase of total crop production is 30% in the United States and 8% in the European Union (Table 2). In the FAOSTAT database, the
mean linear increase in maize yield in the US Corn Belt between 1965 and 2010 was 1.5% per year, with a constant absolute rate of gain between 84 (West, rainfed) and 129 (West, irrigated) kg ha-1 yr-1 (Grassini et al., 2013). The yield increase for maize of
0.2% yr-1 for the United States in the IAASTD baseline is much
lower than the observed increase of 1% yr-1 between 1965 and
2010 (Grassini et al., 2013).
IMAGE results for the baseline scenario show, for both the United States and the European Union, a reduction of the N budget in 2050 by about 10% relative to 2005 (Table 6). However, while NH3 emissions for the European Union continue
to decrease (12% relative to 2005), US emissions continue to increase (13% relative to 2005). The N delivery by agriculture to rivers decreases for both regions but decreases less in the United States (4%) than in the European Union (7%). There is hardly an effect of the baseline scenario on REN for total agriculture, which
stabilizes between 2005 and 2050. REN for arable agriculture
increases because the baseline scenario is driven by an increase of crop yields (30% in the United States; 8% in the European Union). Combined with the effect of improved agricultural practices, reactive N loss per unit of crop production is projected to decrease on both continents. The scenario results suggest that only the European Union could achieve an increase of agricultural production while emissions of reactive N decrease. However, a large part of the increase in N losses in the United States in 2050 is due to expansion of agricultural production.
For the United States and the European Union, the IM scenario offers the most effective approach to increase REN (Table
6). In the IM scenario, N delivery to rivers decreases by almost 20% relative to 2005 for the United States and the European Union. Although this reduction would be sufficient for the European Union to meet targets for the Northeast Atlantic and the Baltic Sea, it is not sufficient for the Gulf of Mexico. The RF scenario gives a larger increase in REN but would likely be more
problematic to implement in view of the risk of crop production loss if not accompanied by improved management of N inputs.
Table 6. IMAGE results for 2050 in baseline and scenarios.
2005 2050
BL† EX FE IM ST RF UN
N budget total agriculture (kg N ha−1)
USA 26.5 24.5 23.2 23.6 20.8‡ 25.1 19.1 24.5
EU 46.2 41.6 40.5 39.5 36.4 42.3 31.3 41.5
N recovery, total agriculture (%)
USA 60 62 63 63 68 62 67 62
EU 60 61 62 63 65 61 68 62
N recovery, arable agriculture (%)
USA 69 75 75 76 82 76 81 72
EU 66 74 74 77 82 75 85 71
N delivery to rivers from agriculture (kg N ha−1)
USA 5.7 5.5 5.2 5.3 4.7 5.5 4.7 5.5
EU 10.7 9.9 9.7 9.5 8.9 10.0 8.5 10.0
Ammonia loss, total agriculture (kg N ha−1)
USA 6.9 7.8 7.2 7.2 8.1 7.7 7.4 7.2
EU 13.9 12.2 12.0 11.6 11.8 12.2 11.5 11.0
† BL, increased crop yields and production; EX, +10% ruminants in pastoral systems; FE, -10% N livestock excretion; IM, maximum recycling of manure; RF, -25% reduction of input effective N; ST, 20% reduction of NH3 emission from housing and storage; UN, replacement of ammonia type fertilizer by calcium-ammonium-nitrate.
www.agronomy.org • www.crops.org • www.soils.org
This loss would need to be compensated by trade limitation or farm subsidies to overcome risk aversion by farmers and to protect farm incomes. The RF scenario would fit into a global scenario with a slower increase in demand for food and animal products compared with the baseline scenario. The FE and EX scenario affect only the livestock sector and decrease the N budget and NH3 emission but have a small effect on overall REN.
The objective of the ST and UN scenarios, and to a lesser extent the FE scenario, is to reduce NH3 emissions. For the
United States, the effect of these scenarios is not sufficient to compensate for the increase of NH3 emissions in the baseline
scenario. However, in combination with the IM scenario, measures in these scenarios can be effective in reducing NH3
emissions.
New policies that encourage or perhaps incite broad implementation of best management practices for US agriculture could further improve REN. However, the potential of N-saving
measures, as in the IM, in the United States probably is lower than in the European Union, even considering that the European Union already gained part of the potential savings in the past two decades. An important scenario assumption that explains this weak response is the spatial decoupling of feed production for livestock and livestock operations in the United States. Recycling of a large part of manure production in the United States would require long-distance transport over 100s to 1000s of kilometers, the cost of which is not economically justified given the current fertilizer value of the manure. Long-distance transport is also a source of emission of NOx, particulate matter,
and greenhouse gasses. A US state where this problem occurs is Texas, where a large proportion of the feed demand of the large livestock sector is imported while the manure remains in Texas. In the European Union, manure is rarely transported beyond a distance of 200 km (Willems et al., 2012) and is currently a major cost, particularly for landless hog farmers. For example, the current average cost for manure disposal for a hog farm in the Netherlands is 30,000 euro per year, which is about 5% of the total production cost (Supplemental Table S4). In the United States, the USDA Environmental Quality Incentives Program partly compensates crop farmers for the additional cost of manure recycling, whereas in The Netherlands, Belgium, and Denmark, livestock farmers compensate crop farmers for these costs.
Conclusions
Different policy approaches in the European Union and United States are reflected in historic trends and levels of N budgets and emissions of reactive N to air and rivers. These different approaches, as well as variation between countries (in the European Union) and states (in the United States), were reproduced by the global IMAGE model. Generally, nutrient surplus problems were more acute and severe in the European Union than in the United States during the 1970s and 1980s, but regulation-driven changes in the European Union have reduced environmental N loads and brought them closer to US conditions. Scenario results from IMAGE for 2050 suggest that differences between the United States and the European Union will be sustained and that NH3 emission in the United
States will increase relative to 2005. IMAGE results for the IM and RF scenarios suggest that a 25% reduction in fertilizer
rates is insufficient to achieve policy targets of a 45% reduction in N delivery to the Gulf of Mexico. European Union river loads under these scenarios could achieve targets for Northeast Atlantic (OSPAR, 2014) and the Baltic Sea (HELCOM, 2014). Such drastic measures, however, have a risk of yield reduction and could “export” environmental problems by intensifying nutrient inputs or expanding crop production areas elsewhere. Environmental N losses can be reduced by adopting a variety of practices, such as improving application methods, management practices, and integrating livestock and crop production. For the United States and the European Union, these measures may need to be accompanied by policy action with strong incentives for participation to better manage NH3 and NO3 losses from
agriculture.
Acknowledgments
This work resulted from a conference supported by NSF Research Coordination Network award DEB-1049744 and by the Soil Science Society of America, the American Geophysical Union, The International Plant Nutrition Institute, The Fertilizer Institute, and the International Nitrogen Initiative. This paper is an elaboration of a keynote at the Kansas conference on the European experience on managing nitrogen in agriculture, titled: Managing nitrogen in the European Union under the NiD: Finding a balance between the benefits and costs of nitrogen fertilization.
References
AAPFCO/TFI. 2006. Commercial fertilizers 2005. Association of American Plant Food Control Officials/The Fertilizer Institute, Washington, DC. Alcamo, J., D. Van Vuuren, and W. Cramer. 2006. Changes in ecosystem services
and their drivers across the scenarios. In: S.R. Carpenter, P.L. Pingali, E.M. Bennett, and M.B. Zurek, editors, Ecosystems and human well-being: Scenarios. Island Press, Washington, DC. p. 279–354.
Alexander, R.B., R.A. Smith, G.E. Schwarz, E.W. Boyer, J.V. Nolan, and J.W. Brakebill. 2008. Differences in phosphorus and nitrogen delivery to the Gulf of Mexico from the Mississippi River Basin. Environ. Sci. Technol. 42(3):822–830. doi:10.1021/es0716103
Beusen, A. 2014. Transport of nutrient from land to sea, Chapter 5: Exploring changes in nitrogen and phosphorus biogeochemistry in global rivers in the twentieth century. Utrecht Studies in Earth Sciences 58. http://dspace. library.uu.nl/handle/1874/298665 (accessed 19 Sept. 2014).
Bouwman, A.F., K. Klein Goldewijk, K.W. Van Der Hoek, A.H.W. Beusen, D.P. Van Vuuren, W.J. Willems, et al. 2013. Exploring global changes in nitrogen and phosphorus cycles in agriculture induced by livestock production over the 1900–2050 period. Proc. Natl. Acad. Sci. USA 110:20882–20887. doi:10.1073/pnas.1012878108
Bouwman, A.F., G. Van Drecht, and K.W. Van der Hoek. 2005. Nitrogen surface balances in intensive agricultural production systems in different world regions for the period 1970-2030. Pedosphere 15:137–155.
Bouwman, A.F., T. Kram, and K. Klein Goldewijk. 2006. Integrated modelling of global environmental change: An overview of IMAGE 2.4. Netherlands Environmental Assessment Agency, Bilthoven, The Netherlands. Bricker, S.B., B. Longstaff, W. Dennison, A. Jones, K. Boicourt, C. Wicks, et al.
2007. Effects of nutrient enrichment in the nation’s esturaries: A decade of change. NOAA Coastal Ocean Program, Decision Analysis Series No. 26. National Centers for Coastal Ocean Science, Silver Spring, MD.
Bruinsma, J.E. 2003. World agriculture: Towards 2015/2030. An FAO perspective. Earthscan, London.
Davidson, E.A., M.B. David, J.N. Galloway, C.L. Goodale, R. Haeuber, J.A. Harrison, et al. 2012. Excess nitrogen in the U.S. environment: Trends, risks, and solutions. Issues Ecol. 15.
Dobermann, A., and K.G. Cassman. 2005. Cereal area and nitrogen use efficiency are drivers of future nitrogen fertilizer consumption. Sci. China C Life Sci. 48:745–758.
EDGAR (Emission Database for Global Atmospheric Research). 2014. http:// gcmd.nasa.gov/records/GCMD_EDGAR_RIVM.html (accessed 14 Feb. 2014).
European Monitoring and Evaluation Programme) 2014. http://www.ceip.at/ms/ ceip_home1/ceip_home/webdab_emepdatabase/ (accessed 14 Feb. 2014).
European Parliament. http://www.europarl.europa.eu/aboutparliament/en/ displayFtu.html?ftuId=FTU_5.2.10.html (accessed 4 Mar. 2014). Eurostat (Statistical Office of the European Union). 2014a. http://epp.eurostat.
ec.europa.eu/statistics_explained/index.php/Glossary:Gross_nitrogen_ balance (accessed 13 Nov. 2014)
Eurostat (Statistical Office of the European Union). 2014b. http://epp.eurostat. ec.europa.eu/portal/page/portal/statistics/search_database (accessed 10 Feb. 2014).
Fertilizers Europe. 2008. Forecast of food, farming and fertilizer use 2008 to 2018. Vol. 1. Executive summary and regional data. European Fertilizer Manufactures Association (EFMA), Zurich, Switzerland.
Fertilizers Europe. 2012. Forecast of food, farming and fertilizer use 2012 to 2022. European Fertilizer Manufactures Association (EFMA), Zurich, Switzerland.
Fixen, P.E., R. Williams, and Q.B. Rund. 2012. NUGIS: A nutrient use geographic information system for the U.S. International Plant Nutrition Institute, Brookings, SD.
Graham, C.J., H.M. Van Es, J.J. Melkonian, and D.A. Laird. 2010. Improved nitrogen and energy use efficiency using NIR estimated soil organic carbon and N simulation modeling. In: D.A. Clay and J. Shanahan, editors, GIS applications in agriculture: Nutrient management for improved energy efficiency. Taylor and Francis, Florence, KY. p. 301–325.
Grassini, P., K.M. Eskridge, and K.G. Cassman. 2013. Distinguishing between yield advances and yield plateaus in historical crop production trends. Nat. Commun. 4:2918. doi:10.1038/ncomms3918
HELCOM (Helsinki Commission for Protection of the Baltic Marine Environment). 2014. http://helcom.fi/baltic-sea-action-plan/nutrient-reduction-scheme/targets/ (accessed 12 Feb. 2014).
Houlton, B.Z., E. Boyer, A. Finzi, J. Galloway, A. Leach, D. Liptzin, et al. 2012. Intentional versus unintentional nitrogen use in the United States: Trends, efficiency and implications. Biogeochemistry doi:10.1007/ s10533-012-9801-5.
IAASTD. 2008. Agriculture at a crossroads. International assessment of agricultural knowledge, science and technology for development. Island Press, Washington, DC.
Iowa State University Science Team. 2013. Iowa science assessment of nonpoint source practices to reduce nitrogen and phosphorus transport in the Mississippi River Basin. Iowa State University, Ames, IA.
Ladha, J.K., H. Pathak, T.J. Krupnik, J. Six, and C. van Kessel. 2005. Efficiency of fertilizer nitrogen in cereal production: Retrospects and prospects. Adv. Agron. 87:85–156. doi:10.1016/S0065-2113(05)87003-8
Leip, A., B. Achermann, G. Billen, A. Bleeker, L. Bouwman, W. de Vries, et al. 2011. Integrating nitrogen fluxes at the European scale. In: M.A. Sutton, et al., editors, European nitrogen assessment. Cambridge Univ. Press, Cambridge, U.K. p. 612.
McCrackin, M.L., J.A. Harrison, and J.E. Compton. 2014. Future riverine nitrogen export to coastal regions in the United States: Prospects for improving water quality. J. Environ. Qual. doi:10.2134/jeq2014.02.0081 (in press).
Mississippi River/Gulf of Mexico Watershed Nutrient Task Force. 2008. Gulf hypoxia action plan 2008 for reducing, mitigating, and controlling hypoxia in the Northern Gulf of Mexico and improving water quality in the Mississippi River Basin. USEPA, Washington, DC.
Moebius-Clune, B., H. Van Es, and J. Melkonian. 2013. Adapt-N uses models and weather data to improve nitrogen management for corn. Better Crops 97:7–9.
Mueller, N.D., J.S. Gerber, M. Johnston, D.K. Ray, N. Ramankutty, and J.A. Foley. 2012. Closing yield gaps through nutrient and water management. Nature 490. doi:10.1038/nature11420
OECD. 2013. OECD compendium of agri-environmental indicators. www. oecd.org/dataoecd/44/26/40678331.pdf (accessed 27 Aug. 2014). Oenema, O., A. Bleeker, N.A. Braathen, M. Budnáková, K. Bull, P. Cermák,
et al. 2011. Nitrogen in current European policies. In: M.A. Sutton, et al., editors, European nitrogen assessment. Cambridge Univ. Press, Cambridge, U.K. p. 612.
OSPAR. 2014. Oslo Paris Convention to protect the marine environment of the North-East Atlantic. http://qsr2010.ospar.org/en/ch04.html (accessed 12 Feb. 2014).
Ribaudo, M., J. Delgado, L. Hansen, M. Livingston, R. Mosheim, and J. Williamson. 2011. Nitrogen in Agricultural systems: Implications for conservation policy. ERR-127. USDA, Washington, DC.
Salvagiotti, F., K.G. Cassman, J.E. Specht, D.T. Walters, A. Weiss, and A. Dobermann. 2008. Nitrogen uptake, fixation and response to fertilizer N in soybeans: A review. Field Crops Res. 108. doi:10.1016/j.fcr.2008.03.001 Seitzinger, S.P., E. Mayorga, A.F. Bouwman, C. Kroeze, A.H.W. Beusen, G. Billen, and J.A. Harrison. 2010. Global river nutrient export: A scenario analysis of past and future trends. Global Biogeochem. Cycles 24(4). Sheriff, G. 2005. Efficient waste? Why farmers over-apply nutrients and
the implications for policy design. Rev. Agric. Econ. 27:542–555. doi:10.1111/j.1467-9353.2005.00263.x
Scharf, P.C., D.K. Shannon, H.L. Palm, K.A. Sudduth, S.T. Drummond, N.R. Kitchen, et al. 2011. Sensor-based nitrogen applications out-performed producer-chosen rates for corn in on-farm demonstrations. Agron. J. 103:1683–1691. doi:10.2134/agronj2011.0164
Stehfest, E., D. van Vuuren, T. Kram, L. Bouwman, R. Alkemade, et al. 2014. Integrated assessment of global environmental change with IMAGE 3.0: Model description and policy applications, PBL Netherlands Environmental Assessment Agency, The Hague. http://www.pbl.nl/sites/ default/files/cms/publicaties/PBL-2014-Integrated_Assessment_of_ Global_Environmental_Change_with_IMAGE_30-735.pdf (accessed 11 Sept. 2014).
Stouman Jensen, L., K.W. van der Hoek, H. Damgaard Poulsen, J.F. Zevenbergen, C. Pallière, J. Lammel, et al. 2011. Benefits of nitrogen for food, fibre and industrial production. In: M.A. Sutton, et al., editors, European nitrogen assessment. Cambridge Univ. Press, Cambridge, U.K. p. 612.
USDA. 2014a. http://www.ers.usda.gov/data-products/fertilizer-use-and-price. aspx (accessed 6 Feb. 2014).
USDA. 2014b. Agricultural Act of 2014. http://www.ers.usda.gov/farm-bill-resources.aspx#.UwAu5V5shNd (accessed 10 Feb. 2014).
USEPA. 2006. Inventory of U.S. greenhouse gas emissions and sinks 1990–2004. USEPA, Washington, DC.
USEPA. 2009a. National lakes assessment: A collaborative survey of the Nation’s lakes. EPA 841-R-09-001. USEPA Office of Water and Office of Research and Development, Washington, DC.
USEPA. 2009b. Office of the Inspector General: EPA needs to accelerate adoption of numeric nutrient water quality standards. Report 09-P-0223. USEPA, Washington, DC.
USEPA. 2011. Reactive nitrogen in the United States: An analysis of inputs, flows, consequences and management options. USEPA Science Advisory Board, Washington, DC.
USEPA. 2013a. National Rivers and Streams Assessment 2008–2009: A collaborative survey. EPA 841-D-13-001. USEPA Office of Wetlands, Oceans and Watersheds, Office of Research and Development, Washington, DC.
USEPA. 2013b. Mississippi River-Gulf of Mexico Watershed Nutrient Task Force reassessment 2013: Assessing progress made since 2008. Office of Wetlands, Oceans, and Watersheds, Washington, DC.
van Grinsven, H.J.M., H.F.M. Ten Berge, T. Dalgaard, B. Fraters, P. Durand, A. Hart, et al. 2012. Management, regulation and environmental impacts of nitrogen fertilization in Northwestern Europe under the NiD; a benchmark study. Biogeosciences 9:5143–5160. doi:10.5194/bg-9-5143-2012 Velthof, G.L., J.P. Lesschen, J. Webb, S. Pietrzak, Z. Miatkowski, M. Pinto, et al.
2014. The impact of the NiD on nitrogen emissions from agriculture in the EU-27 during 2000–2008. Sci. Total Environ. 468–469:1225–1233. doi:10.1016/j.scitotenv.2013.04.058
Willems, J., M. van Schijndel, H. van Grinsven, F. Kragt, H. van Zeijts, J. van Dam, et al. 2012. Evaluatie meststoffenwet 2012–syntheserapport. PBL 500252001. Bilthoven, The Netherlands. (In Dutch.)