MNP report 555034002/2007
Monitoring aerosol over Europe using AATSR HIRAM final report
R.B.A. Koelemeijer, M. Schaap*, R.M.A. Timmermans*, T. van Noije, J. Matthijsen, P.J.H. Builtjes*, R. Schoemaker**, G. de Leeuw**
* TNO Bouw en Ondergrond ** TNO Defensie en Veiligheid
Contact:
Robert Koelemeijer
Milieu- en Natuurplanbureau (MNP) Luchtkwaliteit en Europese Duurzaamheid Robert.Koelemeijer@mnp.nl
This investigation has been funded in part by the Netherlands Agency for Aerospace Programmes (NIVR), within the framework of project E/555034/02, HIRAM, NIVR project code 53516 RI.
Netherlands Environmental Assessment Agency (MNP), P.O. Box 303, 3720 AH Bilthoven, telephone: +31 30 274 2745; www.mnp.nl
Rapport in het kort
Monitoring van aerosol in Europa met AATSR HIRAM-eindrapport
Fijnstofconcentraties zijn moeilijk vergelijkbaar tussen verschillende EU-lidstaten omdat verschillende meetmethoden worden gehanteerd. In dit rapport is onderzocht of satellietmetingen (AATSR) kunnen worden gebruikt om fijnstofconcentraties op Europese schaal beter in kaart te brengen. Het is daarmee een vervolg op het PARMA-project, waarin een vergelijkbare studie is gedaan met behulp van MODIS-satellietgegevens. De AATSR-gegevens uit 2003 bleken echter van mindere goede kwaliteit dan de MODIS-AATSR-gegevens. De belangrijkste foutenbron in de AATSR-gegevens is gerelateerd aan het niet voldoende detecteren van bewolking, waardoor de hoeveelheid aerosol abusievelijk te hoog wordt gemeten. Het verbeteren van de wolkendetectie in AATSR is nodig voordat deze gegevens kunnen worden toegepast voor het verbeteren van fijnstofkaarten.
Contents
Summary 5
1. Introduction 8
2. Data sources 11
2.1 Aerosol optical thickness from AATSR 11
2.1.1 The AATSR instrument 11
2.1.2 Retrieval procedure 11
2.2 Particulate matter concentrations from AirBase 12
3. Initial assessment of AATSR AOT data 15
4. Validation of AATSR 17
4.1 Validation of AATSR using AERONET 17
4.2 Cloud contamination issues 20
4.3 The use of AATSR data in the analysis part of the study 21 4.4 Comparison of ‘screened’ AATSR data with MODIS 23
5. Mapping of PM2.5 – statistical approach 27
6. Mapping of PM2.5 – assimilation approach 31
6.1 Extensions to the model system 31 6.2 Model results for PM in LOTOS-EUROS in 2003 33
6.2.1 PM10 and PM2.5 33
6.2.2 Secondary inorganic aerosol 35
6.2.3 Carbonaceous particles 36
6.3 Assimilation experiment for summer 2003 36
6.3.1 Assimilation approach 36
6.3.2 Assimilation results for the AOT 38
6.3.3 Validation of the assimilated AOT 41
6.3.4 Assimilation results for PM2.5 43
6.4 Assimilation experiment for August, 1997 44
6.4.1 Model results without assimilation 44
6.4.2 Assimilation results for the AOT 45
6.4.3 Assimilation results for PM2.5 45
7. Radiative forcing analysis 47
8. Discussion and conclusions 51
References 55
Appendix A The LOTOS-EUROS model system 62
A1. Model description 62
Summary
Both for the assessment of exposure of the population to particulate matter (PM) and for the assessment of climate forcing by aerosols, it is mandatory to reduce the uncertainties concerning aerosol or particulate matter abundances. At present all EU member states perform air quality measurements, but the diversity and quality of the ground network hampers a comparison of absolute PM levels across member states. Satellite measurements are less precise than ground based measurements, but they have the advantage that they provide full spatial coverage and are – in principle – consistent for the whole European region. This suggests that satellite measurements may be useful to improve the insight in aerosol distributions in Europe in combination with models and ground based measurements. Indeed, in the PARMA project (Monitoring Particulate Matter for Climate and Health Effects in Europe), carried out by MNP and TNO in the period 2004-2006 (Koelemeijer et al., 2006a), it was shown that adding satellite information from the Moderate Resolution Imaging Spectroradiometer (MODIS) to modelled fields and ground based measurements leads to a better description of PM distributions in Europe. This report presents the final results of the HIRAM project (High-Resolution Air quality Monitoring over Europe). In this project the use of satellite data from the Advanced Along-Track Scanning Radiometer (AATSR) instrument (on board ENVISAT) is investigated. The results of this project are therefore complementary to the PARMA study. The results are presented along the following lines:
• Validation of AATSR data;
• Mapping of PM2.5 using the AATSR data;
• Radiative forcing of nitrate and sulphate based on simulations. Validation of AATSR by comparison to AERONET and MODIS
In the project the validation of data from the AATSR received extra attention, by using independent AERONET ground based observations of aerosol optical thickness (AOT), and by comparison with MODIS data. In this study, a one-year dataset of AATSR aerosol optical thickness data over Europe has been processed for the first time. Because of the large data volume, it was decided to make the cloud detection part of the retrieval algorithm fully automatic. However, without rigorous cloud-screening, the large scale distribution of AOT from AATSR in 2003 appeared to be unrealistic. Also, large point sources or source areas such as major cities and even larger scale hot-spot regions could barely be detected. Comparison with MODIS yearly average AOT in 2003, as well as ATSR-2 data revealed large differences in spatial distribution of the AOT. It was found that the time correlation between AERONET and AATSR, averaged over all stations, was 0.53 (0.59 median), while it was 0.65 (0.73 median) using MODIS data. Largest errors in AATSR were found in Northern and Eastern Europe, and are likely related to undetected clouds or insufficient surface correction in cases with snow or ice cover. The spatial correlation between yearly average AOT values from AATSR and AERONET was much lower than that using MODIS data. The validation also showed that AATSR has almost no bias, while MODIS did show a significant bias against AERONET. However, it was shown in the PARMA study that the bias in MODIS has a clear seasonality, and could be largely corrected for in a straightforward manner. Nevertheless, the reasons for the bias and its seasonal behaviour have not yet been fully elaborated and understood.
In this project, it was found that about 50% of the AATSR data in 2003 need to be discarded from further use because of potential contamination by clouds or by insufficient surface correction in cases with snow or ice cover. For MODIS about 33% of the data is potentially contaminated by clouds or snow. In the case of AATSR, contamination of the retrieved AOT by clouds and snow-coverage is the dominating source of error. The main conclusion is that the detection of clouds and snow-coverage needs to be improved before the AATSR retrieval method can be used in a non-supervised mode for air quality studies in Europe. Besides, the lower accuracy as compared to MODIS, also the number of AATSR observations is much more limited because of the small swath width. It turns out that in practice about 65 AATSR observations are available per year for a given location, while MODIS (Terra and Aqua combined) has about 240 observations per year for a given location.
Results of the PM2.5 mapping experiments
Similar to the PARMA project, two different approaches were followed to use satellite AOT data for PM2.5 mapping: a statistical approach and a data-assimilation approach. In an attempt
to avoid the large problems with cloud (and snow/ice) contamination in the AATSR data, a selection criterion was used for additional cloud-screening, based on monthly average data. This screened dataset was used for the statistical approach to map PM2.5. Visual inspection
shows that this leads to better performance for Northern Europe and better agreement with the results from the PARMA study. In the assimilation approach used to map PM2.5,
instantaneous data are used and a similar cloud-screening method, based on monthly average data, was not possible. Therefore we have used the MODIS cloud detection in an attempt to avoid cloud contamination in AATSR.
The spatial correlation coefficient between the yearly AOT retrieved from AATSR and the yearly average AOTF from MODIS is 0.58, after additional cloud screening of the AATSR
data. This indicates that these satellite instruments still show substantial differences in aerosol optical thickness distributions. Since the statistical mapping approach is based on both model calculations and measurements, the resulting PM2.5 maps based on AATSR and MODIS
differs less than the AOT fields. Therefore, the results of the statistical mapping approach were to some extent comparable to MODIS, after application of an additional cloud-screening of the AATSR data. However, there are reasons suggesting that the MODIS based map, resulting from the PARMA study, is more realistic than the map based on AATSR, presented in this report. First, bias-corrected MODIS data show a better comparison with independent AOT measurements from AERONET, as compared to AATSR versus AERONET. Second, the fitted PM2.5 map based on MODIS exhibits smaller residuals when
compared with PM2.5 measurements from AirBase. Third, the MODIS results are less
sensitive to more-or-less arbitrary methodological choices.
Similar to the conclusion of the PARMA study, the assimilation leads to higher PM2.5
concentrations compared to the free model run, as the model underestimates the AOT. For a discussion on these issues we refer to the PARMA report. The limited amount of AATSR data for the months June and July 2003 have, when assimilated, a limited influence on the modelled PM2.5 fields. In other words, the AATSR data do not strongly constrain the model
in the assimilation.
Radiative forcing of nitrate compared to sulphate
In this study, also aerosol radiative forcing aspects were investigated. Based on our simulations for 2003, the annual radiative forcing by nitrate is calculated to be in the order of 55% of that by sulphate, whereas for 1995 the percentage was only 20% (Schaap, 2003). In
summer, nitrate is found to be only regionally important, e.g. in Northwestern Europe, where the forcing of nitrate equals that by sulphate. In the winter the nitrate forcing over Europe is about equal to the sulphate forcing. These results are in agreement with estimates based on measured data (Ten Brink et al., 1997; Schaap et al., 2002). It is concluded that nitrate forcing is significant and gaining importance compared to sulphate and should thus be taken into account to estimate the impact of regional climate change in Europe.
1.
Introduction
Particulate matter (PM) is a major environmental factor affecting public health in Europe. Even today, in Europe still some 35% of the urban population is exposed to PM10
concentrations above EU limit values (EEA, 2004). In the past decades, many studies have identified and quantified health effects of short-term exposure to particulate matter (e.g., Brunekreef and Holgate, 2002; Knol and Staatsen, 2005). Effects of long-term exposure to particulate matter are much more uncertain than the short-term effects, but are believed to have a much greater effect on health loss (Dockery et al., 1993; Pope et al., 1995; 2002). Within the EU’s Clean Air For Europe programme (CAFE), a health assessment was made of long-term exposure to particulate matter. In that assessment, it was concluded that currently in the EU there is a loss in statistical life expectancy of over 8 months due to PM2.5 in air,
equivalent to 3.6 million life years lost annually (EU, 2005).
Aerosols also affect the environment by modifying the radiative budget of the Earth (direct and indirect radiative forcing). Recent estimates of direct radiative forcing by reflective aerosols (like sulphates) amount to about -1 to -1.5 W/m2 (IPCC, 2001; Hansen and Sato,
2001), compared to a positive forcing of +2.5 W/m2 by the well-mixed greenhouse gases. Absorption of solar radiation by aerosols is primarily due to black carbon (soot) aerosols, and is estimated to exert a forcing of +0.25 to +0.5 W/m2. The effect of aerosols on cloud properties (indirect radiative forcing) is even more uncertain. IPCC (2001) estimates a net forcing of -1 W/m2, with an uncertainty of at least a factor of 2. These numbers are estimates at the global scale; regional forcings and their uncertainties can be considerably larger.
Both for the assessment of exposure of the population to PM and for the assessment of climate forcing by anthropogenic aerosols, reducing the uncertainties concerning aerosol or particulate matter abundances is mandatory. At present all EU member states perform air quality measurements to check compliance with the limit values. Ground-based aerosol measurements are relatively precise and available with high temporal resolution, but they are representative for only a limited area, as there can be large spatial concentration gradients particularly in urban areas. Moreover, it is widely recognised that it is very difficult to accurately measure the absolute PM level on a routine basis (CAFE WGPM, 2004). This makes it virtually impossible to achieve a representative overview across Europe based on ground-based measurements only. While chemical transport models are an important tool to improve the understanding of PM concentration distributions, the quality of anthropogenic emission inventories is still seriously hampering models to generate accurate results. Moreover, the contributions from natural sources are hard to quantify, due to limited knowledge of the emission processes. Satellite measurements are less precise than ground based measurements, but they have the advantage that they provide full spatial coverage and are – in principle – consistent for the whole European region. This suggests that satellite measurements may be useful to improve the insight in aerosol distributions in Europe in combination with models and ground based measurements.
In the past few years, many studies have appeared that investigate the usefulness of satellite measurements of AOT for improvement of PM2.5 monitoring. Several studies in the U.S. have
reported good temporal correlations between satellite derived AOT and PM2.5 surface
concentration measurements in parts of the U.S. (Wang and Christopher, 2003; Hutchison, 2003). In general, promising correlations are found between one-month time-series of AOT
and PM2.5 for many stations in the Eastern and Midwest U.S. Other stations, however,
particularly in the Western U.S., show hardly any correlation (Engel-Cox et al., 2004). Variations in local meteorological conditions, occurrence of multiple aerosol layers, and variations in aerosol chemical composition likely play an important role in determining the strengths of such correlations. For a location in Europe (the AERONET station at Ispra, Northern Italy), Chu et al. (2003) have shown that time-series of AOT and 24-h average PM10
measurements correlate well, for a period of several months in 2001 with stable meteorological conditions. Recently, Van Donkelaar et al. (2006) studied the usefulness of satellite AOT measurements of the Moderate Resolution Imaging Spectroradiometer (MODIS) and the Multi-angle Imaging Spectroradiometer (MISR) for assessment of spatial variations of PM2.5 in North-America. They concluded that the spatial variation in yearly
average PM2.5 derived from satellite instruments MODIS and MISR exhibited significant
agreement with those from the surface networks in Canada (NAPS) and the U.S. (AQS). They found better agreement using MODIS data than using MISR data. For Europe, the first comparison of spatial and temporal variations in PM and AOT from MODIS was reported in Koelemeijer et al. (2006b), and a more extensive analysis was reported in the PARMA (Monitoring Particulate Matter for Climate and Health Effects in Europe) final report (Koelemeijer et al., 2006a). Within that project, Van de Kassteele et al. (2006) applied a statistical approach to map PM10 concentrations in Europe using secondary information from
MODIS and the LOTOS-EUROS model.
In the PARMA project, MODIS satellite observations of aerosol optical thickness (AOT) were used to improve the mapping of yearly average PM2.5 concentrations in Europe in 2003.
Similar to the present study, two different approaches were followed to use AOT data for PM2.5 mapping: a statistical approach and a data-assimilation approach. In the PARMA
project, first the MODIS AOT data were validated against independent AERONET AOT observations. It was found that the spatial correlation of yearly averages MODIS and AERONET AOT data is 0.72 (using the ‘fine’ fraction of the MODIS AOT, AOTF). Also the
temporal correlation between MODIS and AERONET is generally high. However, the results show that MODIS systematically overestimates AERONET data. The bias could be characterized, however, and corrected for. In the PARMA project, it was concluded that both the statistical mapping and assimilation methods led to a better description of the spatial gradients in the yearly average PM2.5 field in Europe as compared to modelled results only.
Generally, the spatial features in the PM2.5 map based on the statistical mapping approach
resembled that of the assimilation approach in the central part of the model domain (North-West Europe).
This report presents the final results of the HIRAM project (High-Resolution Air quality Monitoring over Europe). The HIRAM project is complementary to and an extension of the project PARMA, which was carried out by MNP and TNO in the period 2004-2006 (Koelemeijer et al., 2006a). Where in the PARMA project satellite data from MODIS were exploited, in the HIRAM project the use of data from AATSR (on board ENVISAT) is investigated. The advantage of AATSR data compared to MODIS is that AATSR observes each atmospheric volume under two different observation angles, one in a forward view, and a few minutes later, in nadir view (i.e., looking straight down to the Earth). This observation strategy allows a better discrimination between surface reflection and reflection by aerosols in the atmosphere, and hence, in principle, a higher accuracy of the retrieved AOT. The AATSR aerosol retrieval algorithm that is currently used by TNO, has been significantly modified with respect to the ‘scientific’ algorithms that were used in earlier projects, to allow for the automatic processing of large amounts of data. However, it appeared during the course
of the HIRAM project that the current semi-operational algorithm does not provide aerosol information of similar quality as that from the ‘scientific’ algorithms. Comparison with AERONET stations in Europe shows that in nearly 40% of the cases the time correlation is less than 0.5. Furthermore, the spatial distributions in the AATSR AOT data for 2003 are different from those observed by MODIS in 2003 and by ATSR-2 in August 1997 (Roblez-Gonzales et al., 2000; Roblez-(Roblez-Gonzales et al., 2003), and are not in agreement with aerosol distributions expected from chemical transport model calculations. In particular, the current AATSR algorithm performance appears to provide unrealistic results over northern Europe (Ireland, UK, Scandinavia and Finland). It is likely that the reduced performance of AATSR (compared to MODIS or ATSR-2) is at least partly due to the performance of the automatic cloud detection procedures. Therefore, a major part of this study has been devoted to the
validation of AATSR data as provided using the current semi-operational algorithm, through
comparison with AERONET ground based measurements of AOT. As part of the validation, a method was developed to estimate the percentage of cloud contaminated satellite AOT data. Also, criteria were developed by which part of the erroneous data could be identified and removed. These ‘screened’ AATSR data could however no longer be used to study AOT at a high spatial resolution, because too few data were left after this screening to allow a meaningful analysis at high spatial resolution. The analysis part of this study has therefore focussed on analysing PM2.5 variations over Europe at 10x10 km2 resolution. The results have
been compared to those obtained in the PARMA project. Also, an analysis is made of trends in radiative forcing by sulphate and nitrate aerosols.
The report is structured as follows. The primary data sources for the analysis of PM2.5,
AATSR and AirBase, are described in chapter 2. The AATSR AOT measurements are presented in chapter 3, and an initial assessment of AATSR data is made there by comparing to ATSR-2 and MODIS data. In chapter 4, a quantitative validation is performed using independent AOT observations from the ground based AERONET network, and cloud contamination issues are discussed in detail. In that chapter, also a methodology is described how AATSR data are treated in the analysis part of the project, and a quantitative comparison is made with the MODIS data as used in the PARMA project. In chapters 5 and 6, PM2.5
analyses are presented using the statistical mapping and assimilation approaches, respectively. In chapter 7, an analysis is made of trends in radiative forcing by sulphate and nitrate aerosols. Conclusions are presented in chapter 8.
2.
Data sources
Measurements of aerosol optical thickness were obtained from the AATSR instrument on ENVISAT. The AATSR instrument and retrieval method have been described in section 2.1. Daily and hourly particulate matter measurements were extracted from the AirBase database, and are described in section 2.2.
2.1
Aerosol optical thickness from AATSR
2.1.1 The AATSR instrument
The Advanced Along-Track Scanning Radiometer (AATSR) instrument onboard the European ENVISAT satellite revolves the Earth at an altitude of approximately 800 km in a sun-synchronous polar orbit. The AATSR is almost identical to the ATSR-2 instrument, and has seven wavelength bands in the visible and infrared parts of the spectrum (measurement wavelengths are at 0.55, 0.67, 0.87, 1.6, 3.7, 11 and 12 µm; see Koelemeijer et al., 1998). The instrument has a conical scanning mechanism providing two views of the same location with a resolution of 1x1 km2 at nadir view. The radiometer views the surface along the direction of the orbit track at an incidence angle of 49° as it flies toward the scene and some 150 seconds later it records a second observation of the scene at an angle close to the nadir view. The swath width of 512 km results in an overpass over a given location in Europe every three days. An AOT retrieval at each location can only be made in cloud-free conditions, however.
2.1.2 Retrieval procedure
The semi-operational AATSR algorithm that is used for HIRAM is based on the scientific ATSR-2 algorithms developed by Veefkind et al. (1998a, 1998b, 1999, 2000) and Robles González et al. (2000). The dual view is used over land and a single view is used over water. The aerosol properties retrieved with these algorithms are the aerosol optical thickness (AOT) at the available wavelengths (0.55, 0.67, 0.87 and 1.6 μm) and the Ångström coefficient α that provides the AOT wavelength dependence which contains information on the shape of the aerosol size distribution. Over land the AATSR dual view algorithm uses both the forward and the nadir view to eliminate surface reflections (see Flowerdew and Haigh, 1995) from the total reflected solar light measured at the top of the atmosphere. This is necessary because the land surface reflections are variable and often of similar magnitude as the aerosol signal. If the land reflectance is not properly accounted for, this may lead to large errors in the retrieved aerosol parameters. Retrievals are available on the scale of the pixel size of 1x1 km2 (level 2) and averaged over larger scales (level 3) for European maps. AATSR satellite measurements of the radiation at the top of the atmosphere are input for the semi-operational AATSR aerosol retrieval algorithm. The AATSR swath of 512 km allows for an overpass over each geolocation every three days, between 10 and 11 A.M. The retrieval method follows the schematic in Figure 2.1.
The aerosol model used in this work is an external mixture of anthropogenic aerosol (sulphate/nitrate water soluble) and sea salt. The effective radius of the anthropogenic aerosol is 0.05 µm. The optical properties are based on the anthropogenic water soluble aerosol with effective radius reff = 0.03 µm as defined in Volz (1972). The sea salt aerosol has an effective
radius of 1 µm with optical properties as defined in Shettle and Fenn (1979). A Mie scattering code and the Radiative Transfer Model DAK (Stammes, 2001) are used for the generation of
Look-up tables (LUTs). Cloud-free pixels are essential for a proper retrieval of aerosol properties; hence an automatic cloud detection procedure is used consisting of three tests for cloud detection. These tests are based on cloud detection routines initially developed for off-line (manually supervised) application by Koelemeijer et al. (2001). The method was adapted for semi-automatic application by Robles González et al.(2003) to allow processing of larger datasets in reasonable time. After cloud detection, radiative transfer calculations are performed to correct the measured satellite signal for absorption by ozone, for contributions by the surface and for molecular (Rayleigh) scattering. Finally, the corrected TOA (Top of the Atmosphere) reflectance at the satellite sensor is compared with the modelled reflectances in iterative steps in order to select the right aerosol mixture. This procedure is based on a look-up table approach. Measured and modelled reflectances are matched using an error minimization procedure to determine the most likely aerosol mixture and the AOT for the available AATSR wavelengths (Robles González et al., 2000; 2003).
Figure 2.1 Schematic overview of the semi-operational retrieval algorithm.
Daily AOT maps over Europe are produced for the 1x1 km2 sensor resolution. The final AOT maps for the European scale are given as a product with a resolution of 10x10 km2 (roughly 0.1o x 0.1o over Europe) by means of an automatic post-processing step, where the AOT values for the individual AATSR pixels in each 10x10 km2 area are averaged.
2.2
Particulate matter concentrations from AirBase
Since the adoption of the EU air quality directives (EU, 1996; 1999), mass concentration measurements in Europe are performed operationally for particles smaller than 10 micron in diameter (PM10). In the past few years, also more and more measurement sites are emerging
for particles smaller than 2.5 micron in diameter (PM2.5), as a new air quality standard for
These PM data are submitted to the AirBase data of the European Topic Center on Air and Climate Change (ETC-ACC) of the European Environment Agency (EEA). This database consists of hourly or daily averaged values of PM, and meta-data, such as the latitude and longitude coordinates of the station, its altitude, and information on its surroundings (urban background, (sub)urban background, street, industrial), measurement technique, et cetera. The EU reference method to measure PM10 concentrations is described in CEN standard EN
12341, adopted by CEN in November 1998 (EN 12341, 1998). The mass collected on the filter is determined gravimetrically by means of a microbalance under well-defined environmental conditions. This is the reference method under the First Daughter Directive and gives, by definition, the ‘correct’ PM10 results. However this method is not suitable for
operational application. For operational measurements, often the beta-absorption method and tapered element oscillating microbalance (TEOM) are used. In the beta-absorption method, the amount of particles on the filter is determined by measuring the attenuation of a beam of beta-radiation (electrons) which are send through the filter. The attenuation is proportional to the mass of the aerosols on the filter. The TEOM makes use of the change in eigen-frequency of a tapered glass element that is connected to the filter. The change in eigen-frequency is determined by the mass of particles attached to the filter. Operational measurements of
absolute levels of PM have considerable uncertainty. A major reason for this is volatilization
of aerosols because of heating the air sample in the measurement process. This heating is necessary to avoid humification of the filter. The amount to which volatilization occurs depends on the environmental conditions and composition of the particles. Often the results from beta-absorption instruments as well as the TEOM underestimate the concentration due to these problems (e.g. Hitzenberger et al., 2004; Charron et al., 2004). Therefore, if beta-absorption or TEOM is used to determine PM, measurement results have to be corrected by a correction factor to produce results equivalent to the reference method. These correction factors can vary substantially in space and even seasonally (CAFE-WGPM, 2004). Differences between correction factors and the application itself hamper integration on a European scale of all PM10 data. An overview of correction factors used for data in the
AirBase database is given in Buijsman and De Leeuw (2004).
No European Reference Method for the measurement of the PM2.5 fraction has been
established up to now. Such a standard is currently being developed by CEN (CEN TC 264/Working Group 15) under a mandate of the European Commission. As for PM10, the
method is based on the gravimetric determination of the PM2.5 fraction of particles in the air,
sampled at ambient conditions. For operational applications, often the beta-absorption and TEOM methods are used, but no overview exists of correction factors and their application. Most PM measurement stations are representative for background conditions in rural, sub-urban and sub-urban areas. In this study we have used rural background stations only, because these are representative for areas that are comparable to the size of an AOT measurement. In 2003, 28 European countries submitted their PM10 data and 11 countries their PM2.5 data to
AirBase. Most stations only deliver daily averaged PM concentrations to AirBase. From the 88 PM2.5 stations that delivered daily average data, 23 stations also delivered hourly data. The
meta-information in AirBase includes a description of the surroundings (rural, suburban of urban), the type of station (traffic, background, or other), the measurement method used, the altitude et cetera. A number of elementary quality checks have been done on the AirBase data, such as removing data from stations with clearly erroneous latitude/longitude coordinates.
3.
Initial assessment of AATSR AOT data
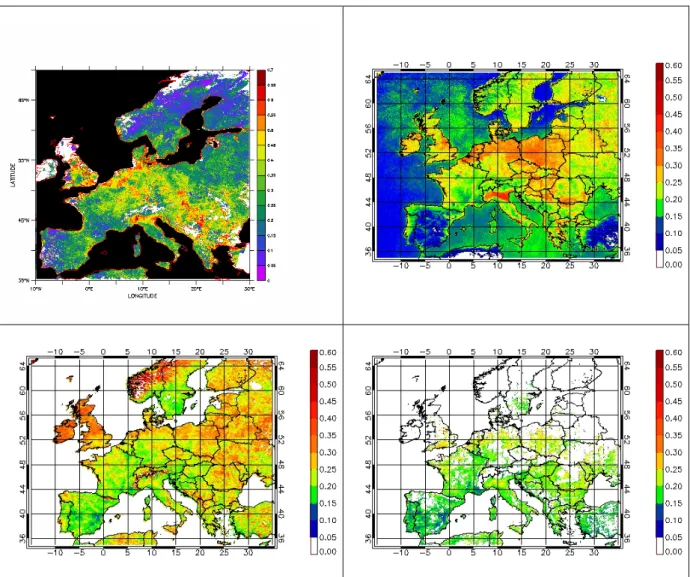
In this chapter, AATSR AOT maps are presented for 2003, and a qualitative comparison is made between AOT maps derived from ATSR-2 (August 1997), AATSR (2003), and MODIS (2003).
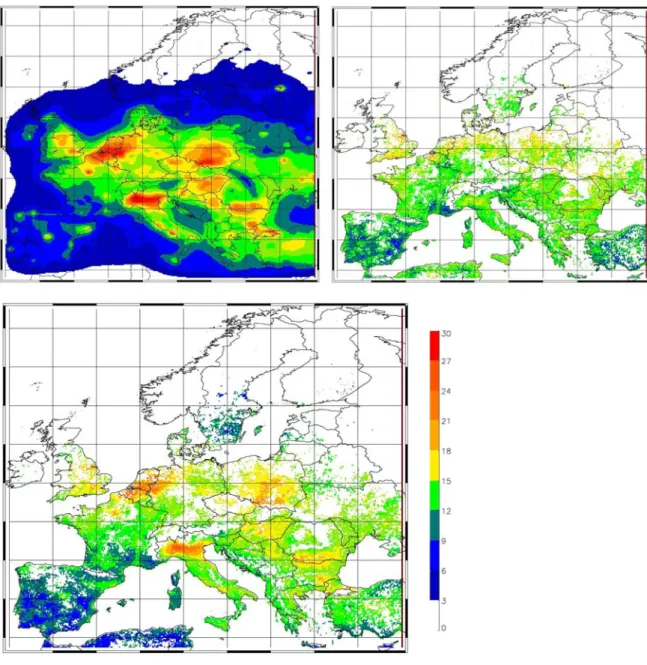
The image of ATSR-2 derived monthly average aerosol optical thickness for August 1997 is shown in Figure 3.1 (top left) (Robles González et al., 2000). Large variations in mean AOT are observed across Europe. For example, mean AOT values of 0.5-0.6 occur over certain areas over Germany, Belgium, the South of the Netherlands and Northern Italy. In contrast, AOT values of 0.1 to 0.2 were observed over Scandinavia, Central Spain, Southern France and Russia. The high AOT values are often associated with strongly industrialized areas, with large emissions of both primary PM emissions and aerosol precursor gases (SO2 and NOx).
Sudden increases of a factor of 3 or more over relatively short distances may be accompanied by a gradual decrease over hundreds of km, presumably down wind from the source. An example is the variation of AOT over Western Germany and Belgium. Strong gradients are also observed in northern Italy. Aerosols produced in the heavily industrialized areas around Milan and Turin are trapped in the Po Valley. Because the Alps in the North and the Apennines in the South form natural barriers, aerosols can only be vented through the Po Valley to the Adriatic Sea (Robles González et al., 2000).
The MODIS yearly average AOTF (fine fraction AOT) for 2003 was used in the PARMA
study and is depicted in Figure 3.1 (top right). The MODIS map of 2003 shows, to some extent, similar spatial structures as that derived from the ATSR-2 map of August 1997. The Po Valley and Benelux area also show up in the MODIS map, as well as high values in Central-Europe and the Balkan countries, albeit that over Northern Germany and Poland, the MODIS AOT is substantially higher than that of ATSR-2 in August 1997. Part of this difference between 2003 and August 1997 can be ascribed to differences in the meteorological conditions, particularly over Poland (see sections 6.3 and 6.4).
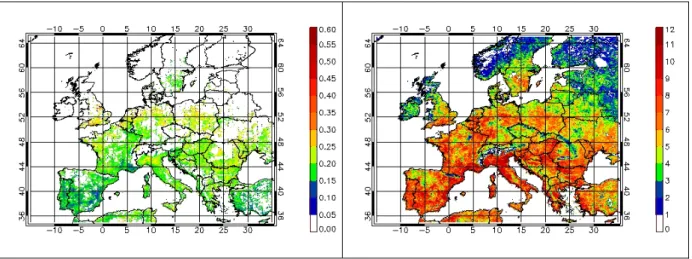
The initially retrieved yearly average map of AOT for 2003 derived from AATSR (i.e., without additional cloud/snow screening) is shown in Figure 3.1 (bottom, left). It is clear that the spatial structures are very different from the AOT distribution derived from ATSR-2 for August 1997, and from the MODIS map of 2003. The annual average AOT values from AATSR in 2003 show unrealistically high values in Northern Europe, particularly in Ireland, UK, Scandinavia and Finland, and over mountain regions (Alps, Pyrenees). Furthermore, it is apparent that large cities cannot be distinguished clearly in the 2003 data, in contrast to the ATSR-2 data of August 1997.
It is likely that the difference between the ATSR-2 image of August 1997 and the AATSR image for 2003 is caused by a difference in cloud detection algorithm. In case of August 1997, the semi-automatic cloud detection was checked visually, whereas a fully automatic procedure was used for 2003. Visual inspection of individual images was not possible for this large dataset. As a result however, it is likely that relatively many cloud or snow-contaminated AATSR pixels have erroneously been classified as cloud-free in the AATSR data of 2003, which leads then to unrealistically high values for the retrieved AOT. This issue is further investigated in chapter 4.
Due to these problems the AATSR results per se could not be used for mapping PM distributions. A severe data selection has been applied in an attempt to partly resolve this problem (see section 4.3). This leads to an large reduction of the number of useable data points (Figure 3.1, bottom right), but what is left appears more realistic than the initial retrieval. Obviously, such data selection could be avoided if the AATSR algorithm would be improved, which is imperative for the future use of this algorithm.
In conclusion, the AATSR data for 2003 show large differences compared to MODIS data for 2003 and ATSR-2 data of August 1997. Given these differences, we have put emphasis on the validation of the AATSR and MODIS products in this study.
Figure 3.1 Aerosol optical thickness over Europe derived from ATSR-2 data (top left, average August 1997), MODIS (top right, average 2003) and AATSR (bottom left, initial average 2003) and AATSR (bottom right, screened average 2003). White area: no data available.
4.
Validation of AATSR
In section 4.1, AATSR validation is performed by comparing the AATSR retrieved AOT values with ground-based measurements of AOT from the AERONET network. This validation is – by definition – limited to nearly cloud-free conditions, as AERONET data of AOT are only available under nearly cloud-free conditions. The extent to which AATSR (and MODIS) data are affected by cloud contamination is therefore estimated in section 4.2. The consequences of the validation results for the analysis part of this study are described in section 4.3. In that section additional cloud-detection checks are suggested (applicable to monthly average data only). The resulting monthly and yearly average AOT map (i.e., after application of these additional checks) are referred to as ‘screened’ AATSR data. A detailed comparison of these ‘screened’ AATSR data with MODIS data is presented in section 4.4.
4.1
Validation of AATSR using AERONET
AERONET is a ground-based global network consisting of many sun photometers that measure the AOT in the atmospheric column from ground to sun, with an accuracy between ±0.01 and ±0.015 (Eck et al., 1999). This accuracy is considerably higher than the retrieval accuracy of current satellite instruments like AATSR and MODIS, and hence is suited for validation. In the past, limited validation of ATSR-2 retrievals over Europe using AERONET has indicated agreement of AOT values of ATSR-2 and AERONET within ±0.06 over land and ±0.04 over sea (Robles González et al., 2003).
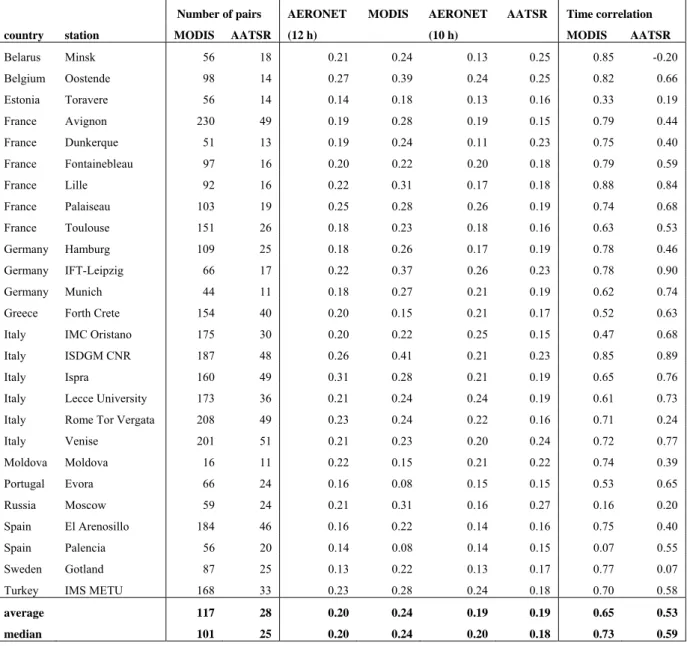
Here an extensive validation of AATSR data has been performed for Europe for 2003. The validation results for AATSR have been compared with validation results of MODIS, to allow comparison with the PARMA study (Koelemeijer et al., 2006a). The validation statistics are shown in Table 4.1. Only stations are shown with more than ten days with both AATSR and AERONET data. AERONET AOT data were acquired between 9:00 and 11:00 hours, i.e., close to the time of the AATSR overpasses (10:00), and between 11:00 and 13:00 hours, i.e., close to the time of the MODIS overpasses (10:30 and 13:30). The comparison results of MODIS and AERONET are slightly different compared to the PARMA study, as the number of stations is more limited here.
The first observation is that the yearly average AOT retrieved from AATSR has only a small bias compared with AERONET. Averaged over all stations the bias is zero on average. MODIS systematically overestimates the AOT (bias averaged over all stations is +0.04 using the AOTF). In the PARMA study, it was found however, that the bias in MODIS AOT and
AOTF showed a distinct seasonal variation, and could therefore be partly characterized and
corrected for in a straightforward manner. The standard deviation of the difference between AATSR and AERONET is ±0.13, based on all 760 pairs AERONET-AATSR in the 2003 dataset. In case of MODIS AOTF, and after correcting for the time-dependent bias according
to the PARMA study, the standard deviation is ±0.11, based on 3400 pairs of MODIS-AERONET in the 2003 dataset, and after correcting for the time-dependent bias in the AOTF.
Hence, the standard deviation of the difference with AERONET is slightly higher for AATSR compared to MODIS. The 1-sigma RMS-error of MODIS of ±0.11 is consistent with that quoted in the literature, which is ±0.05±0.2*AOT.
However, the time correlations of AATSR with AERONET are less than 0.50 for nearly 40% of the stations. A similar comparison shows a better performance for MODIS (15% has a time correlation smaller than 0.50). The time correlation averaged over all stations is 0.53 (0.59 median), while it was 0.65 (0.73 median) using MODIS data. It is apparent that stations with a low time-correlation often correspond to stations where AATSR has a much higher yearly average AOT than AERONET (Belarus, Estonia, Russia, Sweden). This suggests that there is residual cloud contamination in the satellite data leading to too high AOT values and low correlation coefficients. It is also apparent these stations are predominantly located in Northern and Eastern Europe. The spatial correlation between yearly average AOT values from AATSR and AERONET is very low (0.36) whereas for MODIS it was 0.72 (using the AOTF).
The number of collocated pairs of AERONET and AATSR data is about five to six times lower than the number of collocated pairs using MODIS data. This is because MODIS has a much higher temporal coverage (twice daily) compared to AATSR (once every three days for Europe).
Table 4.1 Statistics of AOT observations of AERONET and AATSR in Europe in 2003. For
comparison, MODIS AOTF observations are shown as well.
Number of pairs AERONET MODIS AERONET AATSR Time correlation country station MODIS AATSR (12 h) (10 h) MODIS AATSR
Belarus Minsk 56 18 0.21 0.24 0.13 0.25 0.85 -0.20 Belgium Oostende 98 14 0.27 0.39 0.24 0.25 0.82 0.66 Estonia Toravere 56 14 0.14 0.18 0.13 0.16 0.33 0.19 France Avignon 230 49 0.19 0.28 0.19 0.15 0.79 0.44 France Dunkerque 51 13 0.19 0.24 0.11 0.23 0.75 0.40 France Fontainebleau 97 16 0.20 0.22 0.20 0.18 0.79 0.59 France Lille 92 16 0.22 0.31 0.17 0.18 0.88 0.84 France Palaiseau 103 19 0.25 0.28 0.26 0.19 0.74 0.68 France Toulouse 151 26 0.18 0.23 0.18 0.16 0.63 0.53 Germany Hamburg 109 25 0.18 0.26 0.17 0.19 0.78 0.46 Germany IFT-Leipzig 66 17 0.22 0.37 0.26 0.23 0.78 0.90 Germany Munich 44 11 0.18 0.27 0.21 0.19 0.62 0.74 Greece Forth Crete 154 40 0.20 0.15 0.21 0.17 0.52 0.63 Italy IMC Oristano 175 30 0.20 0.22 0.25 0.15 0.47 0.68 Italy ISDGM CNR 187 48 0.26 0.41 0.21 0.23 0.85 0.89 Italy Ispra 160 49 0.31 0.28 0.21 0.19 0.65 0.76 Italy Lecce University 173 36 0.21 0.24 0.24 0.19 0.61 0.73 Italy Rome Tor Vergata 208 49 0.23 0.24 0.22 0.16 0.71 0.24 Italy Venise 201 51 0.21 0.23 0.20 0.24 0.72 0.77 Moldova Moldova 16 11 0.22 0.15 0.21 0.22 0.74 0.39 Portugal Evora 66 24 0.16 0.08 0.15 0.15 0.53 0.65 Russia Moscow 59 24 0.21 0.31 0.16 0.27 0.16 0.20 Spain El Arenosillo 184 46 0.16 0.22 0.14 0.16 0.75 0.40 Spain Palencia 56 20 0.14 0.08 0.14 0.15 0.07 0.55 Sweden Gotland 87 25 0.13 0.22 0.13 0.17 0.77 0.07 Turkey IMS METU 168 33 0.23 0.28 0.24 0.18 0.70 0.58
average 117 28 0.20 0.24 0.19 0.19 0.65 0.53
For a few stations, time series have been investigated in more detail. For Avignon, the correlation over the entire year 2003 is 0.44. Figure 4.1 (top) shows the time series of both AERONET and AATSR at this station. The agreement between both measurement methods is reasonably good over the summer period, however at the end of the year some AATSR measurements show larger deviations from the AERONET measurements, and are higher than the AERONET measurements. Indeed the correlation over the April-September period is much higher, 0.74 than over the entire year. The station ISDGM-CNR has a high correlation of 0.89 and does not show these large differences between AATSR and AERONET (Figure 4.1, bottom). After investigation, the deviating points visible in the AATSR time series of Avignon correspond to average AOT values at 10x10 km2 resolution where only a few measurements were available. This indicates that the other AATSR 1x1 km2 pixels in this 10x10 km2 area are identified as cloudy. It is possible however that the 1x1 km2 pixels identified as being clear are in reality also contaminated by clouds.
Avignon 0 0.1 0.2 0.3 0.4 0.5 0.6 0.7 0.8 0 50 100 150 200 250 300 350 Daynumber (in 2003) AO T AERONET all AATSR ISDGM-CNR 0 0.2 0.4 0.6 0.8 1 1.2 1.4 1.6 0 50 100 150 200 250 300 350 Daynumber (in 2003) AOT AERONET all AATSR
Figure 4.1 Temporal variation of AERONET AOT and AATSR AOT Avignon (France, top) and at ISDGM-CNR (Italy, bottom).
4.2
Cloud contamination issues
The validation with AERONET is by definition biased to clear-sky situations, as only AERONET AOT data are available under (nearly) cloud-free conditions, such that an AOT measurement can be made by AERONET. Hence, in the validation of AATSR, data with erroneous cloud detection are under-represented in the validation dataset, as these will occur more often under (partly) cloudy situations. Therefore we have also assessed the number of AATSR (and MODIS) retrievals over AERONET stations, which do have satellite AOT value but miss a AERONET retrieval. In this manner, we determine the number of observations that could erroneously be identified as cloud-free. The results of this analysis are shown in Tables 4.2 and 4.3.
Table 4.2 ‘Score card’ for MODIS and AATSR cloud detection.
MODIS observation AATSR observation
yes no yes no
yes 161 11 33 121
AERONET
observation no 80 32
Fist we discuss the results for MODIS. Table 4.2 shows that, averaged over all AERONET
stations, 161 cases occurred where both MODIS and AERONET have AOT measurements,
indicating clear-sky conditions. However, there are 80 cases where MODIS provides an AOT retrieval where AERONET does not have a measurement. This might indicate that the MODIS cloud detection is not strict enough in these cases. So, on average, 33% of the MODIS data might suffer from cloud contamination to some extent. We refer to this percentage as the percentage of potentially cloud-contaminated data (PCCD). Note that there are only a few cases (11) in which AERONET does have a measurement and MODIS does not have a measurement.
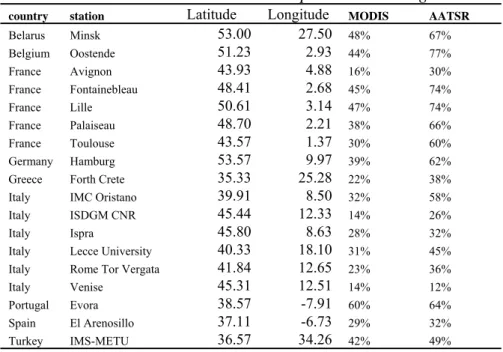
Table 4.3 Percentage of Potentially Cloud Contaminated Data (PCCD) of MODIS and AATSR at AERONET stations that were operational throughout 2003.
country station Latitude Longitude MODIS AATSR
Belarus Minsk 53.00 27.50 48% 67% Belgium Oostende 51.23 2.93 44% 77% France Avignon 43.93 4.88 16% 30% France Fontainebleau 48.41 2.68 45% 74% France Lille 50.61 3.14 47% 74% France Palaiseau 48.70 2.21 38% 66% France Toulouse 43.57 1.37 30% 60% Germany Hamburg 53.57 9.97 39% 62% Greece Forth Crete 35.33 25.28 22% 38% Italy IMC Oristano 39.91 8.50 32% 58% Italy ISDGM CNR 45.44 12.33 14% 26% Italy Ispra 45.80 8.63 28% 32% Italy Lecce University 40.33 18.10 31% 45% Italy Rome Tor Vergata 41.84 12.65 23% 36% Italy Venise 45.31 12.51 14% 12% Portugal Evora 38.57 -7.91 60% 64% Spain El Arenosillo 37.11 -6.73 29% 32% Turkey IMS-METU 36.57 34.26 42% 49%
Application of this method to AATSR shows that on average 50% of the AATSR data can be contaminated by clouds. It is also apparent that many cases exist (121) where AERONET does have a measurement and AATSR does not have a measurement. This can be explained to a large extent by the fact that AATSR does not have a daily coverage for Europe, but only once every three days. Table 4.3 shows the PCCDs for the individual stations. Only stations are listed that provided measurements throughout the whole of 2003. Note that most of the stations are located in Southern Europe, and that the PCCD values in Northern Europe may be higher. The PCCD values range between 10% and nearly 80%. For stations in Southern Europe, MODIS and AATSR PCCD values are closer to each other than for stations at higher latitudes. With increasing latitude, both AASTR and MODIS PCCD values increase, but the PCCD values of AATSR more strongly increase with latitude than those of MODIS. This indicates relatively more cloud contaminated pixels at higher latitudes in both AATSR and MODIS, but more strongly so for AATSR.
It is noted that the PCCD analysis above might be too pessimistic because of two reasons: (1) In the analysis it is assumed that the AEONET stations were fully operational throughout
the year. We have therefore selected those AERONET stations that had data available both at the beginning and at the end of the year. Furthermore we have only used AERONET stations that had more than 100 days with observations in 2003; these coincided with the stations that had data throughout 2003. Nevertheless, it might happen that AERONET has no data because of technical reasons, such as power failure, and not because of cloudy conditions.
(2) It is also possible that AERONET has no data, while the satellite has valid data, because of partly cloudy conditions. In these conditions it may happen that clouds occur in the line of sight between the sun and the AEONET station, whereas directly above the AERONET station it can be cloud-free. This situation can also occur because of time differences between the satellite and AEORNET observation, as in the meantime the cloud situation may have changed. This also means that for MODIS the PCCD analysis may be slightly more pessimistic than for AATSR, as the time-difference between MODIS and AERONET is generally larger (typically 1:30h) than for AATSR (typically 1:00h). Despite these limitations, it is felt that these two aspects are of relatively minor importance.
4.3
The use of AATSR data in the analysis part of the study
As sketched in chapter 3 and the first sections of chapter 4, for several reasons, the AATSR retrieved AOT, using the current version of the algorithm, have a number of shortcomings resulting in problems regarding their use for air quality mapping:1) The large scale distribution of AOT from AATSR in 2003 appears unrealistic, in particular the high values in Ireland, the UK, Scandinavia and Finland. We cannot recognize large point sources, or source areas such as major cities and even larger scale hot-spot regions can barely be detected.
2) Validation with AERONET has shown that AATSR has a much lower correlation in time and space as compared to MODIS.
3) It was shown that on average about 50% of the AATSR data in 2003 is potentially contaminated by clouds (or snow); the contamination increases towards higher latitudes. 4) The number of AATSR observations is limited because of the small swath width. It turns
out that in practice about 65 observations are available per year for a given location. This means about one observation every six days, and only half of these are not potentially
contaminated by clouds or snow. In contrast, MODIS has about 240 observations per year for a given location, of which one-thirds is potentially contaminated by clouds.
The statistical mapping approach makes use of yearly average data. The advantage of this approach is that this method can still work reasonably well with only limited amount of data, although it should be sufficient to calculate a yearly average. Hence, the procedure may profit from a rigorous data reduction. Therefore, to limit the influence of cloud and snow contamination in the AATSR retrieved values are similar to the monthly average was based on at least 150 individual retrievals in a 0.1x0.1 degree grid, and for which the standard deviation of the individual AOT retrievals was 0.25 or smaller. The latter criterion assumes that a large standard deviation indicates the possibility of outliers due to undetected clouds or snow coverage. These data are no longer considered. This leads to an rigorous reduction of the number of data points (see Figure 3.1, bottom right), but what is still left appears more realistic than the initial retrieval. These ‘screened’ data are used in the statistical approach to investigate the mapping of PM2.5 in chapter 5.
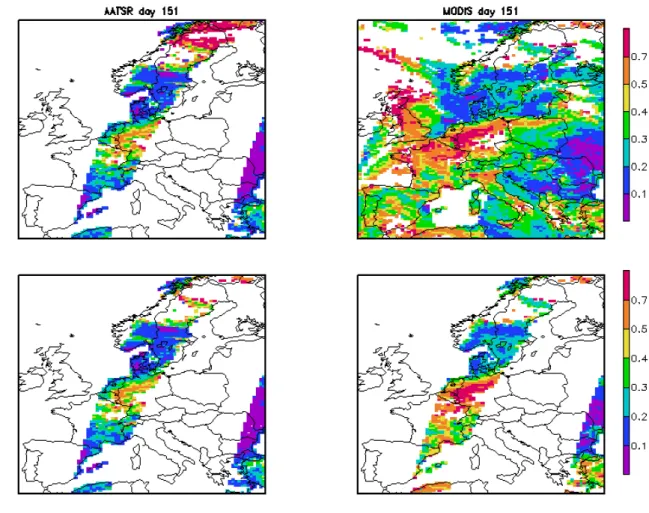
Unfortunately, for the assimilation method, instantaneous data are needed. Hence, the performance of the system is dependent on the number and quality of the individual data. A data reduction approach based on monthly statistics does not work, as the influence of an assimilated swath is only present for about two days. The maximum possible coverage of AATSR is already suboptimal for an assimilation study. A rigorous data reduction would result in too few data points for a sensible application of the assimilation system. In an attempt to reduce the number of cloud-contaminated AATSR pixels in the assimilation, we have used the cloud-detection results from AERONET observations whereas MODIS instead. An example of this method is shown in Figure 4.2. The biased high AOT values in Northern Scandinavia (top, left) are filtered out of the AATSR data when the cloud-detection of MODIS (top, right) is applied to the AATSR-data (bottom, left). This method is applied in the assimilation approach in chapter 6.
Figure 4.2 AOT values for AATSR and MODIS for 31 May 2003. The lower two plots only comprise collocated measurements.
4.4
Comparison of ‘screened’ AATSR data with MODIS
Figure 4.3 shows the resulting AOT map for the year 2003 together with the number of months on which the local yearly average AOT values are based, as obtained after additional screening for cloud contamination. These data are used in Chapter 5 for mapping PM2.5. From
the monthly mean AOT values a yearly average was calculated if at least six months of data were available. It can be observed that over large parts of Europe the temporal coverage is insufficient to determine the yearly average. This is the case over Scandinavia and Finland (with the exception of parts in southern Sweden), over Ireland and parts of the United Kingdom, over large parts of Central and Eastern Europe, as well as over the Alps. Over regions with sufficient data coverage, a clear north-south gradient can be observed with the highest yearly average AOT values on the order of 0.2-0.3 over the Southern United Kingdom, the northwestern part of Belgium, the Netherlands, Germany, and Poland and lower values on the order of 0.1-0.2 over the Mediterranean countries of Southern Europe. Increased AOT values are also observed in Northern Italy over the Po valley. These results are now at least in qualitative agreement with the patterns observed by MODIS, and what might be expected from air quality modelling.
Figure 4.3 Yearly average map of the aerosol optical thickness over Europe derived from AATSR data for 2003 (left), together with the number of months on which yearly average values are based (right). If the number of months for averaging smaller than six, no yearly average is calculated.
The AATSR data have been compared quantitatively with the AOTF (the fine-fraction of the
AOT) from MODIS. We have chosen the AOTF from MODIS, because that quantity was
used to map PM2.5 in the PARMA study. It was found that the spatial correlation coefficient
between the yearly AOT retrieved from AATSR and the yearly average AOTF from MODIS
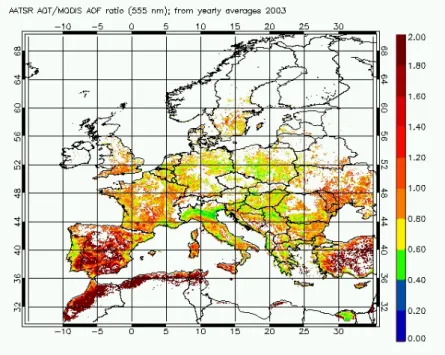
is 0.58. This indicates that these different satellite instruments show substantial spatial differences in yearly average aerosol optical thickness over Europe. To investigate the spatial structure of the difference between AATSR and MODIS, the ratio of the yearly average AOT from AATSR and the yearly average AOTF from MODIS is shown in Figure 4.4. For the
interpretation of these maps it should be realized that ratios lower than unity indicate that AATSR underestimates the AOT compared to MODIS. Note that this does not mean that AATSR overestimates the AOT compared to AERONET, however, as MODIS overestimates the AOT compared to AERONET. Ratios higher than unity indicate either that AATSR overestimates the AOTF compared to MODIS or that a significant fraction of the AOT is
related to particles in the coarse mode. The latter reason can be underlying the high AATSR AOT/MODIS AOTF ratios over large parts of Spain and Turkey as well as along the north
coast of Africa. Another reason may be that these are arid areas with high surface reflection, where both the AATSR and MODIS retrieval algorithms are likely to encounter problems. Over more central parts of Europe the ratio is generally closer to unity. Apparently AATSR strongly underestimates the AOT compared to MODIS over the Po Valley, where the ratio of the annual means is around 0.5. However, the AATSR and AERONET compare well for the ISDGM AERONET station in the Po Valley: the correlation coefficient is 0.89 (Table 4.1) and the AOT values are very similar (0.24 for AERONET versus 0.23 for AATSR). In contrast, MODIS significantly overestimates the AOT (0.43 versus 0.24 for the ISDGM AERONET station). Hence the low ratio of the AATSR AOT and MODIS AOTF can be
ascribed to overestimation by MODIS. Hence the low ratio between the AATSR AOT and MODIS AOTF in the Po Valley largely reflects the overestimation of MODIS in that region.
Figure 4.4 Map of the ratio of the yearly average AOT from AATSR and the yearly average
AOTF from MODIS.
In Figure 4.5, domain-averaged AATSR AOT/MODIS AOTF ratios are presented as a
function of month. The solid line shows the ratio averaged over all 0.1o by 0.1o grid cells within the full European domain with monthly data from both satellite instruments. The dashed line shows the corresponding curve for the region centred around the Benelux (49-55 oN, 0-10 oE). The ratio shows a distinct seasonal cycle with a maximum value higher than 3 for December and minimum values approaching unity from March to June. The high ratio in winter is likely due to insufficient screening of cloud-contaminated or snow-contaminated pixels in the AATSR data (more than in the MODIS data). Over the Benelux region, the average ratio is higher than unity during fall/winter (similar to other areas in Europe), but decreases to values in the range 0.7-0.8 during spring/summer. From validation of MODIS data in the PARMA project, it was found that MODIS overestimates AOT and AOTF in
summer compared to AERONET, while AATSR does not show such a seasonal bias; this leads to a ratio smaller than unity in summer months.
ratio AATSR/MODIS 0 1 2 3 4 5 1 2 3 4 5 6 7 8 9 10 11 12 Europe Benelux
Figure 4.5 Seasonal cycle of the ratio of the monthly average AOT from AATSR and the
AOTF from MODIS. Solid line: ratio averaged over the whole European domain; dashed
5.
Mapping of PM
2.5– statistical approach
In this statistical approach, measured PM concentrations are interpolated over Europe using spatial variations that are derived from ‘explanatory fields’. The method is similar to that used in the PARMA study (Koelemeijer et al., 2006a). Two explanatory fields are used: (1) the AOT fields derived from AATSR, and (2) PM2.5 concentrations that were modelled using
the LOTOS-EUROS model (Schaap et al., 2005a). The following form has been adopted to map PM: , 3 2 1AOT a PM a a PMfit = AAT + LE +
where PMfit is the PM concentration obtained through fitting the AOT derived from AATSR
(denoted by AOTAAT), and the PM2.5 concentrations modelled with the LOTOS-EUROS
model (denoted by PMLE) to AirBase measurements of PM2.5. The coefficients a1, a2, a3 are
free-parameters in this model, and have been fitted through least-squares minimization of PMfit (evaluated at measurement locations) and measured concentrations of PM2.5 (or PM10)
concentrations. For this minimization, the Levenberg-Marquart algorithm is used. The PM2.5
concentrations modelled by LOTOS-EUROS are also used as an explanatory field for PM10
concentrations, rather than PM10 concentrations modelled by LOTOS-EUROS. However,
modelled PM10 does not differ much from modelled PM2.5, as many natural sources that
contribute to PM10 are not accounted for in the emission inventories used by
LOTOS-EUROS. The fitting is performed using rural background stations that have more than 80% data capture during 2003. This leaves 142 PM10 stations, and, unfortunately, only eight PM2.5
stations. The amount of stations is further reduced because AATSR yearly average data are not always available for the location of the AirBase station. Therefore, in the fitting analysis, 69 stations could be used for PM10, and only six stations for PM2.5.
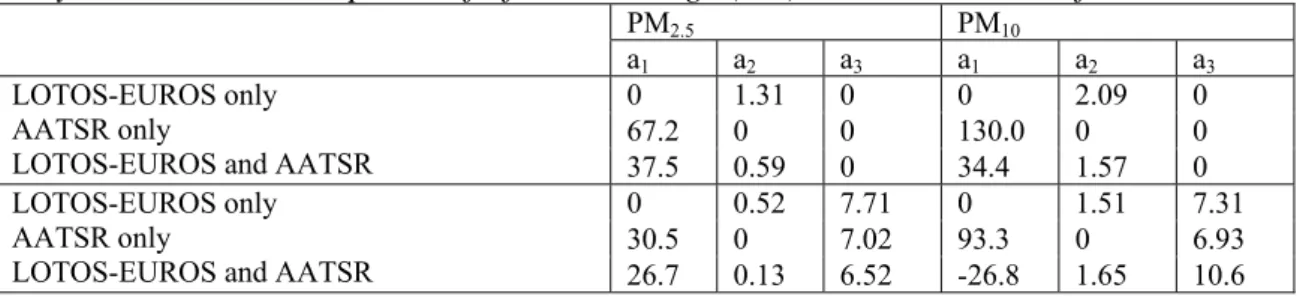
Table 5.1 Fit-coefficients pertaining to fitting PM2.5 with LOTOS-EUROS and AATSR field
only, and combined. Top rows: fit forced through (0,0), bottom: a3 is also fitted.
PM2.5 PM10 a1 a2 a3 a1 a2 a3 0 1.31 0 0 2.09 0 67.2 0 0 130.0 0 0 LOTOS-EUROS only AATSR only
LOTOS-EUROS and AATSR 37.5 0.59 0 34.4 1.57 0
0 0.52 7.71 0 1.51 7.31 30.5 0 7.02 93.3 0 6.93 LOTOS-EUROS only
AATSR only
LOTOS-EUROS and AATSR 26.7 0.13 6.52 -26.8 1.65 10.6
The fitting results for the coefficients a1 (unit: µg/m3), a2 (dimensionless) and a3 (unit: µg/m3)
are listed in Table 5.1. In the top rows, the fit was forced through (0,0), while in the bottom rows also the coefficient a3 is fitted. Note that for PM10, the 3-parameter fit results in a
negative weighting of the AATSR field.
The correlation coefficient between the yearly average AATSR data and the PM10 ground
based measurements is low, 0.31 (based on 69 stations), see Table 5.2. For PM2.5, the
correlation is higher, and amounts to 0.66, but it is based on a very limited number of stations (six stations only for PM2.5). For the two-parameter fit with a3 set equal to zero, the PM10 map
are about equal for both explanatory fields (45% for LOTOS-EUROS versus 55% for AATSR). The large difference in the choice for a two or three-parameter fit is apparent: the a3 coefficient is about 7 µg/m3 using AATSR; in the PARMA study this was about 3 µg/m3
using MODIS (absolute values). This means that the PM2.5 field based on AATSR depends
substantially on a more or less arbitrary methodological choice and is not very robust. The results presented in the following have been obtained with a3 equal to zero, as this is a
physically more plausible model.
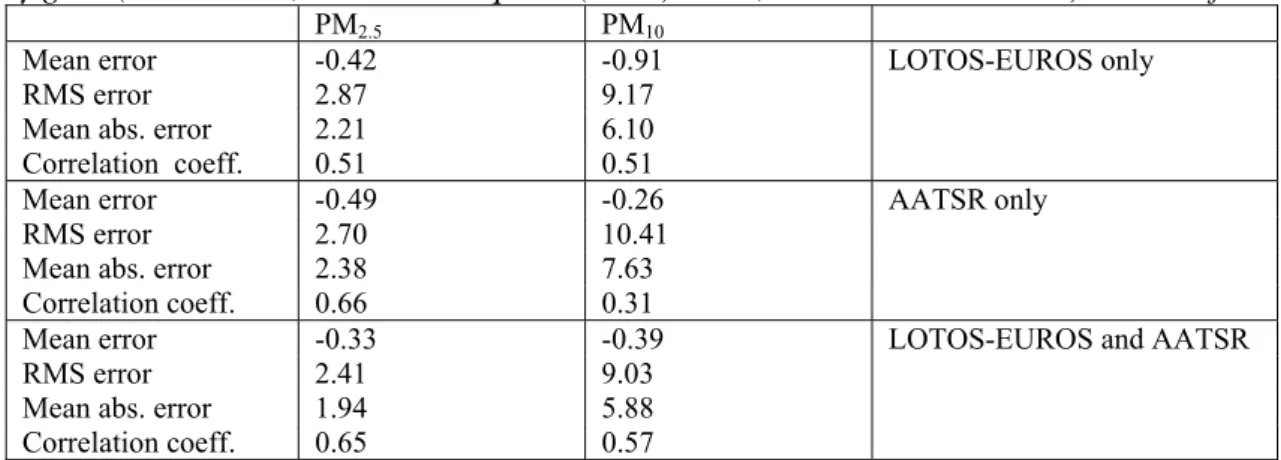
Table 5.2 Error-statistics for fitting AATSR measurements of yearly average AOT and/or
yearly average LOTOS-EUROS fields of PM2.5 to observed spatial variations in yearly
average concentrations of PM2.5 and PM10 at rural background stations in Europe. Units:
µg/m3 (mean error, root-mean-square (RMS) error, mean absolute error). Results for a3=0.
PM2.5 PM10
Mean error -0.42 -0.91 LOTOS-EUROS only
RMS error 2.87 9.17
Mean abs. error 2.21 6.10 Correlation coeff. 0.51 0.51
Mean error -0.49 -0.26 AATSR only
RMS error 2.70 10.41
Mean abs. error 2.38 7.63 Correlation coeff. 0.66 0.31
Mean error -0.33 -0.39 LOTOS-EUROS and AATSR
RMS error 2.41 9.03
Mean abs. error 1.94 5.88 Correlation coeff. 0.65 0.57
Table 5.2 shows the error-statistics when AATSR measurements of yearly average AOT and/or yearly average LOTOS-EUROS fields of PM2.5 are fitted to observed yearly average
concentrations of PM2.5 and PM10 at rural background stations in Europe. This table
describes, in a statistical sense, the difference between observed PM levels and PMfit. The
mean errors are - by definition - close to zero, as this is minimized during the fitting procedure. The results suggest that the AOT field better captures the spatial variation in measured PM2.5 than the modelled PM2.5 fields. However, the fitting procedure for PM2.5 is
based on only six stations. An analysis based on more PM2.5 rural background stations (i.e.,
an analysis for more recent years) would be necessary to investigate whether these preliminary findings holds in a more general sense. By using both explanatory fields instead of a single field for fitting PM2.5, the errors reduce by 10-20%. However, the correlation
coefficient does not improve compared to the value of 0.66 found on the basis of the AATSR field alone, and remains significantly lower than the value of 0.82 obtained within the PARMA project on the basis of a two-parameter fit of MODIS and LOTOS-EUROS fields to PM2.5 measurements from a larger – but still very limited – number of stations.
Table 5.3 Yearly average values of measured and modelled PM2.5, AOT, and fitting results
for PM2.5 using LOTOS-EUROS (LE), AATSR, and both LOTOS-EUROS and AATSR, at
rural background stations in 2003.
Fitted PM2.5 Station Technique lat lon Meas.
PM2.5 Model PM2.5 Meas. AOT LE
only AATSR only LE and AATSR DE0002R gravimetry 52.8 10.8 16.5 10.1 0.26 13.2 17.6 15.8 DE0003R gravimetry 47.9 7.9 10.2 9.9 0.19 13.1 12.8 13.0 DE0004R 49.8 7.1 13.8 10.6 0.15 13.9 10.0 11.9 DE0737A β-absorption 49.3 7.8 12.5 9.2 0.15 12.1 10.3 11.2 GB0036R TEOM 51.6 -1.3 11.8 10.8 0.21 14.2 13.8 14.1 PT0128A β-absorption 39.2 -8.3 9.9 4.4 0.11 5.7 7.3 6.7
Our primary interest in this study is mapping PM2.5, hence the discussion is limited to PM2.5
in the remainder of this section. Table 5.3 lists the measured PM2.5 and fitted PM2.5, as well as
the values of the explanatory variables at these locations. The applied calibration factors applied to the measurements are unknown for PM2.5. Figure 5.1 shows the fitted fields for
PM2.5, using only LOTOS-EUROS as explanatory variable, using only the AOT field from
AATSR as explanatory variable, and using both explanatory fields. It can be observed that, comparing the two top maps, the large scale patterns show substantial differences. It is apparent that the modelled field shows larger spatial contrasts between clean and polluted regions, and also cities are more clearly distinguishable in the modelled map. As noted above, the fitted map using both explanatory fields (bottom) mostly resembles the features of the AOT map, but large cities are more clearly present only because these are very clearly distinguishable in the modelled map.
Figure 5.1 Fitted fields for PM2.5 using only LOTOS-EUROS as explanatory variable (top
left), using only the AOT field as explanatory variable (top right), using both explanatory fields (bottom, large). For these map, the fits were forced through (0,0). All maps have the same colour scale.
In Figure 5.2 the resulting PM2.5 map is compared with the corresponding map obtained on
the basis of the AOTF from MODIS instead of the AOT from AATSR as part of the PARMA
project. Over large parts of Spain, Turkey, and along the northern coast of Africa the use of AATSR instead of MODIS data results in significantly larger PM2.5 levels. Over more central
parts of Europe lower values are obtained with AATSR compared to MODIS. This is most pronounced over regions of large-scale pollution, such as over Poland and over the Po Valley in Northern Italy, where the difference can be as high as 40%. The reasons for the discrepancies between AATSR and MODIS have been discussed in chapter 4.
Figure 5.2 Map of the ratio of the yearly average PM2.5 field obtained in this study from a
two-parameter fit using the AOT from AATSR, and the corresponding field obtained within
the PARMA project using the AOTF from MODIS. In both cases the PM2.5 field from
6.
Mapping of PM
2.5– assimilation approach
The extensions made to the LOTOS-EUROS model during this project are described in section 6.1. Model results for PM10 and PM2.5 in 2003, as well as individual aerosol
components (secondary inorganics, organic carbon and elemental carbon) are validated using EMEP measurements in section 6.2. The assimilation results for 2003 (AATSR data) and August 1997 (ATSR-2 data) are described in sections 6.3 and 6.4, respectively. August 1997 is added to allow a comparison between AOT retrievals from AATSR and ATSR-2.
6.1
Extensions to the model system
The LOTOS-EUROS modelling system used here is described in Appendix A. Here, we present improvements made during the project, which is aimed at developing the possibility to perform simulations on a higher resolution. To that end, the model has been adapted such that at present, the system is able to simulate on resolutions ranging from 1.0 by 0.5 degree (50x50km2) to 0.125 by 0.0625 (6x6 km2). These higher resolutions also put additional demands to the input data for the model (meteorology, emissions, surface characteristics). At the moment, the meteorological data that are not yet available on the highest resolution, and are therefore interpolated. A limiting factor is the availability of emission data on this resolution, which are not yet available for the whole of Europe. Another important input parameter is the land use cover over Europe. During this study the land use database was updated. The starting point was the official Corine/Phare Land Cover Data from the EEA (EEA, 2000), which was completed for the full European domain by Smiatek (FI-Garmisch Partenkirchen) using (mainly) the Pelinda data base (De Boer et al., 2000). The database has a resolution of 0.0166x0.0166 degrees which is aggregated to the required resolution during the start-up of a model simulation. The land use database has the following categories:
1 Urban areas 2 Agriculture 3 Grassland 4 Deciduous forest 5 Coniferous forest 6 Mixed forest 7 Water 8 Marsh or wetland 9 Sand, bare rocks
10 Tundra
11 Permanent ice 12 Tropical forest
13 Woodland scrub
In Figure 6.1 the land use data for the Netherlands and Europe as a whole are shown. In the framework of another project, the Corine/Smiatek data base has been enhanced using the tree species map for Europe made by Koeble and Seufert (2001), who also used Corine as a basis. This data base contains 115 tree species, on a grid of 1x1 km2, with coverage per grid. In parts of the area, especially Russia, the Koeble tree map gives no information. We started with the Corine/Smiatek land use database, and filled this in with the tree data, when the tree database has no information; the three Corine forest categories are maintained. So, the full tree data base contains 115+3 categories. The information on the tree species has been
incorporated as it enables to calculate the biogenic emissions of terpenes, which are thought to be important precursors for secondary organic aerosol (SOA) formation, and thus organic carbon levels. However, due to time constraints, in this study secondary organic aerosol could not yet be taken into account in the actual calculations.
Figure 6.1 High resolution land use database for Europe. Categories are listed in the main text.
The LOTOS-EUROS model system has been adjusted to be able to run in a zoom mode at a resolution of 0.125° x 0.0625°, which corresponds to a horizontal resolution of ~6x6 km2. The available anthropogenic and biogenic emissions have been regridded onto this model grid. The meteorological data used as input for the model have been interpolated to get the higher horizontal resolution needed. For these simulations the model domain was limited to 42.5oN to 60oN and 5oW to 30oE covering the central part of Europe. This domain was chosen to cover some highly industrialised areas (Po Valley, Ruhr area, Poland) and regions where most ground-based measurements are available. Figure 6.2 shows for this high resolution run two fields for AOT. The results show the ability of the LOTOS-EUROS model to perform runs on a high resolution of ~6x6 km2.
Figure 6.2 Total AOT calculated by the model at 25 July and 4 August, 2003.
6.2
Model results for PM in LOTOS-EUROS in 2003
6.2.1 PM
10and PM
2.5The LOTOS-EUROS model calculates the hour-by-hour variation in aerosol concentrations over Europe. The representation of PM in the model is:
PM2.5 = SO4 + NO3 + NH4 + EC + OC + PPMfine + SSfine
PM10 = PM2.5 + PPMcoarse + SScoarse
In these equations, PPMfine and PPMcoarse are the anthropogenic primary emitted PM with a
diameter smaller than 2.5 micrometer and between 2.5 and 10 micrometer, respectively, not being Elemental Carbon (EC) or Organic Carbon (OC). In practice, this PPM consists of contributions from traffic (wear of tyres, brakes, roads) and industry (related to combustion and non-combustion). SSfine and SScoarse are the sea salt contributions in the corresponding
size ranges. Thus, PM10 and PM2.5 are the sum of the individual model components. In Figure
6.3 the modelled field of PM10 for 2003 is depicted. PM10 is shown because many
measurements are available in the AirBase database to compare with. Presently, in the model, the difference between PM10 and PM2.5 stems mainly from the fact that the coarse mode sea
salt (SS) particles are taken into account. Also, there is a slight contribution of PPMcoarse to
PM10. Dust and secondary organic aerosol (SOA) are not included in the current model. This
feature is illustrated in the comparison with observed PM10 data. The model underestimates
the measured PM10 concentrations by about 40% on average. A large part of the