A STUDY ON THE POSSIBLE SUCCESS OF VIRTUAL
REALITY IN THE REAL ESTATE BUSINESS IN BELGIUM
CHALLENGES IN TIMES OF A PANDEMIC
Aantal woorden/ Word count: 12 946
Dariah Vandercammen
Stamnummer/ Student number: 0150 6363
Promotor/ Supervisor: Ass Prof. Dr. Bert Paesbrugghe
Masterproef voorgedragen tot het bekomen van de graad van: Master’s Dissertation submitted to obtain the degree of:
Master’s in Applied Science Economics: Marketing
CONFIDENTIALITY AGREEMENT
I declare that the content of this Master’s Dissertation may be consulted and/or reproduced, provided that the source is referenced.
PREFACE
This Master’s Dissertation is a great conclusion to my four years in Applied Science Economics. It was quite a challenge to write this paper, and without the help of a few people, it would not have been possible to realize this Master's Dissertation. Therefore, I would like to use the preface to thank them appropriately.
First, I would like to thank my supervisor, Assistant Professor Dr. Bert Paesbrugghe, for his guidance, feedback, and support, which has made this Master’s Dissertation as it is. He allowed this paper to be my own work and guided me in the right direction when.
Hereafter, I would like to thank all my respondents for participating in my research. Without them, this Master’s Dissertation would not have been possible.
Further, I would like to thank my parents, for the opportunity and encouragement, not only for this thesis but throughout the entire education. Finally, I would like to thank my friends, who offered a distraction when needed. My years at the University of Ghent would never have been the same without them.
COVID-19 IMPACT
This Master’s Dissertation was partly written during the COVID-19 outbreak in Belgium. Small adjustments had to be made to comply with the measures that were taken in Belgium. This includes contacting respondents through social media, phone, and e-mail instead of face-to-face. Also, the meetings with the supervisor were online instead of offline.
This Master’s Dissertation was first going in a different direction. It would investigate the influence of the virtual reality technology on a company that was active in real estate and its sales. Due to the crisis, it was not convenient to meet with this company in person. Several items they would have shared in normal circumstances were confidential, so there was a different path chosen for this Master’s Dissertation in April 2020.
1. TABLE OF CONTENTS
CONFIDENTIALITY AGREEMENT ... II PREFACE ... III COVID-19 IMPACT ... IV
LIST OF TABLES AND FIGURES ... 1
ABSTRACT ... 2
1. INTRODUCTION ... 3
2. STRUCTURE OF THIS PAPER ... 5
3. LITERATURE REVIEW ... 6
3.1. VIRTUAL REALITY ... 6
3.1.1. WHAT IS VIRTUAL REALITY ... 6
3.1.2. THE IMPORTANCE OF VIRTUAL REALITY IN DOING BUSINESS ... 9
3.1.3. VIRTUAL REALITY VERSUS TANGIBLE TOUCH ... 10
3.2. REAL ESTATE ... 11
3.2.1. WHAT IS REAL ESTATE? ... 11
3.2.2. REAL ESTATE AGENCIES ... 12
3.2.3. NEW RESIDENTIAL REAL ESTATE ... 13
3.2.4. IMPORTANCE OF REAL ESTATE IN THE BELGIAN ECONOMY ... 13
3.2.5. EVOLUTION OF REAL ESTATE IN BELGIUM ... 14
3.2.6. REAL ESTATE VISITS ... 16
3.3. VIRTUAL REALITY IN REAL ESTATE ... 16
3.3.1. VIRTUAL REALITY IN EXISTING HOUSING ESTATE ... 17
3.3.2. VIRTUAL REALITY IN NEW HOUSING ESTATE ... 18
3.3.3. REAL ESTATE IN TIMES OF COVID-19 ... 19
4. PROBLEM STATEMENT ... 20
4.1. RESEARCH QUESTIONS ... 21
5. METHODOLOGY ... 22
5.1. GOAL ... 22
5.2. SAMPLE ... 23
5.2.3. SAMPLE SHAPING ... 24
5.2.4. DESCRIPTIONS OF THE VARIABLES ... 24
5.3. PROCEDURE ... 27
6. ANALYSIS ... 30
6.1. DESCRIPTIVE STATISTICS ... 30
6.2. FACTOR ANALYSIS ... 31
6.2.1. EXPLORATORY FACTOR ANALYSIS ... 31
6.3. RELIABILITY ANALYSIS ... 33
6.4. RESEARCH HYPOTHESES ... 34
6.4.1. HYPOTHESIS 2:THE COVID-19 CRISIS INFLUENCES PEOPLE’S PERCEPTION OF VIRTUAL REALITY. ... 34
6.4.2. HYPOTHESIS 3:THE PERCEPTION OF VIRTUAL REALITY DEPENDS ON THE DECISION THAT HAS TO BE MADE (RENTING VERSUS BUYING). ... 35
6.4.3. HYPOTHESIS 4:THERE IS A DIFFERENCE IN PERCEPTION REGARDING DEMOGRAPHICS. ... 39
6.4.4. HYPOTHESIS VALIDATION ... 45
7. DISCUSSION, LIMITATIONS AND FUTURE RESEARCH ... 46
7.1. DISCUSSION ... 46
7.1.1. INFLUENCE OF COVID-19 ON HUMAN BEHAVIOR ... 46
7.1.2. PERCEPTION OF VIRTUAL REALITY IN DIFFERENT CIRCUMSTANCES ... 47
7.1.3. PERCEPTION OF VIRTUAL REALITY BASED ON TYPE OF DECISION ... 48
7.1.4. PERCEPTION OF VIRTUAL REALITY BASED ON DEMOGRAPHICS ... 49
7.2. LIMITATIONS AND POSSIBILITIES FOR FUTURE RESEARCH ... 50
8. CONCLUSION ... 52 9. REFERENCES ... I 10. APPENDIX ... VI 10.1. QUANTITATIVE METHODOLOGY ... VI 10.1.1. SURVEY ... VI 10.2. QUANTITATIVE RESULTS ... XV 10.2.1. PURCHASE AGREEMENT ... XV 10.2.2. YEAR ... XVI 10.2.3. INFLUENCE COVID-19 CRISIS ... XVI
10.2.6. EXPERIENCE ... XIX 10.2.7. EDUCATION ... XX
10.2.8. EXPLORATORY FACTOR ANALYSIS – PERCEPTION ... XXI
10.2.9. RELIABILITY ANALYSIS – PERCEPTION OF EFFICIENCY ... XXII
10.2.10. RELIABILITY ANALYSYS – PERCEPTION IN DIFFERENT CIRUMSTANCES ... XXIV 10.2.11. RELIABILITY ANALYSIS – PERCEPTION OF REPLACEMENT ... XXV
10.2.12. HYPOTHESIS TESTING – HYPOTHESIS 2– PAIRED SAMPLES T-TEST ... XXVI
10.2.13. HYPOTHESIS TESTING – HYPOTHESIS 3– PAIRED SAMPLES T-TEST ... XXVII
10.2.14. HYPOTHESIS TESTING – HYPOTHESIS 4– CLUSTERS ... XXVIII 10.2.15. HYPOTHESIS TESTING – HYPOTHESIS 4– AGE * CLUSTERS ... XXXI
10.2.16. HYPOTHESIS TESTING – HYPOTHESIS 4– GENDER * CLUSTERS ... XXXII
10.2.17. HYPOTHESIS TESTING – HYPOTHESIS 4– EDUCATION * CLUSTERS ... XXXIII
LIST OF TABLES AND FIGURES
Table 1: Types of virtual reality ... 7
Table 2: Median Prices of Properties ... 15
Table 3: Survey Format of Current Study ... 29
Table 4 Rotated Component Matrix Perception ... 32
Table 5: Significant differences of attractiveness ... 38
Table 6: Final cluster centers - 3 clusters ... 39
Table 7: Final cluster centers - 4 clusters ... 39
Table 8: Final cluster centers - 5 centers ... 40
Table 9: Cluster names ... 40
Table 10: Age groups in clusters ... 41
Table 11: Gender in clusters ... 41
Table 12: Education in clusters ... 42
Table 13: First experience in clusters ... 43
Table 14: Experience in clusters ... 44
ABSTRACT
Virtual reality has a positive influence on the efficiency and performance in various sectors, and the subject is very relevant in modern business life. It is also clear that the real estate sector has benefited from emerging technologies in the past. However, literature has spent little time researching how virtual reality can impact the real estate sector. This research aims to provide additional insights into the Belgian real estate sector regarding the use of virtual reality. This paper will give real estate agencies information about how Belgian people perceive this technology in different situations. The insights obtained by this study will help them know how to integrate this technology into their business. A quantitative analysis of different perceptions of virtual reality was conducted by means of a survey directed to Belgian people with experience in the real estate sector. This study considers 122 respondents of the 211 participants during the COVID-19 crisis. The perception was measured by questioning the participants about the use of virtual reality by real estate agencies in different situations and for different types of decisions. The data were analyzed through the use of SPSS. The findings show that virtual reality is even more relevant in times of a pandemic. Moreover, the perception of virtual reality is co-determined by the decision to either buy or rent a house. In the phases “when making the first selection”, “when wanting to arrange a visit” and “after the visit, to show parents and friends”, the technology is perceived as more valuable when people are looking to buy a property. Nevertheless, when it comes to the actual decision of buying or renting, people are less prone to base their decision only on virtual reality when they want to buy a house compared to when they want to rent a house. In addition, people with a higher level of education were less skeptical about virtual reality than people with a lower level of education. Through this study, it is clear that virtual reality is relevant and essential for agencies in Belgium to anticipate their customers’ expectations, regardless of the circumstances. Future research should combine quantitative and qualitative research to examine how agencies can implement virtual reality into their business, according to whether properties are meant for buying or renting and the absence or presence of a pandemic.
1. INTRODUCTION
Technologies have influenced the real estate sector in the past (Kummerow & Lun, 2005). These technological revolutions were mainly defined by information and communication tools, which made the sector function much more efficiently and particularly resulted in less time-consuming activities on the real estate agent’s schedule. Some examples are the development of advanced real estate websites, supporting tools such as Omnicasa1 and Whise2, and the development of online search tools such as Immoweb. These technologies have been proven useful in the past; however, real estate agencies keep looking for more ways to increase their agents’ work efficiency.
Over the past decades, digitalization has been increasing, so we live in a digitalized world. In many ways, technology has made life easier for all of us. We can do things faster and more efficiently because of the different technologies. This change did not only happen on a personal level (Crittenden, Crittenden, & Ajjan, 2020) but for businesses as well (Kummerow & Lun, 2005). To keep up with the customer’s needs and competition, companies are obliged to adapt to this digital world. This fact is an opportunity for companies, as they can attract new customers by integrating new technologies into their services. However, they also bump into different challenges due to technology. It can be difficult to keep up with changes in the market, and businesses have to be aware of the change in perception and desire of the customer all the time (Ali, Ajmal, Gunasekaran, & Helo, 2019). Companies have to invest in research and development all the time to do this.
While technology can create a lot of opportunities, people can also be very skeptical about change. How people perceive a company, its products, and its services are very important for companies (Arditto, Cambra-Fierro, Fuentes-Blasco, Jaraba, & Vázquez-Carrasco, 2020). In real estate, the agents are in direct contact with their clients and customers. The perception they have of the agents can have a large impact on the companies’ success. When companies
know how people perceive certain aspects, they can anticipate on these findings. An integrated business is very important, where they consider both changes in the market in general and the perception and desire of their customer.
Over the past decades, virtual reality has been a technology that has widely evolved. In business, it is one of the most promising technologies (Kardong-Edgren, Farra, Alinier, & Young, 2019). It has proven its usefulness in different sectors and offers many advantages. For example, in healthcare, surgeons can execute surgery in a virtual reality environment. Thereby, they can practice without real-life consequences. In this field, virtual reality has saved lives.
Knowing that the real estate sector has been positively impacted by technology in the past, it can be interesting to see how this recent technology, virtual reality, can impact the sector. Some agencies in Belgium are already using this technology as an integrated service (Petitjean, 2020). Dewaele Group provides its customers with virtual reality goggles and, in this way, people can virtually “walk” inside houses. They also provide 360° images on their website, so people can navigate through properties online. In this paper, we want to assess the impact virtual reality can have on the real estate business and how it can help agencies attract more clients.
2. STRUCTURE OF THIS PAPER
This paper is organized as follows. Section 3 provides a brief overview of previous research regarding virtual reality, real estate, and the two aspects combined, is provided. Section 4 focuses on the research question based on the literature review. In section 5, the methodological information of the research is presented. Section 6 gives an analysis of the data and the results relating to the different hypotheses. Section 7 discusses the findings, including managerial implications, limitations, and future research. Finally, section 8 concludes all findings with an answer to the research questions.
3. LITERATURE REVIEW
3.1. VIRTUAL REALITY3.1.1. WHAT IS VIRTUAL REALITY
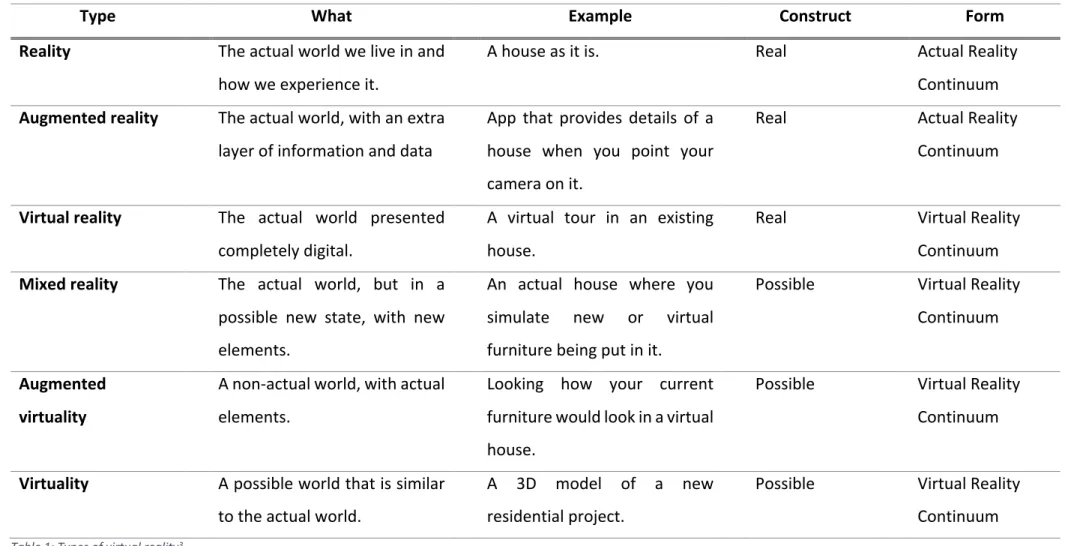
Technology has evolved heavily over the past decades. One of the latest developments is that you can walk inside a room without being present. With the technologies of today, it’s all possible. This phenomenon is called Virtual Reality. This technology creates the experience of presence in a certain area. A 360° camera takes 3D images of different rooms. These images are placed online, and people are able to “move” across different rooms, as they would actually be present in the room. (Steuer, 1992). There are different kinds of reality and virtual reality (Farshid, Paschen, Eriksson, & Kietzmann, 2018). Table 1 provides an overview of six different types of reality and virtual reality.
Reality
The reality is the world we experience as it is. Despite the existence of a technological application, most of real estate transactions still happen in real life.
Augmented Reality
Augmented reality provides a layer on top of the actual reality, to let people have an insight into additional information about the real world. It blends the perception of the real world with digital information generated by technology. An example is an app that provides additional information about a house when your phone’s camera is pointing at it. For example, the app can show the price of items and show the different dimensions of each room when physically being present in the house or room.
Type What Example Construct Form Reality The actual world we live in and
how we experience it.
A house as it is. Real Actual Reality
Continuum
Augmented reality The actual world, with an extra layer of information and data
App that provides details of a house when you point your camera on it.
Real Actual Reality
Continuum
Virtual reality The actual world presented completely digital.
A virtual tour in an existing house.
Real Virtual Reality
Continuum
Mixed reality The actual world, but in a possible new state, with new elements.
An actual house where you simulate new or virtual furniture being put in it.
Possible Virtual Reality Continuum
Augmented virtuality
A non-actual world, with actual elements.
Looking how your current furniture would look in a virtual house.
Possible Virtual Reality Continuum
Virtuality A possible world that is similar to the actual world.
A 3D model of a new residential project.
Possible Virtual Reality Continuum
Virtual Reality
Virtual Reality is a 3D representation of the real world. An example is real estate agencies taking 360° pictures of houses, allowing people to “walk” inside the house. People can interact with their surroundings; they can switch off the lights and open curtains. The difference between virtual reality and (augmented) reality is that people are present in a different reality than their physical world, on a computer screen, for example.
Mixed Reality
Mixed Reality combines the world as it is with objects or people that are not really present. It shows a potential situation. Pokémon Go is a great example of mixed reality. It shows the surroundings as they are, and characters are added to the reality. In the real estate context, people could add furniture to the existing rooms to see what would be possible when buying the house.
Augmented Virtuality
Augmented Virtuality works the other way around, compared to Mixed Reality. There, people can add existing items to a virtual reality. Also, Augmented Virtuality can create a different experience for people. It can add smell and sounds to enhance the virtual experience.
Virtuality
Virtuality creates a possible state of the actual world. It is, for example, a fully computer-generated house where people can walk through. This type is the most futuristic of all types since the shown object does not exist in the real world. Therefore, this type of virtual reality is also the most expensive. As it would be non-profitable to set this up in the process of selling a house, this technology is mainly used in the new housing estate. Those projects are projects on a larger scale for which this expensive technology can bring a positive return on investment.
3.1.2. THE IMPORTANCE OF VIRTUAL REALITY IN DOING BUSINESS
In business, virtual reality is one of the most promising technologies. Over the past years, virtual reality and other types of reality have become more and more relevant in the business world. It has proven its importance in several fields, and it offers many advantages. Regarding the healthcare sector, virtual reality has proven its importance: surgeons can execute a surgery in virtual reality for practicing purposes and thereby offering training to surgeons, without the risk of real-life consequences (Kardong-Edgren et al., 2019). Also, in other sectors, virtual reality has been proven useful (Yu, 2011) and technology is playing a key role in several industries (Berg & Vance, 2017).
Multiple industries where virtual reality is playing an increasingly important role are
- Retail (Bonetti, Warnaby, & Quinn, 2018). Both augmented and virtual reality have been used in physical and online retailing to enhance the shopping experience. - Education, according to Merchant, Goetz, Cifuentes, Keeney-Kennicutt, & Davis
(2014), virtual reality was effective in improving the learning outcome gains.
- Healthcare (Freeman et al., 2017). With virtual reality, potential health care workers can be taught how to overcome difficulties in problematic situations.
- Entertainment (Lin, Wu, & Tao, 2018). People can play games in virtual reality environments.
- Research (Bigné, Llinares, & Torrecilla, 2016). Data for research purposes can be collected through different technologies, such as eye movements and brand choice in a virtual supermarket, providing valuable insights to marketers when designing their supermarket.
In addition, the topic of virtual reality falls within the top ten strategic decisions in business, according to Gartner (2016). Among other technologies, such as artificial intelligence, machine learning, etc., virtual reality is a trend that can be widely beneficial for businesses. This information shows that virtual reality is important in modern business life. Businesses should keep up with this trend to stay competitive in the market.
3.1.3. VIRTUAL REALITY VERSUS TANGIBLE TOUCH
As it is clear that virtual reality has become an important technology in people’s and businesses lives, it is important to know how people see this phenomenon being integrated into real life. Would people prefer this technology over real-life in-store experiences? And more importantly, does this change the perceived value of the product? Virtual reality allows people to have a more autonomous and dynamic experience (Amy L. Ostrom, A. Parasuraman, David Bowen, Lia Patrício, 2015), which results in a heightened perception of the value of the product by the consumer (Patrício, Fisk, & Falcão E Cunha, 2008).
Over the past years, our lives have been increasingly taking part online, on our screens (de Vries, Jager, Tijssen, & Zandstra, 2018). However, we wonder, do people prefer real-life encounters over digital encounters? Virtual reality cannot be seen as “real”, and it relies on people’s perception (Diemer, Alpers, Peperkorn, Shiban, & Mühlberger, 2015). Emotions of people influence the perception they have of this technology. In turn, physical presence has an important role in people’s emotions, which indirectly influences perception (Diemer et al., 2015). Research has shown that the quality of images has an important impact on how people perceive virtual reality experiences (Botella et al., 1999). The sense of presence did not change; however, people felt more sensations in a high-quality virtual reality environment.
To know the possibilities virtual reality can have in business life, we have to know the perceived difference of the experience in virtual reality versus actual reality.
3.2. REAL ESTATE
3.2.1. WHAT IS REAL ESTATE?
“The real estate market is the interconnected system of the market mechanisms providing creation, transfer, management, and financing of real property. The real estate market represents a set of regional and local markets which are significantly distinct from each other on price and risk levels, efficiency of real estate”.4
There are two have types of real estate: residential real estate and commercial real estate. Residential real estate consists of properties where people are living or are going to live. Commercial real estate covers properties like commercial buildings, offices, hotels (Glickman, 2014).
There are two kinds of companies that are active in the real estate industry: operating companies and service companies (Glickman, 2014). The first type is the most common one, where companies create or acquire real estate. In the second, service companies, there is the brokerage, where the companies employ brokers, and they work together with buyer and seller. When the house is sold, these brokers get a certain fee that is negotiated in the contract. For this paper, the focus will lie on the brokerage.
As the real estate business is an information-based business, people often need an external view. As houses or other properties are not being sold frequently, it is very difficult to assess the correct price for a particular property (Kummerow & Lun, 2005). In addition to that, there are a hundred different predictive variables for the housing prices. Therefore, people who want to sell their house will go to agencies, that have experience in the real estate market and close the information gap (Agarwal, He, Sing, & Song, 2019).
4 Kauškale, L., & Geipele, I. (2017). Integrated Approach of Real Estate Market Analysis in Sustainable Development Context for Decision Making. Procedia Engineering, 172, 505–512.
House selling transactions start when there is a homeowner that wants to sell his property. When this happens, in most cases, they go to a real estate agency that puts a price on the house. (Shimizu, Nishimura, & Watanabe, 2016) When the house happens to be on the market for a prolonged time, the price will go down eventually. The renegotiated price will attract new buyers and enlarges the possibility of the house being sold.
The real estate market works to a certain extent in the same way as a normal supply and demand market. When the demand goes up, prices will evolve in the same way. This encourages people to build or buy houses. However, as seen in the past, when too many people do so, the housing market might collapse. This indicates the great importance of the real estate market, as it is a market with high transaction costs. Thus, it has a large impact on the economy as well (Deng, Zeng, & Li, 2019).
3.2.2. REAL ESTATE AGENCIES
Real estate agencies have the function of bringing the buyers and the sellers together, being a medium between the two parties (Kummerow & Lun, 2005). Buyers and sellers pay a commission to the real estate agent. Usually, this is a fixed percentage of the price at which the house is being sold.5
Relationships
There are different relationships when looking into a real estate agency business. First, you have the relationship between the agency and the seller/ renter, the client of the real estate agency. (Differences Between Real Estate Customers & Clients, 2020) On the one hand, you have the perception the agency has on the seller. On the other hand, you can also look at it the other way around.
5 Real estate agents are free to determine their own tariffs. The commission fee around 3% is taken as a reference. The sellers pay this commission to the agency; it’s usually not the buyers that pay.
Secondly, have the relationship between the agency and the potential buyer/ tenant, which
is the customer of the real estate agency (Differences Between Real Estate Customers & Clients, 2020). Here, you can also look at the relationship from two different angles, from the agencies’ point of view and the buyer’s point of view, so how they perceive the agency.
In the first step of the real estate agency business, the most agency’s important relationship is the relationship between the agency and the potential seller. Agencies have to attract potential sellers/ renters to sign a contract with their agency instead of another agency. In this relationship, the agent acts on behalf of the seller with their permission. It’s the most important relationship because when this relationship would not exist, the process of selling houses already stops at this point for the real estate agency. Therefore, the agency needs to have a good reputation for potential buyers, and potential buyers have a positive perception of the agency.
However, the agency has to attract multiple potential buyers to ensure that houses and apartments are bought or rented. If they cannot do this, the sellers won’t be satisfied, which will lead to a bad reputation among the sellers/ renters.
3.2.3. NEW RESIDENTIAL REAL ESTATE
Now, let us zoom in on the second type of real estate, next to the commercial housing estate, as discussed earlier. Residential real estate comes forth of construction sites becoming available for real estate developers. When the sites are available for buildings, real estate is being developed on paper and built (Kerste, Poort, Risseeuw, & Rosenboom, 2011). Before the people who run the project, start building, they let an architect draw the building and develop the first 3D images of the project.
3.2.4. IMPORTANCE OF REAL ESTATE IN THE BELGIAN ECONOMY
construction industry has grown by 24,5% in Belgium, while the real estate sector has grown 15,9% (Statistics Belgium, 2018).
The importance of the real estate industry in the economy has also been proven in the past. When looking back at the economic recession in 2008, the housing prices were a good indicator of economic growth. When housing prices are high, wealth increases; thus, people and companies are going to spend and borrow more. When looking back in time, because of these facts, banks were more willing to grant loans to people from risk groups, because the price of loans is becoming higher, which was beneficial for those banks (Delarue & Seynaeve, 2010). All these facts were the reason for the economic recession. This implies that the real estate sector can have a major influence on a country and even worldwide.
Real estate does not only have a major impact on the business world but also on individuals themselves. The purchase of a house is a high involvement decision (Pratap, 2019)(Jud, Winkler, & Sirmans, 2002). High involvement decisions are decisions that involve a certain amount of risk and are also expensive and complex. People put more thought into the acquisition of a house compared to the purchase of a bottle of milk. The purchase of a new house is not a routine purchase and has a high impact on a person’s life. The buyer does a lot of research before buying the product, in this case, a house. This states the importance of real estate on a personal level.
3.2.5. EVOLUTION OF REAL ESTATE IN BELGIUM
Real estate is an enormous economic factor. It keeps growing over the past years. Over time, real estate has been influenced by changes in technology (Kummerow & Lun, 2005). Especially the flow of information has become larger. This evolution resulted in greater competition for the online real estate agencies because a larger part of the business was taking place online.
Looking at the investment side of real estate agencies, investors see the costs inefficient markets bring with them. Therefore, they are willing to invest in data technologies that support data gathering and analysis. This makes the market work more efficiently (Statistics Belgium, 2018). Where in other markets, there is often cannibalization of the sector due to
evolution in technology, in the real estate market, the existing technology complements shortcomings of the sector and supports the way of working (Kim & Heineman, 2003). The technologies tend to help the agencies accelerate the process.
The main reason why the real estate sector has been impacted by the IT technologies over the past years as much as it has is that the real estate market is a sector with a high need of data gathering, data analysis, data transmission and data storage (Kilpatrick, 2001). Therefore, the cost decreased, while productivity has increased.
Many would expect that the increase in productivity would imply that the number of real estate agencies and agents would decrease. However, the agents are still needed, because they possess tacit knowledge that databases don’t have (Larceneux, Lefebvre, & Simon, 2015). Also, the real estate agent is still seen as the contact point between the seller and the buyer. The buyers’ expectations of the agents are that they locate the house, do the price negotiation, do the paperwork, etc.
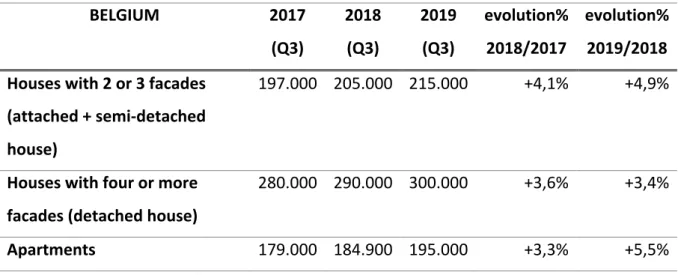
Regarding the prices of properties, we notice in Table 2 that they kept growing over the past years. As stated before, this implies that the wealth of the country is rising.
BELGIUM 2017 2018 2019 evolution% evolution% (Q3) (Q3) (Q3) 2018/2017 2019/2018 Houses with 2 or 3 facades
(attached + semi-detached house)
197.000 205.000 215.000 +4,1% +4,9%
Houses with four or more facades (detached house)
280.000 290.000 300.000 +3,6% +3,4%
Apartments 179.000 184.900 195.000 +3,3% +5,5%
Table 2: Median Prices of Properties6
According to FOD Belgium, in the last 42 years, the prices have grown three times as fast as the products in the consumer price index basket (Machover & Tice, 1997).
3.2.6. REAL ESTATE VISITS
As stated before, purchasing a house is a high-involvement and well-thought-through decision (Pratap, 2019). People try to gather as much information as possible when they want to buy a house. Therefore, people invest a lot of time in the buying process of a house. When people are interested in buying houses, they plan several visits to find the house they want to live in. The regular way of visiting houses is physically going to the house with the real estate agent.
3.3. VIRTUAL REALITY IN REAL ESTATE
Now that the importance of virtual reality and real estate has been made clear, the two concepts will be combined. Virtual reality has been a game-changer in the real estate industry (B., 2020). Integrating this technology can result in the acquisition of more clients and deliver services better than others. The five main reasons to use these technologies given by B. (2020) are the following:
- The biggest benefit of them all is time efficiency. Thanks to virtual reality, both the realtor and the customer don’t have to travel to the property to see it, so they will lose less time.
- 3D images build emotional connections and cause the customer to be more engaged in comparison to 2D images.
- With virtual reality, it does not matter where clients live. They can visit the house from anywhere they are, so you have a more global reach.
- Particularly for new properties, you would have to stage the building and have high-quality images. With the 360° images and other virtual reality technologies, you will
save money, taking into account that the initial investment is quite high.
- Clients are allowed to visit the property as long as they want, with virtual reality, which results in an instant sense of ownership. This nudges customers towards signing the purchase agreement.
Next, we will examine the integration of virtual reality in both existing house estate as in new housing estate.
3.3.1. VIRTUAL REALITY IN EXISTING HOUSING ESTATE
At the end of the 20th century, real estate companies from Europa and North America started to use virtual reality instead of computer models and maps. By replacing them, virtual reality became a major design and sales tool (Kun & Zong, 2009).
Nowadays, some real estate agencies use these technologies to create the illusion of walking in the house. Rent Net is given as an example (Lang & Sittler, 2015). This company from San Francisco has a large database of apartments on its website, where people can navigate through houses thanks to this technology. The asset manager of Benj E. Sherman & Sons states that you will not be able to rent out your apartments in three to five years if you do not have the virtual capacity. Dewaele Group is an example of a real estate agency in Belgium that has already invested in the technology (Petitjean, 2020). They provide their website of 360° images, so people can navigate through the properties online.
On the downside, Gustave, the vice president of GSB, an online real estate company in New York, stresses that virtual reality is expensive and time consuming for the investor. Nevertheless, everyone that is involved in the process of renting an apartment will benefit from it. This is because people will be less prone to visiting apartments in which they are not interested in.
Another area of the virtual reality world that has been researched is the augmented reality in real estate. There are apps where people can gather information about houses generated by real estate search engines. By pointing the camera at the house of interest, people get the price and additional information about the house (Kummerow & Lun, 2005). The paper predicts that the use of augmented reality is going to increase in terms of users and in terms of areas. This technology is going to help people gather information since the knowledge on the internet keeps on growing. Kummerow & Lun state that the real estate field will benefit from this emerging technology because the use of this technology enhances the customer perspective on the real estate market.
Moreover, virtual reality can also be used in the display of real estate. On real estate websites, there are already a lot of pictures and information about houses. However, certain important factors of buildings cannot be presented in two-dimensional images (Kun & Zong, 2009). Here, virtual reality can offer a breakthrough in these limitations. As a result of this technology, people will be feeling much more immersed, which is a great opportunity for real estate.
Looking at how real estate has been influenced by technologies, mainly communication and information technologies (Kummerow & Lun, 2005), we acknowledge that technological evolutions have made life easier for both the real estate agents and buyers of houses. Technologies such as virtual reality, have helped them be better informed in their search for a new house (Downes & Lange, 2015).
Initially, many believed that when virtual reality tours were introduced in the real estate market, the relationship between the seller and the agency would disappear. However, this technology had a positive impact on the productivity and quality service of real estate brokerages. The study of Kummerow & Lun states that in the future, the time of both real estate agents and consumers will be used more efficiently in the real estate market. By showing 30 virtual house tours first, real estate agents can narrow the physical visits down to six instead of 20. This will substantially reduce the time invested in the search for a house.
3.3.2. VIRTUAL REALITY IN NEW HOUSING ESTATE
Virtual reality is mostly being used in new housing real estate. As this market is a high-budget market, they make use of virtual technologies. With architectural visualization, project managers can visualize the project when introducing it to the buyer. It is used as a communication tool (Petitjean, 2020). This technology provides an opportunity to present an idea of how it would look like in the real world. This type of virtual reality is called “virtuality”. With this technology, the designer can show the to-be-build building, and on top of that, he can “visit” the building with potential buyers. Thanks to this technology, people can get a feeling of the place and interact with it (Kun & Zong, 2009).
3.3.3. REAL ESTATE IN TIMES OF COVID-19
The year 2020 will be a year to remember. In December 2019, COVID-19 introduced itself in Wuhan, China (Culp, 2020), and from there, spread around the world. Less than four months later, the virus had reached all corners of the globe and impacted the lives of many people and businesses worldwide.
Once it became clear that the virus was also present in Belgium and very contagious, the government took drastic measures to stop the virus from spreading. They decided to cancel all social events for several weeks and evens months, close companies that can work from home, and many more measures were taken.
Many businesses had to adapt their way of working, since March 2020, due to the COVID-19 crisis. Hence, real estate agencies as well. Real estate offices had to be closed, and they could not arrange meetings with potential sellers, or potential buyers. Due to these measures, some real estate agencies were looking for alternative ways to keep satisfying their clients (Basto & Pereira, 2012). Matterport has been used as a technology to create a virtual house tour instead of real-life house tours (B., 2020). This allowed customers to visit properties they were interested in, so they did not have to wait until after the crisis. This technology allowed real estate agents to continue their jobs in a limited way.
4. PROBLEM STATEMENT
Already numerous researches have looked into certain fields of virtual reality on its own because this type of technology is becoming more relevant in the business world. However, there are still several areas that have not been investigated.
The papers mentioned above investigated multiple fields of virtual reality but never explicitly. They never investigated how people would perceive this type of technology in comparison to real-life situations. Therefore, this paper will investigate peoples’ perception of virtual reality in real estate in general, and in times of a pandemic.
This technology has been proven helpful in many different fields. However, it has not yet been specifically investigated in the real estate sector. It is not yet clear if virtual reality can be beneficial for the real estate sector.
While virtual reality has been widely investigated and discussed, there has not yet been a study about the different possibilities it could have in real estate and how people would perceive it, being implemented in the services of an agency. This virtual reality field has not been investigated widely at the moment, so this creates a lot of room for this paper to investigate different sides in this field.
The last remark is that the investigations were mainly done in other countries, not in Belgium. The main information about virtual reality in real estate and its benefits is found in America.7 The National Association of Realtors does many studies in the market. According to them, homebuyers can more easily visualize the property as their future home. In Belgium, little research has been done on the influence of virtual technology in the real estate market.
4.1. RESEARCH QUESTIONS
For this paper, as there is not much research that has been done in the past, the perception of virtual reality will be the most important factor that is analyzed.
First, it will be analyzed whether the COVID-19 crisis impacted the real estate market in general if people changed their behavior due to the crisis. The next questions concern the perception of virtual reality and its changes in different circumstances or according to demographics.
What is the possible success of virtual reality in the real estate business in Belgium?
- Does the COVID-19 crisis influence the behavior of people?
- Does the perception of virtual reality in the real estate sector change in different situations (pandemic versus no pandemic)?
- Does the perception of virtual reality in the real estate sector change in function of the decision that has to be made?
- Are there differences among people regarding the perception of virtual reality in real estate?
5. METHODOLOGY
5.1. GOALThe main goal of this paper is to give additional insights into the real estate business in Belgium. This paper aims to investigate the possible success of virtual reality in the real estate sector. Previous research has proved that this type of technology can be very efficient and helpful in numerous fields. However, how virtual reality can help the real estate sector and real estate agencies, has not yet been investigated.
Specifically, this paper investigates how people perceive the technology “virtual reality” when used in the real estate sector. This paper tries to answer whether people see this as an absolute alternative for real-life visits, or whether they are rather skeptical towards this technology.
Next, this paper investigates how the coronavirus has impacted the buying behavior of people in the real estate sector. It will be analyzed whether people have changed their behavior when deciding whether or not they will buy or rent houses.
It will also be investigated whether or not people perceive virtual reality differently in different circumstances. To be specific, there will be taken a look at the different circumstances regarding situation, being a pandemic or normal circumstance. Next, there will be looked into the fact that there might be a different perception regarding the decision that has to be made, either to buy or to rent a living space.
Finally, there will be looked into the demographics of the participants, and there will be discussed whether or not there are some different perceptions based on demographics.
The results conducted from this paper can contribute to the efficiency of real estate agencies and give them a clear insight into how they can incorporate these types of technologies into their business.
5.2. SAMPLE
5.2.1. PARTICIPANTS AND SAMPLE COLLECTION
The survey was created, and the data was collected online, through Qualtrics. The participants had to answer 50 questions, with the combination of multiple-choice questions, Likert-scales, and a couple of open questions. One question was used to separate tenants from buyers.
5.2.2. PARTICIPANT PROFILE AND REQUIREMENTS
Participants who either had experience in the Belgian real estate market or who are currently active on the Belgian real estate market by looking to rent or buy a living space were eligible to participate in the study. This proposed study was published on the Internet, across groups of Facebook and shared across the platform.
Overall, 211 surveys were completed, with 122 surveys completed fully. The general demographics were 80 females and 42 males with a mean age of 33 years (SD 13,927).
Within these 122 participants, there are 60 buyers and 44 tenants. Six people helped someone purchase a house and four persons who helped someone with the rental of a house. From now on, these people will be seen as the buyer and the tenant itself. Eight people indicated they were none of the above, but when looking further, we acknowledged that, among these eight people, there were five buyers and one tenant on top of the previous ones. In conclusion, there are 71 buyers and 49 tenants.
For 64 participants, the current purchase was their first experience with buying or renting a house. For the other 58 participants, it was not their first experience with the real estate market.
5.2.3. SAMPLE SHAPING
First, data set cleaning was based on whether the participants had completed the survey. The survey was deleted if the survey was not completed for the full 100%. Overall, 89 surveys that were deleted from the dataset, due to incompletion.
5.2.4. DESCRIPTIONS OF THE VARIABLES
Decision
First, people were asked who they were, tenants or buyers. Then, they got the question when they decided to look for a living space. The year and the (likely) month were asked. Most people decided to move in 2019.
Corona crisis
In order to measure the effects of the corona crisis, the participants were first asked if they had already bought or rented the living space. Among the buyers, 89,4% had already signed the purchase agreement before the crisis. Among the tenants, this percentage was 79,2%.
Overall, there were only six participants that decided to move during the pandemic. The other participants had decided to move before the corona crises.
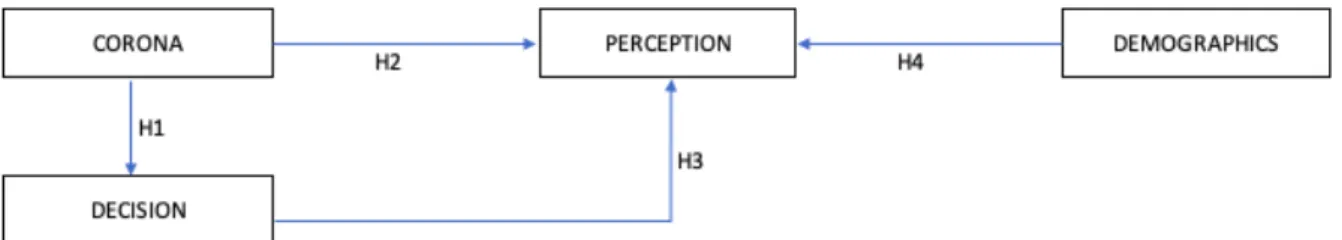
H1: The corona crisis has influenced the behavior of people.
As there were only a few people who could answer these questions, the analysis of this hypothesis will be short.
Only 17 participants did not yet sign the purchase agreement, so only these people were able to answer whether or not the corona crisis has influenced their behavior. Among these 17 people, four people indicated they were more actively searching for a new living space, and four people stated the opposite.
The degree to which these persons altered their behavior varied for each individual. For the participants who stated they were less actively searching, the answers were as follows:
- One person answered, “0%, I am still as actively involved in the search as before.” This answer states that they did not change their behavior, which contradicts their first answer. As a result, there are only three people who are less actively searching instead of four.
- One person answered, “25%, I have made minor adjustments, but I am still actively searching”.
- One person answered, “75%, I am way less actively involved in the search than before”. - One person answered, “90%, I postpone it until after the crisis”.
For the participants who stated they were more actively searching, the degree of change was as followed:
- One person answered, “25%, I have made minor adjustments, but these are not large changes”.
- One person answered, “50%, I am more actively involved in the search than before”. - One person answered, “75%, I am much more actively involved in the search than
before”.
- One person answered, “90%, the crisis was the decision most important factor, but I had already thought about buying/ renting a new living space”.
Among the people that were more active in their behavior, 75% stated that their need to move increased after the corona crisis introduced itself to the world.
One question was asked to see if the general situation changed for people due to the corona crisis. The answer was “No” for 13 of 17 people and “Yes, but not due to the corona crisis” for the other 4.
Because the number of respondents for this part of the survey is too low, no further analysis of the hypothesis can be conducted.
Perception
In different situations (pandemic versus no pandemic)
The perception of the technology of virtual reality was first measured in 2 different situations. The first being the perception under normal circumstances, without a pandemic. Second, the perception of virtual reality was measured under the condition of a pandemic.
H2: The COVID-19 crisis influences people’s perception of virtual reality.
In different decision processes
After that, the perception of virtual reality was measured, and participants were asked questions for different decision processes, being buying versus renting.
H3: The perception of virtual reality depends on the decision that has to be made (renting versus buying).
Last, different statements were given to the participants, and they had to answer whether they agreed with the statement.
H4: There is a difference in perception regarding demographics.
5.3. PROCEDURE
The format of the study was created to validate the type of respondent first. The survey then branched into different questions for different types of participants. At last, the survey merged again to ask general questions.
After the survey’s introduction, the respondents had to answer the question about who they were, being either a buyer, a tenant, someone who helped with the purchase, or someone who helped with the renting of a property.
Secondly, questions were asked about when they decided to move and search for a new living space.
The influence of the corona crisis was being investigated in the next section. Participants had to state whether the crisis had influenced their behavior and to what extent this happened. If the corona crisis did influence their behavior, they had to give reasons why this had happened. The last question for this part measured whether the general situation changed.
In the next block, the perception of virtual reality was measured. There were two different situations, being in normal circumstances or during a pandemic. The next measure was the level of attractiveness of the technology regarding the decision that had to be made. Also, a question was asked to see if people think there is a type of building for which the technology can be more interesting. The last question in this part of the survey was whether or not the technology could be more interesting for some parties than others.
The next block handled the perception of virtual reality for different decision processes, being renting and buying. The perception was measured for two different technologies, virtual reality goggles and 360 images, in two different circumstances, buying and renting. People had to check the different phases of the buying process in which they thought the technology could be useful. After they did that, they had to describe why they thought or didn’t think the
In the next part of the survey, there were different statements given to the participants, where they had to indicate to which extent they agreed with the statements. Also, the participants were asked whether they preferred an agency with or without the virtual reality technology.
At last, the survey gathered information about the participants. The experience in the real estate sector was questioned, as well as the general demographics, age, sex, and education.
Block Content Aim Scales
1 Introduction A brief explanation of the study and a question to determine what type of person the participant is
- Type of person
2 Decision moment
To see when they decided to buy or rent a house.
3 Corona crisis To see whether or not corona has had an influence on behavior and how.
- Change of plans - Level of alterations - Reason for alterations - Change of situation 4 Perception in
different circumstances
Likert scales to measure perception in different circumstances (pandemic versus no pandemic) and other questions to see when the technology would be more interesting. - Perception normal circumstances - Perception in pandemic - Level of attractiveness - Type of building - Attractiveness party 5 Perception for different decisions
To see in which phases people think the technology will be the most or least interesting
- VR goggles buying - VR goggles renting - 360 degrees buying - 360 degrees renting 6 Perception of replacement and efficiency
Likert scales and multiple-choice questions to measure the perception of efficiency.
- Perception of replacement - Perception efficiency - Importance technology agency 7 Demographics - Sex - Age - Experience - Education
6. ANALYSIS
6.1. DESCRIPTIVE STATISTICS
As previously discussed, the survey was completed by 80 female and 42 male participants. The total age range is 21 – 76 years old. The most prominent age groups are 23 (17 participants), 25 (15 participants), and 26 (15 participants) years old.
It is worth mentioning that 58 are more experienced with the real estate market, and for the other 64 participants, it was their first experience. Among the 122 surveys, there are 71 buyers and 49 tenants.
In terms of education, 50,8% of the participants have a master’s degree (62 participants), 19,7% a university bachelor’s degree (24 participants), 13,9% a non-university bachelor’s degree (17 participants), 14,8% a secondary degree (18 participants) and 0,8% a primary degree (1 participant).
When looking at the question that was asked about when people would find the technology interesting, the following results can be observed.
Case Percentage
To buy a place 3,1%
To rent a place 4,3%
Both, but especially to buy a place 14,9% Both, but especially to rent a place 23% Both, and as interesting for both cases 46,6%
None 8,1%
TOTAL 100%
When looking at these percentages, 91,9% thinks the technology is interesting for at least one of the cases, buying or renting, and 84,5% states that it is interesting for both of them.
6.2. FACTOR ANALYSIS
A factor analysis is conducted to verify the independence and the used scales. This analysis is used to test the distinction in scales per construct. Only scales that measure the same constructs are included.
For this study, an exploratory factor analysis is executed. For the exploratory factor analysis, a Principal Component Analysis (PCA), including a Varimax rotation is used, because the factors, measuring the same construct, are allowed to be correlated (Budaev, 2010).
6.2.1. EXPLORATORY FACTOR ANALYSIS
First, the corona dimensions’ scales are analyzed. As this is not measured on a 7-point Likert scale, an exploratory factor analysis will not be possible for this part.
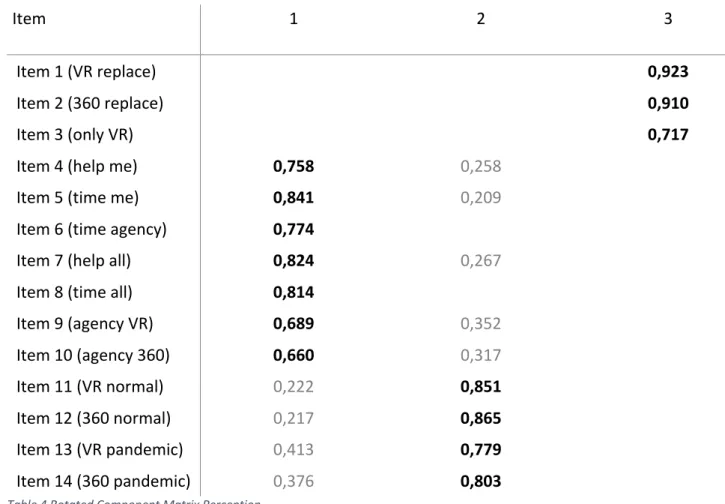
Further, the scales concerning the perception are analyzed that are measured on a 7-point Likert scale. When checking the statistical assumptions, KMO = 0,798 hence significantly greater than 0.50, and the null hypothesis of Bartlett’s sphericity test is rejected with p < 0.001. This indicates that the variables are sufficiently correlated (Basto & Pereira, 2012). Three factors with an eigenvalue greater than 1 explain 72.53% of the total variance, and the scree plot bends at two factors, indicating that two or three factors should be retained (George & Mallery, 2003).
Looking at the Rotated Component Matrix in table 4, it can be stated that the factor loadings are high enough for each item, so each item describes another component. There is
unidimensionality, and there is no cross-loading. Looking at the factors that are grouped, they
Item 1 2 3
Item 1 (VR replace) 0,923
Item 2 (360 replace) 0,910
Item 3 (only VR) 0,717
Item 4 (help me) 0,758 0,258
Item 5 (time me) 0,841 0,209
Item 6 (time agency) 0,774
Item 7 (help all) 0,824 0,267
Item 8 (time all) 0,814
Item 9 (agency VR) 0,689 0,352 Item 10 (agency 360) 0,660 0,317 Item 11 (VR normal) 0,222 0,851 Item 12 (360 normal) 0,217 0,865 Item 13 (VR pandemic) 0,413 0,779 Item 14 (360 pandemic) 0,376 0,803
Table 4 Rotated Component Matrix Perception
The exploratory factor analysis was executed to see how the items correlate with each other forming a unidimensional scale with the same underlying structure. As there are no negatives, there is no need to transform the variables. Looking at each item in the different components, the components are:
- Component 1: Perception of efficiency of VR
- Component 2: Perception in different circumstances - Component 3: Perception of replacement
6.3. RELIABILITY ANALYSIS
After the factor analysis, the reliability analysis is conducted, to verify reliability of the used scales and checks internal consistency. The reliability analysis checks the reliability per scale for the included items. The following rules of thumb by George & Mallery (2003) are applied: α > 0.90 ‘excellent’; α > 0.80 ‘good’; α > 0.70 ‘acceptable’; α > 0.60 ‘questionable’; α > 0.50 ‘poor’ and α < 0.50 ‘unacceptable’.
First, the perception of efficiency is being analyzed. Cronbach’s Alpha is 0,915, and it would not be larger when an item is deleted, so each item is retained. The mean of 7 items was performed. (M: 5,329; SD: 1,116)
Further, there will be taken a look at the perception in different circumstances (pandemic versus no pandemic). Cronbach’s Alpha is 0,908, and Cronbach’s Alpha if item deleted is not larger for any of the items, so none of the items is deleted. The mean of 4 items was performed (M: 5,601; SD: 1,155)
At last, the perception of replacement was analyzed. Cronbach’s Alpha is 0,837, but when the item “I can buy a house, only based on virtual reality” would be deleted, Cronbach’s Alpha would be 0,915, so this item is deleted. Now we only have two items, so Pearson’s r is calculated. Pearson’s r is 0,843, so there is a strong correlation. (M: 2,841; SD: 1,231)
The means of the perception are 5,27 in normal circumstances and 5,93 in times of a pandemic. These means are on a scale of 7, which indicates that, overall, the technology is perceived as positive among people.
6.4. RESEARCH HYPOTHESES
6.4.1. HYPOTHESIS 2: THE COVID-19 CRISIS INFLUENCES PEOPLE’S PERCEPTION OF VIRTUAL REALITY.
To discuss this hypothesis, the questions “What is your opinion about next initiatives in normal circumstances?” and “What is your opinion about next initiatives in times of COVID-19 (or another pandemic)?” are taken into account. It will be investigated if the mean answer to these two questions is significantly different.
In order to investigate this hypothesis, a one-paired sample t-test was used to see if the answers were significantly different for the different questions. A one-paired sample t-test compares the means of variables and tests if they are significantly different (de Pelsmacker & van Kenhove, 2011).
When looking at the results, it can be said that the “perception in normal circumstances” and the “perception in times of a pandemic” were positively correlated (r = 0.682, p < 0.001). There was a significant average difference between the “perception in normal circumstances” and the “perception in times of a pandemic” (t = -8,247, p < 0.001). On average, the perception in normal circumstances is 0,656 points lower than the perception in times of a pandemic (95% CI [-0,812, -0,498]).
6.4.2. HYPOTHESIS 3: THE PERCEPTION OF VIRTUAL REALITY DEPENDS ON THE DECISION THAT HAS TO BE MADE (RENTING VERSUS BUYING).
For this hypothesis, the questions regarding which phases the participants would find the technology of virtual reality interesting, are taken into account. To test the fact that the perception changes when the type of decision changes (renting versus buying), one-paired sample t-tests were used.
For each different phase, it was analyzed whether or not the answer differed significantly based on the type of decision that has to be made.
The question of whether or not participants would find the technology of virtual reality interesting was asked, and they had to indicate their opinion for different phases. The different phases were:
- When you just decided to buy/ rent a house, to make the first selection of houses. - After the first selection, when there is a small interest in a house.
- When you are very interested in a house, after the first impression. - In the phase when you would want to visit the house.
- When you want to decide whether you will buy/ rent the house or not (without a physical visit).
- After the visit (to show to parent or friends). - In none of the phases.
- Other
The question was asked two times: the case in which they wished to buy a house, and the case they wished to rent a house.
After conducting the t-tests, the results were as follows:
attractiveness of virtual reality for renting (t = 5,639, p < 0.001). On average, the attractiveness of virtual reality for buying is 0,13 points higher than the attractiveness of virtual reality for renting (95% CI [0,085, 0,176]).
For the phase of first interest, the attractiveness of virtual reality for buying and the attractiveness of virtual reality for renting were positively correlated (r = 0.703, p < 0.001). There was a non-significant average difference between the attractiveness of virtual reality for buying and the attractiveness of virtual reality for renting (t = 1,389, p = 0.166). On average, the attractiveness of virtual reality for buying is 0,033 points higher than the attractiveness of virtual reality for renting (95% CI [-0,014, 0,080]).
For the phase of interest, the attractiveness of virtual reality for buying and the attractiveness of virtual reality for renting were positively correlated (r = 0.651, p < 0.001). There was a
non-significant average difference between the attractiveness of virtual reality for buying and the
attractiveness of virtual reality for renting (t = -0,202, p = 0.840). On average, the attractiveness of virtual reality for buying is 0,005 points lower than the attractiveness of virtual reality for renting (95% CI [-0,051, 0,042]).
For the phase of wanting to arrange a visit, the attractiveness of virtual reality for buying and the attractiveness of virtual reality for renting were positively correlated (r = 0.750, p < 0.001). There was a significant average difference between the attractiveness of virtual reality for buying and the attractiveness of virtual reality for renting (t = 2,196, p = 0.029). On average, the attractiveness of virtual reality for buying is 0,040 points higher than the attractiveness of virtual reality for renting (95% CI [0,004, 0,076]).
For the phase of deciding whether to buy/ rent or not, the attractiveness of virtual reality for buying and the attractiveness of virtual reality for renting were positively correlated (r = 0.695, p < 0.001). There was a significant average difference between the attractiveness of virtual reality for buying and the attractiveness of virtual reality for renting (t = -2,161, p = 0.032). On average, the attractiveness of virtual reality for buying is 0,036 points lower than the attractiveness of virtual reality for renting (95% CI [-0,068, -0,003]).
For the phase after the visit, the attractiveness of virtual reality for buying and the attractiveness of virtual reality for renting were positively correlated (r = 0.720, p < 0.001). There was a significant average difference between the attractiveness of virtual reality for buying and the attractiveness of virtual reality for renting (t = 3,656, p < 0.001). On average, the attractiveness of virtual reality for buying is 0,083 points higher than the attractiveness of virtual reality for renting (95% CI [0,038, 0,128]).
For the option “none of the phases”, the attractiveness of virtual reality for buying and the attractiveness of virtual reality for renting were moderately and positively correlated (r = 0.459, p < 0.001). There was a significant average difference between the attractiveness of virtual reality for buying and the attractiveness of virtual reality for renting (t = -2,534, p = 0.012). On average, the attractiveness of virtual reality for buying is 0,031 points lower than the attractiveness of virtual reality for renting (95% CI [-0,054, 0,008]).
For the option other, the attractiveness of virtual reality for buying and the attractiveness of virtual reality for renting were very weakly and negatively correlated (r = -0,007, p < 0,922). There was a non-significant average difference between the attractiveness of virtual reality for buying and the attractiveness of virtual reality for renting (t = -0,576, p = 0.565). On average, the attractiveness of virtual reality for buying is 0,002 points lower than the attractiveness of virtual reality for renting (95% CI [-0,010, 0,007]).
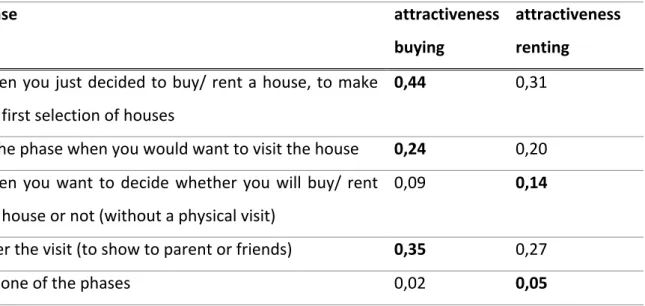
In summary, the following can be observed about the significant differences in attractiveness in different phases: Phase attractiveness buying attractiveness renting
When you just decided to buy/ rent a house, to make the first selection of houses
0,44 0,31
In the phase when you would want to visit the house 0,24 0,20 When you want to decide whether you will buy/ rent
the house or not (without a physical visit)
0,09 0,14
After the visit (to show to parent or friends) 0,35 0,27
In none of the phases 0,02 0,05
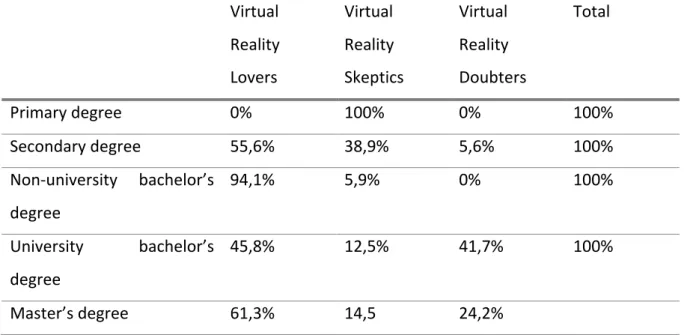
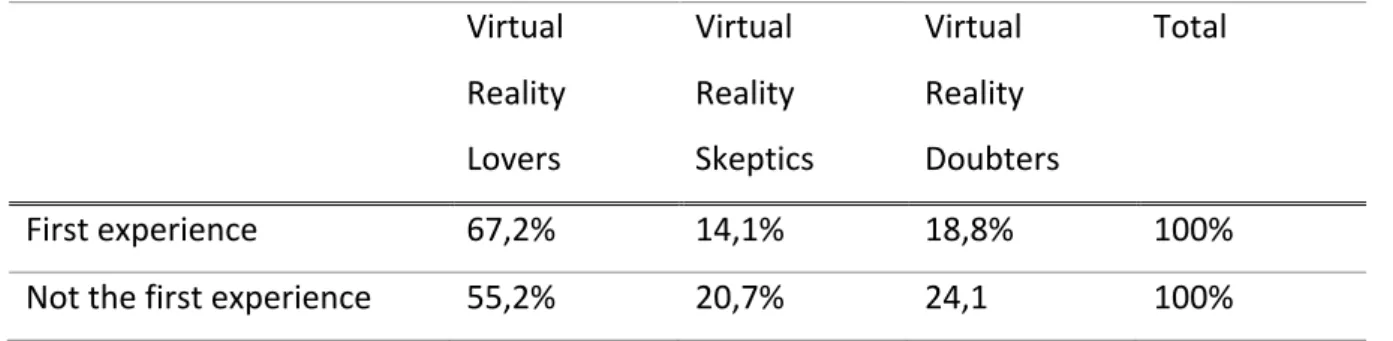
6.4.3. HYPOTHESIS 4: THERE IS A DIFFERENCE IN PERCEPTION REGARDING DEMOGRAPHICS. To discuss if this hypothesis can be accepted; all questions regarding the perception of virtual reality will be taken into account. It will be tested whether or not there are demographic differences among these perceptions. The different demographics are age, sex, education, and experience.
To test if the perception of virtual reality among different groups differs, clusters are made. The variables “Perception” and “attractiveness” are being created. “Perception” takes into account the questions:
- Perception in normal circumstances - Perception in times of a pandemic - Perception of replacement
- Perception of efficiency
“attractiveness” takes into account the questions of whether or not the participants find the technology relevant and attractive in different phases, respectively, for buying or renting. First, the number of clusters had to be decided. The different final cluster centers are represented as follows:
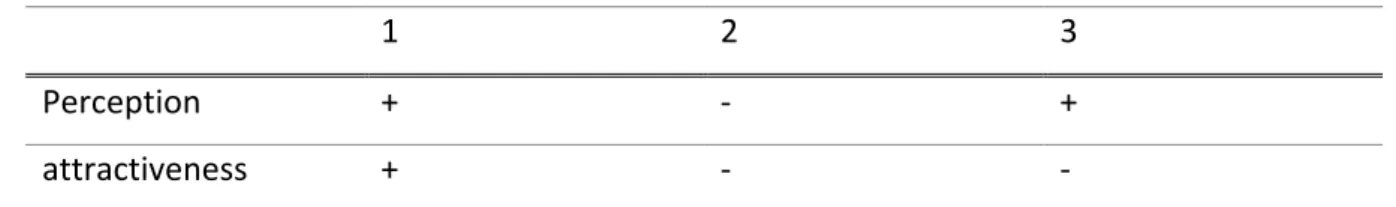
3 clusters
1 2 3
Perception + - +
attractiveness + - -
Table 6: Final cluster centers - 3 clusters
4 clusters
1 2 3 4
Perception + - + -
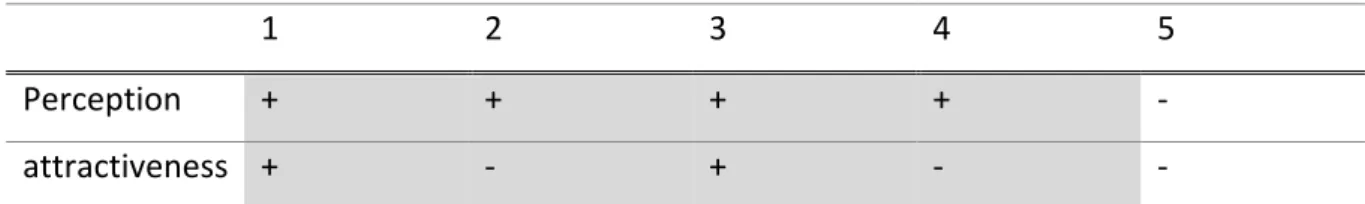
5 clusters
1 2 3 4 5
Perception + + + + -
attractiveness + - + - -
Table 8: Final cluster centers - 5 centers
As groups are being represented twice in the 4 and 5 cluster groups, 3 clusters are chosen:
Virtual Reality Lovers People who have a positive perception of the technology and think it is interesting in many phases of the purchase decision in real estate.
Virtual Reality Skeptics People who do not have a positive perception of the technology and do not think it is interesting in many phases of the purchase decision in real estate.
Virtual Reality Doubters People who have a positive perception on the technology but do not think it is interesting in many phases of the purchase decision in real estate.
Table 9: Cluster names
In order to know if the demographic variables influence the perception of virtual reality, an analysis per demographic variable will be conducted.
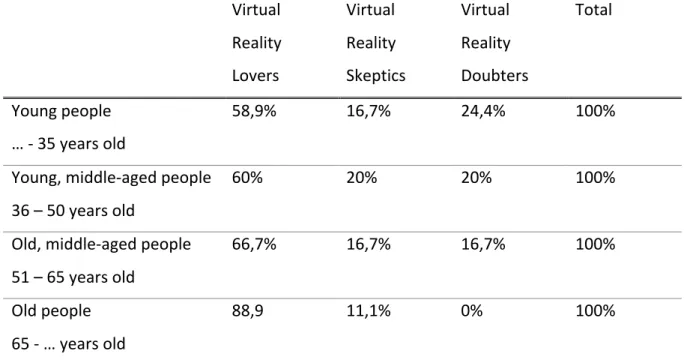
Age
In order to analyze this part of the demographics, age groups are being determined, instead of each age separately. The age groups are as follows:
- Young people: … – 35 years old
- Young, middle-aged people: 36 – 50 years old - Old, middle-aged people: 51 – 65 years old - Old people: 65 - … years old