RIVM report 863001002/2005
Chemical characterization and source
apportionment estimates of particulate matter collected within the framework of EU project HEPMEAP
H.J.T. Bloemen1, M.E. Gerlofs-Nijland2, N.A.H. Janssen2, T. Sandström3, L. van Bree4, F.R. Cassee2
This investigation has been performed by order and for the account European Commission Fifth Framework Programme, Quality of Life and Management of Living Resources, KA 4: Environment and Health QLRT-1999-01582
RIVM, P.O. Box 1, 3720 BA Bilthoven, telephone: 31 - 30 - 274 91 11; telefax: 31 - 30 - 274 29 71
Contact: F.R. Cassee f.cassee@rivm.nl
1. Laboratory for Environmental Monitoring, Environment and Safety Division, RIVM 2. Centre for Environmental Health Research, Environment and Safety Division, RIVM 3. Department of Respiratory Medicine & Allergy, University Hospital, Umeå, Sweden 4. Quality of the Local Environment, Netherlands Environmental Assessment Agency, RIVM
Rapport in het kort
Chemische karakterisatie en bronbijdrageschattingen van fijn stof verzameld in het kader van het EU project HEPMEAP
In het kader van het project ‘Health effects of particles from motor engine exhaust and ambient pollution – HEPMEAP’, een unieke Europese samenwerking tussen toxicologen en epidemiologen, is buitenlucht fijn stof verzameld op diverse locaties in Europa gedurende de periode november 2001 – maart 2003. In het HEPMEAP project zijn relaties tussen de samenstelling van fijn stof en toxische en andere gezondheidseffecten bestudeerd. De chemische samenstelling van twee fracties (0.1 – 2.5 µm en 2.5 – 10 µm) is bepaald met aandacht voor specifieke verkeersindicatoren.
Een groot deel van de massa van het fijn stof bestaat uit anorganisch aërosol (34% nitraat, sulfaat en ammonium). Daarnaast bestaat circa 2% uit organisch materiaal afkomstig van verbrandingsprocessen. Ruwe schattingen van de verkeersbijdrage voor deze twee fracties variëren tussen 30% en 60%.
Behalve grote overeenkomsten in samenstelling van fijn stof op de verschillende locaties, zijn ook locatie-specifieke verschillen gevonden. Zo bleek op de locatie in Noord-Zweden relatief hoge concentraties organisch aërosol in fijn stof voor te komen, wat in een belangrijke mate afkomstig is van houtverbranding.
De gegevens in dit rapport worden gebruikt om de resultaten van experimenteel toxicologisch onderzoek wat ook is uitgevoerd in het kader van dit project, nader te verklaren.
Abstract
Chemical characterization and source apportionment estimates of particulate matter collected within the framework of EU project HEPMEAP .
In the framework of the project ‘Health effects of particles from motor engine exhaust and ambient pollution – HEPMEAP’, a unique European collaboration between toxicologists and epidemiologists, ambient particulate matter (PM) was collected at various sites across Europe during the periods, November 2001 and March 2003. The HEPMEAP project studies the relation between the composition of particulate matter, and the toxicity and health effects.
The chemical composition of fine (0.1 – 2.5 µm) and coarse mode (2.5 – 10 µm) particulate matter is determined with specific attention paid to indicators of traffic emissions. Inorganic ions nitrate, sulphate and ammonium sum to 34% of PM mass and the measured organics from combustion processes up to 2%. Rough estimates of the traffic contributions of these two fractions vary from 30% to 60%.
Besides strong similarities, PM samples from these various locations/sources show
substantial differences in chemical composition. For example, samples from the rural location in Northern Sweden were highly dominated by organic matter, most likely originating from wood combustion. The data presented in this report will provide valuable information for in vitro and in vivo toxicity studies performed within this European Union research project
Preface
The project ‘Health effects of particles from motor engine exhaust and ambient pollution’ (HEPMEAP) is a unique European collaboration between toxicologists and epidemiologists to collect and toxicologically examine ambient particulate matter (PM) fractions to study PM composition-toxicity-health effect relationships. The present project was set out to collect ambient PM fractions using high volume low cut-off inertial impactors at sites throughout Europe with established contrast in road traffic source types and traffic density.
The overall objective of the HEPMEAP initiative is to assess the inflammatory and
toxicological potential of ambient suspended particles in comparison with freshly generated particles obtained from diesel and gasoline engines and to relate these observations to the effects of exhaust on human airways as well as to epidemiological findings of adverse PM health effects.
The results will be discussed also in relation to the physico-chemical characteristics of PM in order to explore the causal factor(s) responsible for the adverse health effects and to facilitate health risk assessment, standard setting as well as the application of cost-effective emission and risk control measurements. The outcomes of this European project are therefore of significant relevance both from the scientific as from a regulatory point of view.
Contents
SAMENVATTING………7
SUMMARY...9
1. INTRODUCTION... 11
2. MATERIAL AND METHODS ... 13
2.1 Particle collection ... 13
2.2 Sampling locations and periods... 13
2.3 Sample pre-treatment ... 16
2.4 Chemical characterization... 17
2.4.1 Elemental composition ... 17
2.4.2 Ionic species ... 18
2.4.3 Polycyclic aromatic hydrocarbons (PAH) and traffic tracers ... 18
2.4.4 Endotoxin ... 19
3. RESULTS AND DISCUSSION ... 21
3.1 Introduction and aims... 21
3.2 General profile... 22
3.3 Specific chemical composition... 22
3.3.1 Metal composition ... 22
3.3.2 Inorganic composition ... 22
3.3.3 Organic composition ... 23
3.3.4 Endotoxin ... 23
3.4 Assessment of the extremes in the composition ... 23
3.5 Source contributions ... 28
3.5.1 Secondary inorganic aerosol (SIA)... 28
3.5.2 Sea Spray Salt (SS)... 28
3.5.3 Crustal material (CRM) ... 28
3.5.4 Traffic (TR) ... 28
3.5.5 Others (including wood smoke)... 29
3.5.6 Synthesis... 29
4. CONCLUSIONS... 35
REFERENCES... 37
Appendix 1 Abbreviations elements... 41
Appendix 2 Chemical composition data ... 42
Samenvatting
Dit rapport beschrijft de resultaten van een in Europa uitgevoerde fijnstofverzamelcampagne. Met behulp van een zogenaamde High-Volume Cascade Impactor (HVCI) werden twee fracties verzameld: grof (2,5-10 µm ) en fijn (0,1-2,5 µm) stof. Dit is op locaties in Nederland, Duitsland, Zweden en Italië uitgevoerd. Daarnaast is ook rechtsreeks fijn stof verzameld vanuit de uitlaat van diesel en benzine gevoede automotoren. Alle fijn stof monsters zijn vervolgens chemisch gekarakteriseerd, waarmee ook een schatting is gemaakt van de bijdragen van emissies van verschillende bronnen.
De veldstudie is succesvol uitgevoerd in de periode tussen november 2001 en maart 2003. Alle veldlocaties zijn tenminste tweemaal bezocht gedurende verschillende seizoenen in het jaar. De massa van de gemeten parameters - elementen, ionen en organische verbindingen – bepalen samen 44% van de totale massa (25 en 75 percentiel: 36 en 53%). Hiervan is 34% nitraat, sulfaat en ammonium (25 en 75 percentiel: 18 en 44%) en de elementen vormen circa 8% (25 en 75 percentiel: 3 en 16%) van de massa. Verkeer lijkt de belangrijkste bron van PM te zijn. Schattingen van de verkeersbijdrage voor deze twee fracties varieert tussen 30% en 60%. Wel moet worden opgemerkt dat het aantal waarnemingen eigenlijk te beperkt is voor een betrouwbaar beeld over bronbijdragen
Naast sterke overeenkomsten blijken er tussen verschillende locaties aanzienlijke verschillen in samenstelling aanwezig te zijn. Zo werden bijvoorbeeld op een locatie in Noord-Zweden zeer hoge hoeveelheden organisch materiaal (polycyclische aromatische koolwaterstoffen) gemeten. Dit kon worden verklaard door grote bijdrage van houtverbranding.
De data die in dit rapport worden gepresenteerd vormen waardevolle informatie voor de interpretatie en evaluatie van de effecten die gevonden zijn in in vitro en in vivo
Summary
This report describes the results of a European-wide initiative for the collection of particulate matter samples. Using High-Volume Cascade Impactor (HVCI), coarse (2.5-10 µm) and fine (0.1-2.5 µm) particulate samples were collected in various locations in the Netherlands, Germany, Sweden and Italy. In addition, PM was also directly collected from diesel and petrol fuelled car engine exhaust. All PM samples were chemically characterized. This characterization was aimed at describing the PM in terms of composition as well as in contributions of main sources.
The sampling campaign has been successfully performed in the period between November 2001 and March 2003. All field locations were sampled at least twice, during different seasons of the year. The measured parameters - elements, ions and organic compounds - amount to 44% of the total PM mass (25 and 75 percentile: 36 and 53%, respectively) of which the ions nitrate, sulphate and ammonium sum to 34% (18 and 44%, 25 and 75
percentile) and the measured elements 8% (3 and 16%, 25 and 75 percentile). Traffic seems to be the major source and the contribution in the fine fraction is higher compared to the coarse fraction. Estimates of traffic contribution to these two fractions vary from 30% to 60%. It needs to be stated that the number of observations is insufficient for a reliable source apportionment assessment.
Besides strong similarities PM samples from these various locations/sources show substantial differences in chemical composition. For examples, samples from the rural location in
Northern Sweden were highly dominated by organic matter, most likely originating from wood combustion.
The data presented in this report will provide valuable information for in vitro and in vivo toxicity studies performed within this European Union research project.
1.
Introduction
There is increasing concern about the possible adverse effects of ambient particulate matter (PM) on human health and the specific role of traffic exhaust emissions like diesel exhaust (DE). Clean air legislation and the various abatement measures have resulted in the decline of the concentrations of the classic air pollutants. However, epidemiology data show adverse health effects at PM concentrations below national ambient air quality standards and health-based guidelines. An important source of air pollution is traffic the volume of which has increased substantially, and, despite improvements in engine technology, so has the amount of emissions from automobile engines. This change in the pattern of air pollution has been paralleled by a progressive increase in the proportion of children and adults suffering with asthma and other allergic diseases. In the literature it is shown that living close to major highways is associated with the development of allergies, and also that the adjuvant effect of diesel particulates on the development of specific IgE directed against airborne allergens is established. Furthermore, epidemiological studies have demonstrated a clear association between cardiovascular morbidity, decreased lung function, increased emergency room admissions and airborne concentrations of PM. Human exposure chamber studies have shown that exposure to diesel exhaust has an acute inflammatory effect on normal human airways.
Uncertainties about health effect-relevant PM characteristics and components and their respective sources seriously complicate the process of PM health risk assessment and standard setting and the application of cost-effective emission and risk control measures. Of eminent importance, both from the scientific and regulatory point of view, is whether the mass concentration of ambient PM and/or its composition is related to the biological activity and toxicity. From this perspective the new EU PM Daughter Directive will also be based on the consideration of controlling the fine fraction of PM10 (i.e. PM2.5) or to relate to a source
related PM fraction like traffic and motor vehicle exhaust emissions.
The pan-European research initiative Health effects of particles from motor engine exhaust and ambient pollution (HEPMEAP) focuses on the inflammatory and toxicological potential of ambient PM related with traffic. More detailed description of scope and overall objectives of the HEPMEAP study are published elsewhere (http://www.hepmeap.org). As part of this project ambient PM was collected at various sites in European countries as well as directly from diesel and petrol fuelled car engine exhaust and was characterized physically and chemically. The characterization is aimed at describing the PM in terms of elemental
composition, acid aerosol related ions and a selection of organic compounds enabling largely the explanation of the found mass as well as in contributions of main sources.
Identical PM material, extracted from the collection medium is to be used for studying the inflammatory and toxicological potential in different in vivo and in vitro biological models by a number of European research groups. These investigations will be published elsewhere. In this report the collection, the chemical characterization and attributing to the main sources is described.
2.
Material and methods
2.1
Particle collection
A High Volume Cascade Impactor (HVCI) with a multi-stage round slit nozzle impactor was used to collect PM fractions on polyurethane foam (PUF) by impaction (Kavouras and Koutrakis, 2001; Demokritou et al., 2002). This instrument was developed by the
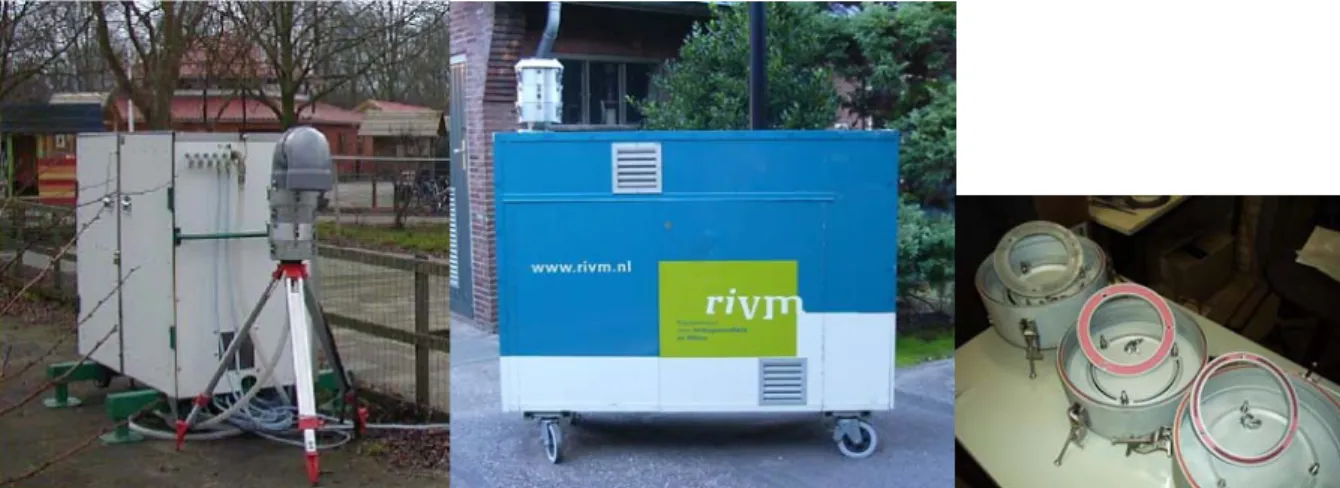
Environmental Chemistry Laboratory at the Harvard School of Public Health. It can be used for the collection of samples for periods up to one week or longer (depending on the particle load) at a flow rate of 900 l/min. The impactor cut-points used are for the range 9.9, 2.46, and 0.12 µm for all the sites except Rome and Hendrik-Ido-Ambacht. For these sites the cut-points were 8.5, 2.35 and 0.12 µm. The cut-cut-points were measured by the manufacturer of the slits. The design features round slit acceleration jets, with corresponding PUF rings for impaction substrates. The jets are mounted in modular cylindrical housings. The housings are stacked in sequence, with the selected stages in proper order (by descending size cut-offs). A removable rain cover is attached to the top stage. An option for the final stage, using a glass fiber filter to collect ultra-fine particles (below the lowest used impactor cut-point) was used in this project, however, ultra-fine particles were not extracted from the substrate and consequently not characterised chemically. The HVCI is shown in Figure 2.1 showing a typical configuration of impactor stages (size cut-offs of 10, 2.5, and 0.1 µm).
Figure 2.1 HEPMEAP PM collection device with the HVCI next or on top of a box with
the pump to pull the air through the impactor (left two panels) and the inside of the HVCI showing the pink PUF with collected PM (black) of the fine mode stage (right panel).
2.2
Sampling locations and periods
The main objective of the HEPMEAP project is the overall analysis on composition-source-toxicity-health effect relationships. In the Dutch ISAAC-II (International Studies of Asthma
and Allergic disease in Childhood) study on respiratory health of children attending schools near highways health effects of ambient PM and the role of traffic emissions were
determined. A close link to the epidemiological and human clinical studies would be beneficial to perform the above-mentioned overall analysis. Therefore, 4 sites in the
Netherlands, characterized by differences in traffic density, were selected close to those used in the Dutch ISAAC-II study. Fine and coarse PM samples were collected for 4-5 two-week periods per site, spaced over a one-year period (November 2001-October 2002).
The Dutch sites are:
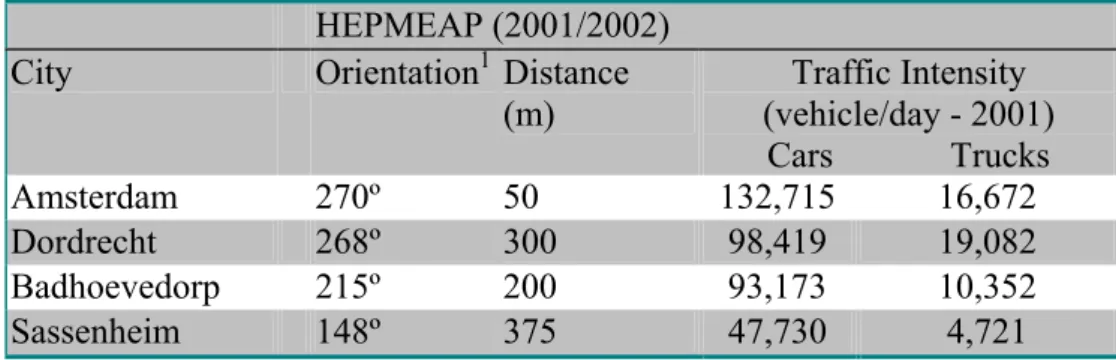
• Netherlands – Amsterdam: located at 50 meters from the road with high car and truck use
• Netherlands – Dordrecht: located at 300 meters from a road with moderate car and high truck density
• Netherlands – Badhoevedorp: located at 200 meters from the road with moderate car and truck use
• Netherlands – Sassenheim: located at 375 meters from a road with low car and truck densities.
The characteristics of the selected sites in the Netherlands are presented in table 1.
Table 1: Traffic characteristics of selected sites in the Netherlands during the HEPMEAP study
HEPMEAP (2001/2002) City Orientation1 Distance
(m) Traffic Intensity (vehicle/day - 2001) Cars Trucks Amsterdam 270º 50 132,715 16,672 Dordrecht 268º 300 98,419 19,082 Badhoevedorp 215º 200 93,173 10,352 Sassenheim 148º 375 47,730 4,721
1 Geographical orientation relative to the road
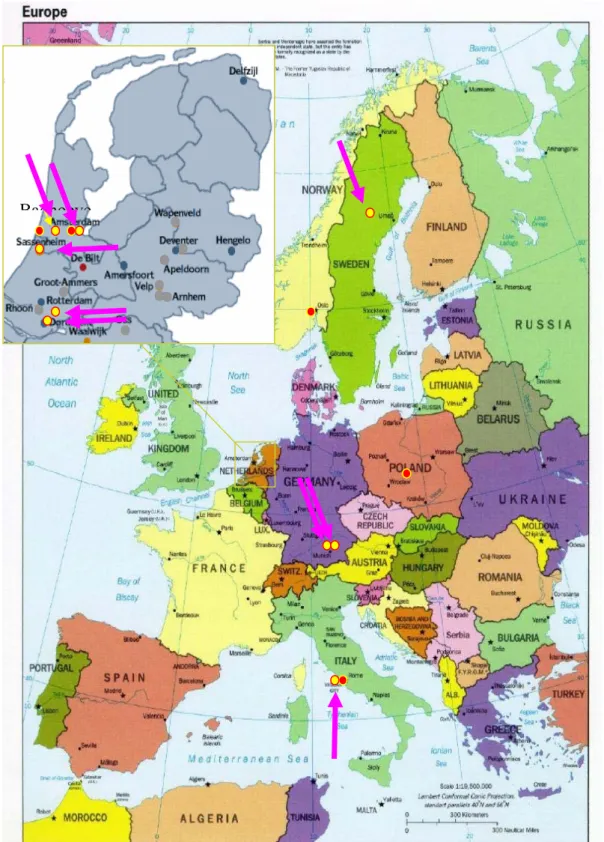
Figure 2.2: Overview of HEPMEAP sampling sites
In Germany (Munich) the number of sampling sites was limited to two due to difficulties locating the collectors at or close to ISAAC-II sites. These two sites were chosen for maximum contrast in traffic density. Eight PM samples were collected over a fortnight at each of those two sites in Germany during 9-months.
• Germany – Munich Ost Bahnhof: located in customs centre Munich, east railway station, close to two major four-lane motorways with very high traffic density
• Germany – Munich Grosshadern hospital: located in a suburban area with university institutes in a residential area on the West side of Munich with low traffic density
Three sites were added to increase the contrast on source/composition/toxicological bioactivity:
• Italy – Rome: a representative Southern European site where the traffic situation is intense but there are differences in vehicle fleet and additional sources (2 fortnight’s samples);
• Netherlands – Hendrik-Ido-Ambacht: a Dutch freeway tunnel which is mainly used by heavy diesel trucks is included in order to distil a diesel exposure atmosphere (2 fortnight’s samples);
• Sweden – Lycksele: a small Scandinavian town of 15,000 citizens located in a rural area with sampling during a cold winter period with inversion pattern. Contribution was expected from the frequent use of wood burning for domestic heating. The area includes local traffic as well as thoroughfare of buses, trucks and other vehicles, but without any major highway in the area. Therefore, this site was included as a
reference with little vehicle contribution to outdoor PM (4 collections; 1 collection of 4 weeks and 3 fortnight’s samples).
In addition, PM fractions obtained from freshly generated diesel and gasoline exhaust were sampled in a special chamber as reference materials. The reference diesel PM was identical to that used in the human exposure studies (Frew et al., 2001; Salvi et al., 1999; Stenfors et al., 2004). Samples in the Dutch freeway tunnel and in Rome were collected according to the Standing Operation Procedure (SOP) published in Cassee et al. (2003). The sampling at the other sites was conducted according to the SOP from the Institute of Risk Assessment Science (IRAS) of the Utrecht University and is available on request.
2.3
Sample pre-treatment
PUF pieces used to collect particulate matter were cut to the correct sizes and cleaned before use. To this end, PUF pieces were sonicated for 30 minutes to 1 hour in an excessive amount water, ethanol (only for samples from the locations Rome and Hendrik-Ido-Ambacht), and 100% methanol respectively and dried. The weight of the foam was determined using an analytical balance. After sampling the foam was conditioned and weighed in the same way. A detailed description of the procedure is given in Cassee et al. (2003) for samples collected in
Rome and Hendrik-Ido-Ambacht. The procedure at the other sites was conducted according to the SOP from IRAS and is available on request.
The PM was extracted from the foam based on the procedure developed by Salonen et al. (2000): approximately 20 ml methanol was added to the tube containing the foam, stirred (vortex) violently and subsequently placed in an ultrasonic bath for 30 minutes after which the supernatant was decanted into a round-bottom flask. This was repeated once more and occasionally twice. The methanol was concentrated (rotary evaporator at 30 ºC, low pressure, approximately 15 minutes) until about 1 ml suspension was left. This suspension was
sonicated in the flask for several seconds to remove the PM from the wall of the flask and divided over weighed and labelled Eppendorf-tubes. The flask was rinsed with 1 ml methanol and sonicated again to remove all PM from the wall of the flask and this suspension was also divided over the Eppendorf tubes. If the flask was still containing PM the rins step was repeated once more. The Eppendorf tubes were transferred to an oven at 30 °C overnight and afterwards conditioned for 24 hrs. The amount of PM per Eppendorf tube was determined using an analytical balance. The tubes were stored at –20 ºC until analysis.
2.4
Chemical characterization
The collected material was characterized by the analysis for an extended suite of elements and ions, organic traffic markers and polycyclic aromatic hydrocarbons (PAHs). The selection of these parameters was based on the notion that they would provide sufficient information to reconstruct the mass by using the parameters as proxies or tracers for the mass not measured. The amount of sample necessary for each analysis was determined based on the detection limits of the various analysis methods and data on the occurrences of the
compounds, published in the literature. These assumptions were tested with a limit number of samples from other studies. Approximately 10 mg of the collected PM suspended in methanol was used for the characterization. The sample was divided over 4 tubes as methanol
suspension, each for one type of analysis, in portions equivalent to 1 mg (twice), 6 mg and 0.1 mg. The sub-samples were dried under nitrogen and gentle heating (30 oC).
2.4.1 Elemental composition
The supplied methanol sample containing 0.1 mg was evaporated to dryness. The material was suspended with 0.5 ml water and transferred into a digestion vial of the microwave system. The sample cup was rinsed with subsequently 0.5 ml, twice with 1 ml water and thrice with the 1 ml digestion medium (diluted aqua regia:
1 ml 65% HNO3 + 3.3 ml 37% HCl + 3 ml water) and the rinse solutions added to the
digestion vial. The volume of the sample was made up to 10 ml. The sample was digested with the aid of microwave. Afterwards 5 ml water was added to the sample, mixed and the sample was transferred to autosampler vials for analyses with inductively coupled plasma mass spectrometry (ICPMS). Whenever necessary, the sample pre-treatment was extended by
centrifugation or filtration to avoid the transfer of particles into the sample introduction system of the ICPMS.
High sensitivity and the option to deal with many matrix- and plasma-related interferences are required whenever measuring an extended suite of elements. Therefore high resolution (HR)-ICPMS was preferred to quadrupol (Q-) ICPMS. Initially an existing multi-element method with HR-ICPMS was used as a screening method, which was, subsequently
optimised and applied. This method includes the following elements: Li, Be, Br, Na, Mg, Si, Al, K, Ca, Sc, Ti, V, Cr, Mn, Fe, Co, Ni, Cu, Zn, As, Se, Sr, Mo, Cd, Sb, Ba, La, Ce, Nd, Hf, Hg, Sm, Tl, Pb, and U (see appendix 1 for explanation abbreviations). Rh was used as an overall internal standard. The samples were quantified with external 2-point calibration. The used HR-ICPMS was an ELEMENT2 (ThermoFinnigan MAT, Bremen, Germany) equipped with 100 µl/min PFA nebulizer – used in pumped mode - with on-line spiking of the internal standard (1:1), a Scott-spray chamber, Quartz injector and Nickel cones. It was operated in the hot plasma mode (RF power = 1290 W). The runtime of the method
(excluding take-up and wash time of the system) was approximately 3.5 min.
For quality control of the whole procedure and for controlling the completeness of digestion a standard reference material (0.01 g NIST 2710 ‘Montana soil’) was treated in the same way. It was concluded that this was the most suitable reference material for this matrix. Each digestion run included a procedural blank, which was used for the calculation of detection limits. The analyses were performed under the QC/QA system of the laboratory.
2.4.2 Ionic species
Two of the supplied methanol samples, each containing 1 mg were evaporated to dryness, dissolved in water by sonification, filtered to remove remaining particles and analysed using ion-chromatography for chloride (Cl-), nitrate (NO3-) and sulphate (SO42-). These anions were
analysed using a Dionex guard column (AG-4A), separation column (Dionex AS-4A) and pulsed electrochemical detector (Dionex-PED). Detection limits were 0.106, 0.124 and 0.096 mg/l for Cl-, NO
3- and SO42-, respectively. Precision was better than 2%.
After two steps of derivation ammonium (NH4+) was analysed by photometry: at first
ammonium was chlorinated and then derivatised into the blue complex of 5-aminosalicylate. The absorption of this complex is correlated to the quantitative abundance of ammonium and was measured at 660 nm using a continuous flow analyser system (CFA). The analyses were performed under the QA/QC system of the laboratory.
2.4.3 Polycyclic aromatic hydrocarbons (PAH) and traffic tracers
The supplied methanol sample containing approximately 6 mg was evaporated to dryness. An aliquot (50 µl) of internal standards (6 deuterated PAHs andd2-C29-α,α,α,(20R)-ethylcholestane) and 50 ml dichloromethane/isohexane (1:1) was added and the compounds were released by sonification. After filtration the extract was
concentrated by evaporation to nearly dryness and mixed with 0.5 ml standard solution of 2.4-dichlorobenzyltetradecylether, which was used to correct for the variation of the injection
volume. 1 µl was injected (splitless mode) at 290 oC on a 30 m 0.25 mm WCOT DB-5MS
column (film 0.25 µm) using a column temperature programmed from 90 – (ramp rate) - 160 – (ramp rate) – 290 oC in a Fisons 8000 series gaschromatograph equipped with an
Interscience MD800 mass-spectrometer with EI in SIR mode. Detection limits were
approximately 0.1 ng/extract. This method has been tested to give maximum yield for PAHs, as well as traffic markers. Occasionally the samples were loaded with other organic material that deteriorate the chromatographic separation which could be overcome by dissolving the sample in toluene, filtration over a low-binding Durapore PVDF membrane (0.22 µm) and evaporation again to the original volume. Comparison of the chromatograms of a number of samples before and after the clean-up showed no loss (less than 3%) of the PAHs and the selected traffic tracers
The reported PAHs include: naphthalene, acenaphthylene, acenaphthene, fluorene, phenanthrene, anthracene, fluoranthene, pyrene, benzo(a)anthracene, chrysene, benzo(b)fluoranthene, benzo(k)fluoranthene, benzo(a)pyrene, dibenzo(ah)anthracene, benzo(ghi)perylene en indeno(123cd)pyrene and the traffic markers:
17α(H)-22.29.30-trisnorhopane, 17α(H)-21β(H)-hopane, αββ-20R-cholestane, 5α-cholestane, αββ-20R-24S-methyl5α-cholestane, αββ-20R-24R-ethylcholestane. The analysis was performed under the QA/QC system of the laboratory.
2.4.4 Endotoxin
For the analysis of endotoxins, approximately 2 mg of PM was suspended in 1.2 ml pyrogen-free water with 0.05% Tween-20, and vortexed for 40 minutes. Endotoxin was measured in the extract with the kinetic Limulus Amebocyte Lysate (LAL) test, as described by Douwes et al. (1995). Extracts were tested at a 5 fold dilution. The assay was performed using LAL and Endotoxin Standard (BioWhittaker Lot 1L463F and Lot 1L4440, respectively), and the EL808 Ultra microplate reader/KC4 v3.0 software package assay system (Bio-Tek
Instruments Inc.)
3.
Results and discussion
3.1
Introduction and aims
The analysis results are presented in Appendix 1 for all the samples identical as they are to be used in the in vivo and in vitro tests. The HEPMEAP samples mostly consist of 2 one-week ambient air samples and are analysed as the pooled samples. The detection limits are also given in Appendix 1 and used to calculate surrogate results (2/3 of detection limits) for sample set comparisons. Only those elements were included in the evaluation described below for which more than 50% had mass concentrations above the detection limit.
The results are expressed as mass by mass concentrations (ng or µg element or component by mg of PM mass) and this implies that when evaluating the results in the light of known compositions of ambient PMcoarse or PMfine the ambient concentrations of each mode and
hence their ratios are relevant. Furthermore, the sample pre-treatment (extraction and suspension handling) is not optimised or tested for maximum sample integrity and so discrimination of PM constituents might alter the patterns compared to those found in ambient air. However, the sample integrity is especially important to express the source contribution for each PM sample and is of less interest examining the relation between the chemical components and the toxicity of the same PM sample extracted from the collection substrate.
It is relevant to acknowledge that the composition, when expressed as mass by mass concentration, depends on the contributions of all sources to ambient PM and subsequently the relation between the found composition and the real world situation might not clearly be reflected. For example, during dry windy conditions wind-driven crustal material might be the major source although the sample is collected near a heavy traffic location. On the other hand, during wet conditions the contribution of tail-pipe emission might be the most relevant one although the sample is collected at a background location.
It is the objective of the evaluation of the analytical results to describe the composition of the analysed samples in general terms of elemental and compound composition. Although the number of collected samples is relatively small, a second aim was to quantify the
contributions of the main sources for the samples collected at the different sites. This
quantification was performed on PM already extracted from the collection substrate, thereby introducing artefacts that may have decreased the reliability of the assessment. The absence of good and solid source information as well as the limited databases on source profiles, and the limited number of samples collected at each site, do not enable the application of
powerful source apportionment models (or receptor models) such as Chemical Mass Balance, Positive Matrix Factorisation or UNMIX. However, describing the found composition in terms of source contribution overcomes the lack of information on the molecular and crystal form in which the elements are present and so enables the distinction between the various forms based on known general composition of source emissions.
3.2
General profile
The measured parameters - elements, ions and organic compounds - amount to 44% of the total PM mass (25 and 75 percentile: 36 and 53% respectively) of which the ions nitrate, sulphate and ammonium sum to 34% (18 and 44%, 25 and 75 percentile) and the measured elements 8% (3 and 16%, 25 and 75 percentile). The measured organic compounds form only less than 2% of the total mass. The remaining part (median: 56%) consists of the
non-measured elements of which oxygen and hydrogen are the most important ones. Another part, sometimes the main part, are the non-measured organic compounds – with common
instrumentation maximum 20% of the organic compounds can be identified of which only a small portion can be quantified. Furthermore, any loss of material that occurred during the sample pre-treatment will add to the unidentified portion of the PM mass.
3.3
Specific chemical composition
3.3.1 Metal composition
An overview of key metals is provided in Figure 3.1. Significant location specific differences in metal composition were observed. For example, average total iron (Fe) and cupper (Cu) in the coarse fraction were almost three times higher at the Munich Ost Bahnhof location compared to all other locations. It seems likely that railway activities contributed
substantially to these levels. This was also observed to a lesser extent, for the fine fraction. The highest aluminium (Al) content were observed in samples collected in Rome,
irrespective the size fraction, whereas the zinc (Zn) content was at least twice as high at the motorway tunnel at Hendrik-Ido Ambacht compared to all other locations. Magnesium (Mg) was on average substantially higher in the coarse fraction, with slightly higher values for the Dutch locations compared to Munich and Lycksele. The latter are locations that are not influence by sea spray, whereas both the Dutch and Italian will be affected by sea salt. Influence of other sources is not excluded. Even though lead (Pb) is omitted from gasoline, this element is still present at substantial amounts in predominantly the fine fraction. Nickel (Ni) contents varied to a large extent, which highest levels observed in samples collected at Dordrecht and Rome. Vanadium (V), an element that can be associated with oil burning, was significantly higher at locations less than 25 kilometers from the sea or harbour, i.e. Dutch and Italian sites.
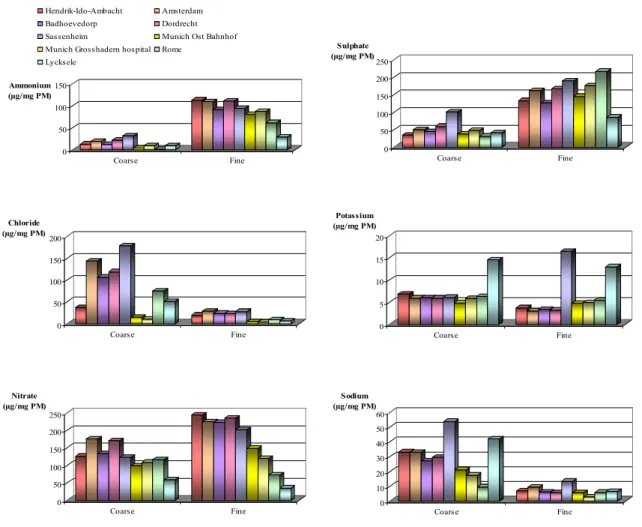
3.3.2 Inorganic composition
With the exception of sodium, and potassium, all other inorganic compounds are
predominantly present in the fine fraction (Figure 3.2). Significant higher potassium (K) values were measured in Lycksele samples, but also in the fine fraction of samples taken in Sassenheim, the Netherlands. Wood combustion (see below) usually contributes substantially to K levels, but this can only be confirmed for Lycksele. Chloride levels are lower in Munich which is in line with the fact that PM in this city is not influenced by sea salt.
3.3.3 Organic composition
It is very clear that the levels of combustion related polycyclic hydrocarbons (PAHs) in Lycksele are at least an order of magnitude higher compared to all other sites and that this is related to wood burning (Figure 3.3). The levels of the other measured organic compounds are more comparable.
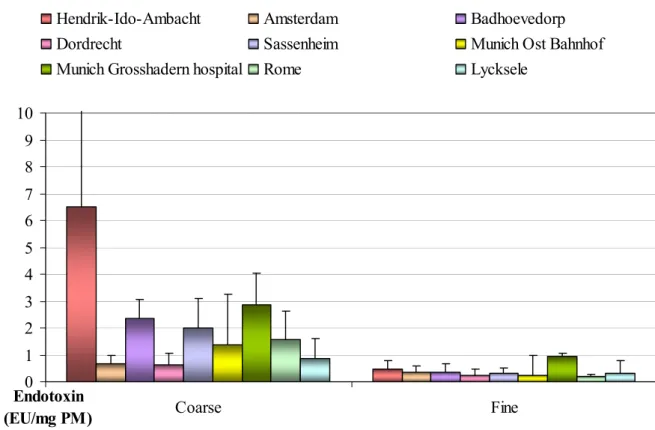
3.3.4 Endotoxin
Relatively low endotoxin levels were measured in all samples (Figure 3.4). The coarse fraction at the motorway tunnel near Hendrik-Ido Ambacht contained the highest levels of all samples, but the variation within the sample set of Hendrik-Ido Ambacht is also substantial. Endotoxin is likely derived from resuspended (road) dust.
3.4
Assessment of the extremes in the composition
To assess the extremes in the composition of the found patterns those mass/mass
concentrations that are twice the average of the concentrations found at the sites or only one third are identified. Raw data used for this assessment is given in appendix 2.
• For Amsterdam high concentrations of La are found in both the fine and coarse fraction. In the fine fraction one PAH (acenaphtene) and one traffic tracer (abb-20R-cholestane) are higher than twice the average. All the measured average
concentrations at the Badhoevedorp site are within the used limits (0.33 – 2.0 site average). For Sassenheim the elements Sr, Ba, Pb, Mg, Na and K and the PAH 2,3,5-trimethylnaphtalene are found to be high in the fine mode whereas NH4 and Cl are
high in the coarse mode.
• For the Dordrecht site only Ni and biphenyl are high in the coarse mode. For Hendrik-Ido-Ambacht Zn is higher than twice the average in both the fine and coarse mode. • For the Ost Bahnhof site in Munich Mo is high whereas Sr, V and Cl are lower than 33% of the average in the fine mode. For the coarse mode the concentrations of the elements Mo, Sb, Cr, Fe and Cu are high. When the PAH concentrations of Swedish site Lycksele are excluded from the calculation of averages the PAHs – phenantrene, anthracene, 1-methylphenantrene, fluoranthene and pyrene are high in both the fine and coarse mode for the Ost Bahnhof site.
• For the Grosshadern hospital site in Munich the elements Cl, V, La, Ba and Sr are low in the fine mode and Ca as well as acenaphtene and anthracene are high in the coarse mode.
• Lycksele is characterised by extremely high concentrations of the nearly all PAHs in both the fine and coarse modes. Along high concentrations of K in the coarse mode the concentrations of Sb, La, Ca, V, Cr and Fe are low in the fine mode.
It is difficult to give some general conclusions from this data but some observations are obvious just by observing the data without using source apportionment methodologies.
• The frequent use of wood burning for domestic heating in the small town of Lycksele, during a period of cold weather with tendency to inversion, most likely caused the high concentrations of PAHs. The high concentration of K(a vegetation-burning tracer) supports the conclusion that particulate matter for a major part originates from vegetation burning.
• The high concentrations of some of the PAHs at the Amsterdam, Sassenheim and both Munich sites might be related to traffic. Other high elemental concentrations at these sites might be related to tail pipe emissions (V, Cr, Fe and possibly Sr, La, Ba). • Noticeable are the high concentrations at the Munich Ost Bahnhof site for Mo, Cu,
Cr, Sb and Fe. Based on the available data a rough indication for a source type can be given: railway activities are likely to contribute to these high metal levels, in
particular Fe and Cu. It is also likely that these are all in the oxidized form (Fe2O3
0 50000 100000 150000 Fe (ng/mg PM) Coarse Fine Hendrik-Ido-Ambacht Amsterdam Badhoevedorp Dordrecht
Sassenheim Munich Ost Bahnhof
Munich Grosshadern hospital Rome Lycksele 0 5000 10000 15000 20000 25000 Mg (ng/mg PM) Coarse Fine 0 150 300 450 600 750 Ni (ng/mg PM) Coarse Fine 0 100 200 300 Cr (ng/mg PM) Coarse Fine 0 10000 20000 30000 Al (ng/mg PM) Coarse Fine 0 2000 4000 6000 Zn (ng/mg PM) Coarse Fine 0 500 1000 1500 2000 2500 3000 Cu (ng/mg PM) Coarse Fine 0 200 400 600 800 1000 1200 Mn (ng/mg PM) Coarse Fine 0 300 600 900 1200 Pb (ng/mg PM) Coarse Fine 0 100 200 300 400 V (ng/mg PM) Coarse Fine
Figure 3.1 Average transition metal contents of PM per site from HEPMEAP locations.1
1 Mean values for Zn, Ni and Cu include data below the detection limit and that are set as 2/3 of this limit see
0 50 100 150 200 250 Sulphate (µg/mg PM) Coarse Fine 0 50 100 150 200 Chloride (µg/mg PM) Coarse Fine 0 50 100 150 200 250 Nitrate (µg/mg PM) Coarse Fine 0 5 10 15 20 Potassium (µg/mg PM) Coarse Fine 0 10 20 30 40 50 60 Sodium (µg/mg PM) Coarse Fine 0 50 100 150 Ammonium (µg/mg PM) Coarse Fine Hendrik-Ido-Ambacht Amsterdam Badhoevedorp Dordrecht
Sassenheim Munich Ost Bahnhof
Munich Grosshadern hospital Rome Lycksele
Figure 3.2 Average inorganic contents of PM per site from HEPMEAP locations.
0 200 400 600 Light PAHs (ng/mg PM) Coarse Fine Hendrik-Ido-Ambacht Amsterdam Badhoevedorp Dordrecht
Sassenheim Munich Ost Bahnhof
Munich Grosshadern hospital Rome Lycksele 0 1000 2000 3000 4000 Heavy PAHs (ng/mg PM) Coarse Fine 0 5 10 15 20 25 Hopanes (ng/mg PM) Coarse Fine 0 5 10 15 20 Steranes (ng/mg PM) Coarse Fine
Figure 3.3 Average organic contents of PM per site from HEPMEAP locations2.
0 1 2 3 4 5 6 7 8 9 10 Coarse Fine Endotoxin (EU/mg PM)
Hendrik-Ido-Ambacht Amsterdam Badhoevedorp Dordrecht Sassenheim Munich Ost Bahnhof Munich Grosshadern hospital Rome Lycksele
3.5
Source contributions
As mentioned before, the dataset of this project does not allow the use of source
apportionment methodologies. To arrive at some indication of the contribution of the major sources the following approach is followed:
3.5.1 Secondary inorganic aerosol (SIA)
SIA consists of the mass of the ammonium sulphate and nitrate. In particular for ammonium nitrate the sample integrity when applying the pre-treatment procedure has not been
optimized. Furthermore the amount of ammonium hydrogen sulphate compared to ammonium sulphate is not known and for assessing the relative contribution not relevant. Another relevant source for sulphate is sea spray salt, on mass base it contains 25% of the mass of Na. Hence:
SIA = NH4 + [ SO4 - SO4, SS ] + NO3
3.5.2 Sea Spray Salt (SS)
Assuming that SS is the only source for Na the total mass contribution of SS can be assessed. This assumption does not hold when de-icing salt is used. The mass contribution is based on the following composition (Na : Cl : SO4 : Mg : K : Ca = 1 : 1.79 : 0.25 : 0.12 : 0.036 : 0.037)
covering the major part of SS.
3.5.3 Crustal material (CRM)
CRM consists of Si , Al, Ca, Fe, K, Mn and a suite of other elements. Crustal material will vary in composition with the sites and so a single tracer not modified by other sources or activities needs to be used. As the sample has been in contact with glass the Si content might be overestimated. Ca might be added to enrich the soil at agricultural areas. Fe, K and Mn will also be part of profiles of other sources, in a mineral form or just as e.g. chloride. Hence Al is used as the tracer although this might also originate form traffic emissions but to a negligable rate. The following composition is used:
Al : Ca : Cl : Fe : K : Mn : Si : Ti = 1 : 0.38 : 0.01 : 0.65 : 0.15 : 0.01 : 2.95 : 0.06. This composition is derived from the source profiles published in the Speciate database of
US.EPA. All these elements explain 42% of the total mass of CRM and a correction factor is applied to take into account the oxygen content.
3.5.4 Traffic (TR)
SIA, SS and CRM explain 46% (39% and 59%, 25 and 75 percentile) of the mass. It is assumed that the remaining part is due to the contribution of traffic and a number of other sources. If this assumption holds the regression graph of the remaining portion of the mass on a traffic tracer will give a scatter plot where a linear relation can be defined letting (most of) the data points having a positive addition to the explained part (SIA + SS + CRM). The regression coefficient is the multiplication factor for the tracer to arrive at the traffic
contribution. As the crustal material has already been defined, the traffic contribution does not include the resuspension of dust as far as this consists of crustal material like particles. The concentration of the hopanes and steranes is different for the fine and the coarse mode and so is the optimum use of the concentration data of each of the traffic tracers in order to minimize the uncertainty.
For the coarse mode the compound with the highest concentration (hopane :17a(H)-21b(H)-Hopane ) is used . For the fine mode the sum of the six traffic tracers (HS) is used. Using the regression graph as described above the equation for the traffic contribution to the coarse mode is TRcoarse = 36000 x hopane + 14800. For the fine mode this equation is TRfine = 5600
x HS + 30000. This report will not discuss traffic contributions in more details. This is the topic of a paper entitled ‘High and low volume sampling of particulate matter at sites with different traffic profiles in the Netherlands and Germany: results from the HEPMEAP study’ (Janssen et al, 2005).
3.5.5 Others (including wood smoke)
The limited number of samples, the applied assumptions and the uncertainty in the used profiles does not permit more apportionment and hence the remaining part
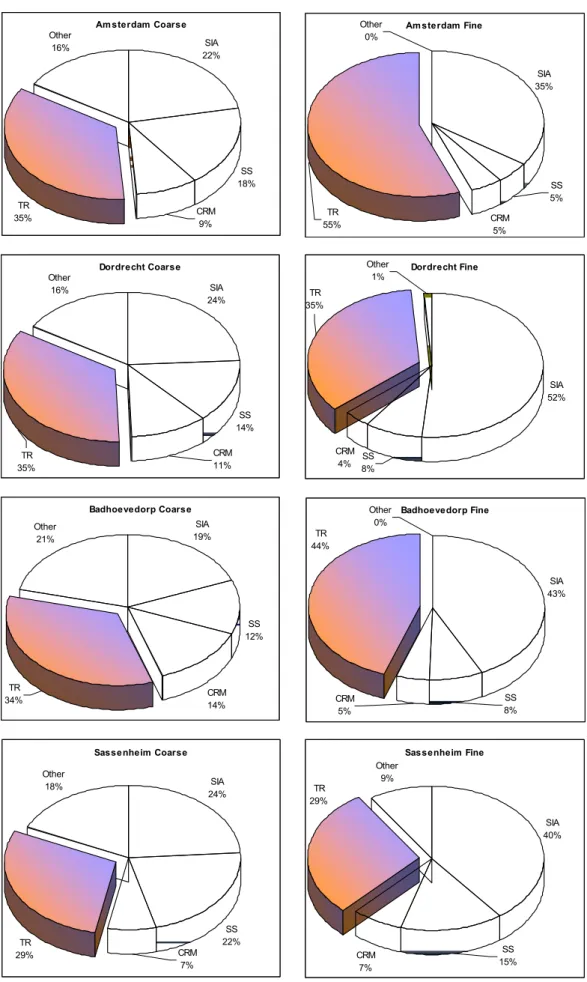
(1 – [SIA + SS + CRM + TR) is the sum of all the other source contributions. The average source contribution calculated with the above-described procedures is given in Figure 3.5 and 3.6 (pie-charts). The calculation included correction for deviation from 100%, including the proportional reduction of all source contributions if the sum of all except ‘Others’ exceeded already 100%.
For some (mostly the Dutch sites) the sum of the contributions exceeded the total mass. This might be caused by the overestimation of the assumed profiles. In the pie-charts this is corrected for proportionally over the contributions. The raw data per collected PM samples (coarse, fine) from each site are listed in Appendix 3.
3.5.6 Synthesis
High contributions of one source will automatically reduce the percentage contribution of other sources. The source estimates should be judged with this comment in mind.
The composition of the coarse mode collected at urban sites in the Netherlands and in Germany shows only moderate variation. At the Dutch sites the contribution of secondary inorganic aerosol and sea salt are slightly higher than at the German sites whereas the contribution of traffic and other sources are slightly higher at the German sites. The contribution of crustal material is more or less the same at all urban sites (12%). The
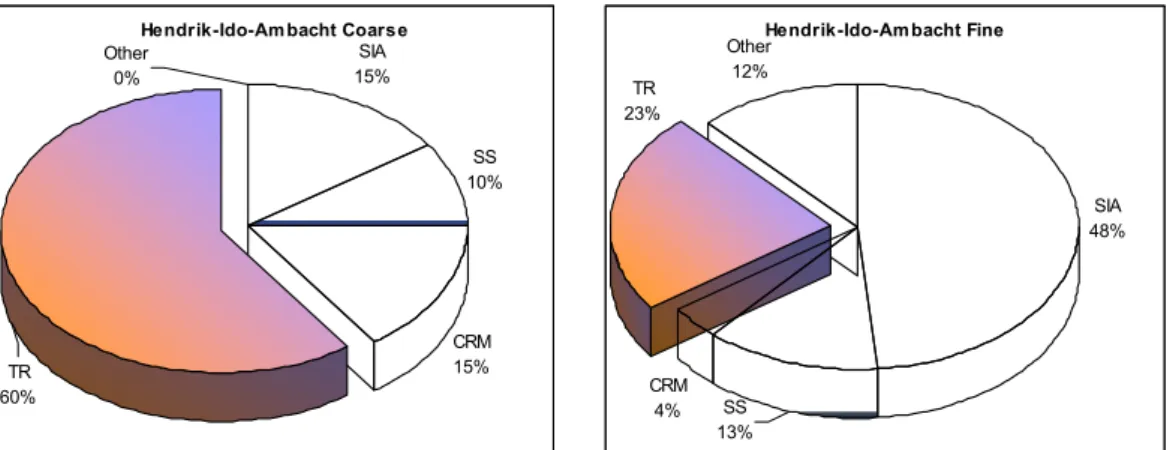
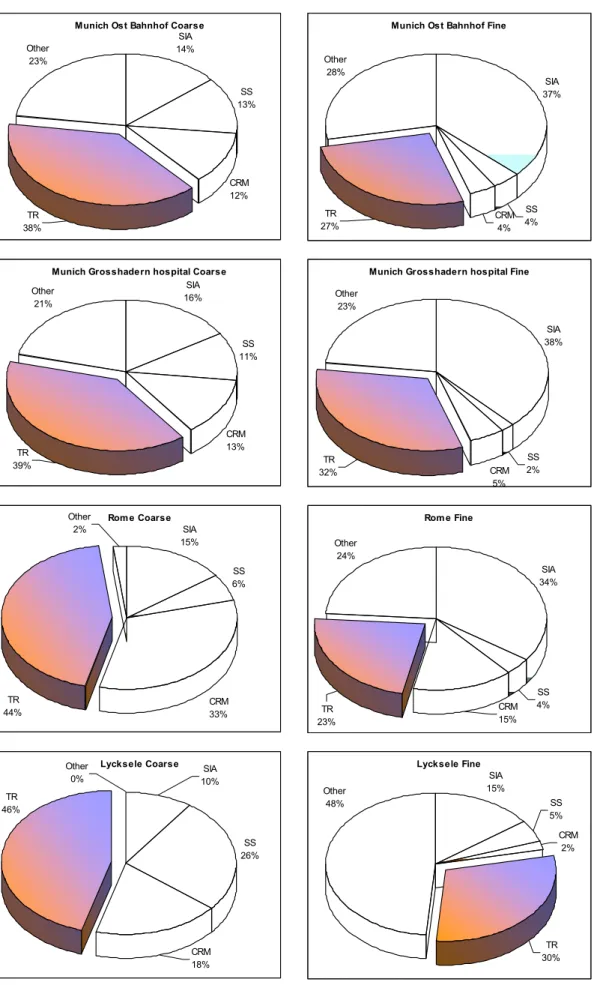
contribution of traffic in the Hendrik-Ido-Ambacht samples and Lycksele samples are higher than at the urban sites, 60% and 46% due to the nearby traffic tunnel and the low impact of other sources, respectively.
The fine mode shows more variation for some of the source contributions. Sea salt is for obvious reason (proximity to the sea) less in the German samples (averages of 9 and 3% respectively for the Dutch and German samples), which is a larger difference than for the coarse mode (15% and 12%, respectively). As argued before, this comparison should also take into account the absolute contribution of other sources. The relative contribution of traffic is higher in the Netherlands samples than in the German ones whereas the contribution of other sources in the Dutch samples is almost negligible (2%) and in the German sample account for a quarter (26%). In particular the Ost Bahnhof site is also dominated by railway activities which partially are included in the traffic source estimate. In the Dutch samples no contribution of other sources could be calculated due to the overestimation of one or more of the named sources, possibly traffic.
Figure 3.5 Average source contributions for the Dutch HEPMEAP sites Am sterdam Coarse SIA 22% SS 18% Other 16% CRM 9% TR 35% Am sterdam Fine SIA 35% CRM 5% Other 0% SS 5% TR 55% Dordrecht Coarse SIA 24% SS 14% Other 16% CRM 11% TR 35% Dordrecht Fine SIA 52% CRM 4% 8%SS Other 1% TR 35% Badhoevedorp Coarse SIA 19% SS 12% CRM 14% Other 21% TR 34% Badhoevedorp Fine SIA 43% Other 0% CRM 5% SS 8% TR 44% Sassenheim Coarse SIA 24% SS 22% Other 18% CRM 7% TR 29% Sassenheim Fine SIA 40% CRM 7% Other 9% SS 15% TR 29%
Figure 3.5 Average source contributions for the Dutch HEPMEAP sites (continued)
Hendrik-Ido-Am bacht Coarse
SIA 15% SS 10% CRM 15% Other 0% TR 60% Hendrik-Ido-Ambacht Fine SIA 48% CRM 4% Other 12% SS 13% TR 23%
Figure 3.6 Average source contributions HEPMEAP sites in Germany, Italy and Sweden
Munich Ost Bahnhof Coarse
SIA 14% SS 13% CRM 12% Other 23% TR 38%
Munich Ost Bahnhof Fine
SIA 37% Other 28% CRM 4% SS 4% TR 27%
Munich Grosshadern hospital Coarse
SIA 16% SS 11% CRM 13% Other 21% TR 39%
Munich Grosshadern hospital Fine
SIA 38% CRM 5% Other 23% SS 2% TR 32% Rome Coarse SIA 15% SS 6% CRM 33% Other 2% TR 44% Rome Fine SIA 34% Other 24% CRM 15% SS 4% TR 23% Lycksele Coarse SS 26% SIA 10% Other 0% CRM 18% TR 46% Lycksele Fine SIA 15% SS 5% CRM 2% Other 48% TR 30%
4.
Conclusions
Over a period of approximately one year samples of ambient particulate matter were successfully collected at a number of sites. This material was collected to test its
toxicological potential in a number of in vitro and in vivo bioassays. In this report, we focus on the chemical composition. A large number of elements and a more limited number of organic compounds were measured along with ions originating from atmospheric reactions and sea spray material.
The main observation is the close resemblance of the composition of material collected at the various sites that are different in terms of traffic intensity and other characteristics. Despite this, some sites (or samples) show distinct differences compared to other sites, for example:
• Samples taken at the Ost Bahnhof site in Munich appear to have much higher metal contents (Fe, Cu, Mn etc) than other locations.
• Potassium, an element that suggests high wood smoke contents was high in Lycksele. • Typical sea spray elements as Na and Cl are higher in the Netherlands compared to
the other locations.
In particular near traffic roads contributions from other sources than tailpipe emissions will vary in the coarse as well as in the fine mode. Nevertheless, the chemical characterization, different in some of the relative concentrations of some parameters (elements, organics or ions) is expected to further the understanding of sources that cause the effects to be found in the suite of biological tests. By the rough estimations of source contributions we could confirm that traffic was often a major contributor to the collected PM and that this effect was by percentage more present in the fine compared to the coarse fraction. The analysis also revealed that in line with the expectations, crustal material is present in the coarse fraction, whereas it is only a minimal fraction in the fine part of PM. It is very likely that the large portion of ‘Other’ fraction in Lycksele is dominated by PM originating from wood combustion as it was a major source of emissions during the collection campaign.
References
Cassee FR, Fokkens PHB, Leseman DLAC, Bloemen HJTh, Boere AJF (2003). Respiratory Allergy and Inflammation Due to Ambient Particles (RAIAP) Collection of Particulate Matter samples from 5 European sites with High Volume Cascade Impactors
-Onderzoeksrapport - RIVM rapport 863001001.
http://www.rivm.nl/bibliotheek/rapporten/863001001.pdf
Demokritou P, Gupta T, Ferguson S, Koutrakis P (2002). Development and laboratory performance evaluation of a personal cascade impactor. J Air Waste Manag Assoc 52: 1230-1237.
Douwes J, Versloot P, Hollander A, Heederik D, Doekes G (1995). Influence of various dust sampling and extraction methods on the measurement of airborne endotoxin. Appl
Environ Microbiol 61: 1763-1769.
Frew AJ, Salvi S, Holgate ST, Kelly F, Stenfors N, Nordenhäll C, Blomberg A, Sandström T (2001). Low concentrations of diesel exhaust induce a neutrophilic response and upregulate IL-8 mRNA in healthy subjects but not in asthmatic volunteers. Int Arch
Allegry Immunol 124 (1-3): 324-325.
Janssen NAH, Meliefste K, Fuchs O, Weiland SK, Cassee FR, Brunekreef B, Sandström T. High and low volume sampling of particulate matter at sites with different traffic profiles in The Netherlands and Germany: Results from the HEPMEAP study. In preparation.
Kavouras IG and Koutrakis P (2001). Use of polyurethane foam as impaction
substrate/collection medium in conventional inertial impactors. Aerosol Sci Technol 34: 46–56.
Salonen RO, Pennanen AS, Halinen AI, Hirvonen M-R, Sillanpaa M, Hillamo R, Karlsson V, Koskentalo T, Aarnio P, Ferguson ST, Koutrakis P (2000). A chemical and
toxicological comparison of urban air PM10 collected during winter and spring in Finland. Inhal Toxicol 12:95–104.
Salvi S, Blomberg A, Rudell B, Kelly FJ, Sandström T, Holgate ST, Frew AJ (1999). Acute inflammatory response in the airways and peripheral blood following short term exposure to diesel exhaust in healthy human volunteers. Am J Respir Crit Care Med 159:702-709.
Stenfors N, Nordenhall C, Salvi SS, Mudway I, Soderberg M, Blomberg A, Helleday R, Levin JO, Holgate ST, Kelly FJ, Frew AJ, Sandström T (2004). Different airway inflammatory responses in asthmatic and healthy humans exposed to diesel. Eur Respir
Acknowledgement
The HEPMEAP PM sampling campaign was successful and we thank Kees Meliefste, Daan Leseman, John Boere, Paul Fokkens, Maj-Cari Ledin and Oliver Fuchs for their valuable assistance during the sampling. In addition, we wish to express our thanks for the
collaboration of those in charge of the chemical analysis: Petra Krystek, Jan Marsman, Gert de Korte, Luuk Fokkert and Rob Cleven.
Appendices
Appendix 1 Abbreviations elements
Abbreviation Full name Abbreviation Full name
Li lithium Sc scandium Be beryllium Ti titanium Sr strontium V vanadium Mo molybdenum Cr chromium Cd cadmium Mn manganese Sb antimony Fe iron Ba barium Co cobalt La lanthanum Ni nickel Ce cerium Cu copper Nd neodymium Zn zinc Sm samarium Na sodium Hf hafnium K potassium Hg mercury As arsenic Tl thallium Se selenium Pb lead NH4 ammonium U uranium Cl chloride
Mg magnesium NO3 nitrate
Al aluminum SO4 sulphate
Si silicon Br bromide
Appendix 2 Chemical composition data
NOTE:
1) All measurements are given in ng/mg of PM retrieved from the collection substrate, with the exception of endotoxin, which is listed as EU/mg PM.
2) For values lower than the detection limit, 2/3 (67%) of the detection limit is used as value. These values are printed in italics.
3) The values of the elements Be, Sm, Co, As, Se, and Br were substantial lower than the detection limit and were not reported.
4) ‘Not determined’ (ND) is noted whenever a component could not be measured due to resolution issues.
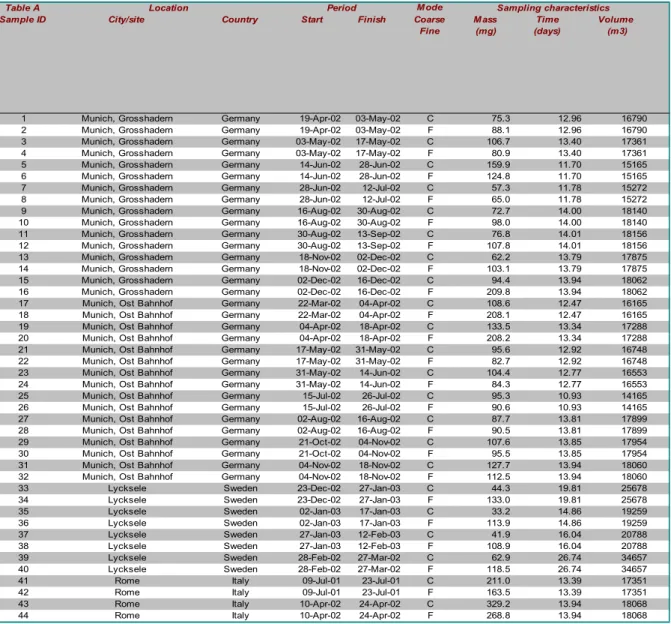
Table A Mode
Sample ID City/site Country Start Finish Coarse Fine Mass (mg) Time (days) Volume (m3)
1 Munich, Grosshadern Germany 19-Apr-02 03-May-02 C 75.3 12.96 16790 2 Munich, Grosshadern Germany 19-Apr-02 03-May-02 F 88.1 12.96 16790 3 Munich, Grosshadern Germany 03-May-02 17-May-02 C 106.7 13.40 17361 4 Munich, Grosshadern Germany 03-May-02 17-May-02 F 80.9 13.40 17361 5 Munich, Grosshadern Germany 14-Jun-02 28-Jun-02 C 159.9 11.70 15165 6 Munich, Grosshadern Germany 14-Jun-02 28-Jun-02 F 124.8 11.70 15165 7 Munich, Grosshadern Germany 28-Jun-02 12-Jul-02 C 57.3 11.78 15272 8 Munich, Grosshadern Germany 28-Jun-02 12-Jul-02 F 65.0 11.78 15272 9 Munich, Grosshadern Germany 16-Aug-02 30-Aug-02 C 72.7 14.00 18140 10 Munich, Grosshadern Germany 16-Aug-02 30-Aug-02 F 98.0 14.00 18140 11 Munich, Grosshadern Germany 30-Aug-02 13-Sep-02 C 76.8 14.01 18156 12 Munich, Grosshadern Germany 30-Aug-02 13-Sep-02 F 107.8 14.01 18156 13 Munich, Grosshadern Germany 18-Nov-02 02-Dec-02 C 62.2 13.79 17875 14 Munich, Grosshadern Germany 18-Nov-02 02-Dec-02 F 103.1 13.79 17875 15 Munich, Grosshadern Germany 02-Dec-02 16-Dec-02 C 94.4 13.94 18062 16 Munich, Grosshadern Germany 02-Dec-02 16-Dec-02 F 209.8 13.94 18062 17 Munich, Ost Bahnhof Germany 22-Mar-02 04-Apr-02 C 108.6 12.47 16165 18 Munich, Ost Bahnhof Germany 22-Mar-02 04-Apr-02 F 208.1 12.47 16165 19 Munich, Ost Bahnhof Germany 04-Apr-02 18-Apr-02 C 133.5 13.34 17288 20 Munich, Ost Bahnhof Germany 04-Apr-02 18-Apr-02 F 208.2 13.34 17288 21 Munich, Ost Bahnhof Germany 17-May-02 31-May-02 C 95.6 12.92 16748 22 Munich, Ost Bahnhof Germany 17-May-02 31-May-02 F 82.7 12.92 16748 23 Munich, Ost Bahnhof Germany 31-May-02 14-Jun-02 C 104.4 12.77 16553 24 Munich, Ost Bahnhof Germany 31-May-02 14-Jun-02 F 84.3 12.77 16553 25 Munich, Ost Bahnhof Germany 15-Jul-02 26-Jul-02 C 95.3 10.93 14165 26 Munich, Ost Bahnhof Germany 15-Jul-02 26-Jul-02 F 90.6 10.93 14165 27 Munich, Ost Bahnhof Germany 02-Aug-02 16-Aug-02 C 87.7 13.81 17899 28 Munich, Ost Bahnhof Germany 02-Aug-02 16-Aug-02 F 90.5 13.81 17899 29 Munich, Ost Bahnhof Germany 21-Oct-02 04-Nov-02 C 107.6 13.85 17954 30 Munich, Ost Bahnhof Germany 21-Oct-02 04-Nov-02 F 95.5 13.85 17954 31 Munich, Ost Bahnhof Germany 04-Nov-02 18-Nov-02 C 127.7 13.94 18060 32 Munich, Ost Bahnhof Germany 04-Nov-02 18-Nov-02 F 112.5 13.94 18060 33 Lycksele Sweden 23-Dec-02 27-Jan-03 C 44.3 19.81 25678 34 Lycksele Sweden 23-Dec-02 27-Jan-03 F 133.0 19.81 25678 35 Lycksele Sweden 02-Jan-03 17-Jan-03 C 33.2 14.86 19259 36 Lycksele Sweden 02-Jan-03 17-Jan-03 F 113.9 14.86 19259 37 Lycksele Sweden 27-Jan-03 12-Feb-03 C 41.9 16.04 20788 38 Lycksele Sweden 27-Jan-03 12-Feb-03 F 108.9 16.04 20788 39 Lycksele Sweden 28-Feb-02 27-Mar-02 C 62.9 26.74 34657 40 Lycksele Sweden 28-Feb-02 27-Mar-02 F 118.5 26.74 34657
41 Rome Italy 09-Jul-01 23-Jul-01 C 211.0 13.39 17351
42 Rome Italy 09-Jul-01 23-Jul-01 F 163.5 13.39 17351
43 Rome Italy 10-Apr-02 24-Apr-02 C 329.2 13.94 18068
44 Rome Italy 10-Apr-02 24-Apr-02 F 268.8 13.94 18068
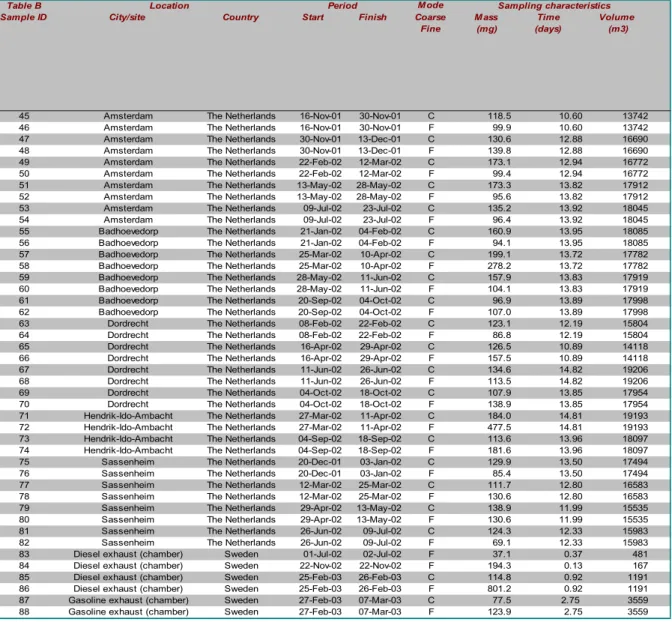
Table B Mode Sample ID City/site Country Start Finish Coarse
Fine Mass (mg) Time (days) Volume (m3)
45 Amsterdam The Netherlands 16-Nov-01 30-Nov-01 C 118.5 10.60 13742 46 Amsterdam The Netherlands 16-Nov-01 30-Nov-01 F 99.9 10.60 13742 47 Amsterdam The Netherlands 30-Nov-01 13-Dec-01 C 130.6 12.88 16690 48 Amsterdam The Netherlands 30-Nov-01 13-Dec-01 F 139.8 12.88 16690 49 Amsterdam The Netherlands 22-Feb-02 12-Mar-02 C 173.1 12.94 16772 50 Amsterdam The Netherlands 22-Feb-02 12-Mar-02 F 99.4 12.94 16772 51 Amsterdam The Netherlands 13-May-02 28-May-02 C 173.3 13.82 17912 52 Amsterdam The Netherlands 13-May-02 28-May-02 F 95.6 13.82 17912 53 Amsterdam The Netherlands 09-Jul-02 23-Jul-02 C 135.2 13.92 18045 54 Amsterdam The Netherlands 09-Jul-02 23-Jul-02 F 96.4 13.92 18045 55 Badhoevedorp The Netherlands 21-Jan-02 04-Feb-02 C 160.9 13.95 18085 56 Badhoevedorp The Netherlands 21-Jan-02 04-Feb-02 F 94.1 13.95 18085 57 Badhoevedorp The Netherlands 25-Mar-02 10-Apr-02 C 199.1 13.72 17782 58 Badhoevedorp The Netherlands 25-Mar-02 10-Apr-02 F 278.2 13.72 17782 59 Badhoevedorp The Netherlands 28-May-02 11-Jun-02 C 157.9 13.83 17919 60 Badhoevedorp The Netherlands 28-May-02 11-Jun-02 F 104.1 13.83 17919 61 Badhoevedorp The Netherlands 20-Sep-02 04-Oct-02 C 96.9 13.89 17998 62 Badhoevedorp The Netherlands 20-Sep-02 04-Oct-02 F 107.0 13.89 17998 63 Dordrecht The Netherlands 08-Feb-02 22-Feb-02 C 123.1 12.19 15804 64 Dordrecht The Netherlands 08-Feb-02 22-Feb-02 F 86.8 12.19 15804 65 Dordrecht The Netherlands 16-Apr-02 29-Apr-02 C 126.5 10.89 14118 66 Dordrecht The Netherlands 16-Apr-02 29-Apr-02 F 157.5 10.89 14118 67 Dordrecht The Netherlands 11-Jun-02 26-Jun-02 C 134.6 14.82 19206 68 Dordrecht The Netherlands 11-Jun-02 26-Jun-02 F 113.5 14.82 19206 69 Dordrecht The Netherlands 04-Oct-02 18-Oct-02 C 107.9 13.85 17954 70 Dordrecht The Netherlands 04-Oct-02 18-Oct-02 F 138.9 13.85 17954 71 Hendrik-Ido-Ambacht The Netherlands 27-Mar-02 11-Apr-02 C 184.0 14.81 19193 72 Hendrik-Ido-Ambacht The Netherlands 27-Mar-02 11-Apr-02 F 477.5 14.81 19193 73 Hendrik-Ido-Ambacht The Netherlands 04-Sep-02 18-Sep-02 C 113.6 13.96 18097 74 Hendrik-Ido-Ambacht The Netherlands 04-Sep-02 18-Sep-02 F 181.6 13.96 18097 75 Sassenheim The Netherlands 20-Dec-01 03-Jan-02 C 129.9 13.50 17494 76 Sassenheim The Netherlands 20-Dec-01 03-Jan-02 F 85.4 13.50 17494 77 Sassenheim The Netherlands 12-Mar-02 25-Mar-02 C 111.7 12.80 16583 78 Sassenheim The Netherlands 12-Mar-02 25-Mar-02 F 130.6 12.80 16583 79 Sassenheim The Netherlands 29-Apr-02 13-May-02 C 138.9 11.99 15535 80 Sassenheim The Netherlands 29-Apr-02 13-May-02 F 130.6 11.99 15535 81 Sassenheim The Netherlands 26-Jun-02 09-Jul-02 C 124.3 12.33 15983 82 Sassenheim The Netherlands 26-Jun-02 09-Jul-02 F 69.1 12.33 15983 83 Diesel exhaust (chamber) Sweden 01-Jul-02 02-Jul-02 F 37.1 0.37 481 84 Diesel exhaust (chamber) Sweden 22-Nov-02 22-Nov-02 F 194.3 0.13 167 85 Diesel exhaust (chamber) Sweden 25-Feb-03 26-Feb-03 C 114.8 0.92 1191 86 Diesel exhaust (chamber) Sweden 25-Feb-03 26-Feb-03 F 801.2 0.92 1191 87 Gasoline exhaust (chamber) Sweden 27-Feb-03 07-Mar-03 C 77.5 2.75 3559 88 Gasoline exhaust (chamber) Sweden 27-Feb-03 07-Mar-03 F 123.9 2.75 3559
Table C Sample ID Li Sr Mo Cd Sb Ba La Ce Nd Hf Hg Tl Pb U 1 20.9 115.3 36.0 3.5 123.0 256.8 8.1 16.1 6.1 37.0 1.0 1.0 128.1 0.5 2 4.1 17.4 10.1 6.5 60.5 46.4 1.8 3.5 1.0 10.1 1.0 1.0 292.8 0.1 3 17.7 159.3 41.3 2.3 135.9 440.7 7.8 16.5 6.2 38.4 1.0 1.0 106.6 0.5 4 4.9 24.6 17.5 6.8 45.2 64.4 2.3 5.3 1.0 10.1 1.0 1.0 276.7 0.1 5 17.8 134.8 27.3 1.0 74.6 373.9 8.7 16.9 7.9 35.1 1.0 1.0 67.1 0.5 6 7.5 30.6 17.2 6.3 44.2 63.6 4.3 8.8 2.9 26.0 1.0 1.0 199.3 0.1 7 7.4 52.9 36.5 2.0 114.5 145.5 4.3 8.4 2.7 31.6 1.0 1.0 66.5 0.2 8 4.0 19.0 22.2 6.3 63.9 54.2 2.2 4.3 1.0 19.7 1.0 1.0 239.6 0.1 9 10.6 81.9 52.0 1.9 165.1 279.7 5.7 12.1 5.2 88.9 1.0 1.0 118.1 0.5 10 3.0 19.9 21.7 5.4 61.4 107.8 2.4 5.3 1.0 31.2 1.0 1.0 235.2 0.1 11 15.0 104.2 54.7 2.5 176.8 322.5 7.0 14.5 5.1 112.8 1.0 1.0 131.3 0.5 12 2.4 17.6 20.2 7.5 57.5 97.2 2.3 4.4 1.0 30.5 1.0 1.0 325.8 0.1 13 13.9 137.9 109.1 4.0 358.1 483.4 7.8 16.2 4.9 66.0 1.0 1.0 191.1 0.6 14 1.9 15.6 20.7 10.0 60.9 81.5 1.6 3.6 1.0 10.1 1.0 1.0 368.5 0.1 15 14.9 116.6 92.1 14.2 309.3 438.8 6.9 17.7 4.6 54.0 1.0 1.0 325.3 0.7 16 4.1 10.1 10.1 14.0 47.2 58.6 1.0 2.2 1.0 10.1 1.0 1.7 550.2 0.1 17 16.2 102.6 270.7 4.7 492.5 619.8 8.6 23.5 5.8 133.8 1.0 1.0 237.8 0.5 18 3.7 10.1 36.0 10.2 71.1 62.8 1.0 3.6 1.0 19.9 1.0 1.0 295.4 0.1 19 17.4 109.1 258.3 4.6 509.3 653.3 8.7 19.4 7.3 125.7 1.0 1.0 246.8 0.6 20 4.3 10.1 40.8 10.1 77.4 81.3 1.5 3.6 1.0 23.1 1.0 1.0 320.4 0.1 21 12.2 85.3 294.7 2.7 576.8 671.3 5.9 16.4 3.4 129.3 1.0 1.0 234.0 0.3 22 7.8 18.7 70.5 6.6 136.2 131.3 2.6 6.3 1.0 49.2 1.0 1.0 266.9 0.1 23 12.5 93.7 275.5 2.6 588.3 650.0 8.5 16.4 4.5 126.0 1.0 1.0 215.3 0.4 24 5.6 26.0 81.2 7.3 155.9 154.9 3.4 6.3 1.0 56.9 1.0 1.0 280.4 0.1 25 9.5 102.5 297.0 2.5 805.1 959.5 6.8 18.4 3.7 135.9 1.0 1.0 312.2 0.4 26 3.8 17.5 80.6 7.0 194.6 227.5 3.0 7.4 1.0 32.7 1.0 1.0 350.6 0.4 27 8.8 93.3 337.5 2.8 777.3 921.8 7.4 18.8 3.9 146.9 5.4 1.0 262.9 0.4 28 2.6 25.9 76.4 6.5 161.9 230.5 3.2 7.1 1.0 33.6 1.0 1.0 292.9 0.1 29 12.2 118.9 296.2 3.4 799.6 856.2 6.1 17.6 3.7 119.5 1.0 1.0 272.1 0.4 30 3.9 25.0 69.5 7.3 159.5 175.2 2.4 6.8 1.0 25.3 1.0 1.0 311.6 0.1 31 19.1 146.2 336.6 2.9 799.1 940.1 9.8 26.8 7.3 135.8 1.0 1.0 282.5 0.6 32 7.5 23.0 74.9 10.1 171.1 194.4 2.9 8.1 1.0 27.3 1.0 1.0 361.6 0.1 33 13.6 165.0 20.8 3.5 79.3 655.6 9.3 20.6 7.4 35.3 1.0 1.0 178.9 0.8 34 4.5 167.4 10.1 10.2 18.8 633.8 1.0 2.2 1.0 10.1 1.0 1.0 387.9 0.1 35 12.4 103.6 16.8 5.2 85.8 263.8 7.6 15.5 5.9 29.4 2.0 1.0 132.6 0.7 36 2.7 10.1 10.1 10.1 8.2 47.4 1.0 1.5 1.0 10.1 1.0 1.0 119.9 0.1 37 18.4 95.7 17.5 5.5 57.7 311.1 13.3 27.2 10.4 41.0 1.0 1.0 162.3 1.2 38 4.6 10.1 10.1 12.1 15.0 46.8 1.0 3.0 1.0 10.1 1.0 1.0 285.6 0.1 39 21.5 81.9 10.1 2.8 34.7 170.6 12.6 28.6 10.7 59.4 1.0 1.0 81.7 1.4 40 3.6 17.6 10.1 9.9 14.2 31.4 1.0 3.4 1.0 10.1 1.0 1.0 168.8 0.1 41 19.8 220.1 58.0 1.0 181.1 370.8 22.4 46.5 17.0 144.3 1.0 1.0 232.8 1.1 42 9.6 68.2 38.4 9.3 219.3 149.5 7.7 16.5 5.6 48.4 1.0 2.8 784.2 0.3 43 35.8 246.6 50.1 1.8 144.8 350.4 21.3 46.1 17.5 122.9 1.0 1.0 105.8 0.9 44 17.8 88.9 28.9 10.3 121.0 123.7 9.2 20.5 7.2 50.8 1.0 2.0 364.2 0.3 Elements