National Institute for Public Health and the Environment
P.O. Box 1 | 3720 BA Bilthoven www.rivm.com
Software to support expert elicitation
An exploratory study of existing software packagesRIVM Letter report 630003001/2011 J.L.A. Devilee | A.B. Knol
Colofon
© RIVM 2011
Parts of this publication may be reproduced, provided acknowledgement is given to the 'National Institute for Public Health and the Environment', along with the title and year of publication.
Jeroen Devilee, RIVM
Anne B. Knol, RIVM
Contact:
Anne B. Knol
MEV/MGO
anne.knol@rivm.nl
This investigation has been performed by order and for the account of Director General RIVM, within the framework of VAMPHIRE project, SOR 2006-2010
Abstract
Software to support expert elicitation. An exploratory study of existing software packages
Expert elicitations are used to gather the informed opinion of experts on topics about which little or no knowledge is available. They can also be used to build consensus on controversial knowledge. Software packages can provide important support, but a lot of researchers are not well aware of that. The National Institute for Public Health and the Environment (RIVM) therefore made an overview of the different possibilities. For this overview scientific literature has been reviewed, supplemented with sources on the Internet. This has been funded from the strategic research program (SOR) of the institute.
There appear to exist software packages that provide support in: 1) the collaboration of experts and building consensus; 2) characterization of
uncertainties; 3) selection of experts; 4) design and execution of the process of estimation and; 5) aggregation and reporting about outcomes.
When designing and executing the estimation process, software can assist in developing and analysing conceptual models. They can also assist in the assessment of scenarios and the estimation of model parameters. For the characterization of uncertainties only one type of software is available: the software of the Netherlands Environmental Assessment Agency (PBL).
Currently, supporting software appears not to be equipped to moderate expert elicitations by mail or by using Internet as an alternative for gathering a group of experts on one specific location.
As the exact and future usage of expert elicitation at RIVM is not known, it is not possible to provide specific advice on the use of software in these specific situations.
Keywords:
Rapport in het kort
Software ter ondersteuning van expert schattingen: een verkennende studie
Expertschattingen worden gebruikt om opvattingen van experts te verzamelen over onderwerpen waarover nog weinig of geen kennis beschikbaar is. Ze kunnen ook worden ingezet om consensus over controversiële kennis te bereiken. Softwarepakketten kunnen hierbij belangrijke ondersteuning bieden, maar veel onderzoekers zijn daar niet goed van op de hoogte. Het RIVM heeft daarom een overzicht gemaakt van de verschillende mogelijkheden. Voor de inventarisatie is wetenschappelijke literatuur geraadpleegd, aangevuld met bronnen op internet. Dit is gefinancierd vanuit het strategische
onderzoeksprogramma (SOR) van het instituut.
Er blijken pakketten te bestaan die ondersteunen bij: 1) het samenwerken van experts en het bereiken van consensus over onderwerpen 2) de karakterisering van onzekerheden; 3) de selectie van experts; 4) het ontwerp en de uitvoering van het schattingsproces zelf en; 5) het bijeen brengen en rapporteren van de uitkomsten.
Bij het ontwerpen en uitvoeren van het schattingsproces kan software helpen om de conceptuele modellen te ontwikkelen en te analyseren. Daarnaast kunnen ze assisteren bij de beoordeling van scenario’s, en bij het schatten van
modelparameters. Voor de karakterisering van onzekerheden is slechts één type software beschikbaar, namelijk de software die door het Planbureau voor de Leefomgeving.
De ondersteunende software blijkt momenteel vaak nog niet uitgerust om expertschattingen via internet of e-mail te laten verlopen, in plaats van door een groep experts op locatie bijeen te brengen.
Omdat het huidige en toekomstige gebruik van expertschattingen op het RIVM onbekend is, kan er niet geadviseerd worden over het gebruik van software in deze specifieke situaties.
Trefwoorden:
Contents
Summary—7
1 Introduction and aims—11
2 Methods—13
2.1 Selecting software—13
2.2 Description of relevant features—13
3 Software to support the process of expert elicitation—15
3.1 Introduction—15
3.1.1 Tools for collaboration and consensus—16 3.2 Characterisation of uncertainties—16 3.3 Selection of experts—18
3.4 Design and execution of the elicitation session—19 3.4.1 Developing conceptual models—19
3.4.2 Analysing conceptual models—22 3.5 Possible aggregation and reporting—34
4 Conclusions and recommendations for software development—37
5 References—39
6 Appendix A—43
6.1 List of software packages—43
6.1.1 @Risk—43
6.1.2 1000Minds—43
6.1.3 AHP templates—44
6.1.4 Analytica—45
6.1.5 Arc Gis customized—46
6.1.6 B-course—47
6.1.7 CoFFEE—48
6.1.8 Criterium Decision plus—49 6.1.9 Crystal Ball—49
6.1.10 Decision Deck—50 6.1.11 Decision Explorer—51 6.1.12 Definite—52
6.1.13 Delphi Blue or a hosted version on realtimedelphi.com—53
6.1.14 DPL—54 6.1.15 ELI—55 6.1.16 Elicitor—55 6.1.17 Elicitor (v. 2010)—56 6.1.18 Equity 3—57 6.1.19 Excalibur—58 6.1.20 Expert Choice—59 6.1.21 Facilitate Pro—60 6.1.22 FC Mapper—61 6.1.23 Flash Q—61 6.1.24 GeNIe—62 6.1.25 GoldSim—63 6.1.26 Google docs—64 6.1.27 Hiview 3—65
6.1.28 Hugin—66
6.1.29 Limesurvey—67
6.1.30 Logical Decisions 6.1—68
6.1.31 Microsoft Baynesian Network Toolkit—68 6.1.32 Modelrisk 3.0—69
6.1.33 NETICA—70
6.1.34 Opinions-Online—71 6.1.35 Precision Tree—72 6.1.36 Prime Decisions—73
6.1.37 PROBES (part of DYNAMO)—74
6.1.38 Pqmethod—75
6.1.39 Quasta—76
6.1.40 RAMAS Constructor—77 6.1.41 RAMAS Risk Calc—78 6.1.42 Rich-Decisions—79
6.1.43 RiskSim—80
6.1.44 SamIam (Sensitivity analysis, modelling Interference, and more)—80
6.1.45 SensIt—81
6.1.46 SHELF 2.0 (beta)—82
6.1.47 Simlab—83
6.1.48 SL Gallery—84
6.1.49 Smart speed connect—84
6.1.50 Survey Monkey—85
6.1.51 Thinktank 3.2—86
6.1.52 TreeAge Pro Suite (Excel, Healthcare)—86
6.1.53 Treeplan—87
6.1.54 Unibalance—88
6.1.55 Unicorn (Uncertainty Analysis with Correlations)—89 6.1.56 Unigraphics—90
6.1.57 Uninet—91
6.1.58 Unisense—91
6.1.59 Vanguard System—92
6.1.60 Vanguard Decision Tree Suite—93 6.1.61 V.I.S.A.—94
6.1.62 Web-Hipre—94
6.1.63 Web Q—95
6.1.64 Win Pre—96
Summary
S 1 Introduction and aims
Expert elicitation involves the structured questioning of experts on a subject about which knowledge is unavailable, incomplete or controversial. Previous experience in RIVM projects that concerned expert elicitation learned that the use of software, for instance to provide graphical feedback about the results of a elicitation session, was very useful. It enabled experts to view the results and compare their own judgments to others. There are many different types of software that could support different phases of the expert elicitation process. Unfortunately, currently no overview of existing software tools to support expert elicitation exists. Therefore, it is unknown which software packages could be applied for which phases and whether further tools are necessary.
The main aims of this study were to:
- outline the possible means in which software programs may support expert elicitation;
- explore existing software programs that could support expert elicitation; - review the functionalities of these existing software projects and review
their potential usefulness for future expert elicitations.
In answering these questions, this report intends to support scientists who want to organize an expert elicitation and helps them to take full advantage of the possibilities of different kinds of software.
S 2 Methods
We have carried out desktop research (literature reviews and internet searches) to identify software packages that could be suitable to support (parts of) expert elicitation sessions. Even though our methods will not have identified all
software available, we think we have been able to obtain a reasonably good overview of the general types of software that could be used to support expert elicitation sessions.
In order to get a useful description of the software in relation to their potential use in expert elicitations, we made a list of potentially relevant features of the software, including functionality/purpose of the software, type of input by the experts, type of output and anonymity in a group session.
S 3 Software to support the process of expert elicitation
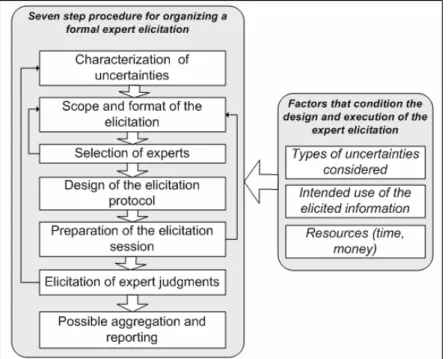
Formal expert elicitation is often carried out according to a protocol, which outlines the different steps in the process. In the field of environment and health, a protocol has been developed –based on existing protocols- which contains the following seven steps: 1) characterization of uncertainties; 2) scope and format of the elicitation; 3) selection of experts; 4) design of the elicitation protocol; 5) preparation of the elicitation session; 6) elicitation of expert judgments and; 7) possible aggregation and reporting. For this report about software support not all steps are equally important. For steps 2 and 5, no software support is needed or available. Moreover, steps 4 and 6 are strongly interrelated from a software point of view and therefore combined in this report. In this report, we therefore distinguish the following steps: 1) Characterizationof uncertainties; 2) Selection of experts; 3) Design and execution of the elicitation session; and 4) Possible aggregation and reporting. In addition, we discuss software packages that can be used to support collaboration and consensus-building, which are not confined to a specific step, but can be useful throughout the elicitation process.
S 3.1 Tools for collaboration and consensus building
Software for online collaboration can be used for brainstorming, categorizing, prioritizing, voting, carrying out surveys and action planning. Packages that can assist these activities are: Delphi Blue, Vanguard System, Facilitate Pro, Smart
speed connect, CoFFEE, Thinktank 3.2, Ynsyte WebIQ.
S 3.2 Characterization of uncertainties
In this phase, it can be identified whether expert elicitation is a relevant approach to deal with the uncertainties, by characterising the type of
uncertainty at hand. The Netherlands Environmental Assessment agency has developed an online Guidance for uncertainty assessment and communication that has tools for characterizing uncertainties. The toolbox is suitable for
projects with different combinations of a) the relevance of the uncertainty (little, medium, large) and b) the capacity/resources available (little, medium, large). S 3.3 Selection of experts
Selection of experts can for instance be carried out by asking authors of relevant papers to nominate experts. For this so-called two-step procedure, online literature databases (Pubmed, Scopus, Web of science, Google scholar) and online surveys can be useful instruments. Online databases can be used in the first step, while online surveys are useful in the nomination process. Specific advantages of online surveys are that they guarantee anonymity and that these surveys provide the possibility to include experts from different geographical locations who can fill out the survey at a time that suits them. Moreover, online surveys provide means to reveal the perspectives of the experts involved. Packages for online surveys include: Survey Monkey, Google Docs,
Opinions-Online and Lime survey. Another technique to reveal the perspectives of experts
is a Q-sort. The Q-sort is a card sort technique, which asks respondents to identify statements (on cards) they most or less agree with. Software that supports Q-sorts includes PQ-method, Flash Q and Web Q.
S 3.4 Design and execution of the elicitation process
Expert elicitation can be used in the field of environment and health to contribute to 1) the development of conceptual models; 2) the analysis of conceptual models; 3) the evaluation of alternatives and scenario’s and; 4) the estimation of model parameters.
S 3.4.1 Software to develop conceptual models
Conceptual models can be used to graphically represent the causal relationships between different variables, e.g. between an environmental exposure and a health effect. The elicitation of conceptual model can be aided by using software that graphically builds such models or by mind mapping, in which the ideas of experts about, for instance, a working mechanism are graphically represented. Software packages that support the development of conceptual models and mindmaps include MS Visio, Mindjet Mindmanager, Matchware Mindview,
S 3.4.2 Software to analyse conceptual models
There are several ways to analyse conceptual models, including: assigning plusses and minuses to relationships between variables; providing qualitative or quantitative estimates about the strength of relationships; and assigning probabilities to the possible states of variables. Experts can have a role in providing these different types of estimates. Software that could be used to support this process includes: Decision Explorer, DAG program, Quasta, FC
Mapper. Tree Age Pro suite (Excel, Healthcare), Precision Tree, Analytica, DPL, NETICA, Hugin, Uninet, SamIam, B-course and the Microsoft Bayesian network toolkit
S 3.4.3 Software to evaluate alternatives and scenarios
Evaluation of alternatives and scenario’s as part of an expert elicitation can be supported by software that implements decision trees or by software for Multi Criteria Analysis. Software that can be used for these purposes includes: Tree
Age Pro Suite, (Excel, Healthcare), Precision Tree, Analytica, DPL, Equity3, Hiview3, Logical decisions 6.1, Expert Choice, Definite, 1000minds, V.I.S.A., Criterium Decision Plus, Unibalance-Unisense-Unigraphics, Web-Hipre, Rich decisions, Win pre, Prime Decisions, Decision Deck, AHP templates and NAIADE. S 3.4.4 Software to estimate parameters
Expert elicitation can also be used to get an idea of the magnitude and
uncertainty of a particular ‘unknown’ variable. Such quantitative estimates are often expressed in probabilistic terms (min, max and most likely values; subjective probability density functions, etc). This type of elicitation can benefit substantially from graphical support by software. In addition, parameters can be elicited using specific software that helps experts to insert and check their estimates, or provides features to analyze results. Software that supports this process includes: SHELF, RAMAS constructor, ELI, Elicitor (v. 2010), Probes, Arc
GIS customized, SL Gallery, Probes and Hypo.
Although most software packages for sensitivity analysis are not specifically meant for expert elicitation, they often acknowledge that some of their input data can be based on information provided by experts. Consequently, the packages often provide input modules. Relevant software packages are: @Risk,
Modelrisk 3.0, Crystall Ball, Goldsim, Risksim, RAMAS Risk Calc., Unicorn.
S 3.5 Possible aggregation and reporting
This step of expert elicitation involves analysis of results, potential aggregation and reporting. All kinds of statistical software packages can assist in this
aggregation process and a whole range of editors can be used to generate useful reports. Further discussion about these types of generic software packages, however, is beyond the scope of this report.
More complex mathematical aggregation of expert judgments has the potential to perform better than just taking the mean. For example, the Excalibur package can be used to aggregate results based on the performance of the experts in providing valid estimates. .
S 4 Conclusions and recommendations for software
development
In general the number and variety of software packages that can be used to support expert elicitation is large. Consequently, the needs in the different
elicitation phases seem to be satisfied sufficiently. This holds especially for the packages that assist in developing conceptual models, software to analyse influence diagrams, packages that can be used to evaluate different scenarios on the basis of decision trees and packages that can be used for eliciting single parameters, such as probabilities and probability distributions.
The software available to characterize uncertainties is limited. To our knowledge only the Guidance for Uncertainty Assessment and Communication of the Netherlands Environmental Assessment Agency provides assistance. In addition, among the software we reviewed there is a lack of software that lowers the costs of expert elicitations in terms of travel, organizing and meeting time and consequently money. Software for online collaboration and discussion might have a role in that, but we think that special purpose, user-friendly elicitation software that can be used online or sent by e-mail can provide a fruitful additional contribution.
The main barrier to use software in expert elicitations may be unfamiliarity with the possibilities and availability of existing software packages. With this report, we hope to increase this familiarity and thereby the use of relevant software in expert elicitations.
1
Introduction and aims
There are many ways in which environmental stressors may affect population health. Assessment of environmental health impacts often requires a variety of information, assumptions and data. Especially for the assessment of complex environmental health issues, such as climate change or Q fever, such
information is often lacking, incomplete, controversial or inconsistent (Knol, Petersen, et al., 2009). There are many ways to deal with such uncertainties (Van der Sluijs et al., 2004). One of these is expert elicitation. Expert elicitation involves:
“the structured questioning of experts on a subject about which
knowledge is unavailable, incomplete or controversial”(Knol et al., 2010; Slottje, van der Sluijs & Knol, 2008)
Expert elicitation can be useful means to provide a temporary summary of the limited available knowledge. This summary of knowledge can serve as a
provisional basis for policy until further research has been carried out. Protocols for developing expert elicitation and discussion on the benefits and limitations of the methods can be found, amongst others, in (Cooke, 1991; Kahneman, Slovic & Tversky, 1982; Meyer & Booker, 1991; National Research, 1994; Plous, 1993).
Within the SOR (Strategic Research RIVM) IQARUS project, a protocol for expert elicitation in the context of environmental health impact assessment has been developed and tested in two case studies about uncertainties in the assessment of the health impacts of ultrafine particle exposure (Hoek et al., 2010; Knol, De Hartog, et al., 2009). In these case studies, quantitative judgments provided by the experts were fed into a computer program during the elicitation session. This allowed the experts to view the results of the elicitation session and compare their own judgments to others’. This graphical feedback proved to be very useful, especially because many experts found the task of providing quantitative probability bounds or likelihood estimates daunting.
The use of supporting software in the two case studies was rather limited, and the tools used were simple (MS Excel plots). A range of more sophisticated software tools are available, which are more targeted towards supporting expert elicitation, and which provide a much wider range of functionalities. Currently, no overview of existing software tools to support expert elicitation (including web pages) exists. Therefore, it is unknown which software packages could be applied and whether further tools are necessary.
In order to get most benefit out of existing expert elicitation supporting software programs in future expert elicitation studies, we have set out in the SOR
Vamphire (RIVM) project to:
- outline the possible means in which software programs may support expert elicitation;
- explore existing software programs that could support expert elicitation; - review the functionalities of these existing software projects and review
The answers to these questions will support scientists who want to organize an expert elicitation to take full advantage of the possibilities of different kinds of software.
In chapter 1 of this report, we will outline the methods we have used to select software programs and the criteria which we have used to review these programs. We will shortly outline the process of expert elicitation, focussing on those steps that could be supporting by software and we shortly list the software programs that could be used to support the specific steps. Chapter 2 will further describe these existing software programs and their functionalities. Finally, chapter 3 discusses the findings and outlines some opportunities for future research and development. In order to assist the reader in understanding the concepts discussed in this report, we recommend to read the previously
mentioned article about the use of expert elicitation (Knol et al., 2010) which is freely available from the internet at http://www.ehjournal.net/content/9/1/19. In this paper, the seven different phases of expert elicitation within the context of environmental health impact assessment are described in more detail. Finally, please note that this is an exploratory study. Hence, we do not aim to cover all existing software programs that may be useful to support expert elicitation. Also, we do not intend to give a judgment about whether software is ‘good’ or ‘bad’. Rather, we outline for which purposes software may be applied and we give a selection of software packages that we consider suitable for these purposes.
2
Methods
2.1 Selecting software
We have carried out desktop research to identify software packages that are suitable to support (parts of) expert elicitation sessions. We used software packages that we identified earlier (Knol et al., 2010) or were mentioned in the ‘Tool catalogue for uncertainty assessment’ (Van der Sluijs et al., 2004) as a starting point. As a second step we followed a ‘snowball procedure’: we looked at the references in the articles mentioned above in order to identify more software packages that could be of potential use. This particularly helped to find software to elicit probability distributions and other variables. Additionally, we consulted the RIVM library and used Internet searches to identify more types of software. We realize that our methods will not have identified all software available, but we think we have been able to obtain a reasonably good overview of the general types of software that could be used to support expert elicitation sessions.
2.2 Description of relevant features
In order to provide a useful description of the software that could be used in expert elicitations, we propose a list of relevant features to evaluate the various software packages. These features can be used to get an impression of the characteristics and usability of software programs in the context of expert elicitation:
o General functionality/purpose of the software: what may researchers do with the package?
o Type of input by the experts: what type of data or expertise has to be delivered and at which point in the process?
o Output: what type of data, knowledge or expertise is produced by the package?
o Type of platform: is the software meant for specific operating systems or not?
o Possibility of indicating the uncertainty range of the estimate: (only in case of quantitative estimates) is the software able to provide uncertainty ranges?
o Possibility of indicating the basis of the estimations: what are the motives, arguments or scientific legitimations for the estimations?
o Suited for group elicitation, individual elicitation or both: in what elicitation context is it possible to use the software?
o Type of statistical analyses possible: : (only in case of quantitative estimates) does the package deliver statistics and what type?
o Possibility of feedback during the elicitation: does the package show experts (intermediate) results and do they get the opportunity to revise their arguments, estimates or opinions.
o Flexibility to fit to a specific situation: is the software designed for one specific purpose or are other applications feasible?
o User-friendliness: how easy is it to use the software by those who are not familiar with it?
o Anonymity in a group session: is it possible for experts to contribute their estimates anonymously. This might facilitate the willingness to participate in elicitation sessions.
o Costs and availability of the software: what is the price of the package and/or under which condition can it be obtained?
o Url: is there a specific website with information?
o Manufacturer/ host organization: which company, person or organization did develop the software package?
o Positive aspects: is the package relatively good in one or more aspects? o Negative aspects: are there important disadvantages of the package? o References: are there any publications in which the software and its usage
are illustrated?
The software packages have been evaluated based on these criteria in appendix A. We limit ourselves to information that is needed to get a useful first
impression of the packages. Within the scope and resources of this project, we have not been able to intensively test and evaluate the packages ourselves. The interested reader can refer to the actual software packages for more detail.
3
Software to support the process of expert elicitation
3.1 Introduction
Several protocols have been developed to carry out formal expert elicitation (e.g. (Cooke & Goossens, 1999; Frey, 1998; Hora & Iman, 1989; Keeney & Von Winterfeldt, 1991; Kloprogge, Van der Sluijs & Petersen, 2009; Kotra et al., 1996; Loveridge, 2002; Meyer & Booker, 1991; Morgan & Henrion, 1990; Refsgaard et al., 2007; Risbey & Kandlikar, 2007; Rsc, 2004; Spetzler & Steal von Holstein, 1975; Van der Sluijs et al., 2005)). In this report we will use a protocol that has been specifically developed for organization of expert elicitation in the context of environmental health impact assessment. This protocol takes a broad perspective on the use of expert elicitation: it can be used not only to acquire quantitative figures, but also to gain information about assumptions or causal models.
Figure 1: Seven step expert elicitation procedure (Knol et al., 2010).
The seven steps outlined in this protocol are presented in Figure 1 and further described in (Knol et al., 2010). In this report, we will focus on those elements of the process that may be supported by using specific software. For some steps, no software programs seem to be needed or available (steps 2 and 5), so they are not further discussed below. Moreover, the steps ‘design of the
elicitation protocol’ (4) and ‘elicitation of expert judgment’ (6) are strongly interrelated from a software tools point of view: an elicitation will usually be designed for a specific software program and this program will subsequently be used in the execution step. Therefore, we combine these two steps in this report. Overall, we distinguish the following steps: 1) Characterization of uncertainties; 2) Selection of experts; 3) Design and execution of the elicitation session; and 4) Possible aggregation and reporting.
In this chapter, the software programs that can be used to support specific steps are presented in grey shaded boxes. For details about specific software features the reader can consult appendix A.
Before we start discussing the software needed in the different steps of the expert elicitation protocol we briefly describe online collaboration software that can be used for brainstorming, categorizing, prioritizing, voting, and carrying out surveys and action planning. This software can be applied in the different steps of the expert elicitation protocol where collaboration and/or consensus is needed.
3.1.1 Tools for collaboration and consensus
A specific method for expert elicitation worth mentioning here is Realtime Delphi. The Delphi method is a well known methodology that is used to obtain an consensus among a group of experts. In classical Delphi, the judgments collected in one round are fed back to the participants in subsequent rounds. By contrast, Real Time Delphi is ‘roundless’ and answers generated are fed back to participants in real time. As in classical Delphi, participants are anonymous to one another and may omit any questions they wish. Software meant for online collaboration that is not tied to de Delphi Method might also provide a useful contribution to the collection of qualitative information.
Delphi software
One type of software that can be used to support this process is ”Delphi Blue”, which is an open source, Java/JSP implementation of the Delphi process for group decision making. It supports creation and editing of decision matrices which reflect group consensus. Concerns a Real Time Delphi as was used by the UN Millenium Project (see http://www.unmillenniumproject.org/). It can be used both for quantitative as well as qualitative estimates
{Delphi Blue}
Software that supports online collaboration and discussion
There are several commercial packages on the market like the Vanguard System that is specifically meant for enterprises, Facilitate Pro, Smart speed connect, Thinktank 3.2 and Ynsyte WebIQ. For these packages, except WebIQ, both a version for an own server and a web application is available. For these packages holds that tools for brainstorming, categorizing, prioritizing, voting, surveys and action planning are provided in all of them. An open source application that was designed for an educational context is CoFFEE (Collaborative Face2Face
Educational Environment). The software provides customisable tools for group collaboration, knowledge sharing and representation, such as a threaded discussion forum, a graphical concept mapping tool, dynamic voting and others. It has so far been translated into French, Spanish, Italian, Dutch and
(experimental version) Hebrew and is being used in schools, colleges and universities in the UK, France, Italy and the Netherlands. Out of all these packages, only Facilitate Pro supports video.
{Vanguard System, Facilitate Pro, Smart speed connect, CoFFEE, Thinktank 3.2, Ynsyte WebIQ}
3.2 Characterisation of uncertainties
The first step of the elicitation procedure is the characterisation of uncertainties. As there are many different types of uncertainties, characterisation of sources of
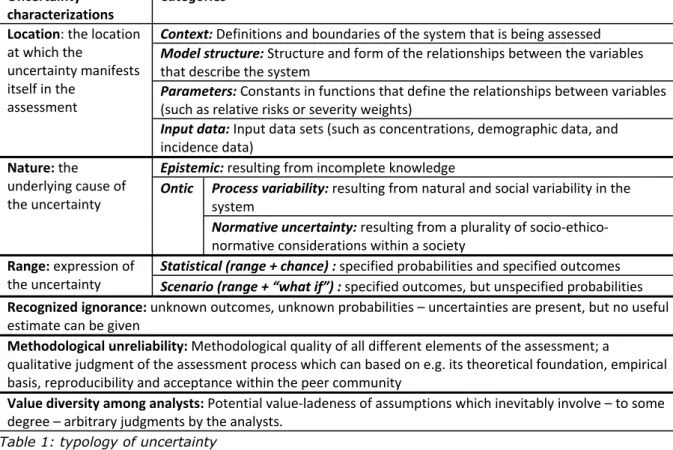
uncertainty can help to determine whether expert elicitation is a relevant approach to deal with the uncertainties. This can be supported by using an uncertainty typology. Knol et al. (2009) present a typology (table 1) of uncertainty that distinguishes between location, nature, range, recognized ignorance, methodological unreliability and value diversity among analysts, as six characteristics of uncertainty. These characteristics apply simultaneously on a piece of information.
Uncertainty
characterizations
Categories
Context: Definitions and boundaries of the system that is being assessed
Model structure: Structure and form of the relationships between the variables
that describe the system
Parameters: Constants in functions that define the relationships between variables
(such as relative risks or severity weights)
Location: the location
at which the
uncertainty manifests
itself in the
assessment
Input data: Input data sets (such as concentrations, demographic data, and
incidence data)
Epistemic: resulting from incomplete knowledge
Process variability: resulting from natural and social variability in the
system
Nature: the
underlying cause of
the uncertainty
Ontic
Normative uncertainty: resulting from a plurality of socio‐ethico‐
normative considerations within a society
Statistical (range + chance) : specified probabilities and specified outcomes
Range: expression of
the uncertainty
Scenario (range + “what if”) : specified outcomes, but unspecified probabilities
Recognized ignorance: unknown outcomes, unknown probabilities – uncertainties are present, but no useful
estimate can be given
Methodological unreliability: Methodological quality of all different elements of the assessment; a
qualitative judgment of the assessment process which can based on e.g. its theoretical foundation, empirical
basis, reproducibility and acceptance within the peer community
Value diversity among analysts: Potential value‐ladeness of assumptions which inevitably involve – to some
degree – arbitrary judgments by the analysts.
Table 1: typology of uncertaintyFor proper explanation about this table, we refer the reader to the original publication(Knol et al., 2010). Other relevant texts about the subject are e.g. Van der Sluijs et al. (2004), Janssen et al. (2005), Petersen (2006), Van der Sluijs et al. (2008), and Walker et al. (2003).
The Netherlands Environmental Assessment Agency has developed an online application that has tools for characterizing uncertainties that are suited for projects with different combinations of a) the importance of uncertainty (little, medium, large) and b) the capacity/resources available (little, medium, large). Software to support characterization of uncertainties
The Netherlands Environmental Assessment Agency has developed online guidance for uncertainty assessment and communication: called ‘Guidance for Uncertainty Assessment and Communication’ and available at
http://leidraad.pbl.nl/.
The guidance offers assistance in mapping and communicating uncertainties in environmental assessments. Special attention is paid to the following parts of assessments: problem framing;
involvement of stakeholders; selection of indicators; appraisal of knowledge base; mapping and assessment of relevant uncertainties; and reporting of uncertainty information. The guidance presents the important issues in the different steps of assessment of uncertain issues and points the reader to the associated tool and methods to deal with these issues. The guidance
incorporates amongst others a mini-checklist, a quickscan questionnaire and a detailed guidance.
{Guidance for Uncertainty Assessment and Communication}
3.3 Selection of experts
Experts can be selected using a structured selection process. This is important to ensure a balance between opposing views and schools of thought. One way to achieve a balanced sample of experts is by a two step nomination procedure. This involves first of all selecting authors of at least two peer-reviewed papers on the subject using a systematic literature review (Knol, De Hartog, et al., 2009). This review can be facilitated by means of online literature databases. Online literature databases
A variety of online publication databases can be used for systematic literature reviews, including:
PubMed (http://www.ncbi.nlm.nih.gov/sites/entrez?holding=inlrivmlib), Scopus (info.scopus.com),
Web of Science (isiknowledge.com) and Google Scholar (scholar.google.com). More information about these types of programs and their functionalities is provided by Falagas et al. (2008).
{Pubmed, Scopus, Web of Science, Google Scholar}
The selected experts are subsequently asked to nominate experts who they think would be most qualified to participate in the elicitation. The most
frequently nominated experts are subsequently invited. Nomination can simply be carried out be replying to an email. However, in order to provide for a more anonymous nomination, which may in some cases lead to slightly different nominations, online anonymous surveys can be used. Other useful
characteristics of surveys are that input can be gathered I a structured way from experts from different geographical locations and that they can do this at a time that suits them. Moreover, surveys provide the possibility to include questions that reveal so-called ‘value diversity’ among experts. Experts may have different opinions and values related to topics that are relevant for the subject on which the experts are elicited. In case of a PM10 expert elicitation these opinions may be e.g. the attitude towards cars, the attitude towards environmental protection and the amount of risk one is willing to accept.
Online surveys
Software that can assist is online surveys includes Survey Monkey, Google docs, Opinions-Online and Lime survey. Lime survey is an open source application that has to be hosted on an own server. The possibilities of Lime survey are
impressive, but when you have a modest problem and are looking for a fast solution, you might opt for the other packages mentioned. For all these packages holds that questions have to be delivered in a format suited for
Internet. Several types of questions are possible. Data acquired can be exported to text, CSV, PDF, SPSS, queXML en MS Excel format. Basic statistics and graphics can be made.
{Survey Monkey, Google docs, Limesurvey, Opinions-Online}
Another way to reveal value diversity is by conducting a Q-sort. In a Q-sort the discourse about a subject is written down in a deck of statements. The experts are asked to sort these statements in a forced normal distribution from ‘totally agree’ to ‘totally disagree’. In a next step, the correlations between the scores of the statements of the experts in the study are correlated and a principal
component analysis is conducted. The result is that groups of experts with similar value patterns are distinguished. By calculating the factor scores and sort them from low to high it is possible to construct typical Q-sorts for groups and to get an idea of the perspectives of the different groups of experts.
Q-sort software
Software that is specifically useful for including different perspectives in the expert elicitation includes PQ-method, Flash Q and Web Q. All three packages support the Q-sort method. The Flash Q and Web Q software assist this process by enabling experts to sort the deck on their own computer and send the data to the researchers. The PQ-method software subsequently assists in the data-analysis.
{PQ-method, Flash Q, Web Q}
3.4 Design and execution of the elicitation session
As said before, the steps ‘design of the elicitation protocol’ and ‘elicitation of expert judgment’ of a formal expert elicitation are strongly interrelated from a software tools point of view: an elicitation will usually be designed for a specific software program and this program will subsequently be used in the execution step. Therefore, we combine these two steps in this report. The format of the desired output of the elicitation session can for example be:
- the development of a conceptual model
- a contribution to the analysis of conceptual models
- a contribution to the evaluation of alternatives and scenario’s - An estimate of single model parameters
These four possibilities and the ways in which software can be used in their elicitation are described in the paragraphs below.
3.4.1 Developing conceptual models
Experts can provide a significant and meaningful contribution to the construction of conceptual models. Conceptual models can be used to graphically represent the relationships between different variables. In this section we will provide an
overview of the several ways in which graphical representations of relationships between variables can be supported by expert elicitation.
The elicitation of conceptual models can be aided by using software to graphically build such models. There are several approaches in building conceptual models. One approach to build a conceptual model is by drawing a mind map (Buzan & Buzan, 1992). A mind map is a diagram used to represent words, ideas, tasks, or other items linked to and arranged around a central key word or idea. Mind maps are used to generate, visualize, structure and classify ideas, and as an aid to studying and organizing information, solving problems, making decisions and writing. The elements of a given mind map are arranged intuitively according to the importance of the concepts. Subsequently, they are classified into groups, branches or areas, with the goal of representing
connections between portions of information. Mind maps may also aid recall of existing memories. For illustrative purposes in figure 1 a mind map of
determinants of health is presented.
Figure 1: Mind map of determinants of health (source: www.mindmapart.com)
A mind map can be contrasted with the similar idea of concept mapping. The former is based on radial hierarchies and tree structures denoting relationships with a central governing concept, whereas concept maps are based on
connections between concepts in more diverse patterns. In practice the two approaches are often lumped together. For research in the field of environment and health both mindmapping and concept mapping can be useful approaches. Both mind maps and concept maps can be used to study the ideas of experts or groups of experts, while concept mapping is useful to examine specific
health effects of exposure to ultrafine particles (ref:
http://www.particleandfibretoxicology.com/content/6/1/19/ ).
In the field of decision analysis a concept map that represents a decision problem is called an influence diagram. In this field, a decision tree is another often used way of representing a decision problem. Decision trees display the set of alternative values for each decision. The alternative values (chance variables) are represented as branches coming out of each node. Software to evaluate influence diagrams will be discussed later on in this section. The software to analyse decision trees will be dealt with in section 3.4.2.5. Software for conceptual models
There is quite a lot of both proprietary and free software available that can be used to visualise ideas. Moreover, software that has been designed to quantify models (e.g. Analytica see paragraph 3.4.2.7.) or are intended to create presentations (e.g. MS Powerpoint) can sometimes also be used to draw conceptual models. In this report we limit ourselves to four popular proprietary and four free software packages for mind- and concept mapping. Mind mapping software is designed to help users in creating visual mind maps for various purposes including learning, teaching, presentation, meeting, decision making and problem solving. Advantages of the software are that the user can save time to create mind maps in comparison to drawing manually or using software that is not designed for mind mapping. Moreover, the software has many clipart and icons to use in the mind map and make it more professional and easy to understand. Most mind map software packages provide many different styles, formats and templates. Furthermore, mind maps can be exported to various file formats such as image (Gif, JPG, PNG), Powerpoint, HTML, etc. Most of the packages support decision trees and influence diagrams, but some of them that are closely tied to the traditional mind mapping concept do not do so. Despite of the differences between the packages, for all of them holds that they are extremely helpful in the process of visualizing ideas and making connections to other pieces of information e.g on the internet or in local databases.
Of the proprietary software an obvious possibility is Microsoft Visio. This software package has been developed to present information in an efficient, descriptive way. This multi purpose package supports lots of different diagrams and schedules, but actually is not specifically designed for mind mapping. Probably the most popular of the proprietary mind map packages is Mindjet Mindmanager. MindManager’s visual information maps (mind maps) start with a central theme, and then add branches with ideas, notes, images, tasks,
hyperlinks and attachments. Other relatively popular mind mapping packages are MatchWare Mindview and iMindMap.
A freeware counterpart of Microsoft Visio is Diagram designer. This is a simple vector graphics editor for creating flowcharts, UML class diagrams, illustrations and slide shows. Moreover, it provides a simple graph plotter to plot
mathematical expressions. Three of the most popular free mind- and concept mapping software packages are: Freemind, VUE (Visual Understanding
Environment and Xmind (free version). Freemind is a package that focuses on traditional mind maps en provides the possibility to link to other sources. The Visual Understanding Environment (VUE) project at Tufts UIT Academic Technology is focused on creating flexible tools for managing and integrating digital resources in support of teaching, learning and research. VUE provides a flexible visual environment for structuring, presenting, and sharing digital information. Using VUE's concept mapping interface, faculty and students design
semantic networks of digital resources drawn from digital libraries, local and remote file systems. XMind is an open source brainstorming and mind mapping software tool. It helps people to capture ideas, organize to various charts, and share them for collaboration. It supports mind maps, Ishikawa diagrams (also called fishbone diagrams or cause-and-effect diagrams), tree diagrams, organization charts, and spreadsheets. It is often used for knowledge management, meeting minutes, task management, and GTD. XMind is compatible with FreeMind.
{MS Visio, Mindjet Mindmanager, MatchWare Mindview, iMindMap, Diagram designer, VUE, FreeMind, Xmind}
3.4.2 Analysing conceptual models
3.4.2.1 Topological analysis
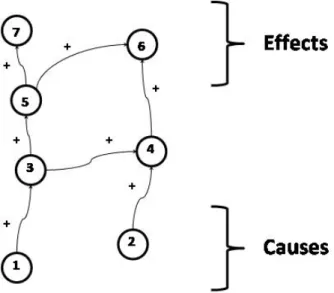
An approach which is only slightly more analytical than drawing conceptual models, is topological analysis. Topological analysis is a simple way of increasing the power of causal inference in conceptual models. In such an analysis one assigns plusses and minuses to relationships. In figure 2 a so-called causal map with plusses and minuses is shown. The diagram is a directed acyclic graph (commonly abbreviated to DAG). A DAG is a directed graph with no directed cycles, e.g. no ‘closed loops’. Many causal diagrams of environmental health issues behave like DAGs. Typical problems with a DAG with plusses and minuses are that one cannot decide whether the total effect of one node on the other is positive or negative (indetermination) or it is not possible to differentiate the effects of different causes (indistinction). Topological analysis is a way to find a solution for this lack of clarity.
Figure 2: Causes and effects in conceptual models
In the field of environmental health research topological analysis can for instance be used to examine the several routes of exposure to a potentially dangerous substance. The main advantage of the rules using topological analysis is that they do not need any extra (elicited) preference information and that they are simple to explain to decision makers. The analysis can be performed by the Decision Explorer software for analyzing conceptual models. Moreover, the DAG program can help to identify confounding in complex causal diagrams.
Obviously, the functionality of this last package is much more limited than Decision Explorer.
Software for analysing conceptual models
Decision Explorer offers a number of tools to draw cognitive maps and to analyze their content. When models become quite large, Decision Explorer has several useful tools available to explore portions of the models. For instance, a cluster analysis can be used to create more manageable sets of concepts. Moreover, Decision Explorer has several tools to aid in showing relationships between concepts or sets in the model.
The literature on Decision Explorer encourages users to share their model output with consulted experts. For instance, if a model is constructed based on an interview, the resulting model can be constructed and shown to the informant for verification. This review of the model can provide another channel for
communication between the interviewer and the informant and can provide a tool for gathering further information.
The DAG program (DAG program(Knüppel, 2010; Knüppel & Stang, 2010)) has been developed specifically in order to identify confounding in complex causal diagrams using algorithms for backtracking. It is not specifically meant for use in expert elicitation, but may be used as such.
{Decision Explorer, DAG program}
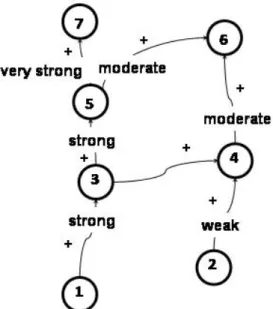
3.4.2.2 Analyzing on the basis of qualitative estimates of the strength of causality Information about the strength of causality can be elicited from experts or a group of decision-makers. With this information it is possible to construct more informative causal maps. In the method proposed by Kosko (1986), qualitative assessments of the strength of causality are elicited from the decision-makers using an ordinal scale (ordered qualitative labels). Moreover, simple calculation rules to calculate the total effect of a cause on an effect are provided.
Figure 3 shows a figure with plusses, minuses and a qualitative indication of the strength of the relationship. Kosko (1986) called this model a ‘fuzzy cognitive map’, suggesting that the qualitative labels could be “fuzzified”.
The theory about fuzzy sets and fuzzy logic has been introduced by Zadeh (1965). He observed that humans deal with situations in which knowledge is uncertain, limited and qualitative by using qualitative, linguistic statements and arguments. Zadeh created the fuzzy sets and fuzzy logic as a mathematical means to implement this way of dealing with incomplete knowledge
Consequently, the ‘fuzzy-paradigm’ is well suited for problems in which the knowledge base is limited, qualitative and uncertain. As the arguments and expressions are motivated by experience the approach is well suited for
situations in which different types of knowledge have to be integrated (inter- or multidisciplinarity, stakeholder participation). The formalism of the approach forces the participant to make their knowledge and arguments explicit and puts differences before the limelight
The fuzzy approach is found in the software packages FC Mapper, RAMAS Risk Calc and NAIADE we will discuss later on in this paragraph. It is predominantly used in situations in which uncertainty makes it difficult to define exact classes. Another approach that relies on qualitative estimates of the strength of
relationships is a Qualitative Probabilistic Network (QPN). These QPNs are a qualitative abstraction of Bayesian Belief Networks (BNNs), which use
probabilities for extending the power of inference in causal maps. BNNs require many quantitative probabilities, which are not always available. Another obstacle is that computer calculations of complex BNNs may take a lot of time. For these reasons, the formalism of Qualitative Probabilistic Networks (QPNs) was adopted (Wellman, 1990). These QPNs only define qualitative restrictions on the
probabilities in terms of signs. This makes a QPN much faster than a BBN with the same number of nodes and arrows, although at the cost of level of detail.
Apart from improving speed, the QPN formalism can be useful in cases where there are no quantified probabilities available and when there is no time to gather them. This allows for studying the model’s behaviour without quantification.
Van Kouwen (2007) has adapted the original QPN algorithm and developed the so-called Quasta Approach. The technique of Quasta has some characteristics which make it quite unique. The most important is that it allows backward reasoning, without needing quantitative information. Apart from identifying effects of certain changes, it can also show how certain changes can be achieved, or why certain changes have occurred. Moreover, it shows the consequences of those changes that could (have) contribute(d) to the observed or desired change. The regular forward reasoning and Quasta’s qualitative backward reasoning can be done simultaneously. There is the freedom to enter all types of desired, feared, expected or observed changes in the diagram. Then, Quasta will show how these changes relate to the other concepts in the network. This process is supported by the Quasta software.
The Quasta approach was used in a prospective study called ‘Sustainable living at sea: the Dutch coast in 2080’ (TNO et al., 2007). In this study Quasta was used to create a conceptual model and to study the influence of changes in variables. In this way it is possible to study different scenario’s for the Dutch coast in a qualitative way. The technique is enables integrated assessments and as a possible consequence integrated policy making
Qualitative Probability Network software
The original version of Quasta consisted of a QPN-based Cognitive Mapping which uses the sign-propagation algorithm as adapted by Van Kouwen et al. (Van Kouwen, Renooij & Schot, 2009; Van Kouwen, Schot & Wassen, 2008). This algorithm was implemented in Java. The qualitative tool QGeNIe of the public domain GeNie BNN package (see probabilistic methods below) was used as a graphical interface. The Java tool reads a QGeNIe file, extracts instructions from annotations, calculates the effects and writes the results back into the file. Today a more user-friendly version is available (see www.quasta.nl).
{Quasta}
3.4.2.3 Analysing on the basis of quantitative estimates
More recently Kosko redefined his fuzzy cognitive mapping approach, we mentioned earlier, to a quantified model (Kosko, 1997). According to Ösmezi and Ösmezi (2004) this quantified version of fuzzy cognitive mapping is suited for: 1) cases where hard to quantify human behavior plays a significant role; 2) cases where scientific data are incomplete or entirely missing, but where local, indigenous and traditional knowledge is available; 3) For very complex questions where many different positions are included but where no simple or correct answers are available. In such cases finding compromises is often the only solution and; 4) Cases where public opinion is desired. In these cases fuzzy cognitive mapping also improves the flow of information between the participants.
Fuzzy cognitive mapping software
FC Mapper is an excel template that can be used to visualize and analyze fuzzy cognitive maps. The software calculates all relevant indices (OD, ID, CN,
Hierarchy), counts nodes and connections, defines types of factors (Transmitter, Receiver, Ordinary). Moreover, it simulates the behaviour of the given system, simulates different management options and shows trends. Furthermore, it transforms your matrix coded FCM into a net-file format which can be displayed by software for social network analysis like Pajek or Ucinet and it provides different options for exporting the data.
{FC Mapper}
An example of the use of fuzzy cognitive mapping in the field of environment and health is the study of Diana Reckien and others of the Potsdam Institute for Climate research (see: http://www.fcmappers.net/). These researchers use fuzzy cognitive mapping to identify the impacts of climate change in Indian megacities. The main purpose of the study is the identification of true, ground-based, locally perceived (adverse) impacts of certain climate events on water (availability), transport, energy (security), food (security) and health. FCMs are used as they can identify the perception of people. Another advantage is the possibility to generate knowledge in environments where statistical data are rare, which is a big problem in India. However, the biggest disadvantage is that it isn’t possible to recognize impacts that were not experienced yet or which are not connected to certain weather events or climate change.
At the time of writing this report, the researchers are planning to undertake interviews with students, their families, with researchers and administrators from official bodies, e.g. the water board, the planning board etc. in Delhi and Hyderabad/India.
Another way of analyzing on the basis of quantitative estimates is to construct influence diagrams in popular software packages like DPL and Analytica. In this approach estimates are elicited for parameters in the model. These estimates have to be provided by the developer of the model or the experts/decision makers involved. Software that can support this process is widely available. Very often this software can used to perform a sensitivity analysis by means of a Monte Carlo simulation.
Software for analysis of influence diagrams
Standard influence diagrams assume that variables are scalar quantities. In some of the software packages, like DPL and Analytica, the variables may be a vector, or a multidimensional array - for example, related to the vulnerability of the population and the number of people that have an environment-related disease for each region, each disease, and each time period. Both the packages for decision trees as well as the packages for influence diagrams use Monte Carlo analysis to perform sensitivity analysis. Sometimes this Monte Carlo functionality can be found in the same package. For other packages, like Precision Tree, the Monte Carlo simulation is performed by another package in the suite (@Risk). Almost all software packages for decision trees can also be used to create an influence diagram, including Analytica, Precision Tree, Vanguard decision Tree suite, Goldsim, Treeage Pro Suite (Exel, Healthcare), Treeplan and DPL.
{TreeAge Pro suite (Excel, Healthcare), Precision Tree, Analytica, DPL} 3.4.2.4 Probabilistic methods
More complex quantitative methods have also been proposed for extending the power of inference in causal maps, using probabilistic information. For example, a causal map can be modeled as a Bayesian Belief Network (BNN) in which each node of the network is represented by a variable with set of possible states (each state with probabilities defined by experts/decision makers). Bayesian Belief networks (BNNs) were developed to deal with uncertain or incomplete knowledge and are being applied widely, especially for medical applications (Pearl, 1988) and ecological management (see e.g. (Borsuk, Stow & Reckhow, 2004; Cain, Batchelor & Waughray, 1999)).
A good example of the use of Bayesian nets the field of environment and health is the project that is currently underway at the Center for the Environmental Implications of NanoTechnology at Duke University. Eric Money and others are attempting to construct a Bayesian Network model for the emissions,
fate/transport, uptake, and environmental exposure to nanomaterials in the environment. Using a combination of expert judgments and experimental data they hope to construct a probabilistic based model that can be used for predictive and diagnostic scenario analysis to determine the probability of adverse effects from the potential release of nanomaterials into the environment.
In another application these researchers do a collaborative effort with the North Carolina Division of Water Quality and Dept. of Health & Human Services to develop a Bayesian Network model to aid the fish-advisory program in North Carolina. A probabilistic model is being developed to relate various secondary and tertiary variables to bioaccumulation of mercury in fish tissue using a combination of expert judgment, mechanistic relationships, and existing data. A dynamic Bayesian Network model is proposed that can update the probability of
health effects as new monitoring data becomes available (see: http://ericsmoney.wordpress.com/research/).
Software for analysing Bayesians Nets
There is quite a lot of free and proprietary software available to support the analysis of BNNs.The packages for building Bayesians networks can find optimal decisions for sequential decision problems (i.e., later decisions are dependent on the results of earlier ones) and some of these packages can distract probabilistic relations from data. Thus, Bayesian Network estimations can be made about chances or probability distributions that represent relations in the network. Packages that can be used to construct Bayesians networks are NETICA, Uninet, GeNie, Hugin, SamIam, B-course and the Microsoft Baynesian network toolkit. A significant part of the software for Bayesian network analysis is freely available (Genie, Uninet, SamIam, B-course and the Microsoft Baynesian network toolkit). As filling out Conditional Probability Tables (CPT) is a necessary step in building Bayesians Networks, the software has to provide the possibilities to elicit
proportions. The interface approaches can be partitioned into two categories: (i) table based, in which CPTs are entered in (basically) a spreadsheet and (ii) graphical, in which graphical methods, such as bar or pie charts are used to represent the CTP. According to Jiangyu Li et al.(Jiangyu Li , Dekhtyar & Goldsmith 2002) is it clear that elicitation of proportions/probabilities is not the largest concern of the developers of these packages. They state that special purpose elicitation software is preferable (see section 3.4.2.7).
{NETICA, Hugin, GeNie, Uninet, SamIam, B-course, Microsoft Bayesian network toolkit}
3.4.2.5 Evaluation of alternatives and scenarios
Another task on which experts can provide a meaningful contribution is on the evaluation of alternatives and scenario’s. Such comparisons are fairly common in integrated environmental health impact assessments, in which often a business as usual scenario is compared to one or more scenarios in which a policy is applied. An frequently used methodology for evaluating scenarios is by
constructing a decision tree, as we introduced in section3.4.1, and quantify the different elements in it. Software that supports the analysis of decision trees and subsequent sensitivity analysis has been mentioned before. Almost all software packages for influence diagrams can also be used to create a decision tree. Software for analysing decision trees
Decision trees let you visually map out complex, multi-layered decisions in a sequential, organized manner. This helps you identify all possible alternatives and choose the best option.
{TreeAge Pro suite (Excel, Healthcare), Precision Tree, Analytica, DPL} 3.4.2.6 Multi Criteria Analysis
Another way to analyse decision trees is by using Multi Criteria Analysis (MCA). MCA also uses a model with a tree structure and also tries to find the most optimal solution like the decision tree packages. An important difference is that in an MCA relevant environmental health aspects like burden of disease, concern about a heath risk and concerns about equity can all be included as important elements (criteria) for a decision. Consequently, a risk can be quantified in a single figure, which weighs the different criteria according to their importance
for the final decision. If this is done for different risks, these can be ranked and an impression is obtained of the risks that deserve attention in the policy process. Moreover, the method provides to possibility to look at the problem from different perspectives. What happens, for instance, if we consider the health impact to be the most important criterion when deciding about policy priorities; or what happens if concern by the general public is considered the most important, etc. In order to check the validity of the ranking, a sensitivity analysis can be performed by assigning an uncertainty range to the variables and execute a Monte Carlo analysis.
Multi criteria analysis software
MCA is a well established technique that finds its implementation in several software packages. The software packages that support Multi Criteria Analysis (MCA) can be classified in those that are developed at a university and are more or less in a ‘basic state’ and packages that have reached a commercial state, but often still have a link with the university at which the package has been
(initially) developed. The commercial packages provide a solution for a wide range of problems and combine several techniques within a single package. Examples are Equity3, Hiview3, Logical decisions 6.1, Expert Choice, Definite, 1000minds, V.I.S.A. Part of the university packages test (a) newly developed algorithm(s) or a new approach to MCA. This holds for Web Hipre, Rich decisions, Win Pre, Decision Deck and Unibalance-Unisense-Unigraphics. All university software can be obtained for free. The commercial packages have to be bought. The prices of the packages start at approximately 1.500 euros. Special about Decision Deck is that this is an open source project in which several MCA-techniques are implemented as a plug-in on a universal software module. Some remarkable products are the free Analytic Hierarchical Process (AHP) excel templates. Although the templates are very useful, their user-friendliness is limited. An advantage of excel templates is that everybody can use them without the need of installing a software package. Of the free packages, NAIADE implements a fuzzy MCA-approach.
Some of the commercial packages provide the possibility of consulting experts or other members of the project team at distance using the internet. This is a very useful feature for group elicitation, but this comes at a high price as relatively large annual subscription fees have to be paid. This holds for Expert Choice, 1000minds and V.I.S.A. Of the university packages Decision Deck can also be used as a multi-user package, but this package is not very user-friendly. In fact it is a MCA development platform. Logical decisions 6.1 has a special version for groups in which all locally participating experts can provide input by means of radio transmitters.
{Equity3, Hiview3, Logical decisions 6.1, Expert Choice, Definite, 1000minds, V.I.S.A., Criterium Decision Plus, Unibalance-Unisense-Unigraphics, Web-Hipre, Rich decisions, Win pre, Prime Decisions, Decision Deck, AHP templates, NAIADE}
The role of experts in this technique can be that: 1) they can indicate relevant criteria; 2) they can provide educated guesses about the values of criteria that have no solid empirical basis yet and/or; 3) they can indicate the relative importance of the several criteria for different risks. They can also state that all criteria are equally important. The combination of expert opinions and Multi Criteria Analysis makes it possible to assess relatively new risks, potential risks and/or new risk aspects in MCA risk rankings.
There are several approaches and algorithms possible in MCA. Examples are: weighted summation, Electre, Promethee, Evamix and McBeth. Janssen (2001) shows that in the Dutch practice of performing environmental assessments, the method of weighted summation is predominantly used. The reasons for that are that the approach is methodologically sound and that it is transparent for the stakeholders involved. Consequently, he concludes that the most important methodological challenge of a MCA is to define the problem properly and not the choice of a particular MCA methodology.
An advantage of MCA software packages that have functionality of group sessions via the Internet is that participation is less time consuming for experts and it is possible to include experts that otherwise wouldn’t be able to
participate e.g. as a consequence of their geographic location. However, there are alternatives for these packages. Practically all MCA packages can be used in a group elicitation, by showing the process on a projection screen. The packages can also be used to integrate data that have for instance been written down by experts as a result of discussion, but this does not take full advantage of the possibilities of the software. For discussion and collaboration the software for online collaboration like can be used. This is also a good approach for experts that cannot be at the same location at the same time. The output of the MCA (pictures, graphics, rankings) can be provided to them by means of this same package. Alternatively one could decide to use the online survey software for this purpose and provide feedback by e-mail. If one strives at a consensus amongst experts about the data a real time Delphi can be an option 3.4.2.7 Estimates of single parameters
In this section we focus on the estimation of model parameters. Expert
elicitation is then used to get an idea about the magnitude and uncertainty of a particular ‘unknown’ variable. This type of elicitation can benefit substantially from graphical support by software. Quantitative estimates are often expressed in probabilistic terms (min, max and most likely values; subjective probability density functions, etc). Such parameters can be elicited using specific software that helps experts to insert, visualize and check their estimates, or provides features to analyze or aggregate results. In textbox 1a few well-known methods for the elicitation of probabilities and probability distributions are discussed.