Assessment of health impacts and policy options in relation to transport-related noise exposures
Topic paper noise
Staatsen BAM, Nijland HA, Kempen EMM van, Hollander AEM de, Franssen AEM, Kamp I van
This paper has been written under the commission of the Ministry of Housing, Spatial Planning and the Environment and the Ministry of Transport, Public works and Water management (projectnr M/815120/TC). It has been developed as part of a joint 6-country project on ‘transport-related health effects, towards an integrated assessment of costs and benefits with a particular focus on children’. The project is a contribution to the UNECE-WHO transport Health and Environment Pan-European Programme (the PEP).
Abstract
This paper has been drafted within the framework of a joint international project (Austria, France, Malta, Sweden, Switzerland and the Netherlands). The aim of this project is to describe the state of the art on transport related health impacts, highlight (if possible) costs and benefits, identify
methodological aspects and develop directions for policy measures and strategies, with a special focus on children. A synthesis report of the overall results is available at www.herry.at/the-pep.
This topic paper on transport noise is one of the products of this joint project. It provides an overview of the state of the art regarding traffic noise-related health impacts and guidance for the assessment of noise exposures, its health impacts and costs.
In Europe, transport (road, rail and air traffic) is the most important source of community noise. Noise exposure at community levels can produce various health effects including annoyance and sleep disturbance. A small effect on blood pressure is also deemed plausible. The limited number of epidemiological studies in children indicates that noise exposure affects children’s learning (cognition), motivation and annoyance.
The benefits of implementing source-measures for noise abatement may well exceed the costs of these measures, as some cost-benefit analyses clearly indicate. A large variety of policies and measures are available which can reduce the noise-related health impacts. A number or priority options have been identified in joint discussions with researchers and policymakers. The results of noise and HIA studies in different countries are difficult to interpret and compare due to methodological differences. Thus, some methodological and research recommendations to improve health impact assessments and cost-benefit analyses, as well as some examples are presented.
Acknowledgements
The Dutch Ministry of Transport, Public Works and Water Management and the Ministry of Housing, Spatial Planning and the Environment commissioned this paper. Lotje van Ooststrom, Mario Fruianu and Marjan Heijman from the Ministry of Transport and Martin van den Berg from the Ministry of Environment provided us with valuable comments while drafting this paper.
We thank Danny Houthuijs, Erik Lebret, Jan-Anne Annema, Oscar Breugelmans and Paul Fischer from RIVM for their critical remarks. Last but not least we would also like to thank the following international experts for their useful comments and discussions on earlier versions of this paper, with special thanks to Hans-Peter Huetter:
Bernard Berry, BEL-Acoustics, United Kingdom Hans-Peter Huetter, University of Vienna, Austria
Ronnie Kleboe, Institute of Transport Economics, Traffic Safety and Environment, Oslo, Norway Evy Öhrström, Göteborg University, Sweden
Alain Muzet, Centre National Recherche Scientifique, Strasbourg, France Henk Miedema, TNO, Delft, the Netherlands
Xavier Bonnefoy, WHO-ECEH, Bonn, Germany
Tommaso Meloni, Swiss Agency for the Environment, Forests and Landscape (SAEFL), Bern, Switzerland
Executive summary
Background and aimThis paper provides an overview of the state of the art regarding traffic noise-related health impacts and guidance for the assessment of noise exposures, its health impacts and costs. It has been drafted within the framework of a joint international project (Austria, France, Malta, Sweden, Switzerland and the Netherlands). The aim of this project is to describe the state of the art on transport related health impacts, highlight (if possible) costs and benefits, identify methodological aspects and develop directions for policy measures and strategies, with a special focus on children. The overall goal of this joint exercise is to provide a contribution to the implementation of the UNECE –WHO Transport Health and Environment Pan European Program (PEP) as well as input for the Ministerial Conference on Environment and Health in Budapest (June 2004).
Trends in traffic noise exposure levels
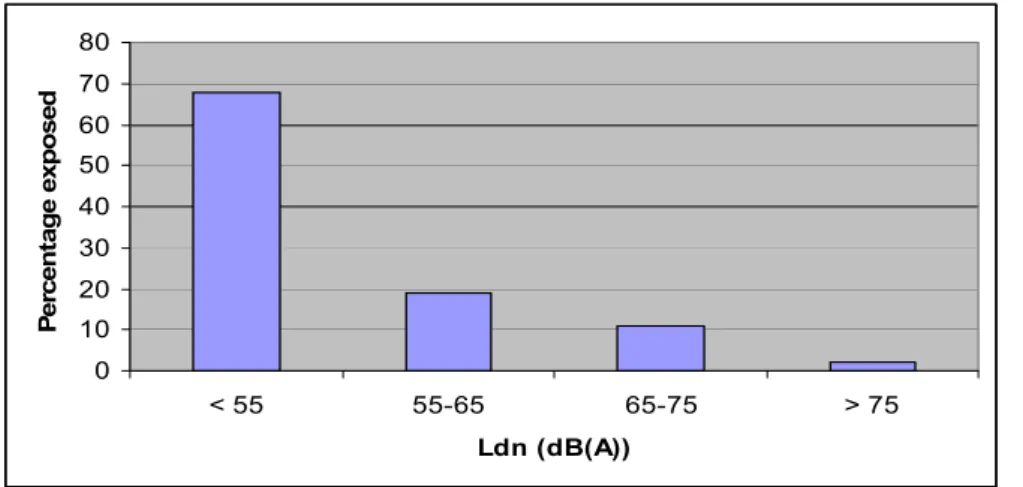
Community noise is a widespread environmental problem. In Europe, transport (road, rail and air traffic) is the most important source of community noise. Approximately 30% of the European Union’s population (EU15) or close to 120 million people are exposed to levels of road traffic noise of more than 55 dB(A). In general, many people are annoyed and disturbed in their sleep at these levels. Exposure to high noise levels has decreased substantially in some countries since 1980 due to technological (e.g. reduction of emissions, change of road surfaces) and spatial measures such as noise barriers and spatial separation of transport and residential functions (see e.g. section 7, box 1). Nevertheless, noise levels are expected to rise again in the next decades due to the growth in traffic volumes, unless additional measures are taken.
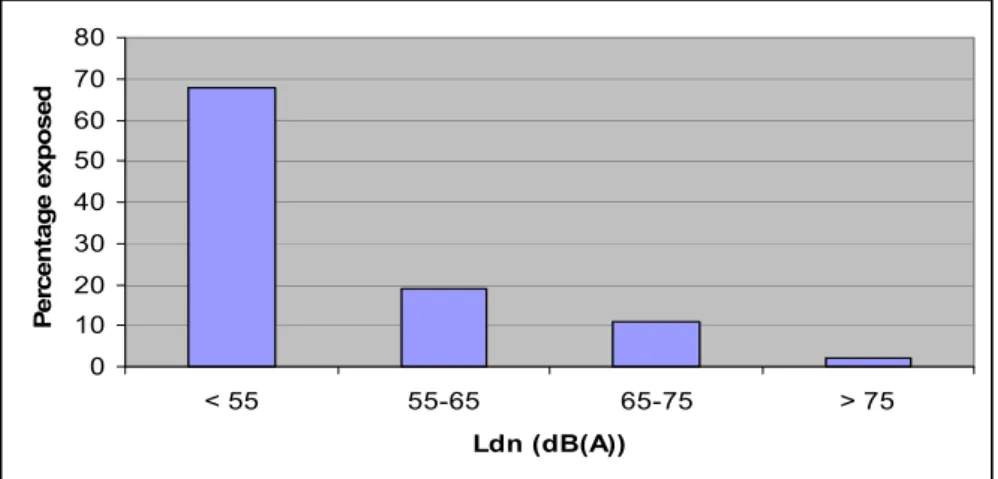
Figure 1 The exposure of European Union's population to traffic noise exposure (façade dwelling) expressed in Ldn (Source: Roovers et al., 2000).
Health impacts in adults
A review of epidemiological studies shows that noise exposure at community levels can produce various effects in adults, including annoyance and sleep disturbance. The evidence for a causal association between noise exposure and increased cardiovascular health risk is limited. However, a small effect of noise exposure on blood pressure levels is deemed plausible, since the overall results of these studies on the full range of endpoints from slight elevation of blood pressure to cardiovascular disease are consistent with known stress
0 10 20 30 40 50 60 70 80 < 55 55-65 65-75 > 75 Ldn (dB(A)) P e rc en ta ge expo s e d
reactions and cardiovascular disease progression and supported by laboratory studies on stress reactions and blood dynamics.
Reported annoyance and sleep disturbance levels vary across European countries, but are difficult to interpret due to differences in methodology. Noise exposure explains about
25 - 30% of the observed variance in annoyance. Individual and socio-economic factors are important too (e.g. anxiety, fear, appraisal of a noise source, trust in responsible authorities, perceived control and economical advantages).
Health impacts in children
The limited number of available epidemiological field studies in children shows that noise exposure affects children’s learning (cognition), motivation and annoyance. Noise exposure may also have impacts on the cardiovascular and endocrine system. There is no convincing evidence for a direct effect of noise exposure on congenital abnormalities, birth weight or disorders related to the immune system. Current levels of environmental noise exposure in Europe do not have an effect on hearing threshold levels of children. Nevertheless, combined effects should not be excluded: recreational noise (walkmans, discotheques, noisy toys) may make children and adolescents more vulnerable for the effects of traffic or occupational noise.
The overall results from epidemiological field studies on the association between noise and cognition in children indicate that an increase of aircraft noise exposure is associated with negative impacts on reading acquisition, up to 6 months impairments in reading age. In general, consistent results are observed for reading ability and memory impairment. Studies looking at the association between noise exposure and attention vary in results. The findings of studies examining the potential impacts of road traffic noise are inconsistent.
While some studies indicate that the effects on reading may be reversible if the noise ceases, the long-term developmental consequences of exposure that persists throughout the child’s education remain yet to be determined. However, intervention measures (outdoor and indoor) have shown the benefits that might be attained if community noise levels are decreased: reduction of noise levels (indoor and outdoor) has been shown to result in improved long-term memory and reading ability of children.
Children are more vulnerable than adults with regard to effects on learning, while for annoyance the reverse seems more likely. Although children appear to be less disturbed during their sleep than adults, there is some evidence for ‘hidden effects’ occurring during sleep that, in the long term, might add to the risk of cardiovascular disease. To avoid these effects, protection of children against noise exposure during the night and at school is recommended.
Cost-benefit analysis of transport noise
Noise abatements costs a lot of money but, on the other hand, if abatement fails, noise may have adverse effects on health and well being. These adverse effects can also be expressed in monetary terms. The benefits of implementing several source-measures on cars and trains may exceed the costs of these measures, as some cost-benefit analyses clearly indicate. Low-noise asphalt and reduced speed limits are more cost-effective than erecting Low-noise barriers; instead of just solving local problems they can reduce noise levels throughout a wider urban area.
Equity (or environmental inequity) may also be considered in cost-benefit analyses of policy measures. In the Netherlands for example, low-income groups are more often exposed to high noise levels (> 65 dB(A) ) and live less than average in quiet areas (<50 dB(A)).
Health impact assessment and cost-benefit analysis of transport noise: lessons learned Currently, international comparisons of the noise levels and related impacts in different countries are hampered by (a) possible methodological differences in exposure assessment which may lead to differences in predicted noise levels up to 10 – 15 dB(A) and (b)
differences in outcomes of national surveys which can be due to the use of different
questions to assess annoyance. The EU Directive 2002/49/EC and ISO technical specification ISO/TS 15666:2003 provide a basis for further harmonisation on noise exposure and
annoyance assessment respectively.
For assessment of the potential health risks of transport-related noise exposure, the following options are available:
• Comparison of community noise levels with limit values or policy targets (‘distance-to-target’). WHO-guidelines are available which specify noise levels for different settings and activities (see table 3.1).
• Identification of ‘ hot spots’ (areas with high exposure levels) or % population exposed to noise levels above reference or limit values.
• Assessment of the health impacts or number of people affected.
Health Impact Assessment (HIA) can add value to the (transport) policy-making process by helping decision makers identify and assess possible health consequences and optimise overall outcomes of the decision. For more strategic assessments, when different policy options or measures have to be compared, methods are needed to compare the different health impacts of competing decisions (comparative risk analysis) or to compare costs of health impacts with measures, which will reduce these health effects (cost–benefit analysis). The following approach could be adopted for the health impact assessment of noise:
1. Select health end-points for which there is sufficient evidence (annoyance, sleep disturbance) or limited evidence (hypertension).
2. Assess the exposure distribution of the population using a noise-propagation
model or (when not available) a more crude model taking into account traffic and population density. Use the EC-guideline for noise calculations and metrics. 3. Select exposure-response functions based on review of epidemiological studies
(see table 7.1 and box). For examining the scientific evidence and selecting valid studies, an advisory report of WHO on evaluating epidemiological evidence provides useful guidance.
4. Calculate the proportion of cases in the study population that can be attributed to noise, based on the basic prevalence in the study population
5. If needed, calculate the total noise-related disease burden or costs.
This approach involves some limitations though. The first is how to deal with uncertainty in causality and exposure-response functions. Do we also include effects for which the evidence is still limited? To overcome this problem one could add a weight factor for the strength of evidence to the calculations. The transferability of estimates to populations other than the study population, from which the estimate has been derived, is another source of uncertainty. Most risk estimates for noise are based on studies in adults. In addition, the prerequisites of certain curves (e.g. some may only be used for strategic, comparative assessments; not for assessment of local and changing situation) should be taken into account. Finally, generalised exposure-response functions for children are lacking, since only a few studies have looked into this. Ongoing projects such as RANCH may provide some useful functions in the near future though.
Exposure-response functions recommended for health impact assessment of traffic noise Annoyance and (perceived) Sleep disturbance: Use risk estimates from national surveys of good
quality. If not available, use functions as described in the EU-guidelines (annoyance, Miedema and Oudshoorn, 2001) or (for sleep disturbance) as described in Miedema et al., 2003. Include correction factors for insulation or window behaviour if needed.
Cardiovascular disease-risk: Use estimates for road traffic and aircraft noise from recent
meta-analyis (Van Kempen et al., 2002)
Cognition: To assess the potential impact of aircraft noise on reading and annoyance in children
upcoming functions from the RANCH-study may be of use (Stansfeld et al., 2003; Stansfeld et al., submitted).
As an illustration, an assessment of the different health impacts has been made for the Dutch situation (table 1). The best available quantitative estimates for the risks for different
cardiovascular endpoints are the results of a meta-analysis published in 2002. These estimates have been used for an indicative assessment, under the assumption that there is a causal association between noise exposure and cardiovascular disease. The results of this assessment of the different health impacts indicate that 1-2 % of the total disease burden might be
attributed to health impacts of noise exposure (annoyance, sleep disturbance and cardiovascular disease).
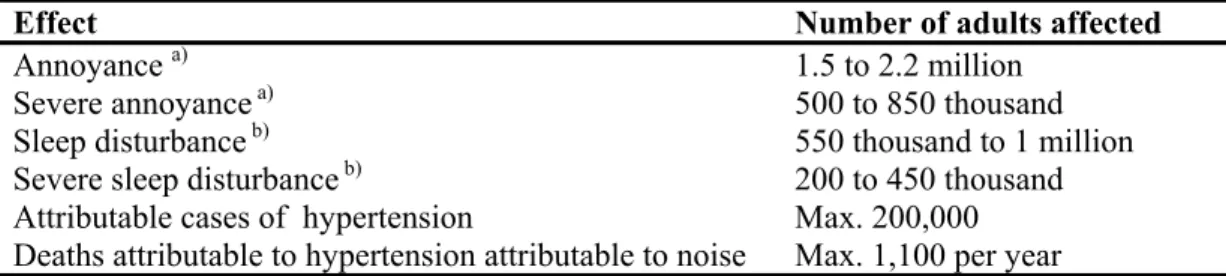
Table 1 Estimates of the number of people affected by road traffic noise exposure in the Netherlands (total population of 16 million) (2000)
Effect Number of adults affected
Annoyance a)
Severe annoyance a) 1.5 to 2.2 million500 to 850 thousand Sleep disturbance b)
Severe sleep disturbance b) 550 thousand to 1 million200 to 450 thousand Attributable cases of hypertension
Deaths attributable to hypertension attributable to noise
Max. 200,000 Max. 1,100 per year
a) Estimated by means of the (international) exposure-response relationship as derived by Miedema and Oudshoorn, 2001 and only valid for Ldn 45-65 dB(A).
b) Estimates are made on the base of the exposure-response relationship from Miedema et al., 2003 and only valid for Lnight 45-65 dB(A).
c) Estimated by means of a RR of 1.26 per 5 dB(A)) from a meta-analysis on noise and cardiovascular disease (Van Kempen et al., 2002).
d) Deaths attributable to hypertension estimated by means of a Chronic Disease model (Hoogenveen et al., 1998).
Cost-benefit analysis of noise measures has mostly been based on annoyance (amenity loss), assessing the Willingness To Pay for reduction of noise levels. No data are known about the value children put to noise reduction. Just recently, monetary values have been derived within the UNITE project for health impacts (sleep disturbance and cardiovascular impacts) of road noise and aircraft noise, which can be used for calculating external costs of noise. These monetary values derived for health impacts of noise need further validation by health professionals though.
Reference limits for exposure to noise
It is proposed to use national standards (where existing) or WHO guidelines as these specify noise levels for different settings, activities and times. In general, noise levels in residential settings should not exceed 55 dB(A) (Berglund, 1999). A substantial number of people will still be annoyed at this level though. The limit values of WHO for school noise levels (35 dB(A) LAeq, in school) can be used in setting objectives but may be difficult to reach. The
WHO guidelines for night-time noise (45 dB(A) LAeq) do not allow acting towards reductions
Recommendations for further research and exchange of information
It is recommended to have regularly scientific reviews on evidence and consensus building on ‘safe’ noise threshold levels for different settings, activities and daytimes (update WHO-guidelines), especially with respect to the protection of children. Besides a scientific
discussion on the existing WHO guidelines, development of new thresholds based on (new) research should be supported. Results of international studies and good practices should be fed directly in the WHO- and PEP-process and made available to other countries.
To improve the knowledge-base on noise-related health impacts and associated costs in children, the following research options may be considered:
• Study long-term consequences of noise exposure on cognitive development by
periodically collecting data on individual performance of children for selected subjects as well as data on the actual noise levels.
• Include other stressors (air pollution) and markers of effect (annoyance, quality of life, behaviour, stress responses) in noise studies. Identify psychological, social and physical protective factors (e.g. restoration). Better information on the context (soundscape) in which adverse effects occur can help architects and land use planners in designing environments which better fit the needs of children (Lercher, 2003).
• Promote intervention studies and identification of best practices of preventing harmful effects of noise in children.
• Assess the health gain of reduction of exposures vs. effectiveness and costs of
intervention measures e.g. by using the DALY method. An approach limited to Cost of Illness (COI) is not sufficient since no estimates are available for effects on cognition. • Support further research on the effects of traffic noise on sleep and cardiovascular risk in
children. Evaluate findings from ongoing field studies where the effect of combined exposure of noise and air pollution is studied.
• Support assessments of socio-cultural, economical, and also political factors, which influence annoyance and disturbance responses, in order to feed the decision makers toolbox (e.g. public participation).
Policy options to reduce noise-related health impacts
A large variety of policies and measures are available, which can reduce the impact of traffic noise on health at the local, regional, national and supranational level. A number of priority options have been identified in joint discussions with noise experts and policy-makers (see table 6.1), based on the (magnitude) of expected reductions in noise-related health impacts: • Development of child-friendly mobility plans, with attention for infrastructure and
education measures promoting safe walking and biking by children and their parents. • Traffic calming measures, such as reduction of speed limits and traffic volume in
residential areas.
• Reduction of speed in non-urban road infrastructures, e.g. by promotion of eco-driving and education of driving instructors and drivers.
• Employee travel: charging for parking, incentives for public transport and cycling. • Integration of land use, transport policy and urban planning. Define objectives for urban
and transport planning with regard to e.g. the design of quiet areas, location of schools and dwellings in relation to busy roads, railways and airports.
• Restrictions for heavy lorries, noisy trains and aircraft in/over residential areas (significantly decreasing the number of trucks during the night and weekends and inhibiting/limiting aircraft and train noise at night).
• Regulations for emissions of rail and road vehicles, aircraft; for tyres, road surfaces. Further development and enforcement of (innovative) technological measures reducing emissions at the source and exposures. Enforcement and control of implementation of EU-guidelines.
• Development and monitoring of noise abatement plans.
Since the type and size of transport problems differ per country, region and urban area, different (packages of) measures are needed containing one or more of the above noise-reducing measures. In developing such a package, it is recommended to give priority to those interventions that also address other transport related health effects, since this allows for economic efficiencies and synergies. For example, measures that reduce the volume and speed of traffic around schools and within or around residential areas will reduce noise, air pollution, energy use and improve safety as well.
In the framework of policy development and target setting it is recommended to calculate and compare health impacts and costs of different plans and scenarios. Goals and thresholds for action, monitoring and evaluation of policy/development plans need to be defined.
Contents
1. Introduction 15
1.1 Background: the PEP 15
1.2 Methods for health impact assessment 16
2. Noise exposure assessment: methodology and available exposure data EU 17
2.1 Characterisation of noise exposure 17
2.2 Noise calculation methods 18
2.3 EU-Noise policy on indices and calculation methods 19
2.4 Noise exposure 20
3. Health effects of noise 25
3.1 Overview of reported noise effects on health and well-being 25
3.2 Annoyance 30
3.3 Sleep disturbance 34
3.4 Cognition 36
3.5 Cardiovascular diseases 39
4. Health Impact Assessment of traffic noise 43
4.1 Health Impact Assessment 43
4.2 Noise-related disease burden 46
5. Economic valuation of noise impacts 49
5.1 Available methodology for cost-benefit analysis 49
5.2 Cost-benefit analysis studies in EU 50
6. Policy analysis and options 53
6.1 Policy analysis and risk management 53
6.2 Effects of noise abatement measures 54
6.3 Policy options 56
6.4 Development of a strategy towards reduction of transport-related noise exposures 59
7. Discussion and conclusions 61
7.1 Noise exposure assessment 61
7.2 Health impacts of transport noise 61
7.3 Assessment of transport-related health impacts and costs: lessons learned 62
7.4 Policy options to reduce noise-related health impacts 65
References 67
1.
Introduction
1.1
Background: the PEP
This paper is a contribution to the integration of environmental health aspects into transport policy. It has been drafted within the framework of a joint exercise (Austria, France, Malta, Sweden, Switzerland and the Netherlands) to expand and further develop the methodology for cost-benefit analyses of transport-related health impacts. The aim of the project is to provide an overview of the state of the art on transport related health impacts, highlight (if possible) costs and benefits as well to develop directions for political measures and
implementation strategies, with a special focus on children. The overall goal of this joint exercise is to provide a contribution to the implementation of the UNECE –WHO Transport Health and Environment Pan European Program (PEP) as well as input for the Ministerial Conference on Environment and Health in Budapest (June 2004).
As a contribution three background papers on noise have been prepared:
1. Health impact assessment of transport-related noise exposures (adults); state of the art on noise exposure, health impacts and guidelines for health impact assessment
2. Traffic-related noise exposure and health impacts in children
3. Policy options to diminish noise exposures and health impacts related to transport This final topic paper is an integration of these three papers, combined with the output of discussions during four international expert-review workshops in respectively Vienna, Stockholm, The Hague and Malta. Reports of these meetings and related papers are available at www.herry.at/the-pep. Within the framework of this project it was not possible to collect (new) data for the countries involved. When data were not available or comparable,
illustrating data from the Netherlands have been used. Aim and objectives
This paper provides guidance for assessment of the impacts of traffic noise exposure on public health and related costs. It starts with a brief description of the general approach to assess environment-related health impacts (1.2). This is followed by an overview of the available methodology to assess noise exposure, illustrated with some data from the EU and the Netherlands (section 2). In section 3 an outline of the current state of the art with regard to the epidemiological evidence on noise-related health risks is given, with a special focus on the evidence available for children. In addition, the potential health benefit from reducing noise exposure based on intervention studies is discussed. This is followed (section 4) by an illustration of a health impact assessment (HIA) of transport noise based on data from the Netherlands. In section 5 the methodology and results of cost-benefit-analyses of noise impacts are discussed, followed by an evaluation of policy measures (section 6) and key messages and recommendations (section 7) for future assessments and noise policies. This paper is based on recent scientific reviews and discussions with (inter) national experts in the field before and during the workshop series.
1.2
Methods for health impact assessment
Health impact assessment (HIA) is a combination of procedures, methods and tools by which a policy, programme or project may be judged as to its potential effects on the health of a population and the distribution of these effects within the population. HIA can add value to the policy development process by (Kemm, 1999; Kemm and Parry, 2004):
• Raising awareness among decision makers of the relationship between health and the physical, social and economic environments (e.g. by quantifying the magnitude of harmful and beneficial impacts);
• By helping decision makers identify and assess possible health consequences and optimise overall outcomes of the decision (e.g. by clarifying the nature of trade-offs in policy making);
• Allowing better mitigation of harmful factors.
The following approach is proposed to assess the health impacts of traffic noise, which is based on the usual procedures for environmental health risk assessment (Hertz-Piccioto, 1998):
(1) Select a set of health endpoints for which there is sufficient evidence for an association with the risk factor under study. For each of these indicators do the following steps: (2) Exposure assessment: Combine data on (sub) population density with noise level distributions, e.g. by means of Geographical Information Systems (GIS). Noise levels may be based on monitoring data, legally required noise propagation models or simple models taking into account degree of urbanisation, traffic or vehicle density and emission levels;
(3) Identify coefficients and confidence intervals of exposure-response relationships and thresholds of effects: Epidemiological data can serve as the base for an exposure-response assessment if they demonstrate an exposure-response relationship and are of sufficient quality. In examining the scientific evidence the validity of the studies (influence of chance and bias) needs to be evaluated (WHO, 2000).
(4) Estimate the proportion of cases observed in the study population that is attributable to the risk factor under study. This is a function of the population exposure distribution,
exposure-response relationships and the observed incidence and prevalence rates of the health end-point in the study population.
(5) Calculate the total noise-related health loss or costs, if desirable.
The impact of traffic-related exposures on human health can take numerous shapes of various severity and clinical significance. Effects of air pollution for example range from increases in respiratory symptoms and hospital admissions to mortality, while noise pollution is
associated with annoyance, sleep disturbance and (perhaps) increased incidence or
aggravation of cardiovascular diseases. For decision-making and strategic assessments these different health effects have to be compared with other health effects caused by competing decision alternatives (comparative risk assessment) or with costs of measures (costbenefit-analysis). Thus, a common metric that allows aggregating a wide range of health outcomes would enable decisions that are more informed (Hofstetter, 2002; De Hollander et al., 1999). Experience with health metrics in environmental decision-support tools is limited to the use of years of lives lost, monetary cost estimates of health impacts and Quality Adjusted Life Years (QALYs) or Disability Adjusted Life Years (DALYs). All these studies used human health metrics in order to aggregate different health outcomes in one dimension so as to make them more comparable and interpretable (Hofstetter, 2002). In section 4 and 5 some
examples of disease burden calculations and cost estimates of noise-related impacts are presented.
2.
Noise exposure assessment: methodology and
available exposure data EU
This section describes the available methodology to assess and compare traffic-related noise exposure in the EU. Some data from the EU and the Netherlands will be presented.
2.1
Characterisation of noise exposure
The available metrics to characterize noise exposure are based on physical quantities to which ‘corrections’ are applied that take into account the sensitivity of the human ear. These corrections depend on the frequency, noise characteristics (impulse, intermittent or
continuous noise levels), and the source of noise. Within the framework of this paper the following metrics are important:
• Sound pressure level. The sound pressure level (L) is a measure of the air vibrations that make up sound. Because the human ear can detect a wide range of sound pressure levels (from 20 micro-Pascal up to 200 Pascal), they are measured on a logarithmic scale with units of decibels (dB) to indicate the loudness of a sound.
• Sound level. The human ear is not equally sensitive to sounds at different frequencies. To take account of the loudness of a sound a spectral sensitivity factor is used to weigh the sound pressure level at different frequencies (A-filter). These, so called A-weighted sound pressure levels are expressed in dB(A).
• Equivalent sound levels. When sound levels fluctuate in time, the equivalent sound level is determined over a specific period of time. For this purpose the A-weighted sound level is averaged over a period of time (T), using a prescribed procedure (symbol LAeq,T). A common exposure period T in community studies/regulation is from 7 to 23 hours (LAeq,7-23hr).
• Day-night level (Ldn). This metric is used in environmental impact assessment as it correlates much better with community annoyance than the equivalent sound level. Ldn is the equivalent sound level over 24 hours, increasing the sound levels during the night (23-07 hours) by 10dB(A) since noise during the evening and the night is perceived as more annoying than during daytime.
• Day-evening-night level (Lden) is constructed in a similar way as the Ldn, increasing the sound levels in the evening (19-23 hours) with 5 dB(A) and those during the night (23-07) with 10 dB(A).
• Lnight . The equivalent sound level over nighttime (23.00 pm – 07.00 am).
• Sound exposure level (SEL) of a noise event, such as the noisy passage of an aircraft, is the
equivalent sound level during the event normalised to a period of one second. Usually, the values of these metrics are assessed outdoors.
In most European countries, A-equivalent indices (LAeq-type) are more common than
statistical indices (L10 -, L50-type). Unfortunately, noise indices differ per country and within
a country even per transport mode. Gottlob (1995) and more recently Flindell et al. (2000) gave good overviews of the indices used for the different modes in European countries. They concluded that especially the indices used to describe noise exposure by aircraft vary
considerably between the different countries. Table 2.1 illustrates the findings of Gottlob and Flindell for the Netherlands. Per noise source the indices differ for the periods (day/night or day/evening/night) considered, the maximum or the average exposure and for the long-term time-period (1–3 years) covered. Similar findings are observed in other countries as well.
Table 2.1 Noise indices in use in the Netherlands
Source Periods considered and
penalties used Night-time Long-term periodconsidered
Road traffic LAeq Maximum of day and (night +
10 dB(A)) 23.00-7.00 1 year, working daysonly
Railroad traffic LAeq Maximum of day, (evening + 5 dB(A)) and (night + 10 dB(A))
23.00-7.00 3 years Air traffic LAeq Average of day, (evening + 5
dB(A)) and (night + 10 dB(A)) 23.00-7.00 1 year
2.2
Noise calculation methods
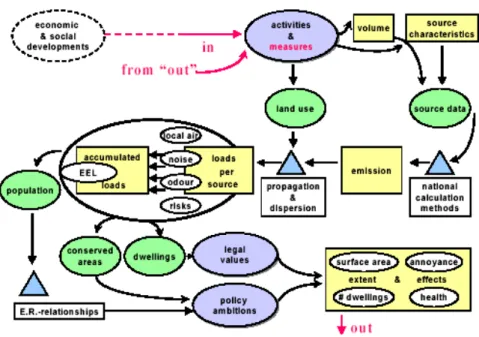
Noise exposure is usually assessed according to national noise calculation methods. In the Netherlands, for road traffic RMV2002 is the legally prescribed method. Like all national European noise calculation methods, it first calculates the noise emission by the source, taking into account the characteristics of the source (type of car, speed, type of pavement, height of the source etc.). The next step is the calculation of noise loads at the receiver. To do so, characteristics of the noise propagation path have to be taken into account (e.g. distance, type of ground, presence and type of buildings or other objects etc.). Corrections can be made for the meteorological conditions (temperature, wind). To estimate the number of people exposed, noise propagation models can be combined with demographic data e.g. using GIS (for example figure 2.1)
Figure 2.1 Example of Dutch noise calculation model (EMPARA) where EEL is Environmental Exposure Level, an index based on a source-dependent weighing of annoyance caused by the different sources
For regional scale calculations (i.e. whole-city to transnational) it is suggested to use relatively ‘simple’, spatially and temporally aggregated dispersion/propagation models and
link those to routine statistical information on population distribution (from census data), stratified as appropriate by age, gender and socio-economic status. For analysis of urban transport, local scale modelling (i.e. street-level to within-city/district) using high resolution and detailed dispersion/propagation models is recommended.
Different countries have different calculations methods, which, given the same standard situation, usually do not lead to the same outcome. This may partly be explained by different characteristics of driving style, composition of fleet and composition of road/rail in the different countries. Dittrich (2000) measured 2-3 dB(A) difference in noise emission of (the same) train wagons in different countries (Austria, Netherlands, Italy and France), due to the use of different types of railroads.
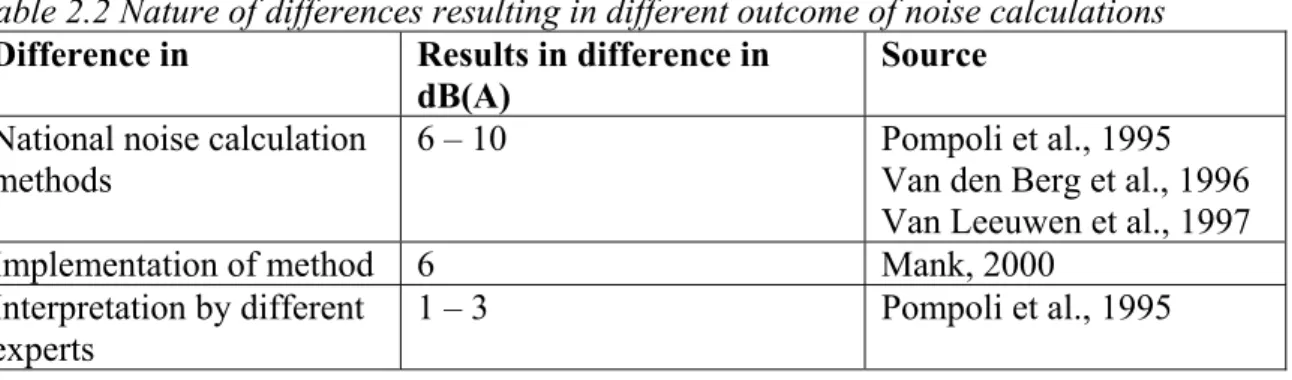
Apart from these real existing differences, other (and bigger) differences in outcome between national assessments are due to (undesired) methodological artefacts. Pompoli et al. (1995), Van den Berg et al. (1996) and Van Leeuwen et al. (1997) calculated standard road-traffic situations using different national methods and concluded that differences in calculation methods may lead to differences in outcome of 6 – 10 dB(A) (table 2.2). The way the national calculation methods are implemented in mathematical models again may lead to differences of 6 dB(A) (Mank, 2000). Pompoli et al. found that interpretation of the data by different acoustical experts may vary by 1–3 dB(A).
Table 2.2 Nature of differences resulting in different outcome of noise calculations Difference in Results in difference in
dB(A)
Source National noise calculation
methods
6 – 10 Pompoli et al., 1995
Van den Berg et al., 1996 Van Leeuwen et al., 1997
Implementation of method 6 Mank, 2000
Interpretation by different experts
1 – 3 Pompoli et al., 1995
The different components in table 2.2 may not be completely independent of each other. Nevertheless, in extreme situations the overall difference between two calculations done by two different experts, using two different national methods, may easily amount up to 10 – 15 dB(A).
In Germany, Austria and Switzerland the so-called ‘Schienenbonus’, a reduction of 5 dB(A) of the outcome of the railroad noise calculation, is applied to account for the fact that, at same noise levels, the noise of trains causes less annoyance than the noise of cars or planes. In the Netherlands it is not accounted for in the noise levels, but in the noise standards, the
maximum allowed noise levels. Noise standards are (slightly) higher for noise from trains than for noise from cars. In the Netherlands, however, a ‘temporary’ reduction of the noise immissions by cars of 5 dB(A) on roads with a maximum speed below 70 km/h and 2 dB(A) on other roads is applied (art. 103, Wgh). This reduction is motivated by the expectation that cars will become less noisy in future.
2.3
EU-Noise policy on indices and calculation methods
In 2002, an important step to improve comparability of data and monitoring of noise levels throughout the EU was taken by the European Parliament (EC, 2002). In that year Directive
2002/49/EC was issued relating to the assessment and management of environmental noise. It aims amongst others to harmonize noise indices and noise calculation methods. The A-equivalent indices Lden and Lnight are the harmonized noise indices, to be used throughout
the EU-countries for all transport modes.
Member States are obliged to make noise maps for all agglomerations with more than 250 000 inhabitants and for all major roads (>6 million vehicle passages a year), railways (>60 000 train passages per year) and major airports. Furthermore, the directive proclaims the development of a common noise calculation model and designates for the time-being so-called interim methods (the French method for road-traffic noise, the Dutch method for railroad noise and the ECAC.CEAC method for noise of aircrafts). However, as long as national methods ‘do not differ too much from the interim-methods’, the national methods may still be used for noise assessments and for reporting to Brussels. Therefore, in near future, noise exposure assessments will most likely make use of the different national methods. EU-noise policy not only deals with harmonization of indices and calculation methods, but also with the setting (and periodically tightening) of emission limits on tyres, cars and (international) trains. The new EU directives do not provide specific standards, this is up to each member country. One action proposed by the EU is the production of noise maps including the number of people exposed to Lden - levels greater or equal to 55 dB(A). At
this level, a substantial number of people will still be annoyed.
2.4
Noise exposure
2.4.1 Noise exposure distribution in Europe
In few countries population exposure models have been developed for policy analysis, in which detailed source information at street, grid and city level is combined with data on demographics and dwellings in Geographic Information Systems. However, if such models are not available a more crude approach might be used, based on strong relations between the size of the city and the population exposure distribution. Roovers et al. proposed a simple modelling approach for the European scale that might be used as an example. Residential areas were classified into five categories of noisiness, based on both city size and regional characteristics, ranging from rural to extremely noisy. Regional characteristics involved factors such as latitude (southern cities tend to be noisier), traffic technology (engines, tyres) and densities, urban traffic infrastructure, and meteorological factors (ventilation behaviour) etc. Through analysis of existing data for a series of European cities a crude population exposure distribution for these categories was determined. Successively, these distributions were used to assess the traffic noise exposure for the European population (figure 2.2). Around 13% is exposed to levels above 65 dB(A) (Ldn, façade dwelling) (EEA, 1999; Roovers et
al., 2000). Noise levels distributions in the EU vary widely as shown in figure 2.3. These figures are nevertheless merely indicative, due to the present differences in methodologies in the member states.
Figure 2.2 Traffic noise exposure distribution in EU (Roovers et al., 2000).
Data on population exposure to aircraft noise in the EU data are scant and unreliable. For a more reliable assessment of population noise exposure distribution on a (supra)national scale, more data have to be collected on crude determinants of exposure, such as city size, traffic technology and density, meteorology, airport size and passenger volumes, urban planning in relation to measured noise levels (EEA, 2000).
Figure 2.3 The percentage of persons exposed to road traffic noise levels > 60 dB(A) (Lden) in different countries for different years (Sources: United Kingdom, the 1999/2000 UK National Noise Incidence Study; Austria: Federal Environment Agency, 2001; Germany: Umweltbundesambt, 1999; the Netherlands (NL): RIVM, 2003).
Exposure to high noise levels has decreased substantially in some countries due to technological measures (e.g. reduction of emissions, change of road surfaces) and spatial measures such as noise barriers and spatial separation of transport and residential functions. Nevertheless, noise will remain a major problem due to the enormous growth in traffic (especially road and air, e.g. figure 3.4) and the 24-hour economy. The OECD predicts an increase in motor vehicle kilometres of 40% in the next 20 years (OECD, 2001).
0 5 10 15 20 25 30 35
UK , 2000 Aus tria, 2001 Germ any, 1999 NL, 2001
C ountry % persons exposed t o Lden > 60 dB (A ) 0 10 20 30 40 50 60 70 80 < 55 55-65 65-75 > 75 Ldn (dB(A)) P e rc en ta ge expo s e d
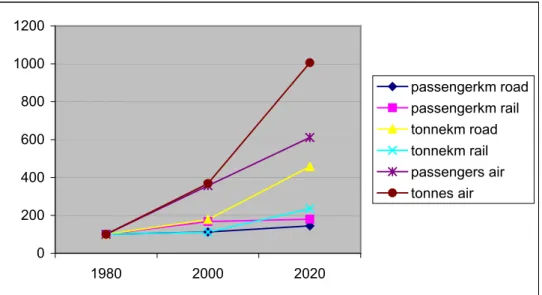
0 200 400 600 800 1000 1200 1980 2000 2020 passengerkm road passengerkm rail tonnekm road tonnekm rail passengers air tonnes air
Figure 2.4 Relative growth (1980 =100) of road, rail and air transport in the Netherlands (source: Feiman et al., 2000)
Freight transport is growing faster than passenger transport. Similar developments can be observed in the EU15, the only exception being freight transport by train, which declines in Europe by 0.6 percent per year (EEA, 2000). For Europe as a whole, EEA expects an ongoing shift towards road and air transport. Although the number of vehicles has risen drastically for all modes of transportation, the noise emission per vehicle has decreased during the last decades (this is especially the case for airplanes, less so for passenger cars or freight trains). As a result, noise levels due to air, road and railtraffic in e.g. the Netherlands have (in general) declined slightly in the recent past (RIVM, 2002). Nevertheless, noise levels are expected to rise again in the next decades, mainly due to the ongoing growth of traffic. The same trend is expected for the whole European region.
2.4.2 Noise exposure in the Netherlands
In the Netherlands, as in all European countries, noise from road traffic is the main source of noise exposure. Noise exposure is not equally distributed throughout the country, neither geographically nor socio-economically. The western part of the Netherlands (‘Randstad’) is the most densely populated area, where road, airport and railroad infrastructure is
concentrated. As a result, noise levels in the Randstad are higher than elsewhere in the country.
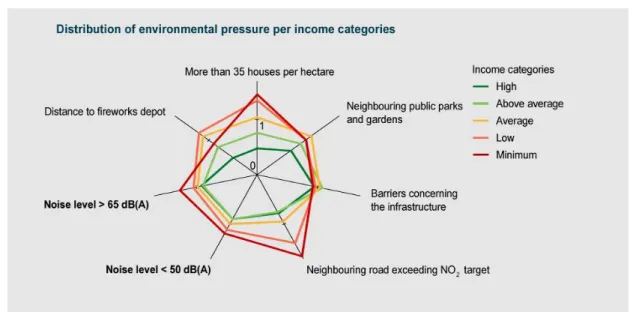
Low-income groups have to deal more than average with high noise exposure (above 65 dB(A)) and live less than average in quiet areas (below 50 dB(A)) (figure 2.5).
Figure 2.5 Distribution of environmental pressures (‘bads’) and ‘good’(green areas) per income category. Index 1 is the average of the total population, a value smaller than 1 is favourable (source: Bouwman et al., 2001).
2.4.3 Noise exposure of children
Traffic-noise exposure data on children are scarce and limited to a few field studies. In general, the world of the child is becoming noisier. Since the mid-fifties traffic volume has increased, causing higher day and night-time noise levels at home, school and during outdoor activities. Children are exposed to multiple sources of noise: in and outside school, during their recreational activities, when watching television, listening to the radio or loud music, either in a discotheque or when listening to a personal stereo (Francois and Vallet, 2001). In many households, nowadays, noisy toys are abundant and television or audio-equipment is turned on for the whole day (Passchier-Vermeer, 2000). Noise and acoustic problems are the second most common environmental problem at school (Holmberg and Lundquist, 2001). It has been estimated that school-age children may be routinely exposed to more noise than 24hrs equivalent sound level of 70 dB(A). In most European countries, the noise limits for schools are lower than for dwellings though (Gottlob, 1995; table 2.3).
Table 2.3 Recommended indoor noise level (Source: Francois and Vallet, 2001) Type of activity
Country Unit Year of
publication Classroom Library Music room Hall, corridor Canteen, gymnasium Room for childr. with hearing difficulties Germany LAeq / LAmax 1987 30-40 / 40-50 30-40/ 40-50 Belgium LAeq 1977/87 30-45a) 30-40 35-50 France LAeq 1995 38 33 43 Italy LAmax 1975 36 40 40 Portugal LAeq 2000 35 40-45 Former Czechoslo vakia LAeq 1977 45 55-60 UK LAeq, 1h 1997 40 40 30 50 30b) Sweden Leq 1995 30 35 40 Turkey Leq 1986 45 60
a) Maximum sound levels depend on the outdoor noise level for the zone. There are four categories of zone.
b) Maximum levels of background noise in all classrooms for children with hearing difficulties should be at least 10 dB lower than these values.
3.
Health effects of noise
In this section, the current state of the art with regard to the evidence on noise-related health risks is given, with a special focus on children. The strengths and weaknesses of previous studies are described as well as ongoing studies, which may provide new data and knowledge to be used in future assessments. In 3.1 an overview is given of the evidence on noise-related health risks in adults and children. There is sufficient evidence that noise causes annoyance and sleep disturbance in adults and has impacts on children’s learning. In addition, there is limited evidence for an association between noise exposure and cardiovascular impacts. These effects are described in more detail in the subsequent paragraphs. The strength of the available evidence, the influence of modifying or confounding factors, and (if available) exposure-response functions which can be used in future assessments are described.
3.1
Overview of reported noise effects on health and
well-being
Long-term exposure to noise has been associated with a wide range of effects on human health and well being. We can distinguish between social psychological responses, such as annoyance and sleep disturbance and disturbance of daily activities on the one hand, and physiological effects on the other, such as hearing impairment, hypertension and aggravation of cardiovascular symptoms. In addition, in children noise-related impacts on cognitive functioning have been observed.
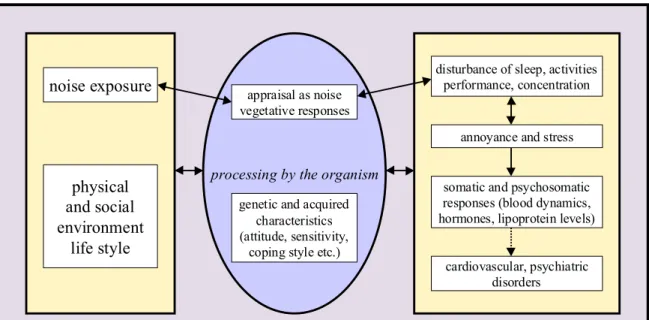
Stress may play an important role in the aggravation of health impacts. One of the many models available and depicting the possible mechanisms of noise-induced health effects and their interactions is presented in figure 3.1.
Figure 3.1 Conceptual model representing relation between noise exposure, health and quality of life (Source: HCN, 1999)
dynamic demographic, social, cultural, technological and economic environment noise exposure
physical and social environment
life style
processing by the organism
disturbance of sleep, activities performance, concentration
annoyance and stress appraisal as noise
vegetative responses
genetic and acquired characteristics (attitude, sensitivity,
coping style etc.)
somatic and psychosomatic responses (blood dynamics, hormones, lipoprotein levels)
cardiovascular, psychiatric disorders
It shows that noise may directly or indirectly (via disturbed activities) influence vegetative, hormone, or emotional regulation mechanisms. Various factors can modify the way in which the individual processes the noise signal. Examples of such factors are the attitude towards noise and noise sensitivity. The model in figure 3.1 is based on what is found in adults. About the underlying mechanisms of noise affecting children less is known. It is suggested that children might be more sensitive to noise than adults because of noise exposure during critical developmental periods (organ development of foetuses, babies, learning of children). In addition, they may have less possibilities of controlling the noise or a less developed coping repertoire as compared with adults (Stansfeld, 2003; Bistrup, 2003).
3.1.1 Evidence for noise-related health risks
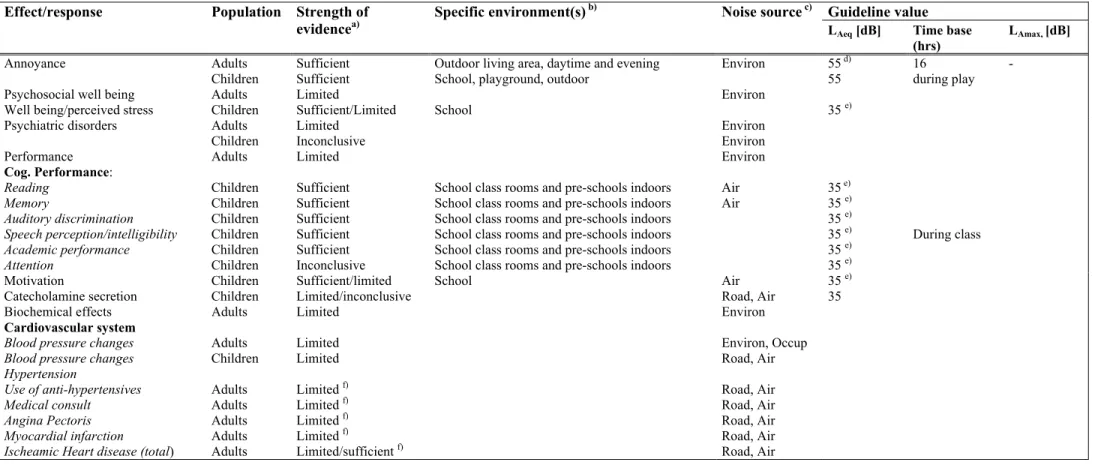
Table 3.1 gives an overview of the effects in both adults and children that have been reported in relation with noise exposure, rating the strength of evidence in terms of the categories proposed by the International Agency on the Research on Cancer IARC (sufficient, limited, inadequate and lacking) and the available guideline values. This overview is based on a large number of previous major scientific reviews (e.g. Health Council of the Netherlands (HCN), 1999; Passchier-Vermeer, 2000; Porter et al., 1998; Stansfeld et al., 2000) and WHO-guidelines (Berglund et al., 1999; WHO, 2002).
Adults
From these substantial reviews, it can be concluded that there is sufficient evidence for an association between noise-exposure and health risks such as hearing damage (although unlikely to occur at typical levels of community noise exposure), annoyance and sleep disturbance. The evidence for cardiovascular risk (e.g. increased rates of hypertension or ischaemic heart diseases) is more limited. Due to inconsistent results and inherent methodological shortcomings, no definite conclusion with respect to the causal role of environmental noise in mental health impacts can be drawn. A significant association between self-reported noise exposure and depression as well as cognitive failures was observed (Smith, 2001). Nevertheless, a number of studies applying psychometric questionnaires to assess psychological morbidity yielded inconsistent results (Stansfeld, 2000).
Children
There is sufficient evidence that noise exposure affects children’s learning (cognition), motivation and annoyance. It may also have impacts on the cardiovascular and endocrine system (table 3.1). Studies investigating impacts on mental health in children yielded inconsistent results. The possible effects of noise on cognitive functioning were studied the most frequently. There is no convincing evidence for a direct effect of noise exposure on congenital abnormalities, birth weight or disorders related to the immune system. The information available indicates that exposure to high occupational noise levels of the pregnant mother is associated with hearing impairment and growth retardation of the child (Passchier-Vermeer, 2000). A few studies show an increased risk of low birth-weight in children of aircraft-noise exposed mothers, but the influence of important confounders such as SES and smoking was not taking into account (Ando, 1973; Knipschild, 1981; Matsui, 2003).
The use of noisy toys as well as very loud noise during concerts, in discotheques and through headphones can be at the origin of development of tinnitus or hearing impairment among young people. It is estimated that 20% of young people across Europe are overexposed to
loud music and at immediate risk of hearing loss (WHO, 2003). Current levels of
environmental noise exposure in Europe do not have an effect on hearing threshold levels of children. The effects of recreational noise (walkmans, discotheques), although an important contributor to current prevalence of hearing loss in adolescents, are not further discussed here since the scope of this paper is transport-related noise exposure. Nevertheless, combined effects should not be excluded: recreational noise may make children and adolescents more vulnerable for the effects of traffic or occupational noise.
An overview of the noise-related health risks for which there is limited to sufficient evidence (annoyance, sleep disturbance, cardiovascular disease, cognition) will be presented in the following paragraphs. This overview is based on a number of recent reviews by national and international advisory committees and/or established scientists. The effects investigated in children are discussed in more detail, based on the results of recent field studies (see table 3.2), results will be explained in 3.2-5.
Table 3.1 Overview of reported responses to environmental noise exposure in children and adults and the available WHO guideline values (Source: Berglund, 1999; Babisch 2001; HCN, 1999; Hygge 2003; Van Kempen et al., 2002; Miedema, 2001; Passchier-Vermeer, 2000, 2003; Stansfeld, 2003).
Guideline value
Effect/response Population Strength of
evidencea) Specific environment(s)
b) Noise source c)
LAeq [dB] Time base
(hrs) LAmax, [dB]
Annoyance Adults
Children SufficientSufficient Outdoor living area, daytime and eveningSchool, playground, outdoor Environ 55
d)
55 16during play -Psychosocial well being
Well being/perceived stress AdultsChildren LimitedSufficient/Limited School Environ 35 e)
Psychiatric disorders Adults
Children LimitedInconclusive EnvironEnviron
Performance Adults Limited Environ
Cog. Performance: Reading Memory Auditory discrimination Speech perception/intelligibility Academic performance Attention Children Children Children Children Children Children Sufficient Sufficient Sufficient Sufficient Sufficient Inconclusive
School class rooms and pre-schools indoors School class rooms and pre-schools indoors School class rooms and pre-schools indoors School class rooms and pre-schools indoors School class rooms and pre-schools indoors School class rooms and pre-schools indoors
Air Air 35 e) 35 e) 35 e) 35 e) 35 e) 35 e) During class
Motivation Children Sufficient/limited School Air 35 e)
Catecholamine secretion Children Limited/inconclusive Road, Air 35
Biochemical effects Adults Limited Environ
Cardiovascular system
Blood pressure changes Blood pressure changes Hypertension
Use of anti-hypertensives Medical consult Angina Pectoris Myocardial infarction Ischeamic Heart disease (total)
Adults Children Adults Adults Adults Adults Adults Limited Limited Limited f) Limited f) Limited f) Limited f) Limited/sufficient f) Environ, Occup Road, Air Road, Air Road, Air Road, Air Road, Air Road, Air
Guideline value
Effect/response Population Strength of
evidencea) Specific environment(s)
b) Noise source c)
LAeq [dB] Time base
(hrs) LAmax, [dB] Effects on sleep g)
Changes in EEG parameters Awakenings
(onset of) motility Subjective sleep quality Heart rate
Mood next day Hormones Immune System Performance next day Sleep disturbance
Sleep disturbance, window open Sleep disturbance, inside
Adults Adults Adults Adults Adults Adults Adults Adults Adults Children Adults/childr en Sufficient Sufficient Sufficient Sufficient Sufficient Sufficient Limited Inadequate Limited Inconclusive Sleep Sleep Sleep Sleep Sleep Sleep Sleep Sleep Sleep Inside bedroom Outside bedrooms Air 30 45 30 8 8 8 45 60 60 Hearing impairment g) Sufficient Industrial, commercial, shopping and traffic areas,
indoors and outdoors
Public addresses, indoors and addresses
Ceremonies, festivals and entertainment events (< 5 times /year)
Music through headphones/earphones
Impulse sounds from toys, fireworks and fire arms
70 85 100 85 24 1 4 1 110 110 110 110 120-140
Birth weight Children Inadequate Environ, air
Immune effects Children Inadequate Environ
a) Classification of evidence of causal relationship between noise exposure and health endpoint; b) Sleep = during sleeping time, school = exposure of children at school;
c) Environ = environmental exposure, road = road traffic noise, air=aircraft noise; d) This is the guideline value for serious annoyance;
e) To prevent disturbance of information extraction; f) Based on the results of Van Kempen et al., 2002;
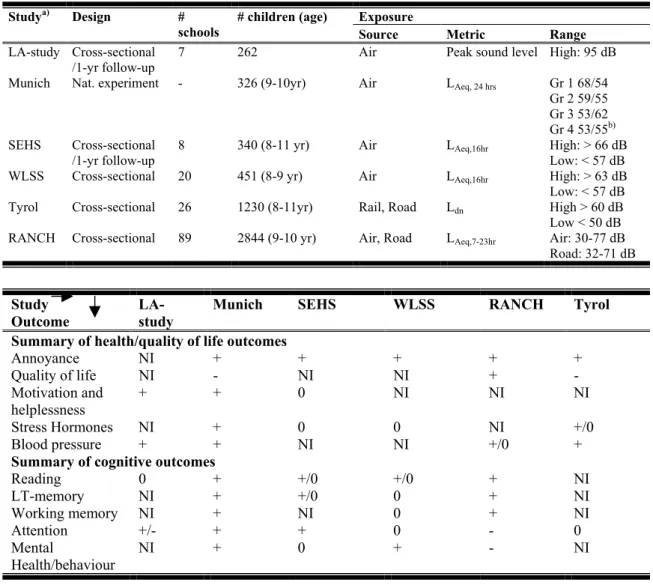
Table 3.2 Summary of health outcomes observed in recent field studies in children (from: Matheson, 2003, Van Kempen, 2003), references in table (+ = positive association observed, 0 = no association observed, - = negative association, NI = not investigated)
Exposure Studya) Design #
schools
# children (age)
Source Metric Range
LA-study Cross-sectional /1-yr follow-up
7 262 Air Peak sound level High: 95 dB
Munich Nat. experiment - 326 (9-10yr) Air LAeq, 24 hrs Gr 1 68/54
Gr 2 59/55 Gr 3 53/62 Gr 4 53/55b) SEHS Cross-sectional
/1-yr follow-up
8 340 (8-11 yr) Air LAeq,16hr High: > 66 dB
Low: < 57 dB
WLSS Cross-sectional 20 451 (8-9 yr) Air LAeq,16hr High: > 63 dB
Low: < 57 dB Tyrol Cross-sectional 26 1230 (8-11yr) Rail, Road Ldn High > 60 dB Low < 50 dB RANCH Cross-sectional 89 2844 (9-10 yr) Air, Road LAeq,7-23hr Air: 30-77 dB
Road: 32-71 dB
Study
Outcome LA-study Munich SEHS WLSS RANCH Tyrol
Summary of health/quality of life outcomes
Annoyance NI + + + + + Quality of life NI - NI NI + -Motivation and helplessness + + 0 NI NI NI Stress Hormones NI + 0 0 NI +/0 Blood pressure + + NI NI +/0 +
Summary of cognitive outcomes
Reading 0 + +/0 +/0 + NI LT-memory NI + +/0 0 + NI Working memory NI + NI 0 + NI Attention +/- + + 0 - 0 Mental Health/behaviour NI + 0 + - NI
a) LA-study: Los Angeles Airport study (Cohen et al., 1980; Cohen et al., 1981). Munich: The Munich Airport Study (Evans et al., 1995; Evans et al., 1998; Hygge et al., 2002). SEHS: Schools Environment and Health Study: Haines et al., 2001ab); WLSS: The West London Schools Study: Haines et al.) Tyrol: The Tyrol Study: Lercher et al., 2002; RANCH: Stansfeld 2003, www.RANCHproject.org
b) Gr 1: noise levels of group old airport-aircraft noise before/after airport switch; Gr 2 noise levels of group old airport-no aircraft noise; Gr 3 noise levels of group new airport-aircraft noise; Gr 4 noise levels of new airport-no aircraft noise.
3.2
Annoyance
Annoyance can be defined as ‘A feeling of displeasure associated with any agent or
condition, known or believed by an individual or group to adversely affect them’ or ‘a feeling of resentment, displeasure, discomfort, dissatisfaction or offence which occurs when noise interferes with someone’s thoughts, feelings or daily activities’. The degree of annoyance caused by noise exposure depends on several characteristics, such as sound level, spectral characteristics and varies with time of the day or season. During the night and late evening noise is more annoying because quietness is expected. Based on the results of surveys it has been observed that noise exposure explains about 25-30% of the observed variance in
annoyance. Non-acoustical factors also play a major role (Job, 1999; Stallen, 1999; Guski, 1999). Examples of non-acoustical factors are individual noise sensitivity, fear with respect to the source, attitude towards the source, perceived control over the situation, perceived
economic or societal advantages of noise generating activity. Several reviews show that anxiety (fear of the noise source) and noise sensitivity are the most important non-acoustical factors of influence on exposure-response relationships (Fields, 1993; Guski, 1999; Job, 1999; Stallen, 1999; Miedema and Vos, 1999). According to Guski factors with a social character (appraisal of a noise source, trust (in those responsible for noise and noise
abatement), history of noise exposure) are important because they apply for whole groups of the population and can be used to reduce noise annoyance.
3.2.1 Adults
Noise annoyance is always assessed on the level of populations using questionnaires. Recently, efforts have been made by the International Commission on Biological Effects of Noise (ICBEN) and the International Organization of Standardization (ISO) towards the use of standardized questions asking for the degree of annoyance in a 0-10 or 100 scale. To determine the percentage of people annoyed and highly annoyed, a cut-off value of 50 and 72 is being used. Road traffic noise, neighbour noise and aircraft noise usually are the most common sources of annoyance in Europe (figure 3.2).
F
Figure 3.2 Percentage of the population highly annoyed by noise in the Netherlands and Germany (Source: RIVM, 2002; UBA, 2003). Comparable questions were used.
3.2.2 Children
Only a few field studies are known in which residential noise annoyance of children is measured in a systematic and quantitative manner (table 3.2). Most studies focus on aircraft noise. No source-specific exposure-response curves are available as yet. According to Lercher (2003) this is due to a lack of standard methodology to measure annoyance in
children, the use of different noise indices as well as insufficient representative data to draw a generalised curve from.
In the Munich studies (table 3.2) an increase in annoyance in children living near the new airport was observed during the measurement period (three waves) while the mean annoyance in the children living near to the closed airport dropped from a high to a low score at wave three. A child-adapted questionnaire with 21 Likert-scaled items was used, covering different degrees of noise perception, air quality and residential qualities (green space, playgrounds etc) (Bullinger, 1998/99).
In an experimental study within the Tyrol studies (table 3.2) children were asked to assess the annoyance of road and railway noise sounds presented via headphones by using a Visual
Population annoyed by noise in the Netherlands
0 10 20 30 40 50 60 70 80 total road traff ic neigh bour s air tr affic indus try enter tainm ent railw ay tr affic %
of population highly annoyed
1993 1998
Population annoyed by noise in Germany
0 10 20 30 40 50 60 70 80
road traffic neighbours air traffic industry railway traffic
% of
populat
ion highly annoyed
1996 1998 2000 2002
Analogous Scale. Children from the quiet area (n = 63, LEq8hr < 40 dB(A)) had consistently
higher annoyance scores for both highway and railway noise than children from the noise-exposed group (LEq,8-night > 50 dB(A)). For both groups an increase in annoyance ratings with
(laboratory) noise levels was observed. Rail noise was rated more annoying at 60 dB(A) and 70 dB(A), but equally annoying as motorway noise at 50 and 80 dB(A) (Sukowski, 2000). A survey among 530 13-15 year old children in Germany (using the same questionnaire as in the Munich study) also showed that children report lower mean annoyance levels than their mothers. The highest mean annoyance ratings were observed in the aircraft exposed rural areas while road traffic noise annoyance ratings equalled those of air pollution or odour annoyance (Bullinger et al., 1997).
Focus group discussions in a small international (n=36) sample indicate that the interviewed children were most affected by neighbours noise and road traffic noise (Millenium
Conference Study, Haines 2003). This is comparable with the results of community surveys in adults. The children rated water pollution as the most damaging source of pollution, followed by air and lastly noise: ‘It depends where you are though. Long term it’s water pollution and air pollution, but walking down the street it’s noise pollution that affects you more.’
Analysis of a small sample (n=18) of the West London School Study showed that the impact of noise exposure on everyday activities (eg schoolwork, homework, playing) was larger for the children exposed to high levels of aircraft noise (Leq 16 hr > 63 dB(A)) compared with the low noise exposed children (<57 dB(A)) and focus group samples. The sample of children exposed to aircraft noise expressed high annoyance levels, with responses consistent with those in adults (irritation, fear, anger). In both studies when asked, children selected their bedrooms and green areas in their neighbourhoods as places to find some respite from noise pollution (Haines, 2003). The sample sizes of both studies are too small though to derive a more definite conclusion on coping strategies in children.
Preliminary findings of the three field surveys in the RANCH study show positive
associations between aircraft and road traffic noise exposure and annoyance reported by the children (Van Kamp, 2003). Annoyance was measured using a for adults standardised general purpose noise reaction question with a 5-point verbal scale ranging from not at all annoyed to extremely much. The use of these questions enables a comparison with previous studies as well as with parents and teachers ratings. For both parents and teachers steeper exposure-response curves were observed than for children (Van Kamp et al, 2003). Analysis of a small subsample of the RANCH-study shows that children with high psychological restoration scores have low annoyance scores, suggesting that psychological restoration may protect against annoyance. ‘Psychological restoration’ is children’s capability to appreciate
restorative environments by creating feelings of pleasantness and tranquillity (Gunnarsson et al., 2003). Also, children seem to have different ways than adults to avoid the noise e.g. children more frequently raised the volume of radio/walkman (Öhrström et al., 2003). All four field studies showed that children are annoyed by long-term noise exposure. The emotional response of children to noise exposure seems to be consistent with adult reactions.
3.2.3 Available exposure-response relationships for annoyance
Based on a pooled analysis of original datasets from noise-annoyance surveys carried out in Europe, Australia, Japan and North-America, exposure response relationships have been derived for road, rail and air traffic noise (Miedema and Oudshoorn, 2001). These can be used to predict the number of (highly) annoyed people in an exposed population (eg. figure 3.3, table 7.1). Based on this pooled analysis, aircraft noise appears to be the most annoying noise source, followed by highway traffic noise, traffic noise from other roads and railway noise. The curves derived by Miedema and Oudshoorn are recommended for use in the EU
Directive on Noise (EU position paper, 2002). Although these curves have been derived from probably the most elaborate database currently available, methodological differences in the original studies (e.g. poor exposure assessment, differences in adequacy noise insulation) may have influenced the observed relationships (Finegold, 2002; Fidell, 2003). Some of the surveys included in the analysis are rather outdated. According to TNO, recent analyses (not published yet) do not reveal any systematic changes of the exposure-response relationships over the time span covered by the data sets used.
Figure 3.3 The percentage highly annoyed as a function of the noise exposure of the dwelling (Lden)(Miedema an Oudshoorn, 2001).
Applications and limitations
According to the position paper the exposure-response functions are only to be used for aircraft, road traffic, and railway noise and for assessment of long-term stable situations (EU, 2002). They can be utilised for strategic assessments, in order to estimate the effects of noise on populations in terms of annoyance. They are not applicable to local, complaint-type situations, or to the assessment of the short-term effects of a change of noise climate. The curves have been derived for adults. The curves are not recommended for specific sources such as helicopters, military low-flying aircraft, train shunting noise, shipping noise or aircraft noise on the ground [taxi-ing] (EU, 2002).
Re-analysis of the existing database may be considered. An important elaboration of the relationships would be the inclusion of more (exposure) variables as predictors of annoyance (in addition to Lden), e.g. sound insulation or the presence of a relatively quiet side of the
dwelling (Miedema and Oudshoorn, 2001). There is also a need for quantifying the influence of noise sensitivity on annoyance. Since actual annoyance levels differ between Northern and Southern EU member states (due to e.g. window behaviour, cultural differences), the