Report 350023001/2010
F. L. Büchner | M. Jansen-van der Vliet | C. T.M. van Rossum
Copper intake in young children
RIVM letter report 350023001/2010
Copper intake in young children
Dutch National Food Consumption Survey-Young Children
Frederike L Büchner
Martine Jansen - van der Vliet Caroline T M van Rossum
Contact:
Caroline van Rossum CVG
caroline.van.rossum@rivm.nl
This investigation has been performed by order and for the account of Ministry of Health, Welfare and Sport, within the framework of Kennisvraag V350023/09/EA
© RIVM 2010
Parts of this publication may be reproduced, provided acknowledgement is given to the 'National Institute for Public Health and the Environment', along with the title and year of publication.
Abstract
Copper intake in young children
Dutch National Food Consumption Survey-Young Children
The copper intake in young children, as reported previously in the RIVM report ‘Dutch National Food Consumption Survey – Young Children 2005/2006’, was overestimated. Too high copper values of some chocolate products explain the overestimation.
Based on newly available analyses, we conclude that copper values of chocolate sandwich fillings were previously largely overestimated. Based on the new copper values, the intake of copper for children aged 4 to 6 years is not above the tolerable upper intake level (UL). Only a small percentage of children aged 2 to 3 year had an intake of copper above the UL (9% of the boys and 7% of the girls). This is considerably lower compared to the previous calculations (48% of the boys and 37% of the girls). These findings emphasize the need for up-to-date and high quality data for the Dutch Food Composition Database (NEVO).
Rapport in het kort
Koperinname bij jonge kinderenVoedselconsumptiepeiling jonge kinderen 2005/2006
De koperinname bij peuters en kleuters, zoals gerapporteerd in het RIVM rapport ‘Dutch National Food Consumption Survey – Young Children 2005/2006’, was overschat. Hoge koperwaardes van bepaalde chocoladeproducten verklaren deze hoge inschatting.
Op basis van nieuw beschikbare analyses, concluderen wij dat de koperwaardes van chocolade-broodbeleg tot op heden erg overschat waren. Gebaseerd op de nieuwe koperwaardes is de koperinname van kinderen tussen de 4 en 6 jaar niet langer boven de maximaal aanvaardbare bovengrens van inneming. Nog maar een klein percentage van de kinderen tussen de 2 en 3 jaar heeft nog een koperinname boven de maximaal aanvaardbare bovengrens van inneming (9% van de jongens en 7% van de meisjes). Deze percentages zijn aanzienlijk lager vergeleken met de vorige berekeningen van de koperinname (48% van de jongens en 37% van de meisjes).
Deze resultaten benadrukken de noodzaak voor actuele en betrouwbare gegevens voor het Nederlands Voedingsstoffenbestand (NEVO).
Trefwoorden: koper, peuters, kleuters, koperinname, voedselconsumptiepeiling
Contents
List of abbreviations 6
1 Introduction 7
2 Copper values in Dutch Food Composition Database 9
2.1 Dutch Food Composition Database 9
2.2 Evaluation of copper values 9
2.3 Updated copper values 10
3 Copper intake in young children 11
3.1 Dutch National Consumption Survey – Young Children 11
3.2 Calculation copper intake 12
3.3 Habitual copper intake for young children 12
4 Conclusion 15
List of abbreviations
DNFCS Dutch National Food Consumption Survey
NEVO Dutch Food Composition Database (‘Nederlands Voedingsstoffenbestand’) UL Tolerable Upper Intake Level
AI Adequate intake
1
Introduction
Copper is an essential nutrient for humans. It is involved in the function of several enzymes. Results of animal and human studies have shown that this trace element is required for normal infant growth, host defence mechanisms, bone strength, red and white cell maturation, iron transport, and brain development.1 It functions as a co-factor in various enzymes and in copper-based pigments. It is found widely in tissues, with higher concentrations in liver, muscle, and bone.2
Copper intake from diet origins mainly from organ meat, sea fish, crustaceans and shellfish, nuts, cereal products, vegetables, fruits and cocoa products. In 1992 an EU population reference intake of 1.1 mg/day for adults was established. Insufficient data exits to set lower reference nutrient intakes and estimated average requirements for different age groups and sexes. If excesses of copper are ingested, effective homeostatic controls are in place to reduce absorption and increase excretion. For adults a tolerable upper intake level (UL) of 5 mg/day is derived, based on available evidence. Extrapolating adult UL values for children based on relative body weight results in an UL of 1 mg/day for children aged 1 to 3 years and 2 mg/day for children aged 4 to 6 years.2
Last year, the RIVM report ‘Dutch National Food Consumption Survey – Young Children 2005/2006’ reported the copper intake for Dutch young children.3 The report showed high intakes of copper. 43% and 31% of the 2 to 3 old boys and girls had levels above the UL, respectively. For the 4 to 6 year-old children less than 1% had habitual copper intakes above the UL. Based on the reported copper intakes, it was concluded that the implications of these high reported copper intakes should be investigated. In this study 31% of the copper was contributed by sugar and confectionery.
Also the Dutch Health Council (‘Gezondheidsraad’) stated in their report on vitamins and minerals4 that the high intake of copper among these young children might be explained by the high levels of copper in some chocolate products. They recommended that after new chemical analyses of these products became available, the intake of copper among young children should be reconsidered.
In this report we describe the new chemical analyses of these chocolate products and reconsider the intake of copper for young children in the DNFCS study.
2
Copper values in Dutch Food Composition Database
2.1
Dutch Food Composition Database
The Dutch Food Composition Database (NEVO) contains data on the nutritional composition of foods. These are food products and dishes consumed regularly by a large proportion of the Dutch population and are thus considered to be major sources of energy and nutrients. NEVO is owned by the Ministry of Health, Welfare and Sport and managed and maintained by the RIVM. NEVO is part of NethFIR (Netherlands Food Information Resource), a database containing nutritional information (nutrients, allergens, and features like sustainability and portion size) concerning brand foods and generic foods. NethFIR is managed by both the RIVM and the Netherlands Nutrition Centre.5
Preferably nutrient data in NEVO originate from analyses conducted in Dutch laboratories. Other data sources include scientific publications, foreign food composition tables, derived nutrients from comparable foods, calculations from recipes and estimations. Also nutrient values of brand foods, for example supplied by manufacturers to the Netherlands Nutrition Centre, make up the nutrient composition of some of the generic foods for NEVO. NEVO provides data on the nutritional composition of food items expressed in 100 grams edible portion, such as meat without bones. For some foods a different unit is used, e.g. 100 ml.5
2.2
Evaluation of copper values
As discussed in the first chapter of this report, the copper values of some chocolate products in NEVO 2006 were rather high. It was therefore decided to re-evaluate the copper values of these products. In 2008, the National Institute for Public Health and the Environment (RIVM) performed a study to update the most relevant nutrient values of 149 selected food items within NEVO. Three of these food items were sweet sandwich fillers: chocolate confetti plain and milk and chocolate hazelnut spread. Per food item four different brands where bought, for each brand two batches, resulting in 8 samples per sandwich filler. Of these 8 samples a composite sample was made for analysis. The copper analysis was performed by SGS Nederland B.V. in 2008, by using Inductively Coupled Plasma Mass
2.3
Updated copper values
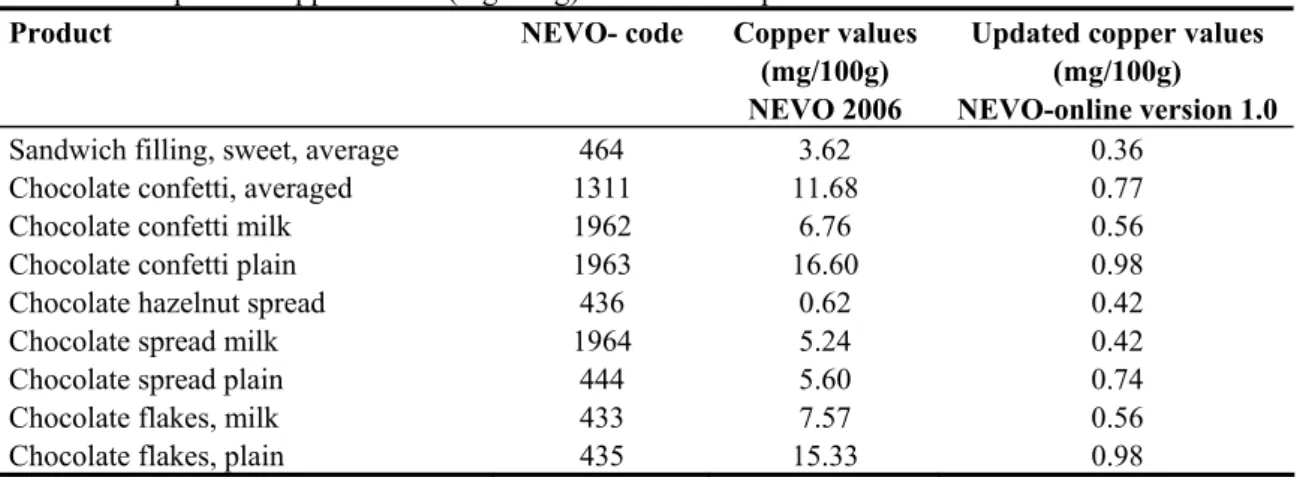
For three products (chocolate confetti milk (1962), chocolate confetti plain (1963) and chocolate hazelnut spread (436)) new copper values were derived from the performed analyses. For three other products (chocolate spread milk (1964), chocolate flakes milk (433) and chocolate flakes plain (435)) copper concentrations were assumed identical to the newly analysed products (436, 1962 and 1963 respectively). Average sweet sandwich filling (464) and average chocolate confetti (1311) were calculated by prescription calculations. The copper concentration of plain chocolate spread (444) was based on chocolate hazelnut spread, but taking into account the higher level of copper in plain chocolate products, as chocolate hazelnut spread is based on milk chocolate. This resulted in a concentration of 1.75 times 0.42 = 0.74 mg copper/100g. The main changes in copper concentrations are given in table 2.1.
Table 2.1: Updated copper values (mg/100g) for chocolate products in NEVO
Product NEVO- code Copper values (mg/100g)
NEVO 2006
Updated copper values (mg/100g) NEVO-online version 1.0
Sandwich filling, sweet, average 464 3.62 0.36 Chocolate confetti, averaged 1311 11.68 0.77 Chocolate confetti milk 1962 6.76 0.56 Chocolate confetti plain 1963 16.60 0.98 Chocolate hazelnut spread 436 0.62 0.42 Chocolate spread milk 1964 5.24 0.42 Chocolate spread plain 444 5.60 0.74 Chocolate flakes, milk 433 7.57 0.56 Chocolate flakes, plain 435 15.33 0.98
The copper values of most of the newly analysed products lowered by a factor of ten or more. The consequences for the calculations of habitual copper intake by young children aged 2 to 6 years old are discussed in the next chapter.
3
Copper intake in young children
3.1
Dutch National Consumption Survey – Young Children
The general methodology of the Dutch National Food Consumption Survey (DNFCS)-Young Children 2005/2006 is described in detail elsewhere.3 Briefly, the aim of the survey was to gain insight in the diet of Dutch children aged 2 to 6 years. In total 1,279 children fully completed the survey. Sampling of the children was stratified by age and gender to obtain at least 300 children in each of four age-gender strata: 2 to 3 year old boys, 2 to 3 year old girls, 4 to 6 year old boys and 4 to 6 year old girls. To optimize representativeness of the study population, the sample was monitored and sampling was adjusted, if necessary, during the recruitment phase according to age, gender, education of the head of the household, level of urbanization, place of residence, and region. The final study population was representative regarding socio-economic and demographic characteristics.
Food consumption data were collected in the period October 2005 to November 2006. Data were collected by means of a written general questionnaire, weight and height measurements and subsequently through two one-day food records. The general questionnaire contained questions related to demographic factors and lifestyle habits, like daily activities and some questions related to eating habits like the consumption frequency of certain specific foods, use of dietary supplements, the purchase of organic foods, and the volume of cups and glasses used habitually by the child.
The food records were filled out by the carer of the child and returned to the market research agency by regular mail. The carer recorded in pre-structured diaries all foods and drinks the child had consumed on two non-consecutive days (separated by about 8 to 13 days). In the whole study population, all days of the week were equally represented. The diaries were structured according to food consumption occasion (breakfast, lunch dinner and three in-between meals). For each food, the carer was asked to indicate characteristics such as fat content, sugar content, flavour, brand name, form of the food and preparation method. All data from the diaries were entered into the EPIC-Soft computer program by specifically trained dieticians. The EPIC-Soft program was developed to process food consumption
3.2
Calculation copper intake
First the products containing copper are identified from the NEVO. The habitual consumption of these products is distracted from the DNFCS.
For the habitual intake of micro-nutrients two analyses were performed; the intake of micronutrients from food and the total intake from both food and dietary supplements. First, the observed consumption of the different products is then multiplied by the concentration of copper found in these specific products and summed for each child. Then the habitual intake was estimated in order to evaluate the proportion of subjects adhering to the dietary recommendations. The habitual intake distribution was obtained from the measured intake by eliminating the intra-individual (=day-to-day) variation with the method developed by Nusser,9 using IML SIDE software.
3.3
Habitual copper intake for young children
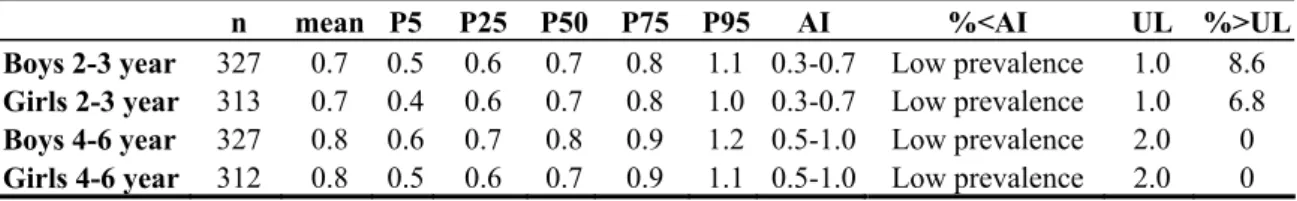
With the new copper values, the habitual intake of copper by 2 to 6 year-old children could be recalculated. The mean habitual copper intake decreased from 1.1 mg to 0.7 mg (see table 3.1). The percentage of children with a copper intake derived from food and supplements, above the upper level also decreased from 48% in 2 to 3 year-old boys and 37% in 2 to 3 year-old girls to 9% and 7% respectively (see table 3.2). Based on the updated copper values, none of the 4 to 6 year-old children have a habitual copper intake above the upper level anymore.
Table 3.1: Distribution of habitual copper intake (mg) from food and their assessment for Dutch boys and
girls aged 2 to 6 years (DNFCS-young children 2005/2006), weighted for socio-demographic factors and season
N mean P5 P25 P50 P75 P95 AI %<AI UL %>UL Boys 2-3 year 327 0.7 0.5 0.6 0.7 0.8 0.9 0.3-0.7 Low prevalence 1.0 1.5
Girls 2-3 year 313 0.7 0.5 0.6 0.7 0.7 0.9 0.3-0.7 Low prevalence 1.0 0.7
Boys 4-6 year 327 0.8 0.6 0.7 0.8 0.9 1.1 0.5-1.0 Low prevalence 2.0 0
Girls 4-6 year 312 0.7 0.5 0.6 0.7 0.8 1.0 0.5-1.0 Low prevalence 2.0 0
Table 3.2: Distribution of habitual copper intake (mg) from food and dietary supplements and their
assessments for Dutch boys and girls aged 2 to 6 years (DNFCS-young children 2005/2006), weighted for socio-demographic factors and season
n mean P5 P25 P50 P75 P95 AI %<AI UL %>UL Boys 2-3 year 327 0.7 0.5 0.6 0.7 0.8 1.1 0.3-0.7 Low prevalence 1.0 8.6
Girls 2-3 year 313 0.7 0.4 0.6 0.7 0.8 1.0 0.3-0.7 Low prevalence 1.0 6.8
Boys 4-6 year 327 0.8 0.6 0.7 0.8 0.9 1.2 0.5-1.0 Low prevalence 2.0 0
Girls 4-6 year 312 0.8 0.5 0.6 0.7 0.9 1.1 0.5-1.0 Low prevalence 2.0 0
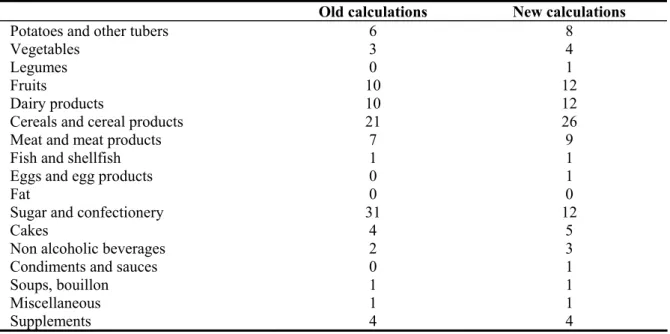
Also the main sources of copper changed. Based on the old values of copper the food group ‘sugar and confectionery’ contributed for 31% of the copper intake. Now this is only 12% (see table 3.3). Also the main food occasions were changed. As chocolate sandwich fillings are mainly consumed during breakfast and lunch, these occasions became less important (see table 3.4).
Table 3.3 Average contribution of food groups* (%) to the intake of copper for 2 to 6-year-old Dutch
children (DNFCS-Young Children 2005/2006), weighted for socio-demographic factors and season.
Old calculations New calculations
Potatoes and other tubers 6 8
Vegetables 3 4
Legumes 0 1
Fruits 10 12
Dairy products 10 12
Cereals and cereal products 21 26
Meat and meat products 7 9
Fish and shellfish 1 1
Eggs and egg products 0 1
Fat 0 0
Sugar and confectionery 31 12
Cakes 4 5
Non alcoholic beverages 2 3
Condiments and sauces 0 1
Soups, bouillon 1 1
Miscellaneous 1 1
Supplements 4 4
Table 3.4: Average contribution (%) of food consumption occasions to total copper intake of Dutch children
aged 2 to 6 years (DNFCS-Young Children 2005/2006), weighted for socio-demographic factors and season.
Breakfast Lunch Dinner Other
Mean % Mean % Mean % Mean %
Old calculations 30 29 23 19
4
Conclusion
Based on newly available analyses, we conclude that copper values of chocolate sandwich fillings were until now previously largely. This explains the high intake op copper among young children as reported in ‘Dutch National Food Consumption Survey – Young Children 2005/2006’.3 Based on newly available values, the intake of copper for children aged 4 to 6 years is not above the tolerable upper intake level (UL). Only a small percentage of children aged 2-3 year had an intake of copper above the UL (9% of the boys and 7% of the girls). This is considerably lower compared to the previous calculations (48% of the boys and 37% of the girls).
These findings emphasize the need for up-to-date and high quality data for the Dutch Food Composition Database (NEVO).
References
1. Olivares M, Pizarro F, Speisky H, Lonnerdal B, Uauy R. Copper in infant nutrition: safety of World Health Organization provisional guideline value for copper content of drinking water. J Pediatr Gastroenterol Nutr 1998; 26(3):251-7.
2. European Food Safety Authority (EFSA). Tolerable upper intake levels for vitamins and minerals. Parma: EFSA, 2006.
3. Ocke MC, Rossum CTM van, Fransen HP et al. Dutch National Food Consumption Survey Young Children 2005/2006 . Bilthoven: RIVM, 2008; RIVM report 350070001.
4. Health Council of the Netherlands. Towards an adequate intake of vitamins and minerals. The Hague: Health Council of the Netherlands, 2009; publication no. 2009/06.
5. RIVM. Dutch Food Composition Database [http://www.rivm.nl/nevo_en] [Web Page]. (Accessed November 2009).
6. SGS Nederland B.V. Analyse diverse producten ten behoeve van NEVO. RIVM/NEVO Internal report 1-35-321, 2009.
7. Slimani N, Ferrari P, Ocke M et al. Standardization of the 24-hour diet recall calibration method used in the european prospective investigation into cancer and nutrition (EPIC): general concepts and preliminary results. Eur J Clin Nutr 2000; 54(12):900-17.
8. Ocke MC, Hulshof KFAM, Buurma-Rethans EJM et al. National food consumption survey 2003. Summary of procedures and evaluation. (in Dutch). Bilthoven: RIVM, 2004; RIVM report 350030003.
9. Nusser SM, Carriquiry AL, Dodd KW, Fuller WA. A semiparametric transformation approach to estimating usual daily intake distributions. J Am Stat Assoc 1996; 91:1440-9.