Key Messages from the 2002 Dutch Public Health
Status and Forecasts Report
J.A.M. van Oers (editor in chief)
Centre for Public Health Forecasting
National Institute for Public Health and the Environment
PO Box 1, 3720 BA Bilthoven, The Netherlands
A publication by
The National Institute for Public Health and the Environment
PO Box 1
3720 BA Bilthoven,
The Netherlands
All rights reserved
© 2002, National Institute for Public Health and the Environment, Bilthoven, The
Netherlands
The greatest care has been devoted to the accuracy of this publication. Nevertheless, the
editors, authors and the publisher accept no liability for incorrectness or incompleteness
of the information contained herein. They would welcome any suggestions concerning
improvements to the information contained herein.
All rights reserved. No part of this publication may be reproduced, stored in an
automat-ed database or made public in any form or by any means whatsoever, whether
electron-ic, mechanical, using photocopies, recordings or any other means, without the prior
written permission of the National Institute for Public Health and the Environment and
that of the publisher. Inasmuch as the production of copies of this publication is
permit-ted on the basis of article 16b, 1912 Copyright Act in conjunction with the Decree of 20
June 1974, Bulletin of Acts, Orders and Decrees 351, as amended by the Decree of 23
August 1985, Bulletin of Acts, Orders and Decrees 471, and article 17, 1912 Copyright
Act, the appropriate statutory fees should be paid to the Stichting Reprorecht
(Publish-ing Rights Organization), PO Box 882, 1180 AW Amstelveen, The Netherlands. Those
wishing to incorporate parts of this publication in anthologies, readers and other
compi-lations (article 16, 1912 Copyright Act) should contact the publisher.
KEY MESSAGES
This brochure presents the key messages of the Dutch 2002 PHSF report (Health on
Course?). The Health on Course? report presents new data and insights about public
health, care and prevention in the Netherlands. It simultaneously examines the past,
pre-sent and future, and draws comparisons both at home and abroad. These insights may
support the Ministry of Health, Welfare and Sport in the development of a medium and
long-term vision for health and care. This information is also important for other players
in the Netherlands: the public health inspectorate, local government councils, other
min-istries, patients and consumers, prevention and healthcare providers, health insurers,
and health research and research programming organizations. Here we present the major
findings and dilemmas, along with their significance for the parties involved.
Major findings
We in the Netherlands are living and staying healthy for longer
Since 1980, male life expectancy has increased by 3.1 years while female life
expectan-cy has grown by 1.4 years. From birth, we can now expect an average life span of,
respectively, 75.5 and 80.6 years. The years that have been added over the last decade
are generally spent in good health. Statistics Netherlands predicts that life expectancy
will increase even more over the next 20 years.
• This increase is mainly due to fewer deaths from coronary heart disease and stroke. In
addition, fewer men are dying of lung cancer.
• The major cause of death is still coronary heart disease. Along with mental ill health
and chronic lung diseases, this disorder also causes the greatest loss of quality of life.
• Around the year 2000, both men and women experienced roughly the same number of
healthy years: 61 years are spent in self perceived good health, more than 70 without disabilities, and 68 in good mental health. Consequently, the number of subsequent unhealthy years is considerably higher for women than for men.
• Considering that neither the incidence nor the duration of chronic disorders has
decre-ased, certain healthcare provisions, such as medical devices and pharmaceuticals, seem to have effectively improved the social participation of the chronically ill.
Yet the Netherlands drops toward the European average
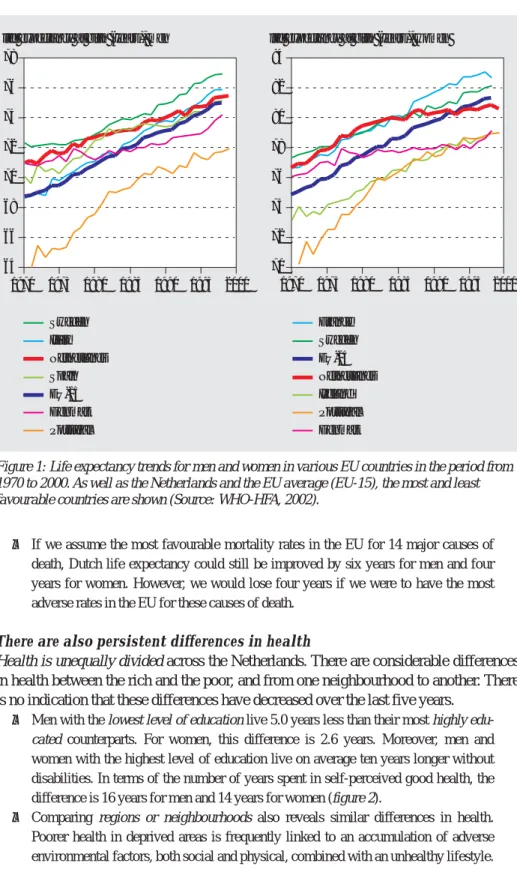
However, the Netherlands is falling behind in the EU. Male life expectancy is increasing
less rapidly than in most EU countries. The increase in the life expectancy of women is
actually stagnating to such an extent that we are now below the EU average (figure 1).
• Male mortality from lung cancer is still one of the highest in the EU. Female mortality
is increasing more rapidly than the European average. Ever more women are also dying from chronic lung diseases (COPD). Smoking is the main cause of both lung cancer and COPD.
• The Netherlands has comparatively high infant and perinatal mortality rates. This also
• If we assume the most favourable mortality rates in the EU for 14 major causes of death, Dutch life expectancy could still be improved by six years for men and four years for women. However, we would lose four years if we were to have the most adverse rates in the EU for these causes of death.
There are also persistent differences in health
Health is unequally divided across the Netherlands. There are considerable differences
in health between the rich and the poor, and from one neighbourhood to another. There
is no indication that these differences have decreased over the last five years.
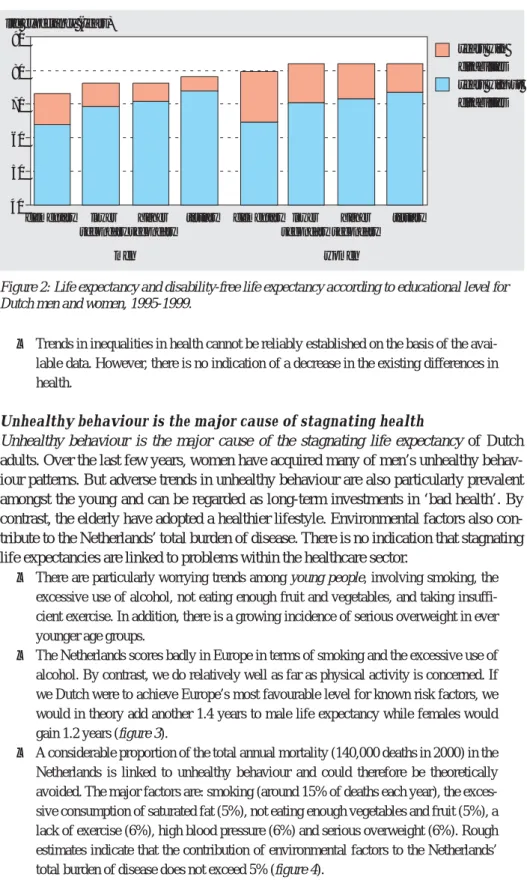
• Men with the lowest level of education live 5.0 years less than their most highly
edu-cated counterparts. For women, this difference is 2.6 years. Moreover, men and
women with the highest level of education live on average ten years longer without disabilities. In terms of the number of years spent in self-perceived good health, the difference is 16 years for men and 14 years for women (figure 2).
• Comparing regions or neighbourhoods also reveals similar differences in health.
Poorer health in deprived areas is frequently linked to an accumulation of adverse environmental factors, both social and physical, combined with an unhealthy lifestyle.
Sweden Italy Netherlands Spain EU-15 Denmark Portugal France Sweden EU-15 Netherlands Ireland Portugal Denmark life expectancy at birth (years), men
64 66 68 70 72 74 76 78 1970 1975 1980 1985 1990 1995 2000
life expectancy at birth (years), women
70 72 74 76 78 80 82 84 1970 1975 1980 1985 1990 1995 2000
Figure 1: Life expectancy trends for men and women in various EU countries in the period from 1970 to 2000. As well as the Netherlands and the EU average (EU-15), the most and least favourable countries are shown (Source: WHO-HFA, 2002).
• Trends in inequalities in health cannot be reliably established on the basis of the avai-lable data. However, there is no indication of a decrease in the existing differences in health.
Unhealthy behaviour is the major cause of stagnating health
Unhealthy behaviour is the major cause of the stagnating life expectancy of Dutch
adults. Over the last few years, women have acquired many of men’s unhealthy
behav-iour patterns. But adverse trends in unhealthy behavbehav-iour are also particularly prevalent
amongst the young and can be regarded as long-term investments in ‘bad health’. By
contrast, the elderly have adopted a healthier lifestyle. Environmental factors also
con-tribute to the Netherlands’ total burden of disease. There is no indication that stagnating
life expectancies are linked to problems within the healthcare sector.
• There are particularly worrying trends among young people, involving smoking, the
excessive use of alcohol, not eating enough fruit and vegetables, and taking insuffi-cient exercise. In addition, there is a growing incidence of serious overweight in ever younger age groups.
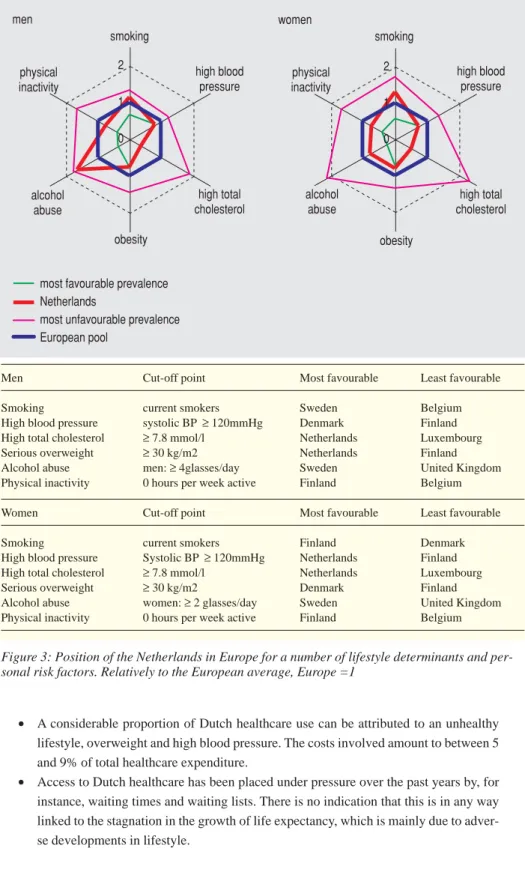
• The Netherlands scores badly in Europe in terms of smoking and the excessive use of
alcohol. By contrast, we do relatively well as far as physical activity is concerned. If we Dutch were to achieve Europe’s most favourable level for known risk factors, we would in theory add another 1.4 years to male life expectancy while females would gain 1.2 years (figure 3).
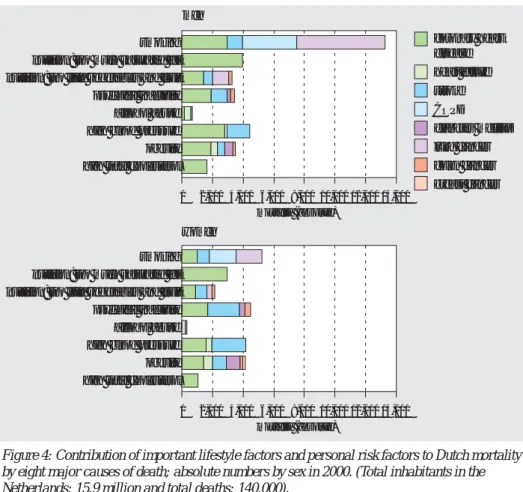
• A considerable proportion of the total annual mortality (140,000 deaths in 2000) in the
Netherlands is linked to unhealthy behaviour and could therefore be theoretically avoided. The major factors are: smoking (around 15% of deaths each year), the exces-sive consumption of saturated fat (5%), not eating enough vegetables and fruit (5%), a lack of exercise (6%), high blood pressure (6%) and serious overweight (6%). Rough estimates indicate that the contribution of environmental factors to the Netherlands’ total burden of disease does not exceed 5% (figure 4).
40 50 60 70 80 90 years with disabilities years without disabilities elementary lower secondary higher secondary
tertiary elementary lower secondary
higher secondary
tertiary life expectancy (years)
women men
Figure 2: Life expectancy and disability-free life expectancy according to educational level for Dutch men and women, 1995-1999.
• A considerable proportion of Dutch healthcare use can be attributed to an unhealthy lifestyle, overweight and high blood pressure. The costs involved amount to between 5 and 9% of total healthcare expenditure.
• Access to Dutch healthcare has been placed under pressure over the past years by, for
instance, waiting times and waiting lists. There is no indication that this is in any way linked to the stagnation in the growth of life expectancy, which is mainly due to adver-se developments in lifestyle. men 0 1 2 smoking high blood pressure high total cholesterol obesity alcohol abuse high total cholesterol alcohol abuse physical inactivity high blood pressure physical inactivity women 0 1 2 smoking obesity
most favourable prevalence Netherlands
most unfavourable prevalence European pool
Men Cut-off point Most favourable Least favourable
Smoking current smokers Sweden Belgium High blood pressure systolic BP≥120mmHg Denmark Finland High total cholesterol ≥7.8 mmol/l Netherlands Luxembourg Serious overweight ≥30 kg/m2 Netherlands Finland Alcohol abuse men: ≥4glasses/day Sweden United Kingdom Physical inactivity 0 hours per week active Finland Belgium
Women Cut-off point Most favourable Least favourable
Smoking current smokers Finland Denmark High blood pressure Systolic BP≥120mmHg Netherlands Finland High total cholesterol ≥7.8 mmol/l Netherlands Luxembourg Serious overweight ≥30 kg/m2 Denmark Finland Alcohol abuse women: ≥2 glasses/day Sweden United Kingdom Physical inactivity 0 hours per week active Finland Belgium
Figure 3: Position of the Netherlands in Europe for a number of lifestyle determinants and per-sonal risk factors. Relatively to the European average, Europe =1
A new approach to prevention can turn the tide
Prevention, particularly by promoting a healthy lifestyle, could result in considerable
health gains. A modern approach is based on a stimulating environment and an
integrat-ed method within existing ‘settings’ rather than by solely placing the emphasis on
influ-encing behaviour. This could occur by making a healthy lifestyle an obvious part of
socio-cultural life: at school, during sport and recreation, at work, in neighbourhoods
and in traffic. Moreover, prevention demands a durable vision, and long-term attention
and investment. Much could also be gained if prevention were to acquire a more
explic-it role in the provision of care.
• Along with the Ministry of Health, Welfare and Sport, other government sectors, and
public and private bodies can also contribute to the development of better health. Fac-tual information, price incentives, clarity about ‘healthy’ and ‘unhealthy’ products, and the organization of both the workplace and the built environment could entice the citizen into making healthy choices and avoiding unhealthy behaviour. Here, preventi-ve interpreventi-ventions are more effectipreventi-ve when supported by legislation and regulations.
• Prevention is more likely to succeed when it involves an approach that is specifically
geared towards the particular target group and is based on a long-term vision invol-ving constant support.
coronary heart disease heart failure stroke COPD diabetes mellitus lung cancer colon cancer breast cancer 14,000 0 2,000 4,000 6,000 8,000 10,000 12,000 men women mortality (absolute) smoking nutrition: too much saturated fat nutrition: too little vegetables and fruit psychical inactivity alcohol abuse high blood pressure obesity high total cholesterol
14,000 0 2,000 4,000 6,000 8,000 10,000 12,000
mortality (absolute)
smoking nutrition: too much saturated fat nutrition: too little vegetables and fruit psychical inactivity alcohol abuse high blood pressure obesity high total cholesterol
Figure 4: Contribution of important lifestyle factors and personal risk factors to Dutch mortality by eight major causes of death; absolute numbers by sex in 2000. (Total inhabitants in the Netherlands: 15.9 million and total deaths: 140.000).
• Prevention programs are too rarely evaluated, and successful local initiatives should be more frequently copied at a national level.
• The clear inclusion of prevention within the healthcare sector would benefit both
public health and the sector’s efficiency. This is often obstructed by the sector’s sys-tem of budgeting and the lack of financial incentives, for instance, and by other orga-nizational aspects along with the pressure of work. Medical training generally places insufficient emphasis on prevention.
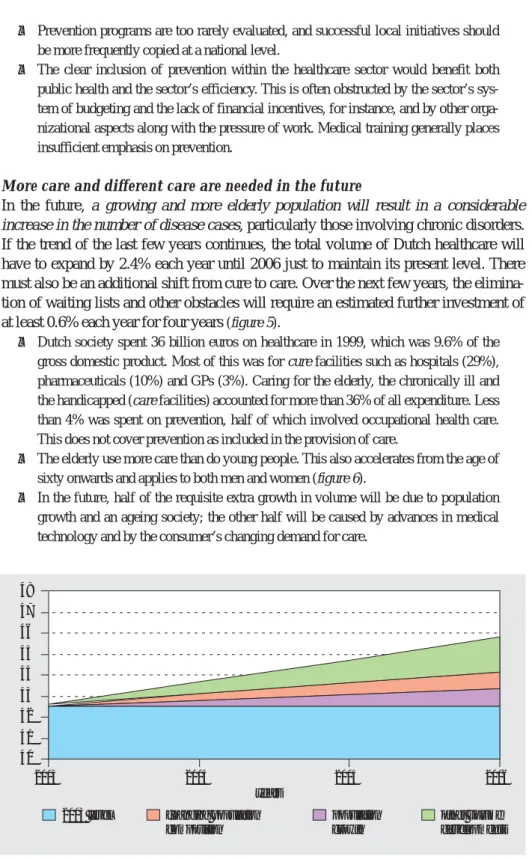
More care and different care are needed in the future
In the future, a growing and more elderly population will result in a considerable
increase in the number of disease cases, particularly those involving chronic disorders.
If the trend of the last few years continues, the total volume of Dutch healthcare will
have to expand by 2.4% each year until 2006 just to maintain its present level. There
must also be an additional shift from cure to care. Over the next few years, the
elimina-tion of waiting lists and other obstacles will require an estimated further investment of
at least 0.6% each year for four years
(figure 5).
• Dutch society spent 36 billion euros on healthcare in 1999, which was 9.6% of the
gross domestic product. Most of this was for cure facilities such as hospitals (29%), pharmaceuticals (10%) and GPs (3%). Caring for the elderly, the chronically ill and the handicapped (care facilities) accounted for more than 36% of all expenditure. Less than 4% was spent on prevention, half of which involved occupational health care. This does not cover prevention as included in the provision of care.
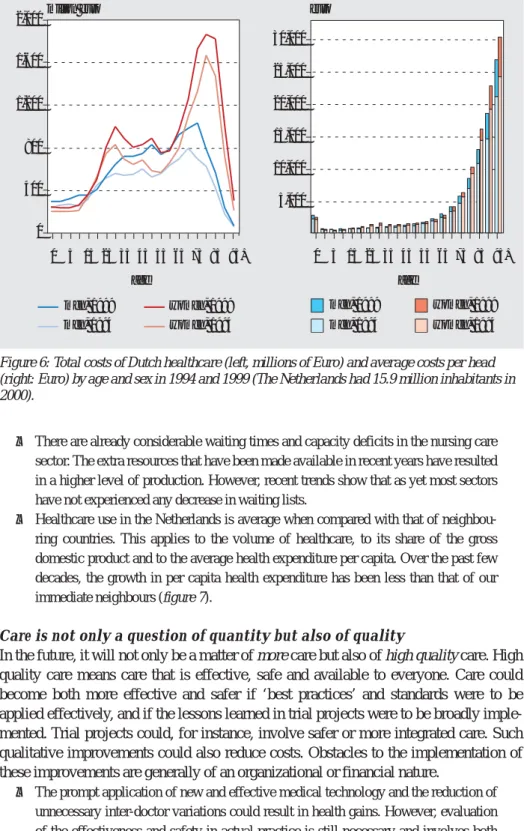
• The elderly use more care than do young people. This also accelerates from the age of
sixty onwards and applies to both men and women (figure 6).
• In the future, half of the requisite extra growth in volume will be due to population
growth and an ageing society; the other half will be caused by advances in medical technology and by the consumer’s changing demand for care.
2003 level changing population composition population growth other volume developments 40 41 42 43 44 45 46 47 48 2003 2004 2005 years 2006
Figure 5: Projection of the development of Dutch healthcare costs split into components for the period 2003-2006 (in billions of euros in constant prices from 1999).
• There are already considerable waiting times and capacity deficits in the nursing care sector. The extra resources that have been made available in recent years have resulted in a higher level of production. However, recent trends show that as yet most sectors have not experienced any decrease in waiting lists.
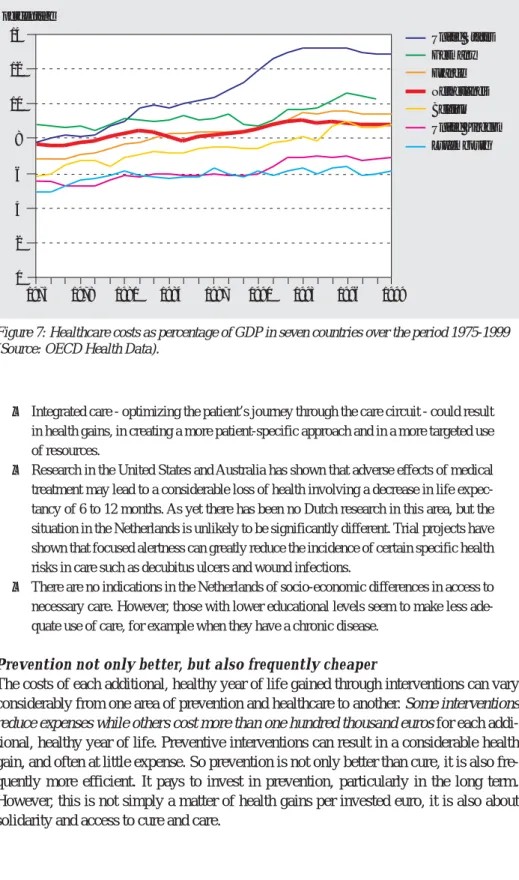
• Healthcare use in the Netherlands is average when compared with that of
neighbou-ring countries. This applies to the volume of healthcare, to its share of the gross domestic product and to the average health expenditure per capita. Over the past few decades, the growth in per capita health expenditure has been less than that of our immediate neighbours (figure 7).
Care is not only a question of quantity but also of quality
In the future, it will not only be a matter of more care but also of high quality care. High
quality care means care that is effective, safe and available to everyone. Care could
become both more effective and safer if ‘best practices’ and standards were to be
applied effectively, and if the lessons learned in trial projects were to be broadly
imple-mented. Trial projects could, for instance, involve safer or more integrated care. Such
qualitative improvements could also reduce costs. Obstacles to the implementation of
these improvements are generally of an organizational or financial nature.
• The prompt application of new and effective medical technology and the reduction of
unnecessary inter-doctor variations could result in health gains. However, evaluation of the effectiveness and safety in actual practice is still necessary and involves both ‘medical technology assessment’ and ‘post-marketing surveillance’.
men, 1999 men, 1994 women, 1999 women, 1994 30,000 25,000 20,000 15,000 10,000 5,000 0 5 15 25 35 45 age age 55 65 75 85 95+ men, 1999 men, 1994 women, 1999 women, 1994
2,000million euro euro
1,600 1,200 400 0 800 0 5 15 25 35 45 55 65 75 85 95+
Figure 6: Total costs of Dutch healthcare (left, millions of Euro) and average costs per head (right: Euro) by age and sex in 1994 and 1999 (The Netherlands had 15.9 million inhabitants in 2000).
• Integrated care - optimizing the patient’s journey through the care circuit - could result in health gains, in creating a more patient-specific approach and in a more targeted use of resources.
• Research in the United States and Australia has shown that adverse effects of medical
treatment may lead to a considerable loss of health involving a decrease in life expec-tancy of 6 to 12 months. As yet there has been no Dutch research in this area, but the situation in the Netherlands is unlikely to be significantly different. Trial projects have shown that focused alertness can greatly reduce the incidence of certain specific health risks in care such as decubitus ulcers and wound infections.
• There are no indications in the Netherlands of socio-economic differences in access to
necessary care. However, those with lower educational levels seem to make less ade-quate use of care, for example when they have a chronic disease.
Prevention not only better, but also frequently cheaper
The costs of each additional, healthy year of life gained through interventions can vary
considerably from one area of prevention and healthcare to another. Some interventions
reduce expenses while others cost more than one hundred thousand euros for each
addi-tional, healthy year of life. Preventive interventions can result in a considerable health
gain, and often at little expense. So prevention is not only better than cure, it is also
fre-quently more efficient. It pays to invest in prevention, particularly in the long term.
However, this is not simply a matter of health gains per invested euro, it is also about
solidarity and access to cure and care.
percentage 0 2 4 6 8 10 12 14 1975 1978 1981 1984 1987 1990 1993 1996 1999 United States Germany France Netherlands Belgium United Kingdom Luxembourg
Figure 7: Healthcare costs as percentage of GDP in seven countries over the period 1975-1999 (Source: OECD Health Data).
• Preventive measures at the beginning of the disease chain, such as the neonatal heel prick, vaccinations or traffic regulations, are often more efficient than interventions at the end of the chain, such as lung transplantation. The general desire for a high level of individual protection also has as a result that sometimes expensive environmental measures are taken.
• However, apart from the cost-effectiveness and efficiency of interventions, there is
also the issue of solidarity and of each Dutch citizen’s legitimate right to protection, cure and care. Nonetheless, making the relation between costs and health gains more explicit could create greater transparency in the decision-making process.
There are certain gaps in the provision of information
An effective and constant flow of information is the basis of monitoring, analysis and
reporting, as presented by the PHSF reports. Since the 1997 PHSF report, the flow of
information has improved in certain areas, but deteriorated in others. There are still
some major problem areas:
• Many data collections lack continuity, fail to represent the country as a whole or allow
insufficient opportunity for regional differentiation.
• Registration and research do not draw sufficiently on information about
socio-econo-mic status, ethnicity, domestic situations and other relevant characteristics such as the severity of a disease or the quality of life.
• Care registration is too fragmented and frequently fails to include diagnostic data or to
assign a unique number to each patient. This makes it impossible to monitor a given course of care at the level of individual patients.
• Various data collections (including those from the public domain) are compiled and
stored by private bodies, as a result of which access to this information is becoming increasingly difficult or even totally impossible.
• Data about the quality, effectiveness, safety and accessibility of prevention and
health-care is extremely incomplete.
• There is an increasing need for international ‘benchmarking’. Various schemes for
measuring ‘health system performance assessment’ are being developed but the inter-national comparability of data still leaves much to be desired.
The findings’ significance for the various players
Central government must invest in prevention to reverse the stagnation in
health
Investment in prevention is vital if we are to break through the stagnation in the
devel-opment of our health. The government will have to achieve this by creating a coherent
policy framework and a long-term vision for health. Therefore, it must continue to invest
in existing preventive facilities, and must strongly encourage the development,
evalua-tion and naevalua-tional implementaevalua-tion of new, preventive intervenevalua-tions. Here, the focus of
attention needs to be directed at strengthening prevention within the healthcare system
as well as intersectoral policy.
• The 2002 PHSF report provided the government with leads for developing national
quantita-tive objecquantita-tives to these priorities in consultation with the other players. This creates the
opportunity to monitor the policy’s progress empirically. In addition, national objecti-ves may stimulate and inspire the other players to develop and implement their own policy plans.
• The government must continue to invest in existing preventive facilities so as to
sustain the existing level of health gain. This entails keeping the existing system of preventive facilities up to standard, which also involves their inspection and mainte-nance.
• The national implementation of new and effective interventions must be promoted.
This could occur through the distribution of information about these interventions in dialogue with the other players, the creation of collaborative alliances and the structur-al financing of nationstructur-al implementation.
• The government must continue to invest in research into the development,
effective-ness, implementation and evaluation of preventive interventions so as to broaden the prevention policy’s basis.
• The implementation of effective prevention activities within the healthcare system
must be promoted by, for instance, eliminating organizational and financial obstacles or by stimulating care providers and health insurers.
• The government could encourage health-oriented, intersectoral policy at a
departmen-tal level by making agreements about common goals within the various policy fields.
Here, opportunities include the major cities policy (Ministry of the Interior and King-dom Relations), sport (the Ministry of Health, Welfare and Sport), schools (Ministry of Education, Culture and Science), employment (Ministry of Social Affairs and Employment), traffic safety (Ministry of Transport, Public Works and Water Manage-ment), and housing and the environment (Ministry of Housing, Spatial Planning and the Environment).
• The government could encourage structural co-operation between local government
councils and local representatives of healthcare providers, health insurers, and
consu-mer and patients’ organizations.
Local-level prevention players should combine forces
The actual implementation of collective prevention largely occurs at local level.
Coun-cils and municipal medical and health services are important local players in
co-opera-tion with the local representatives of the care providers, the health insurers and the
requesters of care. They should combine forces and work together on formulating and
developing a local prevention policy with common, local priorities and policy
objec-tives. A national public health policy framework could inspire the local players and
pro-vide guidance for drawing up local public health reports and for formulating local
objectives.
• Within the national policy framework, local players could promote the development,
implementation and evaluation of new interventions within the local setting. They could also stimulate the implementation of effective interventions, which have been adjusted to reflect the local circumstances.
• Local forms of intersectoral co-operation must be strengthened. Here, national
serve as a source of inspiration for all the players including the national government.
• The local players must jointly examine how effective preventive interventions could
be included in the basic responsibilities of the relevant care providers. They must also reinforce the development of new preventive interventions within the healthcare system.
• There must be joint investment in a two-way risk communication system between the
government and the citizen which also refers to the citizen’s own responsibility.
Con-sumer and patients’ organizations could make a major contribution to a balanced
approach to risks and their perception.
More care, different care and better care are both necessary and feasible
The 2002 PHSF report was neither willing nor able to deal with the full scope of the
healthcare sector. It examines care primarily in terms of attainable health gain. Here, the
key words are ‘accessibility’, ‘effectiveness’, ‘safety’, ‘costs’ and ‘efficiency’. More
and different care will be needed in the future, and this is mainly due to a growing and
increasingly elderly population. Moreover, there are still many opportunities to improve
the quality of care.
More care and different care could be achieved by:
• Keeping the annual increase in the Dutch healthcare budget in step with demographic
changes, advances in medical technology and other autonomous developments. An annual increase of at least 2.4 to 3% would appear to be needed until 2006. This can be partly justified by the budget’s interrupted growth in the 1990s.
• Solving the capacity deficits by expanding medical training in combination with a
long-term vision for developing the capacity of the medical professions.
• Making the necessary shift of investments from cure to care within the required total
increase.
Better care could be achieved by:
• The explicit inclusion of health objectives when formulating preconditions for a new
healthcare system. These could include health gain, promoting quality of life and reducing inequality in health.
• Increasing the quality of care by encouraging the use of standards and guidelines
while retaining the flexibility needed for modernizing the healthcare system.
• Eliminating financial and organizational obstacles that needlessly block the adoption
of effective forms of healthcare modernization, integrated care and new technology.
• Examining whether, within a patient-specific orientation, a boundary could be defined
for the ‘medically unjustified’ demand for care.
• Extra investment in the availability and, particularly, in the tailoring of care for weaker
social groups.
• Encouraging the development of methods for institutions and care providers that
measure health outcomes or relevant process parameters. These indicators could be used for improving internal quality, for the external assessment of quality by care mar-ket consumers and insurers, and to achieve accountability to both society and parlia-ment.
Dilemmas in prevention and care
The analysis of prevention and care in the Netherlands reveals a number of dilemmas
that sometimes seem to obstruct rational policy choices. Some dilemmas have existed
for quite some time while others will only reach practical significance in the future. It is
important to stimulate a political and social debate on these issues in order to achieve
the right social balance for these dilemmas.
• Prevention is a long-term undertaking. Investments generally require time to yield
health dividends, and this often occurs gradually and in an imperceptible manner. This means that prevention may suffer in a political arena where short-term problems are fighting for priority.
• The citizen demands maximum safety from the government at all costs yet rejects any
restriction on his freedom to, for instance, subject his health to considerable risks. Hence, policy-makers are confronted with the difficult choice of whether to opt for the collective interest of public health or to respect the individual’s freedom of choice. Here, a related dilemma concerns the contradiction between the collective interests of public health and the private economic interests of, for instance the drinks and tobacco industries.
• Experts and the public frequently fail to agree about the potential, nature, extent and
control of health risks. The public tends to ignore the risk experts’ estimates. Hence, the government faces the dilemma of whether to deal with these risks rationally on the basis of ‘scientific’ estimates of potential risk, damage and the cost effectiveness of safety measures, or to consider the public’s legitimate experience of those risks as based on a range of values and norms.
• Investing in preventive measures aimed at avoiding or delaying disease often yields a
higher level of health gain than the care provided during the later phases of the disease process. Here, prevention is better than cure and the health gain is frequently obtained in a cheaper way. This in turns leads to a dilemma between the efficient use of limited resources and every Dutch person’s right to the best possible care.
• The basic premise of demand-oriented care and the ‘right to care’ runs counter to an
imperative financial framework, whereby care provision is limited. However, a budget ceiling always exists even within an ample financial framework. Improving the func-tioning of this ‘imperfect’ care market also entails a considerable number of dilem-mas: should solidarity be sacrificed for efficiency through, for instance, individual insurance contributions? Should the basic insurance policy be extended or will people have to opt for additional coverage? Could a useful distinction be made between ‘evi-dence-based’ medicine and problems that have been ‘unjustly medicalized’?
• Endeavouring to maintain standards in healthcare raises its quality but, in theory, this
could also hamper timely modernization and impede a patient-oriented approach.
• Developments in genetics provide us with greater insight into our personal risk and
treatment profile. This means that in the future we will be able to apply both preven-tion and treatment increasingly effectively. However, these developments also entail all manner of moral and ethical dilemmas. This is primarily because the diagnostic potential is increasing far more rapidly than the possibilities for treatment. How do we deal with the right not to know which diseases we may develop later on if, as yet, there is no prospect of a cure? How should we treat a technology that produces more
disea-ses and diagnodisea-ses them at an earlier stage, yet does not yield any significant health gain? Should the often-pricey pharmaceuticals that compensate for an individual’s unhealthy lifestyle be a collective financial burden?
• Some argue in favour of measuring the quality or performance of healthcare so as to
increase its quality and make the options of both consumers and insurers more trans-parent. To what extent should we support the public disclosure of this information? Do we want to use quality measurement to create league tables and rogues galleries? Or should we use it as a lesson for the improvement of quality?
Opportunities to create a more effective flow of information
An effective and constant flow of information is essential for creating the basis of an
‘evidence-based policy’. Hence, the government must develop a long-term vision for its
information and research policies, which it must also direct.
• The government must clearly indicate the health and care subjects that need to be
regularly supplied with data. The monitoring of quantitative policy objectives could be a part of this process.
• The government could agree on the characteristics and working structure of data
col-lections in consultation with other parties. Central direction enables efficiency gains to be made by improving the co-ordination between data collections. The government must also ensure that private interests do not obstruct access to relevant data collec-tions.
• The government should promote local-level collection of data concerning local needs,
in good co-ordination with the existing needs at national level.
• The government must forcefully pursue the development and funding of national
public health and healthcare research programs.
• The government could provide an extra stimulus for the on-going development of
fra-meworks and indicators for measuring performance and risks in care and prevention. This will eventually create more effective possibilities for ‘benchmarking’ at the meso-level (between institutions) and at the macro-level (between countries).
• The government could encourage the Netherlands to become more deeply involved in
the efforts of European and other international institutions to make data from different countries more readily comparable. One way in which this could be achieved is to encourage Dutch researchers to make an active contribution to the design and imple-mentation of the European public health programme.