RIVM report 601353005/2014
J. Struijs
SimpleTreat 4.0: a model to predict the
fate and emission of chemicals in
wastewater treatment plants
Background report describing the equations RIVM Report 601353005/2014Colophon
© RIVM 2014
Parts of this publication may be reproduced, provided acknowledgement is given to: the National Institute for Public Health and the Environment, along with the title and year of publication.
This is a publication of:
National Institute for Public Health and the Environment
P.O. Box 1│3720 BA Bilthoven The Netherlands
www.rivm.nl/en
Jaap Struijs, RIVM
Contact:
Dr T.P. Traas
M&V/VSP/ICH
theo.traas@rivm.nl
This investigation has been performed by order and for the account of the Ministry of Infrastructure and the Environment (project M/601351), within the framework of REACH
Publiekssamenvatting
SimpleTreat 4.0, een model dat gedrag en uitstoot van chemicaliën in rioolwaterzuiveringen voorspelt
Chemische stoffen kunnen via het afvalwater dat bedrijven en huishoudens in het riool lozen in het milieu terechtkomen. Het RIVM heeft in 1992 het zogeheten SimpleTreat-model ontwikkeld, waarmee kan worden geschat in welke mate de milieucompartimenten (bodem, water of lucht) via afvalwater aan dergelijke stoffen blootstaan. Het RIVM geeft nu een overzicht van alle
technische details van de nieuwste versie van het model (4.0), dat in 2013 is herzien. De bedoeling hiervan is om alle wiskundige vergelijkingen en
rekenmethodieken die in het model worden gebruikt, vast te leggen en overzichtelijk weer te geven.
De beoordelingssystematiek voor chemische stoffen, inclusief het SimpleTreat-model, was oorspronkelijk bedoeld om de Nederlandse Wet Milieugevaarlijke Stoffen te ondersteunen. Sinds 2003 is het door de Europese Unie overgenomen en vanaf 2007 maakt het deel uit van de Europese regelgeving voor chemische stoffen REACH (Registratie, Evaluatie, Autorisatie van CHemische stoffen). Ook buiten Europa bestaat er veel belangstelling voor SimpleTreat.
Redenen herziening model
Het model is om twee redenen herzien. Als eerste waren aanpassingen nodig om het model bruikbaar te maken voor de Europese wetgevingen voor chemische stoffen die naast REACH bestaan: de biocidenrichtlijn (ontsmettingsmiddelen), de regulering van de toelating van medicijnen, en de regulering voor het gebruik van gewasbeschermingsmiddelen. Aparte wetgevende kaders zijn ingevoerd vanwege het specifieke gebruik van deze stoffen. Daarnaast komen er meer geneesmiddelen en biociden in het milieu terecht door het toegenomen gebruik ervan. Een apart beoordelingssysteem is nodig omdat deze categorieën
chemicaliën een ander gedrag vertonen. In de tweede plaats is er in toenemende mate behoefte aan een model voor de emissie van chemische stoffen door installaties die industrieel afvalwater zuiveren. Dat was er eerder nog niet. De aard van dit afvalwater wijkt af van het huishoudelijke afvalwater.
Trefwoorden:
lotgevallen model voor chemicaliën, emissiemodel, rioolwaterzuiveringen, behandeling voor huishoudelijk/industrieel afvalwater
Abstract
SimpleTreat 4.0, a model to predict the fate and emission of chemicals in wastewater treatment plants
Chemical substances in wastewater discharged into the sewer by companies and households may reach the environment. In 1992, the National Institute of Public Health and the Environment (RIVM) developed the so-called SimpleTreat model to estimate exposure of the receiving compartments (soil, water and air) to these chemicals present in wastewater. The RIVM presents an overview here of all technical details of the model revised in 2013 (version 4.0). The purpose of this report is to conveniently arrange a document containing all mathematical equations and computation methods applied in the model.
The assessment system for chemicals, including the SimpleTreat model, was originally meant to support the Netherlands Chemical Substances Act. In 2003 the European Union adopted this methodology and since 2007 it has been a part of the European legislation for chemicals REACH (Registration, Evaluation and Authorization of Chemicals). The SimpleTreat model is also receiving
considerable attention outside the European Union. Reasons for the revision
The revision was necessary for two reasons. First, the modifications were required to make the model suitable for European substance regulation and legislation that exist beside REACH: for chemicals covered under the Biocidal Products Directive, such as disinfectants, for active pharmaceutical ingredients regulated by the European Medicines Agency and for chemicals under the plant protection regulation. These regulations came separately into force because of their specific use. Furthermore, the emission of pharmaceuticals and biocides is higher because of increased use. An independent assessment methodology is required because these categories of chemicals show a different behaviour. Second, there is an increasing need for a model that predicts the emission of chemicals from plants that treat industrial wastewater. This type of wastewater is different from communal wastewater.
Keywords:
chemical fate model, emission model, sewage treatment plant, treatment of domestic wastewater/industrial wastewater
Contents
1
Introduction − 11
2
Characterization of the sewage treatment process − 15
2.1
Raw sewage and its treatment − 15
2.2
Defining the primary clarifier − 16
2.3
Defining the activated sludge process − 17
3
Definition of the modelled chemical − 21
3.1
Equilibrium partitioning constants − 21
3.2
Estimation methods for equilibrium partitioning constants − 22 3.2.1
3.2.1. Neutral organic chemicals − 22
3.2.2
Organic acids and bases − 23
4
Description of the model − 27
5
Chemical fate processes − 29
5.1
Advective transport − 29 5.1.1
Air − 29
5.1.2
Water − 30
5.1.3
Sewage solids − 30
5.1.4
Activated sludge solids − 30 5.2
Diffusive transport − 31
5.2.1
Non-equilibrium at the suspended solids-water interphase − 32 5.2.2
Reversible air-water transfer without aeration − 32
5.2.3
Reversible air-water transfer due to aeration − 33
5.3
Degradation processes − 36
5.4
Chemical loading via the sewer − 37
6
Model output − 39
6.1
Emission to air − 39
6.2
Emission to water − 39
6.3
Emission via combined sludge − 40
6.4
Emission via digested sludge − 40
6.5
Concentration in activated sludge − 40
7
Discussion − 41
7.1
BOD removal characterized by the sludge loading rate − 41
7.2
Applicability of SimpleTreat to North America − 42
7.3
Applicability of SimpleTreat to industrial wastewater − 42
7.4
Estimation of Koc − 44
7.5
Default SLR and fixed suspended solids in effluent − 45
8
Literature − 47
9
Appendix A Parameters and mass balance equations − 49
10
Appendix B Mass balance equations for the 6-box model − 55
11
Appendix C Sludge loading rate and related parameters − 61
Summary
Chemical substances in wastewater emitted by companies and households into the sewer may find their way into the environment. The emission of new
substances is regulated by chemical legislation, for which a system was required to assess the human and environmental risks. In the framework of this risk assessment system, the National Institute for Public Health and the Environment (RIVM) in the Netherlands developed the SimpleTreat model. The model
estimates the extent to which environmental compartments (soil, water and air) are exposed to chemicals discharged into the sewer. Since 2003, the EU has adopted the risk assessment methodology implemented in EUSES. In 2007, the European REACH legislation (Registration, Evaluation, Authorization and
restriction of Chemicals) came into force, relying on EUSES with regard to environmental risk assessment.
This report describes the model SimpleTreat 4.0, a model to predict the fate and emission of chemicals in wastewater treatment plants. SimpleTreat 4.0 is an improved version of SimpleTreat 3.1., applied in the European REACH legislation (Registration, Evaluation, Authorization and restriction of Chemicals).
Version 3.1 has become accepted as a useful tool for generic exposure assessment. It is now recognized that the accuracy of exposure assessment, particularly with respect to the water compartment in urban regions, is strongly influenced by the accuracy with which the chemical fate in sewage treatment plants (STP) can be predicted.
Chemicals covered not only under REACH but also those covered under the Biocidal Products Regulation (BPR) and active pharmaceutical ingredients regulated by the European Medicines Agency (EMA) are being evaluated using SimpleTreat 3.1. In the Netherlands, it is even applied to substances that are assessed according to the regulation on plant protection products (PPP)
1107/2009 because drainage water from greenhouses in which PPPs are applied is collected and discharged into sewer systems.
This extended application has led to reservations with respect to the ability of the model to predict complicated substances. Most chemicals under BPR, EMA and PPP may exist in the ionic state or have surface-active properties, while the SimpleTreat model was designed to compute the fate of hydrophobic (neutral) chemicals. In the year of 2012, the German Federal Environment Agency asked for an evaluation of SimpleTreat, with special emphasis on its predicting
behaviour regarding biocides and pharmaceuticals. The study revealed that the assumption that only the neutral chemical is available for sorption into sludge and that the ionized species can only exist in the true dissolved phase may lead to erroneous results.
The operation mode of sewage treatment plants (STP) in the EU has changed somewhat in the last two decades. Moreover, there is an increasing demand to simulate the fate of chemicals in installations treating industrial wastewater. These developments required some modifications of the model. With respect to SimpleTreat 3.1, these adaptations can be grouped into three categories. 1. Wider choice to define wastewater. In SimpleTreat 3.1, a fixed part (2/3) of
the solids in domestic sewage is assumed to settle in the primary clarifier and a fixed part of the total BOD (biological oxygen demand) in raw sewage is dissolved. The remaining (also fixed) part resides in the solids. In version 4.0, these partitions can be chosen.
This modification makes it possible to simulate the fate of chemicals in industrial wastewater.
2. Improved formulation of the partitioning of chemicals. The partitioning of organic acids and bases over (suspended) solids and the water phase has improved in line with recent insights.
3. Revision of fixed and default parameters. Some parameters no longer reflected the technological state of the art. For example, the average
concentration of suspended solids in the effluent is now four times lower than was calculated by SimpleTreat 3.1. This has a significant effect on the
1
Introduction
Discharged chemicals in the industrial world reach the environment most often through wastewater that has been treated. Although industrial wastewater is a relevant source, emission via residential wastewater treatment plants (STP) is the major route to the environment. This is why the risk assessment of chemicals has focussed on this pathway. A major proportion of communal wastewater (sewage) in the industrial world is treated by residential STPs. These systems were initially designed to remove BOD (biochemical oxygen demand) from communal sewage. More recently, STPs also eliminate other nutrients such as phosphorus and nitrogen. During this process, chemicals may be biodegraded or distributed over the receiving environmental compartments of water,
agricultural soil or air (Figure 1). Assesssing the exposure to the chemicals in wastewater requires evaluation of the chemical fate in wastewater treatment installations. The pathway from the sewer system to the receiving environmental compartments runs via an STP.
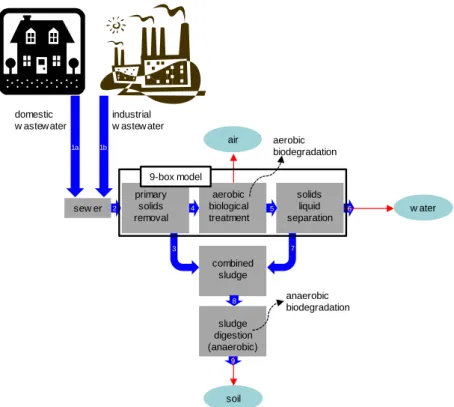
Figure 1 The emission scenario of SimpleTreat, a fate model of a chemical in wastewater discharged into the sewer. Emission routes are air, water and soil. Thick arrows indicate flows of raw residential sewage (1a, 2) and/or industrial wastewater (1b, 2), primary sludge (3), settled sewage (4), activated sludge (5), effluent (6), surplus sludge, also known as secondary or wasted sludge (7) and combined sludge (8). Red arrows indicate emission routes to air, water and soil. Aerobic biodegradation in the aeration tank is the only elimination process.
sew er domestic w astew ater industrial w astew ater primary solids removal aerobic biological treatment solids liquid separation combined sludge sludge digestion (anaerobic) air w ater soil aerobic biodegradation anaerobic biodegradation 1a 1b 2 3 4 5 7 8 9 6 9-box model
Figure 1 is a diagram of the SimpleTreat model in its environment. The core of the model is a multimedia box computation of the chemical fate in the
technosphere of an STP. The 9-box model includes a primary clarifier, an activated sludge reactor (aerobic treatment) and secondary sedimentation (solids-liquid separation). The model computes the fluxes of the chemical via air, water and solids and the chemical concentrations in the media flowing out of the system, describing the local environment of a communal STP. Originally
developed by Struijs et al. (1991), the program has been revised (Struijs, 1996) and adapted to be generically applicable for the European Union. It functions as a central emission and exposure assessment device in the EUSES system (TGD, 2003).
One major feature of the model is that it only requires a few basic properties in the base-set data of the chemical to calculate relative emissions (percentage emission to air, to water and to soil). In combination with a simple emission scenario, these base-set data are used as input for the computation of
concentrations in treated wastewater that flows into the receiving water bodies, in sludge produced (applied to agricultural soil) and in the air above the STP. The emission scenario requires only two input data: the emission rate of the chemical into the sewage system and the size of an average STP in terms of the number of inhabitants connected to it. SimpleTreat allows a choice of various operation modes such as absence/presence of a primary clarifier, aeration regime and sludge loading rate.
SimpleTreat 3.1 is the recommended STP model in Europe for environmental risk assessment of industrial chemicals (REACH 1), chemicals covered under the Biocidal Products Regulation (BPR) and active pharmaceutical ingredients regulated by the European Medicines Agency (EMA). In the Netherlands, it is applied to substances that are assessed according to the regulation on plant protection products (PPP) 1107/2009 because drainage water from greenhouses in which PPPs are applied is collected and discharged into sewer systems. Multi-media models, also known as box models, have been found suitable for estimating fate and environmental concentrations of neutral organic chemicals that are typified by a degree of hydrophobicity, air-water partition coefficient and microbial degradability. The Federal Environment Agency (UBA) of Germany decided to investigate the validity domain of SimpleTreat 3.1 with respect to more complex chemicals (Struijs, 2013). This evaluation was the motive for extending the applicability of SimpleTreat beyond neutral substances, particularly with respect to organic chemicals that are ionized. Franco et al. (2011) have indicated that almost half of the notified chemicals under REACH are ionizable. In a recent study, Franco and Trapp (2010) suggested that a significant fraction of industrial chemicals that have been pre-registered in Europe likely consist of ionizable organic chemicals, whereas the majority of active pharmaceutical ingredients are ionizable (ECETOC, 2013). Neutral chemicals under BPR and EMA are even a minor proportion. The conclusions of these recent studies prompted the revision of SimpleTreat 3.1. Studies
mentioned above have also identified some parameters with respect to the operation mode of STPs that are considered to be out of date. In addition, the OECD recently launched a joint project to compile the current methodologies, tools and models used for estimating removal/emissions of micro-pollutants from/by wastewater treatment systems. A questionnaire indicated that there is interest in extending its applicability to treatment of industrial wastewaters (OECD, 2013).
This report describes in detail the technical aspects of a new version:
SimpleTreat 4.0. The structure of the model has not changed; it is still a steady state non-equilibrium 9-box model. It differs from version 3.1 with respect to: - having parameter settings which better reflect the current technology of
sewage treatment;
- affording greater flexibility to define wastewater and treatment in the primary clarifier, which makes modelling the fate and emission of chemicals in
industrial wastewater possible;
- being scientificly state of the art for estimating the solids-water partition constants of ionized chemicals.
The chemical route to the STP begins with discharge of wastewater into the sewer, where it may remain for hours or days. Sewage in this system consists of two media, i.e. water and solids. In this a binary phase system, the chemical is in equilibrium. Consequently, the chemical enters the STP through two phases, the water phase and the solids phase. SimpleTreat 4.0 offers greater flexibility in defining characteristics of the particulate and aqueous phases and treatment in the primary clarifier. This makes it possible to simulate the fate of a chemical during the treatment of industrial wastewater. New rules for the equilibrium partitioning of ionized chemicals (organic acids and bases) are applied to sewage and activated sludge.
2
Characterization of the sewage treatment process
2.1 Raw sewage and its treatment
Describing the process of sewage treatment starts with the parameterization of inflowing wastewater. Communal sewage can be characterized in terms of flows per capita: volume sewage, mass of solids or BOD (biochemical oxygen demand) per person equivalent per day. The inflow of raw sewage, solids (dry weight) and BOD is expressed per person equivalent (PE) in Table 1.
Table 1 Flow characteristics of raw sewage. Values in the last column are default settings typical for communal wastewater produced daily by one
inhabitant (PE)
BOD is associated with large organic molecules that are easily decomposed by bacteria. However, oxygen is required for this process whereby these molecules are broken down into smaller molecules and eventually into carbon dioxide and water. The amount of oxygen required for this process is known as BOD. An STP is primarily a BOD elimination installation. STPs are often equipped with a primary clarifier that eliminates part of the solids in sewage and a fair share of the BOD content of raw sewage because BOD in sewage is distributed over the aqueous and particulate phases (Table 2). After primary sedimentation, the so-called settled sewage enters the activated sludge process. This technique consists of the aeration of slurry with a high, but stationary content of micro-organisms and a second tank where separation of suspended solids through sedimentation takes place (Figure 2). This tank is also known as the solids liquid separator. Typical for the activated sludge technique is the fact that the settled solids are tracked back to the aerator. The supernatant leaves effluent (treated wastewater) with low concentrations of solids and oxygen-consuming
substances.
BOD that is not removed by the primary clarifier enters the aeration tank. The BOD load of the aerator has influence on the reactor volume and so on the aeration time (hydraulic retention time). It also has an impact on the fate of the solids in the activated sludge process (sludge retention time). The solid phase of raw sewage has the attributes of the density and fraction of organic carbon. The fraction of sewage solids removed due to sedimentation in the primary clarifier (FS) as well as the fraction of BOD in raw sewage that is located in the solids phase of sewage are considered “properties” of raw sewage in the primary sedimentation tank (Table 2). In multimedia models of the real world, FS would be derived from process parameters characterized by the settling velocity of suspended solids.
All parameters in Tables 1 and 2 were fixed in SimpleTreat 3.1, except the sewage flow (Q), which varies between 0.45 (North America) and 0.15 in some countries in Europe. The revised version offers the modeller the option to choose all parameters in Tables 1 and 2. This enables the evaluation of the fate of chemicals during treatment of industrial wastewater.
symbol meaning Units default
Q Sewage flow m3∙d-1∙PE-1 0.2
SO Mass of sewage solids kg∙d-1∙PE-1 0.09
Table 2 Properties of raw sewage. Values in the last column are default settings representing communal wastewater
Table 3 Derived parameters with respect to raw sewage
2.2 Defining the primary clarifier
With respect to the primary sedimentation tank, two parameters required to describe the functioning of the primary sedimentation tank are fixed (Table 4). The geometry of the primary sedimentation tank and other relevant
characteristics are given in Table 5.
Table 4 Fixed properties of the primary sedimentation (PS) tank
symbol meaning units value
hPS Depth of the PS tank M 4
HRTPS Hydraulic retention time hr 2
Table 5 Derived parameters with respect to the primary sedimentation tank (PS)
The fraction of BOD removed in the primary clarifier of a communal STP is typically in the range of 0.3 and 0.4. CSO,PS is the steady state concentration of
solids in the liquid (also known as “settled sewage”) that enters the aeration tank. If the fraction of solids removed by the primary clarifier (FS) is zero, then the fraction of BOD removed (FP) is also zero. This approaches the scenario of an STP without a primary clarifier when raw sewage enters the activated sludge process directly. Nevertheless, a separate box model is employed (“6-box”) to conduct the computation for this scenario to avoid numerical problems in chemical fate computations. In Appendix B, the equations for an STP without primary clarifier are given.
symbo
l Meaning
units default
FB Fraction BOD in sewage solids - 0.5417
FS Fraction sewage solids removed by primary settler - 0.667 focS Fraction organic carbon in sewage solids - 0.3
dS Density of sewage solids kg∙L-1 1.5
symbol Meaning units equation default CSO,S Conc. solids in raw sewage kg∙m-3
SO
Q 0.45
CBOD,S Conc. BOD in raw sewage kg BOD∙m-3
BOD
Q 0.3
symbol Meaning units equation default
VOLPS Volume PS per person m3∙PE-1 Q ∙ HRT24 1.67∙10-2
AREAPS Area PS per person m2∙PE-1
Q ∙ HRT
24 ∙ h 4.167∙10-3
CSO,PS Conc. suspended solids in PS kg∙m-3 1 FS ∙ C , 0.15
FP Fraction BOD removed by
2.3 Defining the activated sludge process
The activated sludge process combines aeration of activated sludge and
sedimentation in a separate basin where the particles settle. The settled sludge is tracked back to the aeration tank (aerator). The aeration tank contains slurry (“mixed liquor”) with a high concentration of suspended solids, a significant portion of which is of microbial origin. In the secondary sedimentation tank the sludge solids are separated from liquid that has a low concentration of
suspended solids (effluent). This tank is also called the solids-liquid separator (SLS). Properties of the solids such as foc and d (see Table 6) in the solids-liquid separator and recycled sludge are identical to those of activated sludge. Again, the steady state concentration of suspended solids is not determined by a process parameter such as the settling velocity. It is a fixed value that reflects the practice of treating communal wastewater using modern biological methods. Note that the concentration of suspended solids in the SLS and in effluent is a factor of 4 lower than in SimpleTreat 3.1.
Table 6 Fixed properties of the aeration tank and the activated sludge process (aeration tank, solids-liquid-separation and recycled sludge)
The modeller has several possibilities to define the mode of operation of the STP. The sludge loading rate parameter, kSLR in kg O2∙kg dry weight-1∙d-1,
typifies the BOD loading of the installation (Table 7). This parameter is also known as the food to mass ratio (F/M).
Table 7 Input parameters characterizing the mode of operation of the activated sludge reactor
The total BOD input to the aerator depends on the performance of the primary sedimentation tank. The concentration of oxygen-binding substances flowing into the aerator, for which the term "oxygen requirement" is used, depends on Q and the BOD input from the primary clarifier. Table 8 shows that the equation for the aeration volume available for one person follows from the kSLR and
characteristics of (settled) sewage and activated sludge.
symbol Meaning units value
hAS = hSLS Depth of aeration tank and SLS m 3
HRTSLS Hydraulic retention time SLS hr 6
CSO,AS Conc. suspended solids in activated sludge kg∙m-3 4
CSO,SLS Conc. suspended solids in effluent kg∙m-3 0.0075
dAS Density of activated sludge solids kg∙L-1 1.3
focAS Fraction organic carbon activated sludge - 0.37
symbol Meaning Units default
kSLR Sludge loading rate kg O2∙kg-1∙d-1 0.1
Table 8 Derived parameters with respect to the activated sludge process
From the input parameter kSLR (Table 7), also known as the food to mass ratio
(F/M), several parameters are derived that are typical for the operation of the plant. Mikkelsen (1995) reported the fraction BOD removal to correlate with ln kSLR according to:
F
0.818
0.0422 ∙ ln k
1with
FBODrem : fraction of BOD removed by the activated sludge process [-]
The yield of biomass per unit BOD degraded in the aeration tank also correlates (Mikkelsen, 1995) with the sludge loading rate:
Y
0.947
0.0739 ∙ ln k
2with
Y
BOD : yield of biomass (sludge growth) per BOD [kg dwt∙kg BOD-1]Mikkelsen (1995) derived equations 1 and 2 using data from Henze (1992). The amount of surplus sludge produced daily, also known as wasted sludge, depends on the presence of primary sedimentation. The net production per capita is obtained after subtraction of the emitted solids via the effluent:
SU
Q ∙ OxReq ∙ F
∙ Y
C
, 3with
SU : wasted (surplus) sludge [kg dwt∙PE-1∙d-1]
symbol Meaning units equation default
OxReq Oxygen requirement kg O2∙m-3 1 FP ∙
BOD
Q 0.192
VOLAS Volume aerator per person m3∙PE-1
Q ∙ OxReq
k ∙ C , 9.6∙10 -2
AREAAS Area aerator per person m2∙PE-1
VOL
h 3.2∙10-2
HRTAS Hydraulic retention time aerator hr
VOL
Q ∙ 24 11.5
VOLSLS Volume SLS per person m3∙PE-1
Q ∙ HRT
24 5.0∙10-2
AREASLS Area SLS per person m2∙PE-1
VOL
If equations 1 - 3 are combined with parameters of Tables 6 to 8, the dependence on the characteristics of raw sewage and the performance of primary sedimentation disappear when deriving an expression for the sludge retention time, because the oxygen requirement cancels:
SRT
VOL ∙ C
,SU
C
,∙ Q
1
k
∙ F
∙ Y
4with
SRT : sludge retention time [d]
Using the previous default settings, the STP has a mode of operation as
characterized in Table 9. This mode of operation is typical for an average STP in Western Europe that predominantly treats communal wastewater. Such an STP has concentrations of suspended solids in settled sewage (sewage after primary sedimentation), activated sludge and effluent as visualized in Figure 2. The corresponding flows of solids per capita per day are given in Figure 3.
Figure 2 Solids concentration (mg/L) in the distinguished basins of an STP equipped with a primary clarifier
Figure 3 Solids flow (gram dry weight per inhabitant per day) in an STP equipped with a primary clarifier
primary settler aeration tank solids liquid separator
primary sludge
raw sew age settled sew age effluent
activated sludge
= steady state concentration suspended solids
4000 450 150 4000 7.5 60 2.7 1.5
primary sludge w asted sludge
net sludge decay
effluent
primary settler aeration tank solids liquid separator
90
30
Table 9 Characterization of the activated sludge process with kSLR = 0.1 kg
O2∙kg-1∙d-1 and default values according to Tables 1 and 2
symbol Meaning units default
FBODrem Fraction BOD removed in activated sludge
process
- 0.915
YBOD Sludge growth kg∙kg BOD-1 0.777
SU Wasted sludge (surplus sludge) kg∙d-1∙PE-1 0.026
3
Definition of the modelled chemical
A set of inter-media equilibrium partition coefficients is a part of the required input parameters of the modelled chemical. Measured inter-media equilibrium partition coefficients are preferred over data estimated using methods based on compound properties. In most cases, however, measured data are not available. The equilibrium partition coefficient, which is the ratio of equilibrium
concentrations, is a parameter that is indispensable to the derivation of intermedia transport rates. This net transport occurs across the boundary of adjacent media if concentrations are not in equilibrium. SimpleTreat is a non-equilibrium, steady state box-model.
In a second paragraph, the so-called base-set properties are given. An
explanation is given on how to use them as input parameters for the model. The set contains basic physico-chemical properties, as well as the outcome of a standardized biodegradability test. This paragraph elucidates how these base-set data are processed in the model calculation to derive surrogate equilibrium partitioning coefficients if measured partition data for the chemical are not available.
3.1 Equilibrium partitioning constants
Variables involved in the definition of relevant equilibrium partitioning
coefficients or constants are given in Table 10. Equilibrium partitioning constants that are used for the calculation of inter-media transport rates of the chemical in an STP environment are given in Table 11.
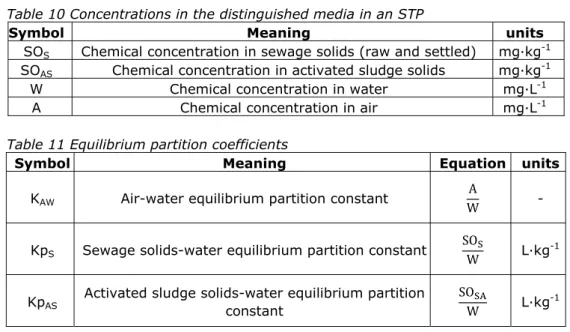
Table 10 Concentrations in the distinguished media in an STP
Table 11 Equilibrium partition coefficients
An alternative partition parameter for air-water is Henry’s law constant (H), which is the equilibrium ratio of the vapour pressure of a chemical and the concentration in the water phase:
H
P ∙ MW
W
R ∙ T ∙ K
5Symbol Meaning units SOS Chemical concentration in sewage solids (raw and settled) mg∙kg-1
SOAS Chemical concentration in activated sludge solids mg∙kg-1
W Chemical concentration in water mg∙L-1
A Chemical concentration in air mg∙L-1
Symbol Meaning Equation units
KAW Air-water equilibrium partition constant WA -
KpS Sewage solids-water equilibrium partition constant
SO
W L∙kg
-1
Henry’s law constant, H, has dimensions of Pa∙m3∙mol-1.P is the vapour pressure
in Pascal (Pa) of the chemical in equilibrium with the aqueous concentration W, MW is the molecular weight of the chemical in g∙mol-1, R is the gas constant
(8.314 J∙K-1∙1R -1) and T is the absolute temperature (K). K
AW is also known as
the dimensionless Henry constant.
3.2 Estimation methods for equilibrium partitioning constants
3.2.1 3.2.1. Neutral organic chemicals
From base-set data (Table 12) the air-water equilibrium partition coefficients of organic chemicals is estimated according to:
K
H
R ∙ T
VP ∙ MW
SOL
R ∙ T
6
Table 12 Base-set data of a chemical
symbol Meaning Units
MW Molecular weight g∙mol-1
SOL Water solubility mg∙L-1
VP Vapour pressure Pa
Kow Octanol-water partition coefficient -
For the partitioning of the chemical between solids and the aqueous phase, a simple relationship is applied:
Kp
foc ∙ Koc
7with
Kp : partition coefficients [L∙kg-1] for sewage (Kp
S) or activated sludge (KpAS)
Koc : partition coefficient for organic [L∙kg-1]
foc : fraction organic carbon solids, focS or focAS [-]
This relationship reflects that Kp depends on 1) a property of the environment, i.e. the organic carbon fraction (foc) of the particles in raw sewage and activated sludge and 2) a property of the chemical, the organic carbon partition coefficient (Koc), also known as the “organic carbon normalized partition coefficient”, Kp/foc. The value of the foc of the solids in raw sewage (0.3) and activated sludge (0.37) is considerably higher than is assumed in the real world, where the fraction foc in soil is 0.02, in sediment 0.05 and in suspended solids equals 0.1 (TGD, 2003).
Koc was initially estimated through a simple proportionality relationship with a substance property Kow, the octanol-water partition coefficient. Kow is equal to CO/CW, being the concentration of the neutral chemical in octanol (CO) divided by
the concentration of the neutral chemical in water (CW). The Kow is part of the
base-set data of a chemical used as input in SimpleTreat (Struijs et al., 1991; Struijs, 1996). In the last revision of SimpleTreat in 2003, the equation of Sablic and Güsten (1995) was introduced for chemicals that are predominantly
hydrophobic:
Unlike rules for estimating the bio-concentration potential from Kow, which is limited by the molecular weight of 700 (TGD, 2003), the applicability range of the relationship between Kp and Kow is wide. Nevertheless, special structural properties related to, for example, amphiphilic substances (surfactants) or dissociating substances (organic acids, bases) may lead to multiple equilibrium processes.
3.2.2 Organic acids and bases
For an acid HA, dissociation results in two species, the neutral HA and the negatively charged A-:
HA ↔ H
A
The acid dissociation constant (Ka) is defined as:
Ka
H ∙ A
HA
9The neutral fraction of the chemical (Fna) depends on the pH and pKa (negative
logarithm of Ka) and is calculated according to:
Fn
HA
HA
A
1
1
10
10he ionized fraction of an acid (Fia) is equal to 1-Fna.
The neutral fraction of an organic acid (Fna) is calculated from property pKa
according to equation 10. In all STP basins, the pH is assumed to be equal to 7. An organic base (B) dissociates according to:
B H O ↔ BH
OH
with base dissociation constant:
Kb
BH ∙ OH
B
11The conjugated acid of an organic base (B) dissociates according to:
BH ↔ B
H
with a dissociation constant (Ka) of the conjugated acid which now looks like:
Ka
B ∙ H
The pKb (negative logarithm of Kb) of base B can be calculated from the pKa of its conjugated acid (BH+) and pKw. The latter is the negative logarithm of the
ion product of water, Kw (Henderson 1908):
H O ↔ H
OH
Kw
H ∙ OH
13The pKw is dependent on the water temperature according to:
pKw
25.35757
0.03818 ∙ T
14with the water temperature, Twater, in K. At ambient temperature (20 ˚C), pKw is
approximately 14. The sum of pKb and pKa equals pKw. The fraction of neutral species for an organic base Fnb is:
Fn
B
B
BH
1
1
10
15The ionized fraction of a base (Fib) equals 1-Fnb.
For monovalent organic acids or bases, the fraction of neutral species is determined on the basis of one input parameter, i.e. the acid dissociation constant Ka. It is the dissociation constant of either an acid which is neutral or the dissociation constant of the ionized conjugated acid of a base:
Fn
1
1
10
∙ 16In the case of acids, γ equals 1 and, in the case of bases, γ is -1. This equation is known as the Henderson-Hasselbach equation (Henderson 1908). Ionizable organics are present as neutral and charged species in fraction according to input substance parameters γ and pKa and an environmental characteristic pH. Only the neutral molecule of acid HA or base B is available for transport across the water-air interface. The equation for Kaw (eqn 17) can be applied for the neutral fraction (eqn 16) at pH equal to 7 for the aqueous phase in an STP. Only the neutral chemical can cross the boundary between air and water, implying that the ionized fraction is not available for volatilization. This seems a valid assumption and the only fate process for ions would be advective transport through water and biodegradation in water and possibly sorption to suspended particles. For estimating the equilibrium partitioning of an organic acid or base between air and water, this may be correct. For an organic acid and an organic base, this would give an equilibrium partition coefficient KAW that depends on the fraction neutral (Fn) of the acid or of the base:
K
H
R ∙ T
∙ Fn
VP ∙ MW
SOL
R ∙ T
∙ Fn
17
Sorption to sludge, however, is complicated by the fact that ions may also adsorb to sludge solids due to, for example, electrostatic interactions. Therefore, it is unlikely that the solids-water partition coefficient for the ionic fraction is equal to zero.
For acids and bases, Franco et al. (2013a) recently proposed an alternative
calculation of Koc. For organic acids, they derived an equation for Koc as a function of Kow and Ka applicable to soil and sediments. They concluded that this equation is also applicable to sludge solids:
Koc
Fn ∙ 10
. ∙ .1
Fn ∙ 10
. ∙ . 18where Fn is the fraction of neutral species, calculated at pHopt = pHactual-0.6
(Franco et al. 2009). Kow is the octanol-water partition coefficient of the neutral species. Default pHactual is 7.
For organic bases, Franco et al. (2013a) were aware of the fact that the equation
for Koc for soils and sediments would not necessarily prove satisfactory for sewage and activated sludge solids. The generally high Koc values observed for cations and the statistically significant correlation with Kow resulted in a simple regression based on Dow. The Dow of an organic compound is the apparent octanol-water partition coefficient at the actual pH and includes concentrations in octanol and water (superscript o and w, respectively) of both the neutral (subscript n) and ionized (subscript ion) of the chemical:
Dow
C
C
C
C
Fn ∙
1
Fn ∙
Fn ∙ Kow
1
Fn ∙ Kow ionized ≅ Fn ∙ Kow
19
In equation 19, the approximation is made that the concentration of an ionized organic compound in the octanol phase is virtually zero and that Kow(ionized) is negligible. ECETOC (2013) and Franco et al. (2013a) proposed a regression for
Koc of monovalent bases with pKa ≥ 4:
Koc
10
. ∙ . 20This equation is the preferred default in SimpleTreat 4.0. If, however, Dow is not given but only Kow is known, i.e. the octanol-water partition coefficient
experimentally determined at a pH at which the chemical is predominantly in its neutral form, then Dow is estimated as Fn∙Kow (see eqn 19).
4
Description of the model
The model structure of SimpleTreat has not changed with respect to version 3.1. It is a multimedia model of the fate of a chemical (Figure 4) submitted to the following processes: advection, depicted as open arrows which represent media flows, intermedia transport (two-headed arrows) and degradation (curved arrows).
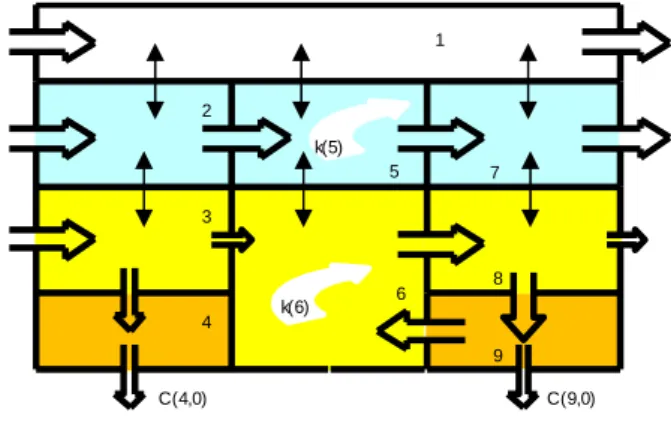
Figure 4 Box representation (“9-box”) of the chemical fate in a sewage treatment plant which combines primary sedimentation and the activated sludge process (Struijs, 1996)
Nine of the fifteen media flows are flows of particles, suspended or settled, carrying the adsorbed chemical from outside the system (0,j), from box i to box j or out of the system (i,0). The product of the media volume flow and the concentration of the source box is the irreversible media mass flow (g∙s-1). The
two-headed arrows represent reversible or diffusive transport between adjacent media, such as air-water and solids-water. Rate and direction of the net diffusive
mass flow (XCHi,j∙Ci in g∙s-1) is driven by non-equilibrium concentrations. Curved
arrows stand for the disappearance of the chemical in boxes 5 and 6 (the aqueous and the suspended solids phase in the aeration tank), implying that a chemical is solely biodegraded in activated sludge.
Steady state concentrations (dCj/dt = 0) are obtained from multiple mass
balance calculation by solving nine linear equations according to:
V ∙
dC
dt
k ∙ C ∙ V
ADV
,∙ C
XCH
,∙ C
21with
ADVi,j : flow rate of media [m3∙s-1] from box i to box j, advective, irreversible
XCHi,j : flow rate of media [m3∙s-1] from box i to box j, diffusive, reversible
Vj : volume of box j [m3]
Ci : concentrations in box i [g∙m-3]
C0,j : concentration in medium j outside the system
Ci,0 : concentration in medium i flowing out of the system (air, water or solids)
t : time [s]
ki : first-order biodegradation rate constant in box i [s-1] C(1,0) C(7,0) C(8,0) 1 2 3 4 5 6 7 8 9 C(0,2) C(9,0) C(4,0) C(0,3) primary
sedimentation aeration tank
secondary clarifyer k(5)
In the next chapters, expressions for the media flow rates ADV and XCH are derived. In Appendix A, expressions for all Vi, ADVi,j and XCHi,j are given.
In Appendix B, figures, equations and default values are given for an STP without primary clarifier, the so-called “6-box” scenario.
5
Chemical fate processes
A subdivision is made into three categories of processes. First, there is advective transport of a medium carrying the chemical with it. This chemical fate process is irreversible. Second, there is diffusive (reversible) intermedia transport which is driven by non-equilibrium concentrations in adjacent media, tending to the direction of equilibrium. The third type is first-order degradation. This process occurs inside a medium. Processes related to water and solids occur in three separate basins which are interconnected in a special way. Transport of solids is rather complex due to sludge recycling, sludge growth or sludge decay in the activated sludge process. Depending on the mode of operation of an STP, the volume of the suspended solid phase in the aerator may increase due to microbial growth or decrease due to sludge decay. Solids are withdrawn from different basins. There are two types of solids, each with their specific properties – such as specific density and the fraction of organic carbon: 1) sewage (raw or settled) and primary sludge and 2) activated sludge suspended in the aerator – in the solids-liquid separator and in effluent and in wasted or surplus sludge.
5.1 Advective transport
Three types of media flows (m3∙s-1) are distinguished. An air column moves
across the sewage treatment plant, carrying the chemicals in the gas phase away. A volume of water enters the primary clarifier of an STP. This volume passes the three basins connected in a series. Water leaves the installation via the secondary clarifier (solids-liquid separator). The flow of water causes transport of the dissolved chemical through the three basins. The flow of solids, also in m3∙s-1, causes import, transport inside the system and export of the
chemical in the adsorbed state. Advective transport coefficients (ADV) are not dependent on the chemical. For all media (air, water and solids), volume flow rates are formulated from which “media mass flow rates” (g∙s-1) are derived by
multiplying the volume flow rate with the concentration in the source medium (g∙m3). The area of a basin (AREA) is proportional to the number of inhabitants
(N). According to Tables 5 and 8, the areas for the three basins PS, AS and SLS are expressed in area per person (m2∙he-1).
5.1.1 Air
Air advection depends on the wind speed (WS), the air mixing height (h) and the sum of areas of the three basins. In Table 13, default values are given. The advective volume flow rate for the air compartment, ADVair, is proportional to:
ADV
h ∙ WS ∙
AREA
AREA
AREA
22with
ADVair : air flow rate into or out of the area of an STP [m3∙s-1∙PE-½]
The advective volume flow rate for air depends on the plant’s mode of operation. This choice determines the area of the active sludge reactor (Table 7), which depends on the oxygen requirement determining the volume and thus the area of the aerator. The areas of the primary sedimentation tank and the solids-liquid separator depend only on the sewage flow per inhabitant Q as HRTPS and hPS and
advective flow rates are given per person (PE). The actual flow rates have to be multiplied by the number of personal equivalents connected to the STP, N, except for air, which should be multiplied by √N.
Table 13 Default parameters that define the air compartment of an STP
Symbol Meaning Units Value
WS Wind speed m∙s-1 3
h Air mixing height m 10
5.1.2 Water
The water volume flow rate (m3∙s-1
∙PE-1) into, inside and out of the installation is
considered proportional to the sewage flow, Q, according to:
ADV
Q
24 ∙ 3600
23All water volume flow rates in the system are equal (box 2, 5 and 7 in Figure 4).
5.1.3 Sewage solids
The volume flow rate of solids into, inside and out of the primary settler is shown by the following three equations:
ADV
SO
1000 ∙ d ∙ 24 ∙ 3600
24ADV
FS ∙ SO
1000 ∙ d ∙ 24 ∙ 3600
25ADV
1
FS ∙ SO
1000 ∙ d ∙ 24 ∙ 3600
26with ADVsolids in m3∙i-1, SO in kg∙d-1∙1S-1, dS in kg∙L-1 and dimensionless FS
shown in Tables 1 and 2. The volume flow rate of primary sludge solids results from primary sedimentation, which is equal to the fraction FS of volume flow rate related to the inflow of raw sewage. The remaining fraction of solids (1-FS) flowing into the aerator, is related to suspended solids in settled sewage.
5.1.4 Activated sludge solids
The fixed values for the volume flow rate of activated sludge solids from the aerator into the solids liquid separator is equal to:
ADV
Q ∙ C
,1000 ∙ d ∙ 24 ∙ 3600
27with CSO,AS (kg∙m-3) and dAS (kg∙L-1) as shown in Table 6. For the solids leaving
ADV
Q ∙ C
,1000 ∙ d ∙ 24 ∙ 3600
28with CSO,SLS (kg∙m-3) shown in Table 6. The volume flow rate of surplus sludge or
wasted sludge solids is:
ADV
SU
1000 ∙ d ∙ 24 ∙ 3600
29with SU in kg∙PE-1∙d-1 as calculated according to Table 9. Both ADV
effluent solids and
ADVsurplus solids reflect the solids emission, expressed as volume flow rates, by the
activated sludge process. The equation for ADVactivated sludge solids is part of the
internal sludge recycling. There are two other flows of activated sludge solids. The difference in solids volume flow rates between the activated sludge inflow (eqn 27) and the effluent solids outflow (eqn 28) is equal to the sedimentation rate in the solids liquid separator expressed as solids volume flow rate:
ADV
ADV
ADV
30Recycling of the sludge solids (return sludge) is the difference between sedimentation and the production of wasted (surplus) sludge (see Figure 4):
ADV
ADV
ADV
315.2 Diffusive transport
Diffusive transport processes are driven by non-equilibrium concentrations in adjacent phases. In the model, these are the solids-water and air-water interphases. Partition coefficients for solids-water (Kp) and air-water (KAW) are
input parameters necessary to quantify the extent to which the actual
concentrations deviate from the equilibrium concentration. Diffusive transport across the interphase is proportional to the departure from the equilibrium concentration. Also, for diffusive transport, volume flow rates (symbol XCH) are derived in m3∙v-1. XCH is called the mass transfer coefficient, which has to be
multiplied by the concentration in the source phase (in g∙m-3) to obtain the mass
flow (g∙s-1). Diffusive mass flows should be evaluated for both directions, i.e.
both XCHi,j for transport from i to j and XCHj,i for transport from medium j to
Table 14 Fixed parameters for deriving diffusive volume flow rates (Mackay et al., 1985)
Table 14 contains fixed rate constants required for deriving diffusive volume flow rates. The first-order rate constants for sorption and desorption in this table are derived from a half-life of one hour for uptake by suspended particles (sorption) or clearance (desorption) in the primary settler and the solids-liquid separator. This figure was applied by Mackay et al. (1985) for (de)sorption processes in suspended particles in natural freshwater systems. The primary clarifier and the solids-liquid separator considered here are lakes or lagoons. The activated sludge reactor, however, is a heavily aerated system and therefore (de)sorption is assumed to be significantly faster. It is assumed that the half-life is a factor of ten lower, i.e. 0.1 hour. This half-life is fairly well in agreement with the data obtained by Dobbs et al. (1989) through experiment. They observed equilibrium in approximately one hour.
Table 15 Dependent parameters for deriving diffusive volume flow rates
The volumes of the suspended solids phases in Table 15 are calculated according to (default) values in Tables 1 to 9.
5.2.1 Non-equilibrium at the suspended solids-water interphase
Interphase transport is reversible and the volume flow rates have to be evaluated for both directions across the interphase. In Table 16, the diffusive volume flow rates (XCH) are listed. XCH is a reversible diffusive volume flow rate and, in the equations for XCH partition, coefficients of the chemical (KpS and
KpAS) appear which are related to a chemical property.
5.2.2 Reversible air-water transfer without aeration
Diffusive transport to air is thought to occur exclusively from the water phase. The NEUTRAL chemical is available for volatilization processes only if it is purely dissolved. The rate of these processes depends on how far the actual
symbol Meaning Units Value
kPS First-order rate constant for (de)sorption in PS s-1 1.925∙10-4
kSLS First-order rate constant for (de)sorption in SLS s-1 1.925∙10-4
kAS First-order rate constant for (de)sorption in AS s-1 1.925∙10-3
Kair Mass transfer coefficient in air m∙s-1 2.78∙10-3
Kwater Mass transfer coefficient in water m∙s-1 2.78∙10-5
Symbol Meaning Units Equation Value
VPS Volume of suspended solids in PS m3∙PE-1
VOL ∙ C
,1000 ∙ d
1.67∙10-6VAS Volume of suspended solids in AS m3∙PE-1
VOL ∙ C
,1000 ∙ d
2.95∙10-4VSLS Volume of solids in SLS m3∙PE-1
VOL
∙ C
,concentrations deviate from the equilibrium concentrations in air and water. Both in the primary clarifier and in the solids liquid separator, air-water
transport is simulated using a two-layer model. A gas phase resistance in series with a water phase resistance was applied by Liss & Slater (1974) and extended by Mackay & Leinonen (1975). According to Mackay et al. (1985), expressions for XCH are formulated in Table 17 for volatilization/gas absorption in basins without engineered aeration. For the aerator, the mass transport coefficients in Table 17 are considered baseline transport coefficients, reflecting (reversible) mass transfer as if the aeration basin is a lake or lagoon.
Table 16 Mass transfer coefficients at the solids water interphase (m3∙s-1∙PE-1)
Symbol Equation XCHwater-solids PS
k
1
VOL
V ∙ Kp ∙ d
1
XCHsolids-water PSk
Kp ∙ d
VOL
V
1
XCHwater-solids ASk
1
VOL
V ∙ Kp
1
∙ d
XCHsolids-water ASk
Kp
∙ d
VOL
V
1
XCHwater-solids SLSk
1
VOL
V
∙ Kp
1
∙ d
XCHsolids-water SLSk
Kp
∙ d
VOL
V
1
5.2.3 Reversible air-water transfer due to aeration
In addition to baseline mass transfer in the aeration tank, shown in Table 17, air-water exchange of chemicals in the aerator is enhanced by engineered aeration. The expressions for the aerator in Table 17 may be regarded as the minimal mass transport coefficient for air-water exchange. At least for chemicals with a volatility higher than H = 50 Pa∙m3∙mol-1, aeration causes increased
removal rates due to stripping. The two types of stripping processes
distinguished in SimpleTreat are surface aeration and bubble aeration. Several expressions for first-order rate constants have been reported.
Surface aeration. Roberts et al. (1984) derived an expression for the first-order rate constant for surface aeration. They ignored the correction for the gas phase resistance and instead considered a proportionality constant equal to 0.6 to be satisfactory. This is, however, appropriate for volatile chemicals. This
approximation has been shown adequate only if H exceeds 250 Pa∙m3∙mol-1
(KAW = 0.1). This means that liquid layer resistance controls the rate of
factor accounting for the gas phase resistance (GPC) for chemicals with H < 250 Pa∙m3∙mol-1, would have the following form:
k
GPC
OxReq
3600 ∙ HRT ∙ ∆O
32with
ks : first-order transfer rate constant for surface aeration [s-1]
Table 17 Mass transfer coefficients at the air-water interphase without aeration (m3∙s-1∙PE-1). Subscript NA (no aeration) is used here to refer to the
activated sludge reactor without engineered aeration.
Symbol Equation XCHwater-air PS
AREA
1
K
∙ K
K
1
XCHair-water PSAREA
1
K
K
K
XCHwater-air NAAREA
1
K
∙ K
K
1
XCHair-water NAAREA
1
K
K
K
XCHwater-air SLSAREA
1
K
∙ K
K
1
XCHair-water SLSAREA
1
K
K
K
In Table 18, values are given according to the aeration regime. The parameters HRTAS and OxReq are are dependent on the operation mode of the STP and are
shown in Table 7. The gas phase resistance correction, recommended by Munz & Roberts (1989), depends on the air-water partition coefficient KAW of the
chemical:
GPC
k a
k a ∙ K
k a
k a ∙ K
1
33The mass transfer rate constants kGa and kLa are given in Table 18. They are
and the air mixing height (Table 13) and as the quotient of Kwater (Table 14) and
the depth of the aeration basin (Table 6), respectively.
Table 18 Default parameters required to compute water-air exchange in an aerated system
Applying the equation for GPC, instead of the factor of 0.6, extends the validity kS to chemicals with H < 250 Pa∙m3∙mol-1 (KAW < 0.1) when the gas phase
resistance has to be taken into account.
Bubble aeration. If oxygen is supplied by bubble or diffuse aeration, the first- order rate constant of air-water exchange proposed by Hsieh et al. (1993) is applied in the SimpleTreat model:
k
8.9 ∙ 10
G
VOL
H
. 34with
kb : first-order transfer rate constant for bubble aeration [s-1]
This expression is almost similar to the relationship given by Blackburn et al. (1984), used in an earlier version of SimpleTreat. Note that through VOLAS
(Table 8) the rate constant kb is not only dependent on the sludge loading rate
but also on the presence (or not) and mode of operation of the primary clarifier.
Table 19 Mass transfer coefficients at the air water interphase of an aerated activated sludge reactor (m3∙s-1∙PE-1), either by surface aeration (k
s) or by bubble aeration (kb) Symbol Equation XCHwater-air aeration k, 1 VOL AREA 1∙ h ∙ K XCHair-water aeration k , K VOL AREA1 ∙ h
Symbol Meaning units Value
∆O2 Coxsat-CoxAS kg O2∙m-3 0.007
Coxsat Saturation O2 concentration kg O2∙m-3 0.009
CoxAS Actual O2 concentration in activated sludge kg O2∙m-3 0.002
kGa Gas phase mass transfer rate constant s-1 2.78∙10-4
kLa Liquid phase mass transfer rate constant s-1 9.27∙10-6
Engineered aeration combined with baseline volatilization and gas absorption Mass transfer coefficients for mechanical or bubble aeration are given in
Table 19. These are added to mass transfer coefficients for baseline volatilization and gas absorption (Table 17) to obtain the overall mass transfer coefficient for volatilization of the chemical:
XCH overall XCH XCH 35
and for gas absorption:
XCH overall XCH XCH 36
Mikkelsen (1995) also proposed calculating the overall interphase transfer rate constant as the sum of surface volatilization/gas absorption and stripping. For a given sludge loading rate, the air-water interphase mass transfer coefficient (XCH) is plotted versus KAW in Fig 5. Mass transfer coefficients for volatilization
and gas absorption without aeration are higher than for surface or bubble aeration for KAW < 0.025.
With inserted parameters that are typical for an activated sludge reactor (G, ∆O2
etc.), surface aeration is more efficient than bubble aeration up to KAW = 1.
Figure 5 shows interphase transfer coefficients applied in SimpleTreat 4.0. This figure shows that combined transfer coefficients with surface aeration (black) are higher than for bubble aeration (blue) if Kaw is below 1.
Figure 5 Surface aeration compared with bubble aeration in the activated sludge reactor. The overall mass transfer coefficients are plotted versus KAW
5.3 Degradation processes
In activated sludge. Although, before the chemical enters an STP, it can be degraded and this process can also occur in the primary clarifier, it is assumed that elimination through degradation can only occur in the aeration tank. In the
10‐8 10‐7 10‐6 10‐5 10‐4 10‐3 0.0001 0.001 0.01 0.1 1 10 KAW XCHwater‐air surface aeration XCHair‐water surface aeration XCHwater‐air bubble aeration XCHair‐water bubble aeration XCH (m3 s‐1 PE‐1)
activated sludge reactor, the degradation process can occur in the water phase only or in both the water and solids phases according first-order kinetics. If the half-life of a chemical in activated sludge (t½a) is measured, for example,
by means of a test guideline OECD 314, the first-order rate constant (kAS) is
calculated according to:
k
k
ln 2
t½
37By converting the units of kAS water and kAS solids from reciprocal hours or days into
reciprocal seconds, the first-order degradation rate constants in box 5 (water) and box 6 (activated sludge solids), k5 and k6 respectively, are derived (see
equation 21). If measured half-lives are not available, the first rate constant of the chemical in the aqueous phase of activated sludge, kAS water, is estimated on
the bases of test results according to the OECD 301 series as described in a guidance report (Struijs, 2014). In SimpleTreat 4.0, rate constants by the TGD (2003) are suggested (Appendix E).
The anaerobic digester. Nowadays, most STPs are equipped with an anaerobic digesting installation. Combined sludge is transferred to anaerobic digesters (flow indicated as number 8 in Figure 2) which most often operate as batch or plug-flow systems with a rather long residence time (RT) of 30 to 60 days. Anaerobic biodegradation is particularly relevant for chemicals with a high solids-water partition coefficient. A first-order rate constant for anaerobic biodegradation cannot be entered into the box-modelling system directly. Instead, the half-life for elimination of the chemical in the anaerobic digester is applied to calculate an attenuation factor for the concentration of the chemical in combined sludge. The chemical concentration in combined sludge multiplied by this factor yields the chemical flux via solids that reaches the soil. This
attenuation factor is the anaerobic reduction factor (ARF) due to anaerobic biodegradation processes in the digesting tank. It depends on the measured residence time (ResdT) and is a function of the measured half-life (t½an):
ARF
2
½ 38The model does not perform this calculation. The user has to evaluate ARF from ResdT and t½an.
5.4 Chemical loading via the sewer
A chemical with property KpS enters an STP of size N person equivalents (PE)
through both the aqueous phase and the solids phase. If the discharge rate of the chemical is E kg per day, the nominal concentration, distributed over the aqueous phase and the particle phase is given in Table 20.
Table 20 Chemical loading and concentrations in water and solids entering an STP serving N inhabitants.
In the model, concentrations in only two media in sewage are defined, i.e. the aqueous phase and the solids phase of raw sewage (Figure 4):
C 0,2
W
39C 0,3
SO
40The concentrations in media flowing out of the system are given as C(i,0) in Figure 3. However, these concentrations are equal to the steady state concentrations in box i.
Symbol Meaning Units Equation
E Emission rate of the chemical kg∙d-1 -
Co Nominal concentration of the chemical
in raw sewage g∙m3
E ⋅ 1000
Q ∙ N
WS Concentration in sewage in aqueous medium g∙m-3
Co
1
Kp ∙
SO
Q ∙
1000
1
Ss Concentration in sewage associated
with solids g∙m-3
Co
Ws
SOS Concentration in sewage solids (dry weight) mg∙kg-1
Co ∙ Kp
1
Kp ∙
SO
Q ∙
1000
1
SOS VOL
Concentration in sewage solids medium
(dry weight)
g∙m-3
Co ∙ Kp ∙ d
1
Kp ∙
SO
Q ∙
1000
1
6
Model output
The concentration (in units of g per m3 medium) in medium i flowing out of the
system (Ci,0) is the primary output of the box model computation. There are
5 concentrations which are used as follows: 1. Directly:
a. the concentration in air can be used to assess occupational,
b. primary sludge and secondary sludge in g per m3 dry weight (is equal to
mg per L dry weight). Most often these concentrations are converted into units of mg chemical per kg dry matter by multiplying with the density of dry matter (dS or dAS in kg per L).
2. To obtain derived concentrations
a. Concentration in combined sludge: primary and secondary (wasted) sludge;
b. Concentration in digested sludge;
c. Concentration in activated sludge (mixed liquor);
d. Concentration in effluent (combined dissolved and sorbed to particles). 3. Multiplied by the appropriate advective flow rates (ADVi,0) to obtain
a. Absolute chemical mass fluxes to air, water and soil in appropriate units; b. Relative chemical mass fluxes (%).
6.1 Emission to air
The fraction of the chemical emitted to air (Eair) by an STP of the size of N
inhabitants is:
E
3600 ∙ 24 ∙
C ∙ ADV
,∙ √N
1000 ∙ E
416.2 Emission to water
The total concentration (CT in mg∙L-1) in effluent discharged into the receiving
water body is:
C
C
C ∙
C
,1000 ∙ d
42The concentration in effluent suspended solids is C8/dAS (mg∙kg-1).
The fraction (Eeff) of the chemical input that leaves an STP serving N inhabitants
via effluent is:
E
C ∙ Q ∙ N
6.3 Emission via combined sludge
Without anaerobic treatment of the combined sludge, the fraction (Esludge) of the
chemical leaving an STP of N people equals
The concentration in combined sludge (Ccs in mg/kg dry weight) equals
E
C ∙ ADV
,C ∙ ADV
,1000 ∙ E
∙ N
FS ∙ SO
1000 ∙ d ∙ C
1000 ∙ d ∙ C
SU
1000 ∙ E
∙ N
446.4 Emission via digested sludge
With anaerobic treatment of combined sludge, the anaerobic reduction factor (ARF) has to be taken into account for the fraction of the chemical emitted by digested sludge:
E
ARF ∙ E
46The user has to calculate Edig sludge from model output Esludge and the manually
computed ARF.
The concentration of the chemical in digested sludge (CDS in mg/kg dry weight)
is determined by the concentration in combined sludge (CCS), the anaerobic
reduction factor (ARF) and the reduction of the dry weight volume of the combined sludge due to conversion into CO2 and methane. It is assumed that
that this volume is reduced by 50 %:
C
ARF ∙ C
0.5
47The user has to calculate CDS from model output CCS and ARF, the latter is
manually computed.
6.5 Concentration in activated sludge
The total concentration (CT act sl in mg∙L-1) in activated sludge, i.e. the slurry also