RIVM letter report 2020-0165 P.M.F. van Breemen et al.
Colophon
© RIVM 2020
Parts of this publication may be reproduced, provided acknowledgement is given to the: National Institute for Public Health and the Environment, and the title and year of publication are cited.
DOI 10.21945/RIVM-2020-0165 P.M.F. van Breemen (author), RIVM J. Quik (author), RIVM
E. Brand (author), RIVM P.F Otte (author), RIVM
A.M. Wintersen (author), RIVM F.A. Swartjes (author), RIVM Contact:
Peter van Breemen
Duurzaamheid, Drinkwater en Bodem Peter.van.breemen@rivm.nl
This report was produced by order, and for the account, of the Ministry of Infrastructure and Water Management, within the framework of the NIBO programme
Published by:
National Institute for Public Health and the Environment, RIVM
Synopsis
CSOIL 2020: Exposure model for human health risk assessment through contaminated soil. Technical description
This report describes the CSOIL 2020 model, which calculates human exposure to soil contaminants throughout the entire human lifetime. Exposure can occur through, for example, consuming home grown vegetables and inhalation of soil particles during gardening. CSOIL 2020 is the most recent version of the CSOIL model, which was developed in 1995 and revised in 2000. The Government of The Netherlands uses the results of this model to determine soil quality standards.
CSOIL 2020 was updated to incorporate recent scientific knowledge and allow functionality under newer IT operating systems. Additionally, the exposure results from CSOIL can now be used in the newest version of the risk toolbox for soil (in Dutch: Risicotoolbox Bodem). The toolbox is used to determine whether soil can safely be (re-)used. New modules are currently under development to allow the toolbox to be used in the Environment and Planning act, which will enter into force on the first of January 2022.
Contact with contaminants in soil can be damaging to human health. Information on the extent of human exposure is required to determine the risk to health. CSOIL determines the exposure on the basis of the type of soil use on a location, like ‘Residential with garden’, the
properties of the contaminant, such as solubility, and the local situation.
Keywords: CSOIL 2020, health risk limit, exposure model, human risk assessment
Publiekssamenvatting
CSOIL 2020: blootstellingsmodel voor gezondheidsrisico’s door bodemvervuiling. Technische beschrijving
Dit rapport beschrijft de update van het blootstellingsmodel CSOIL 2020. Met dit rekenmodel wordt berekend in welke mate mensen gedurende hun hele leven blootstaan aan bodemvervuiling. Dat kan bijvoorbeeld door groente en fruit uit eigen tuin te eten of gronddeeltjes in te slikken als ze in de tuin werken. Het RIVM heeft dit model, dat in 1995 is ontwikkeld en in 2000 is herzien, nu geactualiseerd. De overheid gebruikt het CSOIL-model om de normen voor de kwaliteit van de bodem te bepalen.
Door de update sluit CSOIL 2020 aan op nieuwe
ICT-besturingssystemen en wetenschappelijke kennis. Ook kan het model hierdoor aansluiten op de nieuwste versie van de Risicotoolbox Bodem, die de blootstellingsberekeningen van CSOIL gebruikt. Met deze toolbox kan worden bepaald of de grond veilig mag worden (her-)gebruikt. De toolbox wordt op dit moment uitgebreid met andere tools zodat hij voor de Omgevingswet kan worden ingezet. Deze wet treedt, naar
verwachting, op 1 januari 2022 in werking.
Contact met stoffen uit een vervuilde bodem kan schadelijk zijn voor de gezondheid van mensen. Om te weten hoe groot het risico op
gezondheidseffecten is, is informatie nodig over de mate waarin mensen blootstaan aan een stof. Voor de blootstelling kijkt CSOIL 2020 welke functie een bodem op een locatie heeft, zoals wonen of natuur, en naar de eigenschappen van een vervuilende stof. Het samenspel van de functie van een bodem, de stofeigenschappen en de lokale situatie zoals de diepte van de vervuiling bepaalt de blootstelling. Een voorbeeld van een stofeigenschap is hoe makkelijk een stof oplost in water.
Kernwoorden: CSOIL 2020, risicogrenswaarden, blootstellingsmodel, humane risicobeoordeling.
Contents
Summary — 11 Reading guide — 131 Introduction — 15
1.1 Scope and objectives — 15
1.2 Exposure modelling — 16
2 Updates to the CSOIL 2020 model — 19
2.1 Dissociating contaminants — 19
2.2 Permeation — 19
Permeation of non-dissociating contaminants — 19 Permeation of dissociating contaminants — 19
2.3 Drinking water constant and drinking water usage — 19
2.4 Exposure through vegetable consumption — 20
Regression-based bio concentration factors for cadmium and lead — 20 Consumption rates of vegetables — 20
2.5 New input options — 20
2.6 Risk values for groundwater — 20
3 The CSOIL model — 23
3.1 Lay-out of the model — 23
3.2 Exposure pathways of the model — 23
3.3 Exposure scenarios — 25
Aggregated exposure pathways for contaminants in groundwater — 25
3.4 Calculation of the health-based risk limit — 26
4 Model concepts and parameters — 29
4.1 Partitioning soil, water & air — 29 Dissociating contaminants — 30
4.2 Constants, site parameters & partition parameters — 31
4.3 Soil transfer pathway — 33
Ingestion of soil particles — 33 Inhalation of soil particles — 34
Dermal uptake of soil contaminants — 36
4.4 Air transfer pathway — 38
4.5 Water transfer pathway — 40
Permeation of contaminants through water pipelines — 41 Drinking water — 41
Showering and bathing — 42
Direct consumption of contaminated groundwater — 44
4.6 Vegetable consumption pathway — 44
Uptake by roots and leaves — 46 Consumption rate of vegetables — 48
Soil re-suspension and rain splash (organic contaminants) — 48 Deposition of volatile contaminants (organic contaminants) — 48 Empirical and modelled BCF — 49
5 Human exposure — 51
5.2 Soil use scenarios — 52
Standard soil use scenario — 52 All soil use scenarios — 52
Parameters soil use scenarios — 54
5.3 Determination of risk indexes and risk values — 54
6 Abbreviations — 55
7 References — 57
1 Appendix 1 – Formulas — 61
1.1 Fugacity calculations — 61
1.2 Mass fraction calculations — 62
Organic and some inorganic contaminants — 62 Metals and some inorganic contaminants — 62
1.3 Dissociation — 63
1.4 Concentrations in air, water, and soil — 63
Organic contaminants in air — 63 Inorganic contaminants — 63 Metals — 64
Metals and organic contaminants in water — 64
1.5 Soil ingestion, inhalation, and dermal uptake — 65
Exposure through soil ingestion — 65
Exposure through inhalation of soil particles — 66 Exposure through dermal uptake — 68
1.6 Formulas Air transfer pathway — 71
Air flux from soil to crawlspace (indoor) — 71 Concentration in crawlspace and indoor air — 72 Air flux from soil to soil surface (outdoor) — 72 Dilution speed child, adult, plant (constant) — 73 Concentration in outdoor air — 74
Exposure through inhalation of indoor air — 75 Exposure through inhalation of outdoor air — 75
1.7 Permeation of contaminants into drinking water through
PE pipeline — 76
Concentration in drinking water — 76
Exposure through permeation in drinking water — 77 Concentration in bathroom air — 77
Exposure through inhalation of vapours during showering — 78 Exposure through dermal contact with drinking water during showering — 79
1.8 Vegetable transfer pathway — 80
Calculation vapour pressure of a Sub-cooled liquid (organic) — 80 Calculation of BCF for organic contaminants — 80
Concentration in vegetables — 83
Exposure through consumption of vegetables — 84
1.9 Aggregated exposure — 86
Aggregated exposure through inhalation — 86 Aggregated exposure oral and dermal — 86
2 Appendix 2 – Parameters of soil use scenarios — 91 3 Appendix 3 – New and updated functionality — 94
3.1 Implemented updates — 94
Dissociating contaminants (1) — 94
Permeation of contaminants based on permeation coefficient (2) — 94 Drinking water constant and drinking water usage (3) — 95
BCF Regression for lead and cadmium (4) — 95 Consumption rates of vegetables (5) — 96 New input options (6) — 97
3.2 Postponed updates — 98
Fugacity and dissociation (7) — 98 Dissociation and BCF (8) — 101
Permeation of contaminants into drinking water pipelines based on permeation factor (9) — 102
4 Appendix 4 – Contribution of exposure pathways to the total exposure for all contaminants in CSOIL — 105
Summary
This report describes the updated CSOIL 2020 model. CSOIL 2020 is a human exposure model that can be used to derive health risk limits for contaminants in soil. CSOIL 2020 was reprogrammed based on the CSOIL 2000 model (Brand et al., 2006) to implement new scientific developments, ensure compatibility with current operating systems and ensure CSOIL 2020 is ready for use when the Environment and Planning act (Government of the Netherlands, 2017) takes effect.
Contaminants in soil can present a risk to humans. This risk depends on the extent of human contact with the soil as well as the extent of
contamination and the toxicity of the contaminant. Exposure modelling combined with toxicity of the contaminant results in an expression of risk to humans, which can later be used by local and national authorities to formulate standards for use in legislation. In the Netherlands, the human exposure model CSOIL has been used for this task.
The CSOIL model was originally developed by Van den Berg (1995) and later revised by Otte et al. (2001) and Brand et al. (2006), which resulted in the CSOIL 2000 model (Brand et al., 2006). CSOIL 2000 is currently used in the Risk Toolbox Soil, which provides a framework for the safe (re-)use of soil. The CSOIL 2020 model will be used in an updated version of the Risk Toolbox Soil under the Environment and Planning act (Government of the Netherlands, 2017).
Exposure modelling and human risk
CSOIL 2020 determines the exposure of humans to contaminants in the soil based on human activities and site-specific characteristics. Human exposure to contaminants in soil occurs through different exposure pathways resulting from contact with various environmental
compartments (air, soil, water), and vegetables. Physicochemical properties of the contaminant combined with the type of soil use, such as living in a residential area with garden, determine the extent of exposure. The extent of exposure is expressed as a daily dose of contaminant to which an individual is exposed.
Toxicity studies for contaminants provide a Maximum Permissible Risk (MPR) to which humans can be exposed without experiencing any adverse effects. This Maximum Permissible Risk is expressed in a tolerable daily intake (TDI) or a tolerable concentration in air (TCA), depending on whether the exposure to the contaminant is oral, dermal, or respiratory. When combined with the extent of human exposure, this Maximum Permissible Risk provides information about the risks posed by a certain contaminant concentration in the soil.
Updates to the CSOIL model
Reprogramming CSOIL 2000 into a form compatible with new operating systems also provided the opportunity to implement new developments into the model. Most of the updates pertain to exposure pathways, however various updates were implemented in the fate modelling of CSOIL to enable input of ground water concentrations and future
compatibility with the Risk Toolbox Groundwater. The updated exposure pathways are: Consumption of vegetables from the garden, permeation into drinking water, and dermal exposure and exposure inhalation by showering and bathing.
Keywords: CSOIL 2020, health risk limit, exposure model, human risk assessment
Reading guide
This report describes the current state of the CSOIL model and contains an overview of updates performed to update the model. Chapter 2 describes the updates to the CSOIL model. Chapter 3 provides a general overview of the CSOIL model and its concepts. Chapter 4 provides a detailed description of the various exposure pathways, and chapter 5 describes the total human exposure and the soil use scenarios. Detailed descriptions of the updates to the CSOIL model and the formulas can be found in the appendixes.
1
Introduction
1.1 Scope and objectives
The project “NIBO” (Normen en Instrumentarium Bodem en
Ondergrond, in English “standards and risk assessment tools for soil and subsoil”) has the objective to ensure the soil standards and risk
assessment procedures are up to date and ready for deployment when the new Environment and Planning act (Government of the Netherlands, 2017) takes effect. The exposure model CSOIL contains exposure
calculations for the health risk assessment of contaminated soil. This report contains an up to date technical description including (technical) improvements, updates, and new functionalities of the CSOIL model. The CSOIL model, originally developed in 1995 (Van den Berg, 1995), was revised in 2001 (Otte et al., 2001) and a comprehensive description of the model was made in 2006 by Brand et al. (2006). CSOIL is
currently used by the Dutch National Institute for Public Health and the Environment (RIVM) to derive human risk limits for contaminated soil, and functions as a reference model for the decision support systems SANSCRIT (Otte et al., 2007) and other modules incorporated in the Risk Toolbox Soil (see figure 1.1). CSOIL was adapted to function with modules in the Toolbox such as the lead module (used to assess the risk of soil with diffuse contamination of lead), Volasoil (used to assess the risk of volatile contaminants evaporating into indoor air)(Bakker et al., 2008), and Sedias (Hin et al., 2010). CSOIL 2000 was programmed in an older version of excel (Microsoft Excel 97-2003), which is not fully compatible with current operating systems. Additionally, new scientific developments and greater data availability warranted a fresh
development cycle for CSOIL. CSOIL 2020 will be accessible through various tools in the Risk Toolbox Soil (RTB: www.risicotoolboxbodem.nl, Figure 1.1). The updates are described in this report, which gives a description of the CSOIL 2020 model and contains a detailed explanation of the updated functionality of the model.
Figure 1.1 The position of CSOIL in the risk toolbox soil and the future risk toolbox groundwater. For more information on the tools in the Risk Toolbox Soil visit www.risicotoolboxbodem.nl.
1.2
Exposure modelling
Due to the production and extensive use of various chemicals and products, (slightly) contaminated soils are now present in large parts of the Netherlands. Contaminated soil can pose risk to humans, plants and animals. The contaminants can accumulate in the ecosystem and may lead to human exposure by ending up in the human food chain (Bontje et al., 2005). However, other pathways, like soil ingestion, dermal contact, or inhalation, can also lead to human exposure. The risks related to human behaviour and soil contamination can be determined using exposure models. Ecological risks are not determined in CSOIL and will therefore not be discussed in this report.
Exposure modelling comprises a set of exposure pathways (inhalation, ingestion or dermal contact) through which contaminants can enter the human body. In essence, exposure models calculate the total human exposure to a contaminant, based on a contaminant concentration in the environment. Exposure is defined as the amount of a contaminant that enters the human body, expressed as contaminant mass, per unit of
body weight and time (mg.kgbw-1.d-1). In a subsequent step, total
exposure can be compared to the Maximum Permissible Risk to elucidate whether risk limits have been exceeded (Swartjes et al., 2013). The chosen set of exposure pathways depends on the aim of the model. An extensive model can include a high level of detail or a large number of pathways, but may not be practical as some exposure pathways may be uncertain or contribute little to nothing to the total exposure.
Nonetheless, taking the pathways with a low contribution under normal conditions to the total exposure into account does ensure these
pathways are included in the eventuality the pathways do contribute more greatly.
The human exposure model ‘CSOIL’ is embedded in the Risk Toolbox
SANSCRIT 3.0 VolasoilIndoor air
concentration
Resoil
Risk Toolbox Soil
Lead module Sedias
CSOIL 2020 CSOIL 2020 CSOIL 2020 CSOIL 2020 Volasoil Toolbox Tool Model Sanscrit 2.0 Transition policy CSOIL 2000 Concrit Building on contaminated soil CSOIL 2020 In development Risk Toolbox Groundwater CSOIL 2020 developmentIn
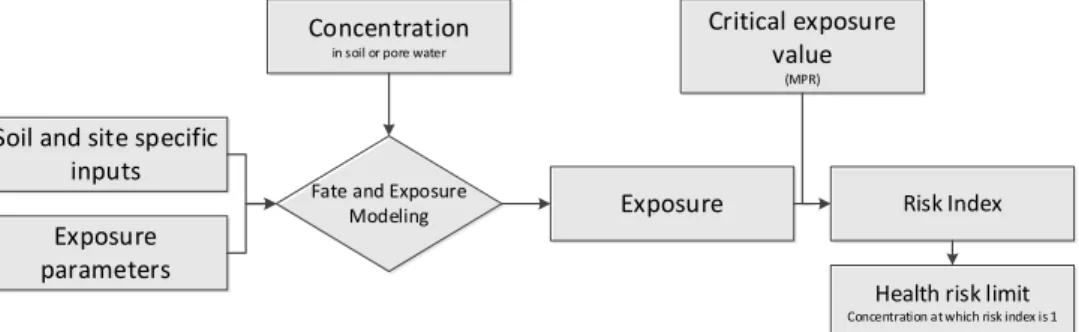
human exposure to a contaminant. The human health-based risk limit is the concentration in soil that corresponds to an exposure that equals the Maximum Permissible Risk. Figure 1.2 gives an outline of the derivation of the human health-based risk limit.
Concentration
in soil or pore water
Exposure Fate and Exposure
Modeling Risk Index
Critical exposure value
(MPR)
Soil and site specific inputs Exposure parameters
Health risk limit Concentration at which risk index is 1
Figure 1.2 Inputs and outputs for CSOIL 2020. Inputs in blue and outputs in green. The risk index is derived from a concentration and a Maximum
Permissible Risk. A health risk limit is the concentration at which the risk index is equal to one.
2
Updates to the CSOIL 2020 model
This chapter provides an overview of the updates made to CSOIL. The changes range from updated parameters to adapted exposure pathways. A detailed description of the changes as well as considerations can be found in appendix 3.
2.1 Dissociating contaminants
During the revision of CSOIL attention was placed on preparing the CSOIL model for assessing Contaminants of Emerging Concern (CECs), which sometimes exhibit different properties from the substances that were part of the CSOIL model up till now. Some of the CECs, such as PFAS (Per- and Poly-Fluorinated Alkylated Substances), are organic acids that are mostly dissociated in aqueous environments. Fate and exposure modelling for dissociating contaminants was introduced to CSOIL to enable more robust modelling of these types of contaminants. Some challenges however remain in the modelling of dissociating contaminants, like correcting the solubility values to represent the soil pH.
2.2 Permeation
Permeation of non-dissociating contaminants
The revision of the CSOIL model provided an opportunity for
harmonisation between CSOIL and the way permeation is modelled for non-dissociating contaminants by the Knowledge and Expertise Centre for Water (KWR). Harmonisation between the CSOIL 2020 model and the guideline on the application of piping materials in contaminated soil of the KWR (Meerkerk et al., 2017) was explored. However,
harmonisation between the models was postponed to allow for further exploration of uncertainties and further coordination with the KWR.
Permeation of dissociating contaminants
Dissociation plays a role in the amount of contaminant that can
permeate PE water pipelines. A study by Otte et al. (2016) attempted to develop a method to determine the extent of permeation based on substance parameters. However no definitive method could be
implemented into CSOIL. In CSOIL 2020 we assume that the dissociated fraction of a soil contaminant will not permeate into PE pipelines, and permeation does not occur at all into metal pipelines.
2.3 Drinking water constant and drinking water usage
The drinking water constant (dwconst) is a parameter consisting of several specific constants relevant to the concentration of contaminant in drinking water. These constants are the daily water use, the
dimensions of the water pipeline, and the stagnation time of water in the pipeline for an average (model standard) situation. The daily water use (CSOIL2000) was outdated and therefore revised to 126.3 liter per household per day (Vewin, 2017).
Additionally, the length of the water pipeline in contact with
meters in accordance with (Otte et al., 2016; Van der Schans et al., 2016). This concerns so-called PE connection pipes - the connection from the main water pipe to the house.
Moreover, the Vewin statistics provided updated values for water use during showering and bathing which is used to determine the respiratory and dermal exposure during showering and bathing (Vewin, 2017). Based on the Vewin statistics, water use for showering was set at 51 liter per day.
2.4 Exposure through vegetable consumption
Regression-based bio concentration factors for cadmium and lead
A bio concentration factor (BCF) is used to model the transfer of contaminants to vegetables1. The BCF is defined as the contaminant concentration in the vegetable divided by the total contaminant concentration in the soil. Determination of a site-specific BCF can be laborious, therefore for most contaminants the BCF is given as a single value which assumes a linear relationship between vegetable and soil concentration. As of this version, the BCF for lead and cadmium is dependent on the contaminant concentration in soil and soil properties, derived from linear regression in earlier studies (Versluijs et al., 2001; Swartjes et al., 2007; Otte et al., 2011).
Consumption rates of vegetables
Consumption rates of vegetables are required to calculate the human exposure to contaminants through vegetable consumption. To comply with the actual food pattern in the Netherlands, consumption rates of different vegetables were updated based on consumption data provided by the Nutrient, Prevention and Health Services (VPZ) department of the RIVM from the 2012-2016 version of the Dutch National Food
Consumption Survey (Voedsel Consumptie Peiling, 2019).
2.5 New input options
The option for users to enter a pore water concentration instead of a soil concentration was introduced to CSOIL to facilitate the implementation of CSOIL into the Risk Toolbox groundwater. Additional input options for soil concentrations in developed and non-developed areas, as well as pore water concentrations in developed and non-developed areas, were introduced to ensure CSOIL will still function in SANSCRIT. Soil in non-developed area is defined as soil which is open to outside air (garden, nature), soil in developed area is defined as soil on which buildings are present (e.g. houses).
2.6 Risk values for groundwater
In the newly developed version of CSOIL it is possible to perform a risk assessment based on groundwater concentrations alone, i.e. without the need of entering corresponding soil concentrations. This option is only available for the total concentration in groundwater (meaning
concentrations based on equilibrium partitioning. Notably, calculating a soil concentration from a groundwater concentration is only valid for concentrations under the maximum solubility of a contaminant.
Additionally, the exposure pathways in CSOIL were updated to facilitate its implementation in the Risk Toolbox Groundwater, which is currently under development. This allows CSOIL to be used iteratively to derive risk values for groundwater. A health risk limit for groundwater can be derived by iterating on the pore water concentration and only taking the exposure pathways “evaporation of contaminants to air” and
“permeation of contaminants into drinking water” into account.
However, this option can only be used when the contaminant is known to be located solely in groundwater. If, on the other hand, contaminated groundwater has affected the quality of the contact zone of the soil (or if the possibility cannot be excluded) then the risks of the contaminants in groundwater must be determined separately. Additionally, this method does not take the presence of pure contaminant at concentrations higher than the solubility into account. Therefore, user discretion is advised.
3
The CSOIL model
3.1 Lay-out of the modelThe CSOIL model was programmed in Excel and consists of several worksheets. The input sheet stores all user inputs and converts them to common or SI units for later use in the model. The engine sheet uses the converted input values from the input sheet and calculates the various compartment concentrations necessary for calculating the exposure pathways. The output sheet combines the contribution of each exposure pathway and determines a total risk index. Finally, the
overview sheet sums up the output sheet and the input sheets as well as some calculation results from the engine sheet. Various extra sheets like the sheets on contaminant data and scenario data are required for the model to function properly. Additionally, a start screen was made which contains command buttons for contaminant selection and allows the model to calculate multiple contaminants in one run.
3.2 Exposure pathways of the model
The CSOIL model distinguishes three processes:
• Calculation of the behavior (fate) of the contaminants in the soil and the partitioning over the soil phases
• Transfer processes and parameterization of the different exposure pathways (direct and indirect)
• Calculation of the lifetime average exposure (Otte et al., 2001) The first process relates to the fate of contaminants and utilizes input parameters describing contaminant specific physicochemical properties (e.g. Kow). The second process relates to the site specific inputs of the
exposure pathways and utilizes input parameters describing the site and soil properties related to potential exposure (e.g. pH). The third process relates to the receptor specific (human) inputs of the exposure pathways and utilizes input parameters describing human behaviour (e.g.
breathing volume and consumption of vegetables) (Otte et al., 2001). For the derivation of national standards, a standard exposure scenario has been defined. In this scenario, all possible exposure pathways in CSOIL are parametrized to reflect exposure to contaminants in a
residential situation. The direct and indirect exposure pathways that are considered by CSOIL are described below (also see figure 3.1). The exposure pathways are linked to four distinct media through which contaminants are transferred from soil to human and can therefore be grouped into four transfer pathways. These pathways are Soil, Air, Vegetables, and Drinking water.
Soil
• Ingestion of contaminated soil particles;
• Dermal contact with soil contaminants (indoor);
• Dermal contact with soil contaminants (outdoor);
• Inhalation of contaminated soil particles;
Air
• Inhalation of vapours of contaminants via crawl space (indoor);
• Inhalation of vapours of contaminants (outdoor);
Vegetable
• Ingestion of contaminants via consumption of locally grown vegetables;
Drinkingwater
• Ingestions of soil contaminants via drinking water;
• Inhalation of vapours of contaminants in the drinking water during showering;
• Dermal contact with contaminants in the drinking water during showering and bathing (Rikken et al., 2001).
Representative soil content Pore water concentration Permeation into drinking water Soil air concentration Uptake by vegetation (no deposition) Dilution in indoor and outdoor air Inhalation indoor and outdoor air Intake drinking water + dermal contact and inhalation showering Transport to surface soil Consumption of vegetation Distribution over soil fractions Transfer-processes Direct exposure Indrect exposure Uptake by deposition on vegetation Empirical BCF Modeled BCF Ingestion, Inhalation, Dermal uptake Soil
Figure 3.1 Diagram showing the exposure pathways of CSOIL.
The following three exposure pathways account for at least 90% of the total exposure for almost all contaminants. This can be concluded from calculations performed with the CSOIL model by Otte et al. (2001). The three exposure pathways are:
• The human exposure via ingestion of contaminated soil particles; • The human exposure to volatile contaminants in the indoor air;
• The human exposure via consumption of contaminated
The following exposure pathways contribute very little to the total exposure (Brand et al., 2006).
• Dermal uptake via soil contact (1-7% for 18 contaminants); • Drinking water intake due to permeation through Low Density
Polyethylene (LDPE) (1-13% for 29 contaminants);
• Dermal uptake during bathing (1-5% for 20 contaminants). Although not every exposure pathway has a significant contribution to the total human exposure, the basic principle is that all possible exposure pathways are considered.
3.3 Exposure scenarios
CSOIL uses a set of pre-defined exposure scenarios, which include a set of parameters representative for a specific type of soil use. The
parameters are used in the exposure pathways to calculate the total exposure. There are seven pre-defined exposure scenarios of which “residential with garden” is considered the default scenario. The choice of exposure scenario has a large impact on the risk limits calculated by CSOIL as the amount of direct or indirect contact with soil varies between the different scenarios.
Aggregated exposure pathways for contaminants in groundwater
A new set of aggregated exposure pathways were made for the case when contaminants are only present in groundwater. In these
aggregated pathways, the transport of contaminants from groundwater to the upper soil layer is not taken into account. This translates into the exposure only being dependent on the exposure pathways inhalation of indoor/outdoor air, permeation into drinking water, and inhalation and dermal uptake during showering and bathing. The pathways not considered are: Inhalation of soil particles, ingestion of soil particles, dermal contact with soil particles indoors and outdoors, and
consumption of vegetables. Although this “groundwater only”
functionality was added to the model, the preconditions for the use of these aggregated pathways are not fully explored yet.
Additionally, the fate of contaminants in groundwater is more complicated than currently implemented in CSOIL. Therefore, it is advised to only use this specific groundwater scenario when it is certain that the contaminated groundwater has no effect on the top layer of the soil. Another option is to use soil and groundwater concentrations
resulting from more detailed groundwater fate models. Figure 3.2 shows the exposure pathways relevant to the groundwater scenario.
Figure 3.2 Diagram showing the aggregated exposure pathways for
groundwater. Direct exposure pathways (soil ingestion, soil inhalation, and dermal uptake) as well as consumption of vegetables are not relevant to the aggregated pathways for groundwater.
3.4 Calculation of the health-based risk limit
CSOIL is used to calculate the human health-based risk limit. The human toxicological definition for health risk limit is as follows: the soil quality which results in an exposure that equals the Maximum
Permissible Risk for intake (MPRhuman). MPRhuman is defined as the
amount of substance that any human individual can be exposed to daily during a full lifetime without significant health risk. However, risk limits are derived for specific aggregated exposure pathways. For example, the risk limit for exposure through inhalation is different from the risk limit for oral and dermal exposure. Therefore, the MPRhuman can be
expressed as a tolerable daily intake (TDI) for oral and dermal exposure, and a tolerable concentration in air (TCA) for exposure through
inhalation.
Due to different modes of toxic action, contaminants can be divided into the threshold and non-threshold groups. For threshold contaminants risks only occur when a certain exposure level is reached, whilst for non-threshold contaminants every additional molecule above 0 results in extra risk. Therefore, for non-threshold contaminants the MPRhuman can
limits in relation to the aggregated exposure pathways and the mode of toxic action.
Table 3.1 An overview of the various risk limits used in the definition of the MPRhuman.
MPRhuman Threshold Non-threshold
Oral and dermal
exposure Tolerable daily intake (TDI) Excess carcinogenic risk oral, dermal (CRoral)
Exposure through
inhalation Tolerable concentration in air (TCA)
Excess carcinogenic risk inhalation (CRinhal)
To derive human toxicological risk limits, the oral/dermal exposure and exposure through inhalation are calculated separately under
standardized conditions (potential exposure). The oral MPRhuman (TDI or
CRoral in μg.kg-1 bw day-1) are used for the risk assessment of the oral
and dermal exposures. The TCA or CRinhal (in μg.m-3) are used for the
risk assessment of exposure via air.
However, TCA and TDI do not have the same units and cannot be used interchangeably. Therefore, for risk assessment purposes, the TCA or CRinhal are converted to the same unit as the TDI/CRoral, namely µg.kg-1
bw day-1 (Lijzen et al., 2001), and two separate MPRhuman-inhalation are
derived to account for the differences in bodyweight and breathing volumes for children and adults. The oral/dermal exposure, and exposure through inhalation for children and adults, divided by their respective MPRhuman result in three Risk Indexes (resp. RIoral/dermal,
RIinhalation, child, and RIinhalation, adult) (Equation 1). A weighted summation of
the two separate Risk Indexes for inhalation result in a total Risk Index for inhalation (Equation 2). Finally, as shown in Equation 3, the human toxicological risk limit is defined as the concentration of a contaminant in the soil for which the sum of the oral (including dermal) and inhalation risk indexes equal 1 (Lijzen et al., 2001).
Equation 1 Derivation of a Risk Index. Where “y” can either be the total exposure, or the exposure specific to oral/dermal, or inhalation.
𝑅𝑅𝑅𝑅𝑅𝑅𝑅𝑅 𝐼𝐼𝐼𝐼𝐼𝐼𝐼𝐼𝑥𝑥
𝑦𝑦=
∑ 𝐸𝐸𝑥𝑥𝐸𝐸𝐸𝐸𝑅𝑅𝐸𝐸𝐸𝐸𝐼𝐼
𝑀𝑀𝑀𝑀𝑅𝑅
𝑦𝑦𝑦𝑦
Equation 2 Weighted summation of Risk Indexes resulting in a Risk Index specific to lifelong inhalation.
𝑅𝑅𝑅𝑅𝑅𝑅𝑅𝑅 𝐼𝐼𝐼𝐼𝐼𝐼𝐼𝐼𝑥𝑥𝑖𝑖𝑖𝑖ℎ𝑎𝑎𝑎𝑎𝑎𝑎𝑎𝑎𝑖𝑖𝑎𝑎𝑖𝑖= (6 ∗ 𝑅𝑅𝐼𝐼𝑖𝑖𝑖𝑖ℎ𝑎𝑎𝑎𝑎𝑎𝑎𝑎𝑎𝑖𝑖𝑎𝑎𝑖𝑖−𝑐𝑐ℎ𝑖𝑖𝑎𝑎𝑖𝑖) + (64 ∗ 𝑅𝑅𝐼𝐼70 𝑖𝑖𝑖𝑖ℎ𝑎𝑎𝑎𝑎𝑎𝑎𝑎𝑎𝑖𝑖𝑎𝑎𝑖𝑖−𝑎𝑎𝑖𝑖𝑎𝑎𝑎𝑎𝑎𝑎)
Equation 3 The human toxicological risk limit is the concentration at which the sum of the Risk Indexes for oral/dermal and inhalation (the total Risk Index) are equal to 1.
Figure 3.3 depicts the general trend of Equation 3 in graph-form for metals and organic contaminants. The orange and yellow lines represent organic contaminants and the blue lines represent metal contaminants. The four dashed lines represent the increasing risk as a result of
increasing soil concentration for oral/dermal exposure and exposure through inhalation. The dash-dotted lines represent the total Risk Index. The concentration, which leads to a Risk Index of 1 is called the health risk limit.
The increase in human exposure resulting from an increasing soil concentration is a linear process for metals. However, when the solubility for organic contaminants in water is exceeded, the absolute contribution to human exposure through oral uptake of vegetables and inhalation of evaporated contaminants does not increase further.
Figure 3.3 The derivation of health risk limits depends on respiratory and oral uptake. The dashed lines represent Risk Indexes for oral/dermal or inhalation, the dash-dotted lines represent the total Risk Index.
Organic contaminants oral/dermal Metals oral/dermal Metals inhalation Organic contaminants inhalation
Health risk limit Total soil concentration (mg.kg-1dw)
Risk Index (-) Organic contaminants total Metals total 1
4
Model concepts and parameters
Soil consists of three compartments. When a contaminant comes into contact with soil it will partition over pore water, the solid phase (as minerals and organic matter), and air. From these phases the
contaminant can enter different transfer pathways, which can result in human exposure.
The first section of this chapter describes the partitioning of
contaminants over the different soil phases. The other sections describe the various transfer pathways of a contaminant to human exposure. Four distinct transfer pathways leading to human exposure are depicted in figure 3.1. These transfer pathways are soil, air, vegetables, and (drinking) water, where air and soil lead to direct exposure and drinking water and vegetables lead to indirect exposure through, for example, consumption. The formulas required for calculating human exposure via these transfer pathways can be found in appendix 1.9.
4.1 Partitioning soil, water & air
The distribution of a contaminant between the different phases in soil is called partitioning. Based on contaminant specific parameters (e.g. the
Figure 4.1 Partitioning of soil contaminants.
octanol water partition coefficient) and soil characteristics (e.g. the amount of organic carbon and water) a contaminant will partition over the different soil phases to attain a chemical equilibrium (Van den Berg, 1995). CSOIL uses three soil phases in which an equilibrium of a
contaminant is calculated, namely the water phase2, air phase, and soil (solid) phase (Figure 4.1). The concentration of a contaminant can be calculated from a known soil-water partition coefficient (Kd), air-water Henry-coefficient (H), and soil parameters (Van den Berg, 1995). A requirement for the calculation is that the concentration of the
contaminant in the water phase does not exceed its solubility. When this is the case the concentration in the water phase is limited the solubility level. Similar measures have been taken for contaminants in the gas phase of soil.
The large amount of distinct contaminants also requires differentiation between a wide range of chemical characteristics. Therefore,
2 The concentrations in pore water and groundwater are assumed to be equal.
Soil
contaminants
Soil water
contaminants were split into four groups, namely metals, inorganic contaminants, organic contaminants, and dissociating organic
contaminants. Metals are non-volatile and are therefore not present in the gas phase (with the exception of mercury)but will partition over the water phase and the solid phase of the soil. Organic contaminants can be found in all three phases of the soil. Additionally, dissociation
(through an acid-base reaction with water) of organic contaminants with a known pKa can be calculated in the water phase. Non-volatile, soluble substances like inorganic contaminants partition over the water phase and the solid phase of the soil. The formulas required for the calculation of partitioning can be found in appendix 1.
For partitioning calculations CSOIL uses the fugacity method (Mackay, 2001). Fugacity expresses the tendency of a contaminant to be present in a certain soil phase based on the difference in fugacity capacities with other phases. For each soil phase a fugacity capacity can be calculated. Subsequently, mass fractions of the total amount of contaminant in the different soil phases are calculated. See appendix 1.1 for the fugacity formulas. The presence of organic carbon plays a significant role in the sorption and partitioning of organic contaminants. Therefore, the Kd is usually expressed as a soil organic carbon related parameter Koc
(appendix 1)(Van den Berg, 1995).
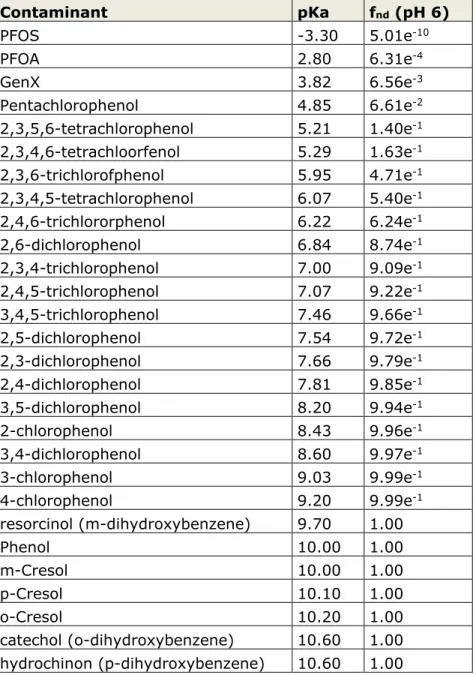
Dissociating contaminants
Dissociation in CSOIL is defined as the reaction of an (organic) acid with water into its conjugate base (negatively charged) and an aqueous cation (H3O+).
The dissociation of a hydrogen atom from a contaminant in an acid-base reaction is shown in figure 4.2 for perfluorooctanoic acid (PFOA).
Dissociated organic contaminants behave differently from non-dissociated organic contaminants, which results in more complex partitioning over the three soil phases. Additionally, some exposure pathways are modelled differently for dissociating contaminants. For example, only non-dissociated contaminants can permeate drinking water pipelines (section 4.5.1). The degree of dissociation in the water phase can be calculated based on the pKa of the contaminant and the pH of the soil’s water phase. The pKa is the logarithm of the equilibrium constant describing the acid-base reaction of the contaminant with water. When the pKa value of a contaminant is equal to the pH of the soil, half of the contaminant in water will be dissociated. By rewriting the Henderson-Hasselbalch equation (Po et al., 2001), the non-dissociated fraction (fnd) can be calculated based on the pKa and the soil pH
(Equation 4).
Dissociation of contaminants also influences the organic carbon partition coefficient (logKoc), which is used to calculate the fugacity capacity of
solid soil (Zs). Otte et al. (2001) evaluated the logKoc values of the
dissociating contaminants in CSOIL and updated the values based on dissociation. The updated values are currently used in CSOIL. Table 4.1 shows the contaminants that are labelled as dissociating in CSOIL.
Table 4.1 List of dissociating contaminants in CSOIL and their pKa values as well as the non-dissociated fraction at standard soil pH of 6.
Contaminant pKa fnd (pH 6) PFOS -3.30 5.01e-10 PFOA 2.80 6.31e-4 GenX 3.82 6.56e-3 Pentachlorophenol 4.85 6.61e-2 2,3,5,6-tetrachlorophenol 5.21 1.40e-1 2,3,4,6-tetrachloorfenol 5.29 1.63e-1 2,3,6-trichlorofphenol 5.95 4.71e-1 2,3,4,5-tetrachlorophenol 6.07 5.40e-1 2,4,6-trichlororphenol 6.22 6.24e-1 2,6-dichlorophenol 6.84 8.74e-1 2,3,4-trichlorophenol 7.00 9.09e-1 2,4,5-trichlorophenol 7.07 9.22e-1 3,4,5-trichlorophenol 7.46 9.66e-1 2,5-dichlorophenol 7.54 9.72e-1 2,3-dichlorophenol 7.66 9.79e-1 2,4-dichlorophenol 7.81 9.85e-1 3,5-dichlorophenol 8.20 9.94e-1 2-chlorophenol 8.43 9.96e-1 3,4-dichlorophenol 8.60 9.97e-1 3-chlorophenol 9.03 9.99e-1 4-chlorophenol 9.20 9.99e-1 resorcinol (m-dihydroxybenzene) 9.70 1.00 Phenol 10.00 1.00 m-Cresol 10.00 1.00 p-Cresol 10.10 1.00 o-Cresol 10.20 1.00 catechol (o-dihydroxybenzene) 10.60 1.00 hydrochinon (p-dihydroxybenzene) 10.60 1.00
4.2 Constants, site parameters & partition parameters
CSOIL uses a set of general parameters and constants to calculate the human risk level. Table 4.2 shows the constants and site specific parameters for the user scenario “Residential with garden”. The
the default scenario for deriving intervention values for soil. More information on user scenarios can be found in section 5.2.
Table 4.2 Constants and parameters for “Residential with garden” (Otte et al., 2001)
Parameters transfer
pathway Abbreviation/ code value Unit
Gas constant Air R 8.3144 [Pa.m3.mol-1.K-1]
Viscosity of air Air ETA 5e-09 [Pa.h]
Mean depth of
contamination Air dp 1.25 [m]
Air permeability of
soil Air KAPPA 1e
-11 [m2]
Depth of
groundwater table Air Dg 1.75 [m]
Height of the capillary transition boundary Air Z 0.5 [m] Air pressure difference crawl space
Air DELTAPCS 1 [Pa]
Fraction dry matter
root vegetables Vegetable fdwr 0.167 [-]
Fraction dry matter
leafy vegetables Vegetable fdws 0.098 [-]
Deposition constant Vegetable dpconst 0.01 [-]
Temperature bathing
water Water Tsh 313 [K]
Liquid exchange
speed Water Kl 0.2 [m.h
-1]
Gas phase mass
transport coefficient Water Kg 29.88 [m.h
-1]
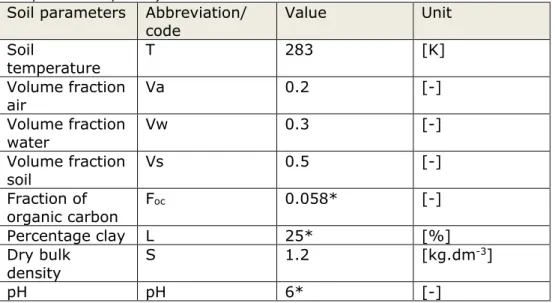
Additionally, CSOIL uses a set of soil parameters to facilitate the partitioning of contaminants over the various phases. Soil
characteristics, shown in Table 4.3, are known to have a large effect on the calculated risk limits. Therefore, the parameters were evaluated by Otte et al. (2001) and specifically for lead by Brand et al. (2019). The impact of the following parameters on the exposure can be significant: density of the solid phase; organic matter content; depth of
contamination; depth of groundwater table; contribution of vegetable consumption from a vegetable garden to total vegetable consumption; pore air fraction. By default, the model uses the Dutch ‘standard soil’ consisting of an organic matter content of 10%, clay content of 25% and a pH of 6 (Lijzen et al., 2001).
Table 4.3 Soil parameters for scenario “Residential with garden” (Lijzen et al., 2001; Otte et al., 2001)
Soil parameters Abbreviation/
code Value Unit
Soil temperature T 283 [K] Volume fraction air Va 0.2 [-] Volume fraction water Vw 0.3 [-] Volume fraction soil Vs 0.5 [-] Fraction of organic carbon Foc 0.058* [-] Percentage clay L 25* [%] Dry bulk density S 1.2 [kg.dm -3] pH pH 6* [-]
* For background on these values see Lijzen et al. (2001)
4.3 Soil transfer pathway
Ingestion of soil particles
Soil ingestion is a major pathway by which humans are exposed to contaminants in the soil. Adults and especially children ingest soil both on purpose and by accident (Figure 4.3). Ingested soil is then released
Figure 4.3: Pathway of exposure via soil ingestion.
to the digestive tract where contaminants can be absorbed into the body. Especially for immobile contaminants, this exposure pathway shows a significant contribution to the total human exposure.
Several studies were performed to determine the amounts of soil that adults and children might ingest per day (Calabrese et al., 1989; Calabrese et al., 1990; Wijnen et al., 1990; Calabrese et al., 1997; Stanek III et al., 1997). Otte et al. (2001) performed a review to
determine the yearly averaged daily soil ingestion of children and adults. Although the amount of data from direct measurements was limited, the insight in the (distribution) of the parameters was sufficient for exposure modelling. The formulas used for calculating soil ingestion can be found in appendix 1.5.
Contaminated soil Contact area
Human exposure
Parameters
Exposure to contaminants via soil ingestions mainly depends on the daily amount of ingested soil by children/adults (AIDc,a). Moreover, the
amount of ingested contaminant also depends on the concentration in the soil (Cs), the relative absorption factor (Fa) and the bodyweight of the child or adult (BWc,a). More background information on soil ingestion
can be found in Otte et al. (2001).
The relative absorption factor represents the relation between the absorption amount assumed in the CSOIL model and the absorption amount in the toxicological study on which the MPR was based. By default, the relative absorption factor is set to 1 meaning the absorption amounts between CSOIL and the toxicological study are the same. One exception occurs in the case of lead, where the relative absorption factor is set to a default of 0.74 (VROM, 2008). Table 4.4 shows the default parameters used to calculate exposure via soil ingestion.
Table 4.4 Exposure parameters for soil ingestion for child/ adult for the scenario “residential with garden” (Otte et al., 2001)
parameters soil
ingestion Abbreviation/ code Value Unit
Child Adult Child Adult
Soil ingestion AIDc AIDa 1.00e-4 5.00e-5 [kg dry
weight. day -1]
Relative absorption
factor Fa Fa 1 1 [-]
Bodyweight BWc BWa 15 70 [kg]
Inhalation of soil particles
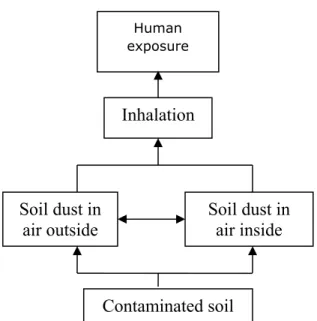
Both indoor air and outdoor air contain soil particles. These soil particles can be absorbed into the human body through inhalation (figure 4.4). The relative contribution of soil inhalation to the total exposure depends on the type of contaminant. Volatile contaminants are more likely to evaporate and be inhaled as gases compared to contaminants that are sorbed to soil particles (see section 3.4). The soil inhalation pathway considers the latter category of contaminants, meaning contaminants are released from soil particles after inhalation as is the case for metals and non-volatile contaminants. Soil particles < 10 µm are included in this pathway (Van den Berg, 1995).
Figure 4.4 Pathways of exposure via soil inhalation.
A distinction between indoor and outdoor air is made as the outdoor concentration of dust particles in the air is higher, but the fraction of soil in these dust particles is lower compared to indoor air (Otte et al., 2001). Only soil dust is considered to be of importance in this pathway. Contaminants from dust particles or other sources are therefore not considered. Appendix 1.5.2 shows the formulas used to calculate soil inhalation.
Parameters
Exposure to contaminants via soil inhalation depends on the
concentration of the contaminant in the soil (Cs), the amount of inhaled dust particles for a child/adult (ITSPc/ITSPa), the relative absorption
factor (Fa), the retention factor of the soil particles in the lungs (Fr), and the bodyweight of the child/adult (BWc,a). Table 4.5 shows the default
parameters used to calculate exposure via soil inhalation.
Contaminated soil
Soil dust in
air outside
Soil dust in
air inside
Inhalation
Human exposure
Table 4.5 Exposure parameters for soil inhalation for child/ adult for the scenario “residential with garden” (Otte et al., 2001).
Parameters soil
inhalation Abbreviation/ code Value Unit
Child Adult Child Adult
Amount of inhaled dust particles
ITSPc ITSPa 3.13e-7 8.33e-7 [kg.day-1]
Relative absorption factor Fa Fa 1 1 [-] Retention factor soil in lungs Fr Fr 0.75 0.75 [-] Air volume AVc AVa 0.317 0.833 [m3.h-1]
Indoor/outdoor Indoor Outdoor Indoor Outdoor
Amount of suspended particles in air TSP TSP 52.5 70 52.5 70 [µg.m-3] Fraction soil particles in air frs frs 0.8 0.5 0.8 0.5 [-]
Exposure time ti(i/o)c ti(i/o)a 21.14 2.86 22.86 1.14 [h.d-1]
Dermal uptake of soil contaminants
The uptake of contaminants through dermal contact with soil is an exposure pathway with a relatively small contribution to the total exposure. Nonetheless, exposure is still a possibility and therefore programmed into the CSOIL model (figure 4.5). Similar to the inhalation of soil particles, the uptake of contaminants through dermal contact is split up in an indoor and an outdoor component. Additionally, the surface area of exposed skin is higher when outdoors compared to
Figure 4.5: Pathways of exposure via dermal contact with soil inhalation. Contaminated soil
indoors. Furthermore, the amount of particles covering the skin is higher outdoors compared to indoors (Otte et al., 2001).
The skin consists of an outer layer that protects the body against various external factors. However, it is possible for some contaminants to be absorbed by the skin. After absorption the contaminants enter the blood vessels that are located in the interstitial tissue. Once the
contaminants have reached the bloodstream they can cause various health problems depending on their toxicity. The absorption can increase due to damaged skin.
The uptake of contaminants through dermal contact with soil is possible for organic contaminants. For inorganic contaminants (and metals) no absorption is assumed resulting in no contribution to the total exposure for these types of contaminants (Van den Berg, 1995).
Parameters
Exposure through dermal contact with soil depends on the fraction of soil indoors (FRSi), the concentration in soil (Cs), and the surface area of
exposed skin for child/adult when indoors/outdoors (AEXPci,o/AEXPai,o)
(which is based on differences in skin coverage of indoor and outdoor clothing). Additional parameters of influence are the degree of skin coverage with soil particles (DAEci,o/DAEai,o), the dermal absorption rate
for a child/adult (DARc, DARa), the period of exposure through contact
with soil indoors/outdoors/ for child/adult, and a matrix factor for dermal uptake (fm). Appendix 1.5.3 shows the formulas used to calculate the dermal uptake of soil contaminants
The period of exposure through contact with soil was derived from the exposure time indoors/outdoors for a child/adult and a correction factor for daily to yearly exposure. Table 4.6 shows the exposure parameters for the dermal uptake of soil.
Table 4.6 Exposure parameters for dermal uptake of soil for child/adult when indoors/outdoors for the scenario “residential with garden” (Otte et al., 2001).
Exposure parameters
dermal uptake Abbreviation/ code Value Unit
Child Adult Child Adult
Fraction of soil indoors FRSi FRSi 0.8 0.8 [-]
Dermal absorption
rate DARc DARa 0.01 0.005 [h
-1]
The matrix factor
dermal uptake Fm Fm 0.15 0.15 [-]
Indoor Outdoor Indoor Outdoor
Exposed surface area
of skin AEXPci,o AEXPai,o 0.05 0.28 0.09 0.17 [m
2]
Degree of coverage
skin DAEci,o DAEai,o 5.6e
-4 5.1e-3 5.6e-4 3.8e-2 [kg.m-2]
Average period of
exposure with soil TBci,o TBai,o 9.14 2.86 14.86 1.14 [h.day
-1]
Duration of exposure tci,o tai,o 8 8 8 8 [h.day-1]
Correction factor daily
yearly tfci,o tfai,o 1.143 0.357 1.857 0.143 [h.day
4.4 Air transfer pathway
The air transfer pathway consists of the evaporation of contaminants to air and the resulting exposure to humans through inhalation (Figure 4.6). This pathway differs from the inhalation of soil particles, described in section 4.3.2, because in air the contaminant is not attached to a soil particle but present as a gas. CSOIL describes the transport of
contaminants from the soil phases to the air phase as a result of a number of stationary equilibrium processes (Van den Berg, 1995; Waitz et al., 1996).
Figure 4.6 Pathways of exposure via inhalation of volatile contaminants.
The model assumes the contaminant is located at a default depth of 1.25 meters. Emission of the contaminant can take place from this depth through vertical transport through the soil. If the contaminant is located in soil in non-developed area the emission will be to outdoor air, which dilutes the emission. If the contaminant is located beneath a building the emission will be to a crawlspace and finally to indoor air, which dilutes the emission to a lesser extent through ventilation of the house (Waitz et al., 1996).
Exposure through the inhalation of volatile contaminants is significant for volatile organic contaminants. Metals, with the exception of mercury, and inorganic contaminants do not evaporate from the soil and will
Contaminated soil
Concentrations in soil, water & air Flux to surface level
Flux to crawlspace Crawlspace air concentration Indoor air concentration Outdoor air concentration Human exposure
and subsequently contribute to exposure through inhalation (Wintersen et al., 2019).
Parameters
The amount of contaminant inhaled depends on the concentration in the indoor and outdoor air (CIA2/COAc,a). Similar to the inhalation of soil
particles, the inhalation of air is split up between inhalation of indoor air and outdoor air due to a concentration difference resulting from the pathway of emission as well as the extent of dilution (Waitz et al., 1996). Additionally, the exposure to contaminants through inhalation of air depends on the time spent indoors and outdoors for child/adult (TIic,a/TIoc,a), the breathing volume of a child/adult (AVc,a), the relative
absorption factor (Fa), and the bodyweight of a child/adult (BWc,a). In
the exceptional case that the outdoor air concentration for a child exceeds the indoor air concentration, the outdoor air concentration for child is taken as the indoor air concentration. The choice of taking the outdoor air concentration for child reflects the most sensitive scenario. Table 4.7 shows the exposure parameters for the inhalation of
contaminants evaporated to indoor/outdoor air.
Table 4.7 Exposure parameters for the inhalation of contaminant in indoor/ outdoor air for a child/adult for the scenario “residential with garden” (Otte et al., 2001) Exposure parameters Inhalation of air Abbreviation/co de Value Unit
Child Adult Child Adult
Indoor Outdoor Indoor Outdoor Inhalation
period TIioc TIioa 21.14 2.86 22.86 1.14 [h.d
-1] Air volume AVc AVa 0.317 0.883 [m3.h-1] Relative absorption factor Fa Fa 1 1 [-]
The concentration of contaminant in outdoor air is determined by the dilution velocity of a child/adult (VFc,a) and the diffusion flux from the
soil-water phase to surface level (Dfs). The dilution velocities for child and adult differ due to the different breathing heights for children and adults. For the indoor air concentration the contaminant is assumed to be the same concentration throughout the entire indoor air volume. The concentration of contaminant in indoor air is determined by the
concentration of contaminant in crawlspace air (CBA), which in turn depends on the total contaminant flux from the soil to the crawl space air (Jcs), the height of the crawlspace (Bh), and the ventilation void of the crawlspace air (Vv). Lastly, the indoor air concentration of a contaminant can be determined when the fraction of indoor air originating from the crawlspace (fbi) is known. Table 4.8 shows the parameters used for calculating the different concentrations in air.
Table 4.8 Exposure parameters for contaminant concentrations in
indoor/outdoor air for child/adult for the scenario “residential with garden” (Otte et al., 2001)
Exposure parameters
concentration of air
Abbreviation/code Value Unit
Child Adult Child Adult
Dilution velocity VFc VFa 161.3 324.6 [m.h-1]
Height crawl space Bh Bh 0.5 0.5 [m]
Air exchange rate
crawlspace Vv Vv 1.1 1.1 [h
-1]
Contribution of the crawl space air to indoor air
fbi fbi 0.1 0.1 [-]
4.5 Water transfer pathway
Human exposure resulting from the water transfer pathway is contingent on two processes, namely the permeation of a contaminant through water pipelines into drinking water, and the direct consumption of groundwater as drinking water (Figure 4.7). Drinking water, aside from
Figure 4.7 Pathways of exposure via drinking, inhalation, dermal contact with drinking water.
consumption, is also used for showering and bathing which results in exposure through dermal uptake as well as inhalation of evaporated volatile contaminants. Pore water Transport to groundwater Permeation into drinking water via pipeline Permeation into drinking water
Intake of drinking water, dermal contact or
inhalation when showering Human exposure
Permeation of contaminants through water pipelines
When located close to a water pipeline, some contaminants can permeate through a water pipeline made of polyethylene (PE) and dissolve into clean drinking water (Van den Berg, 1995). Contaminants in the pore water or air phases of the soil will generally only permeate if the pipeline is made out of PE. These type of pipelines are often found in the vicinity of houses or other buildings (Van den Berg, 1995).
Permeation occurs through a series of interactions between the contaminant, the pore water and drinking water, and the PE pipeline separating the two water reservoirs (Van den Berg, 1995). Furthermore, permeation is only possible for non-dissociated organic contaminants as these can be dissolved into the hydrophobic PE and migrate between the PE polymer layers (Otte et al., 2016; Van der Schans et al., 2016).
Parameters
The concentration in drinking water (CDW) depends on the amount of contaminant present in pore water (CPWo) that can permeate through water pipelines as well as the amount of water used (Qwd). The pore water concentration in non-developed area is used as it is assumed that most of the water pipeline is located in non-developed area. Permeation is a slow process and contaminant concentrations can build up when water usage is low or non-existent (during the night). Moreover, the rate of permeation is not equal for all contaminants. Therefore, a permeation coefficient was derived by Van den Berg (1997) based on Vonk (1985). Additionally, the surface area and thickness of the pipeline as well as the length of the pipeline exposed to the contaminant (LP) influences the rate of permeation. In CSOIL, the thickness of the pipeline wall (d2) and the radius of the pipeline (r) are combined with the water usage (Qwd) and stagnation period (d1) into a drinking water constant (dwconst). The daily drinking water consumption (QDWc,a) is
used to calculate the exposure to contaminants by drinking tap water. Table 4.9 shows the parameters used to calculate the contaminant concentration in drinking water.
Table 4.9 Exposure parameters for permeation in drinking water for “residential with garden” (Otte et al., 2001)
Exposure parameters permeation in drinking water
Abbreviation/code Value Unit
Drinking water constant dwconst 178.48* [-]
Diameter contaminated area LP 25* [m]
Duration of water stagnation d1 0.33 [d]
Radius of pipeline r 0.0098 [m]
Thickness of pipe wall d2 0.0027 [m]
Average daily water use Qwd 0.1263* [m3]
Child Adult
Drinking water consumption QDWc,a 1 2 [dm3.d-1]
*revised values, more information can be found in appendix 3.1.3. Drinking water
As mentioned in the previous section, contaminants can enter drinking water by permeation through drinking water pipelines. Drinking water that originates from surface water (e.g. rivers and lakes) is not part of
the CSOIL model and will therefore not be discussed in this report. The formulas that are used to calculate the exposure via drinking water are described in appendix 1.7.2.
Parameters
Consumption of drinking water after a contaminant has permeated the drinking water pipeline leads to exposure. The daily drinking water consumption for adult or child (QDWc,a) is given in table 4.9.
Showering and bathing
Contaminants enter the tap water used for showering and bathing through permeation of drinking water pipelines as mentioned in the previous sections. Exposure to contaminants through showering or bathing can occur via two pathways, namely through dermal contact with water and through inhalation of contaminants evaporated from the water (fig 4.8).
Figure 4.8: Pathways of exposure via showering.
Inhalation of vapours
During showering and bathing volatile organic contaminants can evaporate from the tap water and be inhaled together with water vapours. Water droplet formation during showering will increase the surface to volume ratio which increases the evaporation rate of the contaminant from water. Additionally, the relatively high water
temperatures used during showering also increase the evaporation rate (Bontje et al., 2005). Contaminated drinking water Dermal uptake Evaporation contaminant Inhalation evaporated contaminant Human exposure Contaminated soil
exposure pathway is generally small compared to the total human exposure (Brand et al., 2006). The rate of absorption is mainly determined by the contaminant concentration in drinking water, the fraction of exposed skin during showering or bathing, the time spent in the shower, and the dermal absorption speed. The formulas used to calculate the exposure through dermal contact during showering are described in appendix 1.7.5.
Parameters
The concentration in bathroom air (CBK) resulting from evaporation of a contaminant is determined by the contaminant concentration in drinking water (CDW), the rate of evaporation (Kwa), the volume of the bathroom
(Vbk), and the volume of water used for showering. The rate of evaporation is corrected for the water temperature of water used for showering. Subsequently, the exposure through inhalation is calculated using the residence time in the bathroom (Td) and the breathing volume of a child/adult (AVc,a). Table 4.10 shows the parameters for exposure
through inhalation of contaminants during showering.
Table 4.10 Exposure parameters for the inhalation of contaminant during showering for “residential with garden” (Otte et al., 2001).
Exposure parameters inhalation of water
vapours during showering
Abbreviation/code Value Unit
Child Adult Child Adult
Air volume AVc AVa 0.317 0.833 [m3.h
-1]
Residence time bathroom Td Td 0.5 0.5 [h.d-1]
Volume of the bathroom Vbk 15.0 [m3]
Volume of water used for
showering Vwb 51* [dm
3] * Revised values, for more information see appendix 3.1.3.
The exposure through dermal contact with water during showering depends on the concentration in drinking water (CDW), the body surface of a child/adult (ATOTc,a), the fraction of exposed skin during
showering/bathing (Fexp), the time spent showering (tdc), the dermal absorption speed while showering (DARw), the relative absorption factor (Fa), and the bodyweight of a child/adult (BWc,a). Time spent showering
is not the same as residence time in the bathroom. After showering is finished there is little to no contact with water anymore, yet breathing of vapours still continues. Table 4.11 shows the parameters for exposure through dermal contact during showering.
Table 4.11 Exposure parameters for uptake of contaminant through dermal contact with water while showering for the scenario “residential with garden” (Otte et al., 2001)
Exposure parameters dermal
contact during showering
Abbreviation/code Value Unit
Child Adult Child Adult
Body surface ATOTc ATOTa 0.95 1.80 [m2]
Fraction exposed
skin Fexp Fexp 0.40 0.40 [-]
Showering time tdc tdc 0.25 0.25 [h.d-1]
Bathing time td td 0.5 0.5 [h.d-1]
Relative absorption
factor Fa Fa 1 1 [-]
Direct consumption of contaminated groundwater
The direct consumption of contaminated ground water as drinking water is included in the CSOIL model (figure 3.1 and 3.2). Groundwater is occasionally used as a drinking water source at camp sites. However, groundwater should also be considered as a strategic source of drinking water. Therefore, groundwater should be of drinkable quality without treatment.
Human exposure via drinking contaminated groundwater in the Netherlands occurs very rarely but is nonetheless included in CSOIL. Due to its rarity, however, direct consumption of groundwater is not included in the total human exposure calculated by the CSOIL model. Appendix 1.10 gives the formula that are used to determine the maximal permissible concentration in groundwater.
4.6 Vegetable consumption pathway
Exposure to contaminants can occur through consumption of home-grown vegetables. Contaminants enter home-home-grown vegetables via two pathways, namely the uptake of contaminants through roots and the uptake of contaminants through leaves (via air) (Figure 4.9). A
Bioconcentration Factor (BCF) is derived to determine the contaminant concentration in vegetables. A BCF is defined as the quotient of the