National Institute for Public Health and the Environment
P.O. Box 1 | 3720 BA Bilthoven www.rivm.com
Follow-up study on the chemical status
of Lake Goto, Bonaire
Measurements and risk assessment
RIVM Letter report 609224001/2012 D. de Zwart et al.
Colophon
© RIVM 2012
Parts of this publication may be reproduced, provided acknowledgement is given to the 'National Institute for Public Health and the Environment', along with the title and year of publication.
This investigation has been performed by order and for the account of DGM, within the framework of project M/609224 Bodemonderzoek Gotomeer Bonaire
Dr. Dick de Zwart (ecotoxicologist, RIVM)
Ing. Arthur de Groot (specialist sampling, safety expert, advisor
hazardous substance (RIVM)
Dr. Michiel Kotterman (Environmental chemist, specialist biological
sampling, Imares)
Drs. Monique van der Aa (coordinator, RIVM)
Dr. Theo Aalbers (coordinator, RIVM)
Dr. Diana Slijkerman (ecotoxicologist, coordinator Imares)
Dr. Charles Bodar (ecotoxicologist, RIVM)
Review committee
Ir. Luit-Jan Dijkhuis (Ministry of Infrastructure and the Environment)
Drs. Wil van Delft (liaison at Bonaire, Ministry of Infrastructure and
the Environment)
Drs. Frank van Slobbe (Directorate of Spatial Planning and
Development, Bonaire government)
Drs. Kris Kats (Progressive Environmental Solutions, Bonaire
government)
Drs. Fernando Simal (Stinapa, Bonaire)
Contact:
Monique van der Aa
Abstract
Follow-up study on the chemical status of Lake Goto, Bonaire
On 8 and 9 September 2010 there was a big petrochemical fire at the BOPEC facility on Bonaire. In a study on the environmental impact it was concluded by RIVM that for perfluorooctane sulfonate (PFOS) environmental quality criteria were exceeded in Lake Goto and Salina Tam, two lagunas which are located in the vicinity of BOPEC. These substances originated from the fire fighting foams that were used on the BOPEC site. The study was inconclusive about the nature and size of possible ecological effects that could result from this. It was noted that concentrations might gradually decrease in time, however at an unknown speed.
At present the results from a follow-up study in 2012 performed by RIVM show that the concentrations of PFOS in water and sediments of Lake Goto and Salina Tam, although a little lower than in 2010, are still exceeding environmental quality criteria. This means that
ecotoxicological riks because of this exposure that has been going on for 2 years now, can not be excluded. Examples are direct effects on waterorganisms such as mortality, or indirect effects for example when higher organisms leave because their food has disappeared. It is impossible to make any firm conclusions on the question whether the higher concentrations in Lake Goto and Salina Tam are the (only) causative factors influencing the observed ecological deterioration as indicated by a disappeared flamingo population from Lake Goto. In order to address this question an ecological study is needed, which will be performed by research institute IMARES. This follow-up study was performed by order of The Dutch Ministry of Infrastructure and the Environment (I&M) upon request of the Public Entity of Bonaire.
Keywords:
Rapport in het kort
Vervolgstudie naar de chemische verontreinigingstatus van het Gotomeer, Bonaire Op 8 en 9 september 2010 woedde een grote brand op het terrein van de olieraffinaderij BOPEC op Bonaire. Destijds bleek uit onderzoek van het RIVM dat normen voor
perfluoroctaansulfonaat-verbindingen (PFOS) zijn overschreden in het Gotomeer en in Salina Tam, twee zoutmeren vlakbij BOPEC. Deze verbindingen maakten deel uit van het gebruikte blusschuim op het BOPEC-terrein. Het bleek niet mogelijk om aan te geven wat de ecologische effecten van deze normoverschrijding zouden kunnen zijn. Wel werd aangegeven dat de concentraties van deze stoffen in beide meren geleidelijk zouden kunnen gaan afnemen. Hoe snel dat zou gaan, was onbekend.
Uit vervolgonderzoek in 2012 van het RIVM blijkt dat de milieukwaliteitsnormen nog steeds worden overschreden in het Gotomeer en Salina Tam. De concentraties PFOS in het water en sediment van deze meren vlakbij de brand zijn iets lager dan in 2010, maar nog duidelijk verhoogd. Risico’s voor het ecosysteem van deze inmiddels twee jaar durende blootstelling zijn hierdoor niet uit te sluiten. Hierbij valt te denken aan directe effecten op waterorganismen zoals bijvoorbeeld sterfte, of indirecte effecten wanneer hogere organismen verdwijnen doordat er niet meer voldoende voedsel voor ze is. Het is echter niet aan te geven of, en zo ja, in welke mate de verhoogde concentraties ervoor verantwoordelijk zijn dat de flamingopopulatie is verdwenen. Hiervoor is nader onderzoek naar de ecologische dynamiek van dit ecosysteem nodig. Onderzoeksinstituut IMARES gaat dit binnenkort doen.
Deze studie is uitgevoerd in opdracht van het Nederlandse ministerie van Infrastructuur en Milieu (I&M) en het bestuur van de ‘bijzondere gemeente’ Bonaire, het Openbaar Lichaam Bonaire (OLB).
Trefwoorden:
Contents
Summary—6
1 Introduction—7
1.1 Rationale behind the follow-up study on Lake Goto, Bonaire—7 1.2 Objectives of the follow-up study—7
1.3 Cooperation between RIVM and IMARES—7
2 Study plan—8
2.1 Sampling—8
2.2 Chemical analyses of potential fire related contaminants—8 2.3 Associated measurements—8
2.4 Evaluation of ecological risk—9
3 Sampling—10
3.1 Sampling procedure—10
3.2 Sampling schedule and locations—10
4 Chemical analyses and properties of the chemicals—12
4.1 Polycyclic Aromatic Hydrocarbons—12 4.2 Perfluorinated compounds—13
5 Risk analysis and discussion—18
5.1 Polycyclic Aromatic Hydrocarbons—18 5.2 Perfluorinated compounds—18
6 Conclusions and recommendations—21
6.1 Conclusions—21
6.2 Recommendations for further study—21 References—22
Appendix 1—23 Appendix 2—25 Appendix 3—27 Appendix 4—29
Summary
The big petrochemical fire that took place in September 2010 at the BOPEC facility on Bonaire, caused a lot of potentially toxic material to be deposited on the island. Recently, the ecological condition of Lake Goto and Salina TAM, two water bodies adjacent to the BOPEC terrain are suspect of being deteriorated by these toxic depositions. The deterioration is thought to be indicated by the recent disappearance of the once thriving flamingo population in Lake Goto. By order of the Dutch Ministry of Infrastructure and the Environment (I&M) as requested by the Public Body of Bonaire, RIVM conducted a follow-up study in collaboration with IMARES to assess the present chemical condition of Lake Goto and a few other salinas (salt lakes). More explicitly, the follow-up study should answer the following questions:
1. Does the water and/or the sediments of Lake Goto contain pollutants that may be related to the BOPEC fire or the fire fighting foams used
2. Are the observed concentrations of these compounds high enough to induce ecological effects?
The follow-up study indicated that only the concentrations of fire fighting foam constituents, such as perfluoridated compounds (PFC), mainly represented by the most toxic and most bioconcentrating perfluorooctane sulfonate (PFOS), are still elevated in the water and sediments of Lake Goto and Salina Tam. These substances are not present in the two reference salt lakes evaluated in comparison. It turned out that the evaluation of the second question is affirmative. Some of the observed PFOS concentrations in the water and less in the sediment of Lake Goto are clearly indicative for secondary food chain intoxication.
In order to address the question if ecological effects in the food chain have actually taken place as a consequence of the elevated PFOS concentrations, an ecological study is needed. Such a study might elucidate the possibly contaminated food supply of the flamingo population and potential other ecologically or climatologicallly significant disturbing factors that may have caused the flamingo population (and possibly other flora and fauna) to disappear
1
Introduction
1.1 Rationale behind the follow-up study on Lake Goto, Bonaire
On 8 and 9 September 2010 there was a big petrochemical fire at the BOPEC facility on Bonaire. The BOnaire PEtroleum Corporation is a fuel oil storage and transhipment terminal that is fully owned by the Venezuelan oil company Petróleos de Venezuela S.A. (PDVSA). Allegedly, 32 million liters of crude and naphta went up in flames over a period of 2 days
(http://www.beautiful-bonaire.nl/natuur/gotomeer.html). Immediately after the fire, the
environmental impact resulting from the release of mainly oil, polycyclic aromatic hydrocarbons (PAH) and perfluorinated constituents of fire fighting foams were assessed and reported by RIVM (RIVM 2011).
In January 2012, an Antillean website (
http://www.boneiru-awe.com/2012/01/22/awa-den-salina-di-goto-ta-kontamina/) signals a suspected contamination of Lake Goto, adjacent to the
BOPEC facility. Lake Goto is historically known to be of value as a nature conservation area with, amongst others, a healthy flamingo population (Phoenicopterus ruber). The website reports that the flamingo’s are basically gone from Lake Goto. It is indicated that the flamingo population already displayed a vast reduction of abundance within 4 months after the fire.
1.2 Objectives of the follow-up study
Two years after the fire the biological condition of Lake Goto lead to the question whether the observed deterioration of ecological values may be related to delayed ecotoxicological impact caused by the 2010 BOPEC fire and the release of fire associated chemicals. On October 15, 2012, the Dutch Ministry of Infrastructure and the Environment (I&M) as requested by the Public Body of Bonaire ordered RIVM to conduct a follow-up study to assess the present chemical condition of Lake Goto and a few other salinas (salt lakes). More explicitly, the follow-up study should answer the following questions:
1. Does the water and/or the sediments of Lake Goto contain pollutants that may be related to the BOPEC fire or the fire fighting foams used
2. Are the observed concentrations of these compounds high enough to induce ecological effects?
1.3 Cooperation between RIVM and IMARES
The study plan for this follow-up evaluation of the chemical quality of Lake Goto was designed in close cooperation with I&M and our sampling partner IMARES. IMARES expects to get an
assignment from the Dutch Ministery of Economic affairs (EZ) in 2013 to evaluate the possibly contaminated food supply of the flamingo population and potential other ecologically significant disturbing factors that may have caused the flamingo population to disappear. In order to make sure that the results of the RIVM research can be used for this possible ecological follow-up study, the monitoring campaign was designed and performed together. During the sampling expedition RIVM took water and sediment samples. IMARES took samples of available small animals and algae that represent the food of the flamingo birds and stored them for analysis for the possible assignment in 2013.
2
Study plan
Immediately after the fire, elevated concentrations of mixtures of PAHs and perfluorinated constituents of fire fighting foams were detected in Salina Tam and Lake Goto, both close to the BOPEC facility. It is proposed to restrict our sampling and analytical efforts to a minimally plausible set of samples from a limited number of surface waters and sediments. As a reference for the previously contaminated water bodies (Salina Tam and Lake Goto), a similar type of water body had to be selected where the flamingo abundance did not suffer from the date of the fire to the present time. Salinas in Bonaire are however differing from each other on specific characteristics (See: Buitrago et al. 2010). The reference Salinas to be selected will always differ in certain aspects from Lake Goto, e.g. in salinity, size, depth, organic matter, substrate. From this point of view, the selection can be pragmatic as well, and be based on the previous study results, in combination with recent observations that Flamingo is present in to be selected reference sites.
2.1 Sampling
The total number of sampling locations is therefore restricted to 10:
Five sampling locations in Lake Goto at different distances from the BOPEC facility
Three sampling locations in Salina Tam
Two sampling locations in reference salinas. Prior to the sampling on Bonaire, we selected Salina Matijs and Salina Bartol as appropriate reference sites
This selection leads to 20 samples to be analyzed:
Ten sampling locations, and
Two compartments, namely surface water and sediment 2.2 Chemical analyses of potential fire related contaminants
In order to reduce the analytical expenditure, the analyses are restricted to the two groups of chemicals that are most likely associated to the 2010 BOPEC fire:
Polycyclic aromatic hydrocarbons (PAH), possibly limited to naphtalene and phenanthrene as the most prominently occurring PAH compounds related to spilling and burning of mineral oil. These analyses were performed by the laboratory of TNO Earth, Environmental and Life Sciences, Utrecht, the Netherlands.
Perfluorinated alkanoic acids and perfluorinated alkane sulfonic acids, possibly limited to perfluorooctanoic acid (PFOA) and perfluorooctane sulfonic acid (PFOS) as the most
prominently used constituents of fire fighting foams. These analyses were performed by the laboratory of our sampling partner IMARES, IJmuiden, the Netherlands.
2.3 Associated measurements
In order to be able to put the analytical contaminant results into a biological impact perspective, it is necessary to co-evaluate a small number environmental or sample characteristics, either during sampling in the field, or during analysis in the laboratory:
Lab measurement of the fraction organic matter in sampled sediment. Needed because this sediment property influences bioavailability and toxicity of organic contaminants
Lab measurement of dry weight of the sampled sediment. Needed because the
environmental quality standards (EQS) for sediments are generally available based on dry weight
Field measurement of sample descriptors like map coordinates, sampling depth and nature of the sample. Needed for mapping and identification of the sampled compartment
Field measurement of electrical conductivity as a proxy for salinity, temperature, dissolved oxygen and pH at the time of sampling. Needed as estimates of environmental
biocompatibility
2.4 Evaluation of ecological risk
The local risk of ecosystem deterioration as a consequence of ecosystem exposure to adverse chemical conditions is commonly expressed as risk quotient (RQ): the local available
concentration of a single toxicant divided by a certified risk limit (RL), in this case defined as a near completely safe maximum permissible concentration (MPC) of the toxicant after prolonged exposure. If this RQ is below one, there is no risk for ecosystem damage. If the RQ is above unity, ecosystem damage is potentially to occur. RQs for similarly acting chemicals (e.g. PAH or PFC compounds) may be added (ΣRQ – in this report impossible for PFCs, due to absence of data) to evaluate the risk of local toxicant mixtures. Risk limits are defined for a diversity of different kinds of impacts and for different routes of exposure (water, sediment, soil, food, air, etc.). In the present report we will only evaluate the risk for general direct ecotoxicity
originating from exposure to water and to sediment, as well as the risk for secondary poisoning from the toxicant contained in water and sediment propagating through the food chain. For the derivation of risk limits, a variety of toxicity observations obtained from single species lab tests, microcosm experiments and even field studies may be used as input. The risk limits for general direct ecotoxicity (MPCeco, sediment and MPCeco, water) used in this study are either based on a
species sensitivity distribution (SSD) approach with (sub)chronic no observed effect
concentrations (NOEC) data (e.g. for PAH) and extrapolated to safe levels for the ecosystem, or, if not sufficient data of good quality are available (e.g. for PFOS), on the lowest (sub)chronic NOEC observed for any species tested extrapolated to a safe ecosystem level by applying assessment factors. The risk limits for secondary poisoning used in this study are derived from chronic food exposure experiments with warm blooded vertebrates (rat, mouse, monkey, bird, etc.). Safe intake levels (e.g. in mg/kg/day) are first transformed to safe concentrations in the food (e.g. mg/kg), and thereafter transformed to safe environmental concentrations in the environment where the food organisms are exposed to (e.g. water ng/L and/or sediment -mg/kg). In every legislation, risk limits for individual substances are formulated according to stringent protocols, where uncertainty is followed by reducing the lowest observed effect endpoint or the derived hazard concentration with appropriate assessment factors (AF – sometimes also called safety factors). The use of assessment factors may reduce the RL by several orders of magnitude. It is therefore very hard to make a reliable estimate of what really will happen in terms of ecosystem damage in a particular situation where the RLs are exceeded. It is not always easy to trace the overall assessment factors that are applied in the derivation of risk limits. In order to express risk in easily understandable terms for lay people, a widely applied strategy is to divide the entire continuous risk scale (RQ or ΣRQ, theoretically ranging from zero to infinity) into three color coded parts:
1. The green part indicates very reliable estimates where the risk with near 100% certainty indicates that no impacts will occur even if the evaluated situation is to occur during prolonged periods of time. For this part of the risk scale we will adopt the local situation where the concentrations are below the certified risk limits.
2. The orange part, related to possible risks, is indicative for a situation where we can only predict impacts with a large uncertainty. In terms of RL this applies to the RQ range (uncertainty margin – UM) between the RL and the RL multiplied by the applied assessment factor.
3. The red part is indicative for the higher concentration range where we are near 100% certain that unacceptable impacts of chemical exposure will occur.
3
Sampling
The week from October 29th to November 2nd, 2012 a two person team consisting of Mr ing.
Arthur de Groot (RIVM-IMG) and Dr Ir Michiel Kotterman (IMARES) traveled to Bonaire and took the required samples in collaboration with representatives of the Dutch Ministry of I&M and by the area managers of Stichting Nationale Parken Bonaire (STINAPA Bonaire). STINAPA is a non governmental, non profit foundation commissioned by the island government to manage the two protected areas of Bonaire: the Bonaire National Marine Park (BNMP) and the Washington
Slagbaai National Park (WSNP). The sampling team was guided through the WSNP by a park
ranger, Mr G. Thode.
3.1 Sampling procedure
Before the actual sampling took place at the preselected sampling locations, readings on depth, pH, conductivity, dissolved oxygen and temperature were taken in the field. The measurements where conducted just under the water surface and a few centimeters above the sediment layer on the bottom of the lake. Water and sediment samples were taken in duplicate. To avoid the introduction of turbidity in the water samples, the water samples were taken first by submersing a plastic beaker to approximately mid depth, and subsequently filling two glass 1 L bottles. After sampling the water, two 250 mL sediment samples were taken by carefully scraping the
sediment of the bottom surface layer and transferring the collected sediment to a 250 ml glass container. After sampling the samples are labeled and stored in a cool box. After a sampling day, all samples where store in a refrigerator, until transport to the Netherlands. The water content in most initial sediment samples was very high due to the sampling technique. Some of these sediment samples settled considerably during storage at Bonaire. The overlaying water layer was discarded before transport to The Netherlands.
3.2 Sampling schedule and locations
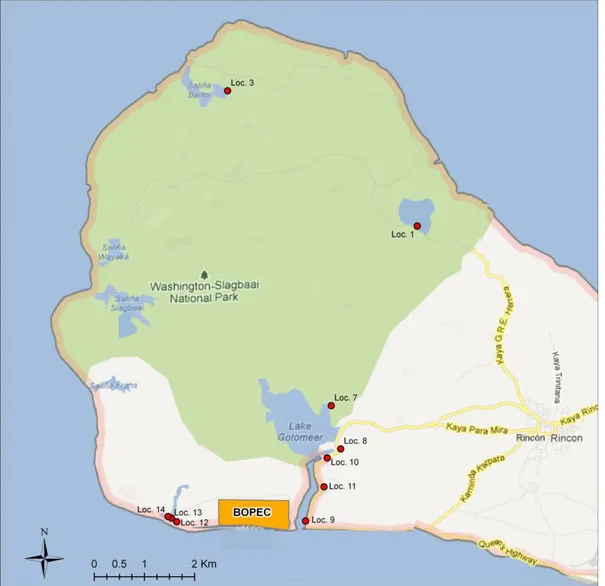
Salinas Matijs and Bartol East where sampled on 29 October, Lake Goto on 30 October and Salina Tam on 31 October 2012.
A tabular overview of sampling data is given in Appendix 1, Table 6.
Figure 1 Map of the north-eastern part of the island of Bonaire, showing the sampling locations by code – Loc 1 to 14, with missing numbers.
4
Chemical analyses and properties of the chemicals
4.1 Polycyclic Aromatic Hydrocarbons
At TNO, the analysis of PAH compounds is automated to quantify the concentrations of the most commonly occurring 16 EPA PAHs in a single analytical run. It proved that limiting the analyzed compounds to naphtalene and phenanthrene did not reduce the overall analytical expenditure.
4.1.1 Analytical procedure
The organic constituents in the water samples are extracted by speeddisk (J.T. Baker) filtration on a solid phase, which is then eluted with toluene. The organic constituents in the sediment samples were collected in toluene by Accelerated Solvent Extraction (ASE). The toluene solution is subsequently analyzed to determine the concentration of the 16 EPA PAHs by a GCMS
procedure with isotope dilution.
4.1.2 The PAH compounds analyzed and their risk limits
The set of analyzed PAH compounds, together with justified risk limits for water and sediments is presented in Table 1 . The MPC values are derived by calculating the MPCeco, water and the
MPCeco, sediment as the hazard concentration for 5% (HC5) of the tested species exposed to water
or sediment, respectively. The testdata are given for a mix of fresh and saltwater taxa. The MPC calculations are based on a SSD approach with (sub)chronic NOEC data and dividing the
resulting HC5 concentration by an AF of 5 (HC5/5) (Table 99, p 102 in Verbruggen 2012). Risk limits for secondary poisoning are not readily available for all 16 PAH compounds. In view of the very low concentrations now observed in the sample Bonaire waterbodies and the low associated risk of direct ecotoxic effects (Appendix 2, Table 7 and Appendix 4, Table 9), we did not
evaluate the risk of secondary poisoning for PAH compounds. Risk limits are always derived from experiments with a limited exposure duration. For (sub)chronic toxicity tests, the maximum exposure duration is about a month. Potentially, the exposure time to the substances originating from the BOPEC fire in 2010 is now (december 2012) more than 27 months. Due to the fact that the concentrations of PAH were never so high that we may expect direct ecotoxic effects to occur, we did also not include considerations of prolonged exposure into the evaluation.
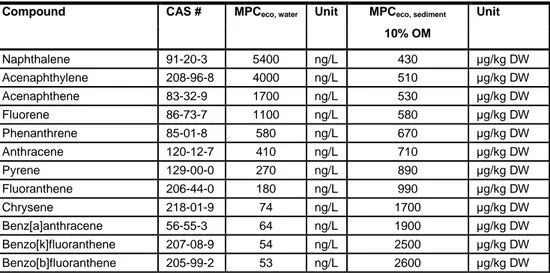
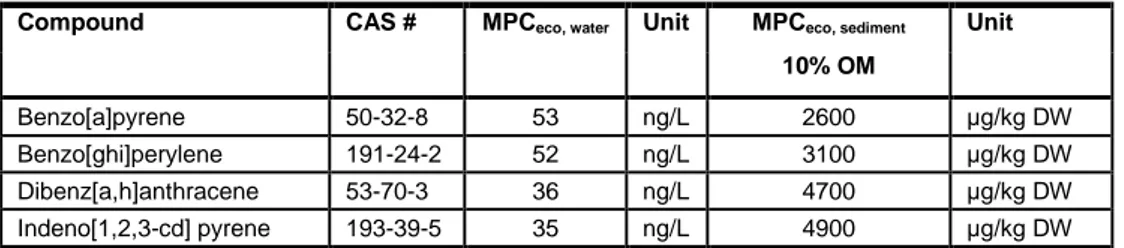
Table 1 The set of 16 most prominently occurring PAH compounds as selected by the USEPA. The HC5/5 for water and sediments are adopted as the maximum permissible risk limits. For sediments, the risk limits are standardized to sediments with 10% organic matter (OM) (Table 99, p 102 in Verbruggen 2012).
Compound CAS # MPCeco, water Unit MPCeco, sediment Unit
10% OM Naphthalene 91-20-3 5400 ng/L 430 μg/kg DW Acenaphthylene 208-96-8 4000 ng/L 510 μg/kg DW Acenaphthene 83-32-9 1700 ng/L 530 μg/kg DW Fluorene 86-73-7 1100 ng/L 580 μg/kg DW Phenanthrene 85-01-8 580 ng/L 670 μg/kg DW Anthracene 120-12-7 410 ng/L 710 μg/kg DW Pyrene 129-00-0 270 ng/L 890 μg/kg DW Fluoranthene 206-44-0 180 ng/L 990 μg/kg DW Chrysene 218-01-9 74 ng/L 1700 μg/kg DW Benz[a]anthracene 56-55-3 64 ng/L 1900 μg/kg DW Benzo[k]fluoranthene 207-08-9 54 ng/L 2500 μg/kg DW Benzo[b]fluoranthene 205-99-2 53 ng/L 2600 μg/kg DW
Compound CAS # MPCeco, water Unit MPCeco, sediment Unit 10% OM Benzo[a]pyrene 50-32-8 53 ng/L 2600 μg/kg DW Benzo[ghi]perylene 191-24-2 52 ng/L 3100 μg/kg DW Dibenz[a,h]anthracene 53-70-3 36 ng/L 4700 μg/kg DW Indeno[1,2,3-cd] pyrene 193-39-5 35 ng/L 4900 μg/kg DW 4.1.3 Analytical results
The analytical results of the PAH analyses are presented in Appendix 2, Table 7.
4.2 Perfluorinated compounds
At IMARES, the analysis of PFC compounds is automated to quantify the concentrations of the most commonly occurring 12 PFCs in a single analytical run. It proved that limiting the analyzed compounds to PFOA and PFOS did not reduce the overall analytical expenditure.
4.2.1 Analytical procedure
For all PFC analyses 50 ng of 13C4-PFOS in 350 µl of methanol and 50 ng of 13C4-PFOA in 350 µl of methanol were used as internal standards.
For water samples an internal standard was added to 1 liter of sample, after which the sample was vigorously shaken. A 1 g Oasis HLB solid phase extraction (SPE) column was prepared by activating with 10 ml of methanol followed by 20 ml of demineralized water after which the sample was introduced onto the column. Subsequently, 5 ml of acetonitrile was used to rinse the bottle and elute the column, followed by another 5 ml of acetonitrile. The samples where then dried over a glass filter containing sodium sulfate and concentrated to approximately 1 ml. Subsequently, 50 mg of ENVIcarb (Sigma Aldrich, Zwijndrecht, Netherlands) was added to the sample after which it was vortexed for 1 minute and then centrifuged for 20 minutes at 3000 rpm. The homogenate was transferred to a polypropylene auto sampler vial and concentrated under nitrogen to approximately 350 µl. The sample was made up to 700 µl by adding
demineralized water after which the vial was capped and stored at 4°C until analysis by LC-MS. For sediment samples, an internal standard was added to 2 g of (homogenized wet) sample in a 15 ml polypropylene (pp) tube. Eight ml of acetonitrile was added and the sample was shaken for 3 minutes by hand, 30 minutes on a shaker and then centrifuged for 20 minutes at 3000 rpm after which the acetonitrile was transferred to a 50 ml pp tube. The extraction was repeated 2 times. The extract was concentrated to 5 ml using a TurboVap. Subsequently, 5 ml of hexane was added and the sample was shaken vigorously for 5 minutes and then centrifuged at 3000 rpm for 5 minutes after which the hexane layer was removed. Due to the high salt content after concentration, the water and the acetonitrile did not fully mix (two separate layers). The salt water layer was removed by drying over 20 grams of sodium sulfate. This was repeated 2 times after which the acetonitrile extract was concentrated to approximately 700 µl. 50 mg of
ENVIcarb was added and the sample was vortexed for 1 minute and subsequently centrifuged for 5 minutes at 10000 rpm. The extract was transferred into a auto sampler vial and
concentrated under nitrogen to approximately 350 µl. The sample was made up to 700 µl by adding demineralized water after which the vial was capped and stored at 4°C until analysis by LC-MS.
Dry weight was determined gravimetrically by weight loss (103 °C, 3 hours). Dry weight in sediment samples was corrected for dry weight of water samples; due to the high salt content the mass of salt in the adhering water was significant.
Dry weight was also determined by washing sediment twice with a relative large volume of demineralized water (followed by centrifugation). The dry weight was comparable with the values obtained by correcting for calculated adhering salt.
Organic carbon was determined gravimetrically as loss on ignition (550°C, 22 h) in sediment samples previously washed twice with demineralized water to remove the salt.
4.2.2 The PFC compounds analyzed, their risk limits and partitioning
The set of analyzed PFC compounds for water and sediments is presented in Table 2, together with molecular mass, chain length and an estimate of the partitioning coefficient (Koc) of the compounds between water and the organic carbon content in the sediment (Sepulvado et al. 2011). Table 3 gives the justified risk limits that are only derived for PFOS (Moermond et al. 2011) in water. Bodar et al. (2011) derive risk limits for PFOS in terrestrial soil. We adopted these risk limits without modification for sediments. Properly derived risk limits for the other PFCs analyzed are simply not available, because these compounds have never been subject to formal toxicity testing. However, PFOS is by far the most toxic and the most bioconcentrative constituent of the fire fighting foam formulations used to extinguish the BOPEC fires. The ecotoxicological effectivity of PFOA is considered to be less than that of PFOS by a factor of approximately 50 (Hekster et al. 2003). Sulfonates accumulate in biota to a greater extent than the corresponding carboxylates (Kwadijk et al. 2010). This is most probably the only reason for PFOS to be more toxic than PFOA (personal communication Eric Verbruggen). The extent of bioconcentration of PFCs appears to be highly structure dependent. Martin et al. (2003) showed that carboxylates with less than 7, and sulfonates with less than 6 perfluoroalkyl carbons did hardly accumulate in rainbow trout. For longer PFCs than PFOS, bioconcentration factors increase with increasing length of the perfluoroalkyl chain. Luckily, the compounds with a chain length longer than 8 were not present in the samples taken in 2010 nor in 2012 (Appendix 3, Table 8). It has become clear that PFCs behave differently from non-polar and slightly polar organic micropollutants (Hekster et al. 2003). The perfluoroalkylated chain is oleophobic as well as hydrophobic (Key et al. 1997). Therefore, the partitioning process of PFCs to lipids in biota or to organic matter in sediments is not fully governed by hydrophobic interactions. PFCs are intrinsically polar chemicals. For example, PFOS is present in the environment as the dissociated salts. Therefore, electrostatic interactions may play an important role in their distribution. Both biotic membranes and sediment surfaces have various polar parts with which such interactions are plausible. For these reasons the prediction of ecotoxicity through quantitative structure-activity relationships (QSAR) based on octanol-water partitioning is not applicable to PFC compounds. Although the partitioning between water and the organic material contained in the sediments is not fully governed by partitioning between water and organic carbon, there is a marked gradient in the Koc values (Sepulvado et al. 2011) and also in the overall sediment partitioning Kd values (Möller 2009) for the PFCs associated with different chain lengths. In Figure 2 the chain length is related to the Koc value for carboxylates and sulfonates separately. Due to the fact that there are only few data available, the risk limits for PFOS are all
characterized by the application of rather large assessment factors. For the determination of the risk limit for direct ecotoxicity upon (sub)chronic exposure, eleven NOEC/EC10 values are available for the combined freshwater and marine datasets (Moermond et al. 2011), the lowest of which is 27 μg/L for Pimephales promelas. According to the guidance, an assessment factor of 10 would normally be applied to the lowest NOEC when long-term NOECs are available from at least three species across three trophic levels. This is only sufficient, however, if the species tested can be considered to represent one of the more sensitive species groups. In the available data are several lowest observed effect concentrations (LOEC - specified by a less than sign – “<”) that are far below the lowest NOEC, and substantial effects are observed at the level of
these LOECs. Applying an assessment factor of 10 to the lowest NOEC of 27 μg/L would lead to an MPCeco, water of 2.7 μg/L. This value is highly underprotective, since considerable effects on
emergence of Chironomus tentans were present at 2.3 μg/L. Moreover, 18% effect on
metamorphosis of the insect Enallagma cyathigerum (Bots et al. 2010) and 80% effect on larval survival of Oryzias latipes (Ji et al. 2008) were observed at 10 μg/L. Therefore, an assessment factor of 100 is put on the lowest available endpoint (the LOEC of 2.3 μg/L) and the MPCeco, water
using the assessment factor method becomes 2.3 / 100 = 0.023 μg/L = 23 ng/L. The MPCeco, sediment is derived with a similar method from the measured (sub)chronic toxicity in terrestrial soil
for earth worm (14 day NOEC of 77 mg/kg DW at 10% organic matter (OM)) and lettuce (EC10 approx. 1 mg/kg DW). With chronic data available for only a single species of plants a
assessment factor of 100 is to be applied, leading to an MPCeco, sediment of 10 μg/kg DW. Aquatic toxicity studies revealed that insect larvae are highly sensitive towards PFOS exposure. The MPC based only on earth worms and terrestrial plants may not be very protective for sediment dwelling species. The MPCsp, water for secondary poisoning in water is derived from the
lowest MPCoral of 0.037 mg/kgbiota ww for rabbits. This value is based on a no observed adverse
effect level (NOAEL) of 0.1 mg/kg bw/d for maternal weight gain from a teratogenicity study where exposure lasted from gestation day 6 to day 20. The applied assessment factor is 90. Normally, the factor of 90 is applied to subchronic toxicity studies with an exposure duration of minimally 90 days. From similar studies with rats exposed during the gestation period compared with full chronic studies, it can be concluded that the assessment factor of 90 can also be applied to teratogenicity studies. The assessment factor of 90 is composed of a factor of 3 to correct for the high caloric content of fodder given in lab experiments, a factor of 3 to
extrapolate from subchronic to chronic exposure and a factor of 10 as a real assessment factor. Subsequently, the MPCsp, water can be calculated using the bioconcentration factor (BCF) from
water to food organisms of 2800 L/kg and the biomagnification factor (BMF) from food to predator of 5 kg/kg. The MPCsp, water thus becomes 0.037 / (2800 × 5) = 2.6 × 10⁻⁶ mg/L =
0.0026 μg/L = 2.6 ng/L. The MPCsp, sediment for secondary poisoning in sediments is derived from
the same data with a biota-to-soil-accumulation-factor (BSAF = the ratio between the
concentration in earth worms and soil) instead of the aquatic BCF. The BSAF is 2.5 kg/kg dw. With a correction for the specific mass of sediments, the MPCsp, sediment becomes: 3.2 μg/kg dw
for sediments with 10 % of OM. For both risk limits for secondary poisoning, the assessment factor for the concentration ranges with uncertain impact is therefore set to 30. As for PAH compounds, the risk limits for PFOS are derived from experiments with a limited exposure duration. For (sub)chronic toxicity tests, the maximum exposure duration is about a month. Potentially, the exposure time to the substances originating from the BOPEC fire in 2010 is now (december 2012) more than 27 months. It is virtually impossible to account for the potential effects that may be caused by this prolonged exposure times.
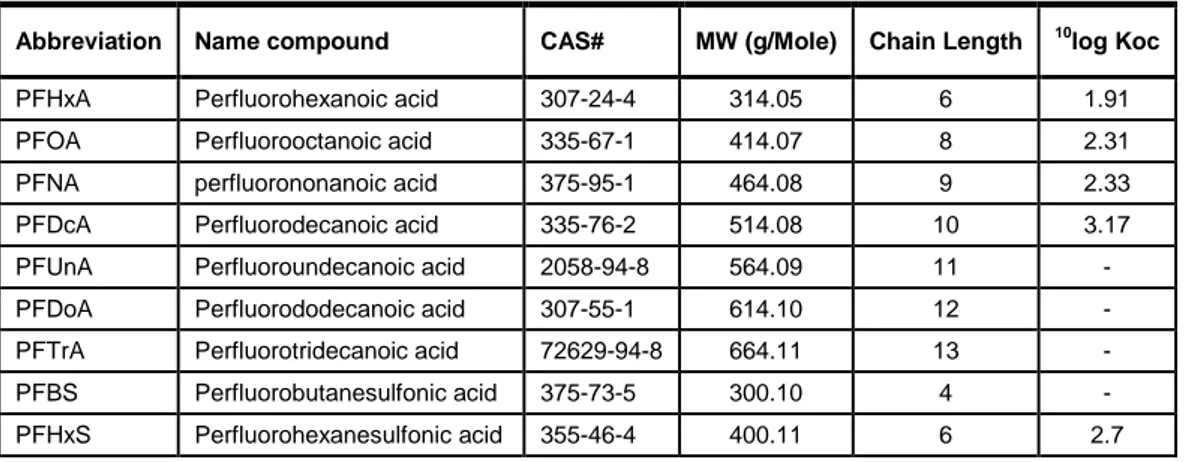
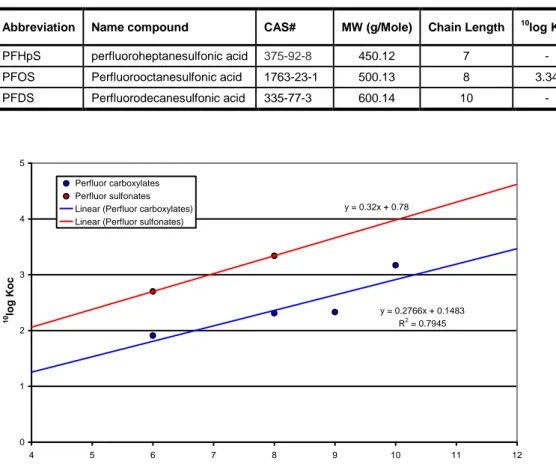
Table 2 The set of the most prominently occurring PFC compounds as selected by the US EPA, together with their molecular mass, chain length and the Koc (Sepulvado et al. 2011). - = not available.
Abbreviation Name compound CAS# MW (g/Mole) Chain Length 10log Koc
PFHxA Perfluorohexanoic acid 307-24-4 314.05 6 1.91
PFOA Perfluorooctanoic acid 335-67-1 414.07 8 2.31
PFNA perfluorononanoic acid 375-95-1 464.08 9 2.33
PFDcA Perfluorodecanoic acid 335-76-2 514.08 10 3.17
Abbreviation Name compound CAS# MW (g/Mole) Chain Length 10log Koc
PFHpS perfluoroheptanesulfonic acid 375-92-8 450.12 7 -
PFOS Perfluorooctanesulfonic acid 1763-23-1 500.13 8 3.34
PFDS Perfluorodecanesulfonic acid 335-77-3 600.14 10 - y = 0.2766x + 0.1483 R2 = 0.7945 y = 0.32x + 0.78 0 1 2 3 4 5 4 5 6 7 8 9 10 11 12 Chain length 10 lo g K o c Perfluor carboxylates Perfluor sulfonates Linear (Perfluor carboxylates) Linear (Perfluor sulfonates)
Figure 2 The relationship between chain length and Koc value (Sepulvado et al. 2011). Table 3 The risk limits defined for PFOS as the Maximum Permissible Concentration (MPC) based on assessment factors (AF) for direct ecotoxicological effects (eco) and for secondary poisoning (sp) (Bodar 2011, Moermond et al. 2011). For sediments, the risk limits are standardized to dry sediments with 10% organic matter (OM).
Abbreviation Name MPCeco,
water MPCsp, water MPCeco, sediment MPCsp, sediment
PFOS Perfluorooctanesulfonic acid 23 ng/L 2.6 ng/L 10 μg/kg DW 3.2 μg/kg DW
AF Assessment factors applied (AF) 100 30 100 30
4.2.3 Analytical results
The analytical results of the PFC analyses are presented in Appendix 3, Table 8.
Scrutinizing the analytical results for the PFCs, the large difference between the water and sediment accommodated concentrations immediately jumps into the eye. At the locations 7 to 11, the concentrations in the water phase for the PF-carboxylates is relatively high (above 100 ng/L) for PFHxA and around 10 ng/L for PFOA. In the sediments, the concentrations of these substances are below the detection limit. This can only be explained by a relatively low hydrophobicity (low Koc, see Figure 2) and high polarity, resulting in a low adsorption to soil particulates and a high solubility. This holds for all the carboxylates as compared to the PF-sulfonates. For the PF-sulfonates the situation is different. At the locations 7 to 11, we see high (>100 ng/L) water concentrations for PFBS, PFHxS and PFOS, while the concentrations for PFHpS are detectable, but below 10 ng/L. In the sediments, only the concentrations for PFHxS and PFOS are above the detection limit, but generally below a concentration of 10 μg/kg WW. The PFOS concentration in the sediment sample of location 9, with 26 μg/kg WW is deviating. At
this location, sediment was very hard to collect between the hard sediment (consisting of large chunks of coral and rocks), a large part of the collected soft upperlayer of sediment was therefor collected about 50 meters from the water samples. These two spots were divided by a very low, porous dam of rocks and coral This sample is characterized by a high water content of more than 90% and a high % of organic matter. Similar to the PF-carboxylates, the low adherence of PFBS to sediment particulates prevents the high concentration in the water phase to reflect in high concentrations in the sediment.
5
Risk analysis and discussion
5.1 Polycyclic Aromatic Hydrocarbons
5.1.1 The 2012 concentrations as compared to 2010
The 2012 concentrations in water and sediments for 16 US EPA PAH compounds are presented in Appendix 2, Table 7. Immediately after the fire in 2010 the analyses of PAH compounds from water bodies in Bonaire was restricted to the sediments of Salina Tam, Lake Goto and Salina Bartol. Water samples were not taken for PAH analysis in 2010. The dataset from 2010 also relates to a subset of 12 of the 16 different PAH compounds: Acenaphthene, Anthracene, Benzo[ghi]perylene and Dibenz[a,h]anthracene were not measured in 2010. Of all the sediment concentrations measured in 2010 the highest value was 20 μg/kg DW found for naphtalene in Salina Tam. In 2012 the highest concentration was 9.9 μg/kg DW found for fluoranthene also in Salina Tam. In general the concentrations went down in the period between 2010 and 2012. Salina Matijs (Location 1) is characterized by comparatively high PAH concentrations (Appendix 2, Table 7) for acenaphtylene in water and sediment. This may be explained by a different origin and exposure route than in the other water bodies. Salina Matijs may be exposed to airborne PAH compounds, rather than the water related PAHs in Salina Tam and Lake Goto.
5.1.2 The risk of ecological damage in 2012
In tabular form the risk analysis by the sigma RQ approach of the PAH compounds contained in water and sediments of the sampled water bodies on Bonaire are presented in Appendix 4, Table 9. The RQ for a particular compound is defined as the concentration (Appendix 2, Table 7) divided by the risk limit (Table 1), both expressed in the same units. In case of sediments, the risk limits (RL) are corrected for the local organic carbon content of the sediments. The risk limit is quantified as µg/kg DW for sediments containing 10% of organic matter (OM). If the local sediment then contains x% of organic matter, the risk limit is recalculated according to RLnew =
RLold*x%OM/10%OM.
For all sampling locations in both sediments and water, the sum of the risk quotients (ΣRQ) for the different PAHs is considerably below unity (1), indicating a complete absence of risk in terms of ecosystem impact caused by exposure to PAHs. This is why we did not evaluate the risk of secondary poisoning, as wel as the assessment factors that have been applied in the derivation of the risk limits.
5.2 Perfluorinated compounds
5.2.1 The 2012 concentrations as compared to 2010
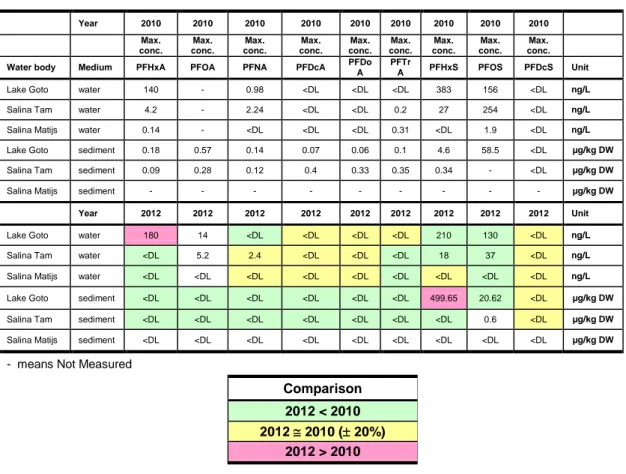
Table 4. gives a color coded comparison of the results of the maximum PFC measurements in water and sediments generated for the different water bodies immediately after the fire in 2010 (RIVM 2011) and in October 2012 (Table 8). This evaluation is only valid if the limits of
detection for the 2010 and 2012 PFC concentration data are similar. The 2010 and 2012 detection limits appear to be of the same order of magnitude. A more statistical approach does not seem to be possible, because the data for 2010 and 2012 are derived from different
locations. As an overall conclusion it can be stated that the concentrations of the measured PFC compounds show a slight, but for most compounds a consistent decrease since 2010. This does not mean that the PFCs are subject to degradation, but mainly that some of it is diluted by rain or sea water, or relocated to a pool of PFC in the subsoil, the groundwater, or the biota. From a comparison of individual PFC measurements (not presented), it is obvious that the PFC
concentrations in the 2012 evaluation are more evenly distributed within the different water bodies.
Table 4 Color coded comparison of the maximum analytical results for sampled PFC compounds immediately after the fire in 2010 and in the month of October 2012, based on the maximum concentrations observed in the water bodies.
Year 2010 2010 2010 2010 2010 2010 2010 2010 2010 Max. conc. Max. conc. Max. conc. Max. conc. Max. conc. Max. conc. Max. conc. Max. conc. Max. conc.
Water body Medium PFHxA PFOA PFNA PFDcA PFDo A
PFTr
A PFHxS PFOS PFDcS Unit
Lake Goto water 140 - 0.98 <DL <DL <DL 383 156 <DL ng/L Salina Tam water 4.2 - 2.24 <DL <DL 0.2 27 254 <DL ng/L Salina Matijs water 0.14 - <DL <DL <DL 0.31 <DL 1.9 <DL ng/L Lake Goto sediment 0.18 0.57 0.14 0.07 0.06 0.1 4.6 58.5 <DL µg/kg DW Salina Tam sediment 0.09 0.28 0.12 0.4 0.33 0.35 0.34 - <DL µg/kg DW
Salina Matijs sediment - - - µg/kg DW
Year 2012 2012 2012 2012 2012 2012 2012 2012 2012 Unit
Lake Goto water 180 14 <DL <DL <DL <DL 210 130 <DL ng/L Salina Tam water <DL 5.2 2.4 <DL <DL <DL 18 37 <DL ng/L Salina Matijs water <DL <DL <DL <DL <DL <DL <DL <DL <DL ng/L Lake Goto sediment <DL <DL <DL <DL <DL <DL 499.65 20.62 <DL µg/kg DW Salina Tam sediment <DL <DL <DL <DL <DL <DL <DL 0.6 <DL µg/kg DW Salina Matijs sediment <DL <DL <DL <DL <DL <DL <DL <DL <DL µg/kg DW
- means Not Measured
Comparison 2012 < 2010 2012 2010 ( 20%)
2012 > 2010
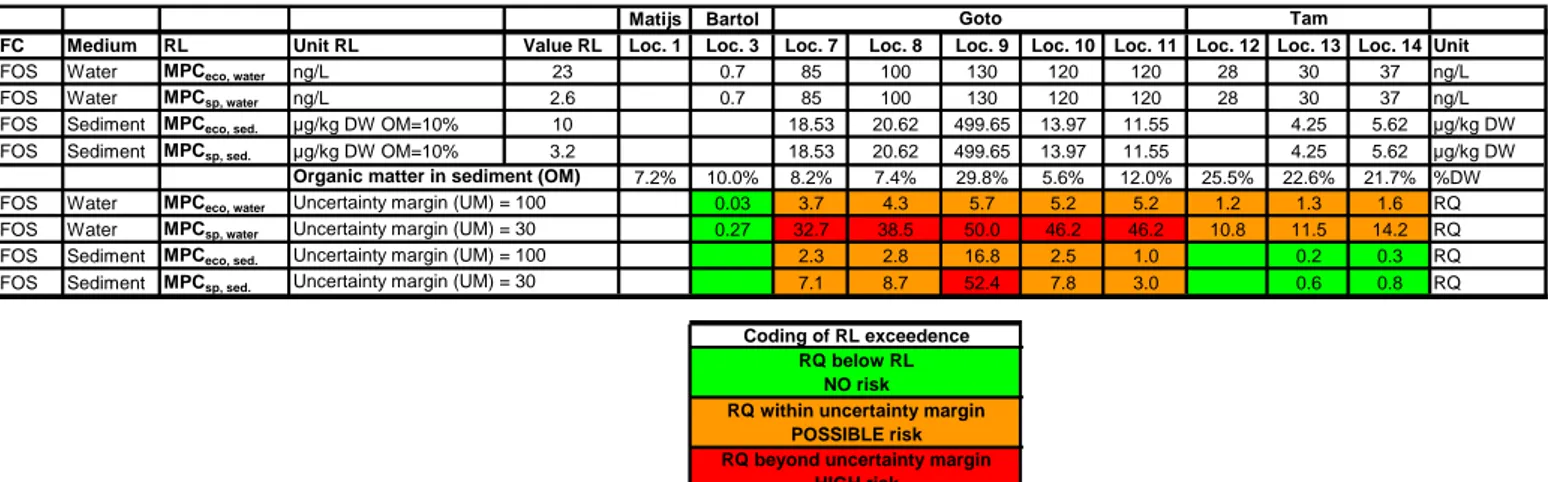
5.2.2 The risk of ecological damage in 2012
The evaluation of ecological risk associated with the observed exposure to PFOS is given as risk quotients (RQ) in Table 5. With respect to the risk quotient of direct ecotoxicity in water it is important to realize that a number of specific aspect should, additionally be taken into account when discussing the possibility that effects will actually occur. These aspects are 1) the
simultaneously co-exposure of the organisms to other PFCs than PFOS, 2) the very long exposure time of organisms to PFCs (two years) and 3) the RL is not based on a NOEC divided by an assessment factor, but on a LOEC (i.e. concentration level at which effects will occur). It is difficult to precisely quantify the total impact of these extra factors, but they definitely point towards a larger possibility that adverse effects will become manifest, than when exceeding the risk limits for PFOS only. The reference salinas Matijs en Bartol are exposed to PFOS to a green level, indicating the complete absence of risk. For Salina Tam the exceedences op risk limits are relatively low, with a complete absence of risk for the sediments and a very modest exceedence of the risk limits for water exposure with a maximum risk of RQ = 1.6 for direct intoxication and a RQ = 14.2 for secondary poisoning. All sampling locations in Lake Goto indicate a possible risk in the uncertain orange RQ-range, for direct ecotoxicological effects induced by sediment exposure with a maximum RQ of 16.8 and an average RQ of 5.1, and for water exposure a maximum RQ of 5.7 with an average RQ of 4.8. This direct ecotoxicity may have reduced the
secondary poisoning from sediment exposure is the only observation with a red risk indication. For sediments the RQ maxima of 16.8 for direct ecotoxicity and of 52.4 for secondary poisoning are clear outliers with respect to the average RQ in the samples from Lake Goto of 5.2 and 15.8, respectively. These outlying RQ values are both coming from a sediment sample with a high water content taken at location 9. There is also a clear gradient that correlates with the distance to the BOPEC facility: the water samples taken at locations 7 and 8 are both characterized by a lower RQ than deducted for the locations 9 – 11.
Table 5 RQ risk analysis as performed for the measured PFOS in the sampled water bodies on Bonaire. The RQ values are calculated by dividing the measured concentrations (Appendix 2,
Table 8) by the compound and medium specific risk limit (RL as specified in Table 3), for water
and sediment and for direct effects of intoxication and the occurrence of secondary poisoning in the food chain. Concentrations below the limit of detection (DL) are omitted. For the different RLs the applied assessment factor is used as an uncertainty margin (UM) for the orange RQ range. For sediments the risk limits are corrected for the organic matter content of the local sediments.
Matijs Bartol
PFC Medium RL Unit RL Value RL Loc. 1 Loc. 3 Loc. 7 Loc. 8 Loc. 9 Loc. 10 Loc. 11 Loc. 12 Loc. 13 Loc. 14 Unit
PFOS Water MPCeco, water ng/L 23 0.7 85 100 130 120 120 28 30 37 ng/L
PFOS Water MPCsp, water ng/L 2.6 0.7 85 100 130 120 120 28 30 37 ng/L
PFOS Sediment MPCeco, sed. µg/kg DW OM=10% 10 18.53 20.62 499.65 13.97 11.55 4.25 5.62 µg/kg DW
PFOS Sediment MPCsp, sed. µg/kg DW OM=10% 3.2 18.53 20.62 499.65 13.97 11.55 4.25 5.62 µg/kg DW
7.2% 10.0% 8.2% 7.4% 29.8% 5.6% 12.0% 25.5% 22.6% 21.7% %DW
PFOS Water MPCeco, water 0.03 3.7 4.3 5.7 5.2 5.2 1.2 1.3 1.6 RQ
PFOS Water MPCsp, water 0.27 32.7 38.5 50.0 46.2 46.2 10.8 11.5 14.2 RQ
PFOS Sediment MPCeco, sed. 2.3 2.8 16.8 2.5 1.0 0.2 0.3 RQ
PFOS Sediment MPCsp, sed. 7.1 8.7 52.4 7.8 3.0 0.6 0.8 RQ
Goto Tam
Uncertainty margin (UM) = 30 Organic matter in sediment (OM) Uncertainty margin (UM) = 100 Uncertainty margin (UM) = 30 Uncertainty margin (UM) = 100
RQ below RL NO risk
RQ within uncertainty margin POSSIBLE risk
RQ beyond uncertainty margin HIGH risk
6
Conclusions and recommendations
6.1 Conclusions
The results derived from the October 2012 mission on the determination of the chemical water quality for Lake Goto, Salina Tam and the reference salinas Matijs en Bartol on the island of Bonaire are inconclusive for Lake Goto and Salina Tam with respect to the two study question to be answered:
1. The concentrations PFC-compounds PFOS, PFOA, PFHxA, PFHxS, PFBS and PFHpS in the water of Salina Tam and Lake Goto are still exceeding the risk limits, but within the margin of uncertainty (Appendix 3, Table 8). For sediments the concentarations of PFHxS and PFOS are similarly exceeding the risk limits for direct ecotoxicity within the uncertainty margin only in Lake Goto. For secondary poisoning the PFOS concentrations in the water from Lake Goto and a single sediment sample from location 9 are such that the margins of uncertainty are exceeded. All of these PFC compounds are certainly related to the use of fire fighting foams (used to extinguish the BOPEC fire in 2010, or used during earlier fire incidents at the BOPEC facility). However, the concentrations for all PFC compounds show a more even distribution and a decrease in time as compared to 2010 (Table 4). For the PAH compounds, the situation is completely different. The concentrations were all well below the quality criteria for water and sediment already in 2010, but the concentrations went further down (near half) over the two years preceeding October 2012. For both types of contaminants, the reference salinas Matijs (location 1) and Bartol (location 3) have very low
concentrations, not exceeding any quality criterion.
2. For all measured water bodies this implies that there are no adverse biological effects to be expected from the exposure to the very low PAH concentrations. Only for Lake Goto and Salina Tam, the exposure to PFC compounds, and mainly the exposure to PFOS as the most toxic and most bioconcentrative of all the PFCs, demonstrated to have relatively high concentrations in the range where biological effects, both directly as well as in the food chain, cannot be excluded.
6.2 Recommendations
In order to address the question if ecological effects in the food chain because of the elevated PFOS concentrations have actually taken place, an ecological study is needed. Such a study might elucidate the possibly contaminated food supply of the flamingo population and potential other ecologically or climatologicallly significant disturbing factors that may have caused the flamingo population to disappear. Some of the samples required for this evaluation are already taken by our sampling and analytical partner IMARES, awaiting an assignment in this direction by the Dutch Minstery of Economic affairs (EZ) in 2013.
References
Bodar, C. W. M., et al. 2011. Advies risicogrenzen grond en grondwater voor PFOS. RIVM Briefrapport 601050002/2011, RIVM, Bilthoven, the Netherlands.
Bots, J., De Bruyn, L., Snijkers, T., Van den Branden, B., and Van Gossum, H. 2010. Exposure to perfluorooctane sulfonic acid (PFOS) adversely affects the life cycle of the damselfly
Enallagma cyathigerum. Environmental Pollution 158:901-905.
Buitrago, J., Rada, M., Barroeta, M. E., Fajardo, E., Rada, E., Simal, F., Monente, J., Capelo, J., and Narváez, J. 2010. Physico-Chemical Indicator´s Monitoring for Water Quality in the Salinas of Northwest Bonaire, N.A. A base line study. A technical report. Estación de Investigaciones Marinas de Margarita to STINAPA, Bonaire.
Hekster, F. M., Laane, R. W. P. M., and De Voogt, P. 2003. Environmental and Toxicity Effects of Perfluoroalkylated Substances. Reviews of Environmental Contamination and Toxicology 179:99-121.
Ji, K., Kim, Y., Oh, S., Anh, B., Jo, H., and K., C. 2008. Toxicity of perfluorooctace sulfonic acid and perfluorooctanoic acid on freshwater macroinvertebrates (Daphnia magna and Moina macrocopa) and fish (Oryzias latipes). Environmental Toxicology and Chemistry 27:2159-2168.
Key, B. D., Howell, R. D., and Criddle, C. S. 1997. Fluorinated organics in the biosphere. Environmental Science and Technology 31:2445-2454.
Kwadijk, C. J. A. F., Korytár, P., and Koelmans, A. A. 2010. Distribution of perfluorinated compounds in aquatic systems in the Netherlands. Environmental Science and Technology 44:3746-3751.
Martin, J. W., Mabury, S. A., Solomon, K. R., and Muir, D. C. G. 2003. Bioconcentration and tissue distribution of perfluorinated acids in rainbow trout (Oncorhynchus mykiss). Environmental Toxicology and Chemistry 22:196-204.
Moermond, C. T. A., Verbruggen, E. M. J., and Smit, C. E. 2011. Environmental risk limits for PFOS - A proposal for water quality standards in accordance with the Water Framework Directive. RIVM Report 601714013/2010, RIVM, Bilthoven, the Netherlands.
Möller, A. 2009. Analysis of poly- and perfluoroalkyl compounds (PFCs) in surface water of the River Rhine using HPLC-MS/MS. Fachhochschule Lübeck, Lübeck, University.
RIVM. 2011. Compound depositions from the BOPEC fires on Bonaire - Measurements and risk assessment. RIVM Letter report 609022067/2011, RIVM, Bilthoven, the Netherlands. Sepulvado, J. G., Blaine, A. C., Hundal, L. S., and Higgins, C. P. 2011. Occurrence and Fate of
Perfluorochemicals in Soil Following the Land Application of Municipal Biosolids. Environmental Science and Technology 45:8106–8112.
Verbruggen, E. M. J. 2012. Environmental risk limits for polycyclic aromatic hydrocarbons (PAHs): For direct aquatic, benthic, and terrestrial toxicity. RIVM Report 607711007, RIVM, Bilthoven, the Netherlands.
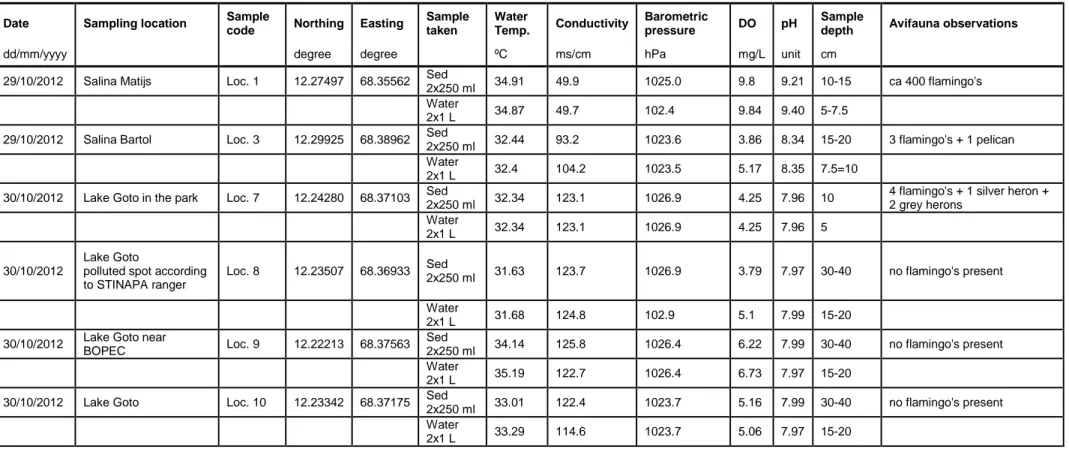
Table 6 Description of samples taken, together with field measured site characteristics.
Date Sampling location Sample
code Northing Easting
Sample taken Water Temp. Conductivity Barometric pressure DO pH Sample
depth Avifauna observations
dd/mm/yyyy degree degree ºC ms/cm hPa mg/L unit cm
29/10/2012 Salina Matijs Loc. 1 12.27497 68.35562 Sed
2x250 ml 34.91 49.9 1025.0 9.8 9.21 10-15 ca 400 flamingo's
Water
2x1 L 34.87 49.7 102.4 9.84 9.40 5-7.5
29/10/2012 Salina Bartol Loc. 3 12.29925 68.38962 Sed
2x250 ml 32.44 93.2 1023.6 3.86 8.34 15-20 3 flamingo's + 1 pelican Water
2x1 L 32.4 104.2 1023.5 5.17 8.35 7.5=10
30/10/2012 Lake Goto in the park Loc. 7 12.24280 68.37103 Sed
2x250 ml 32.34 123.1 1026.9 4.25 7.96 10
4 flamingo's + 1 silver heron + 2 grey herons
Water
2x1 L 32.34 123.1 1026.9 4.25 7.96 5
30/10/2012
Lake Goto polluted spot according to STINAPA ranger
Loc. 8 12.23507 68.36933 Sed
2x250 ml 31.63 123.7 1026.9 3.79 7.97 30-40 no flamingo's present Water
2x1 L 31.68 124.8 102.9 5.1 7.99 15-20
30/10/2012 Lake Goto near
BOPEC Loc. 9 12.22213 68.37563
Sed
2x250 ml 34.14 125.8 1026.4 6.22 7.99 30-40 no flamingo's present Water
2x1 L 35.19 122.7 1026.4 6.73 7.97 15-20
30/10/2012 Lake Goto Loc. 10 12.23342 68.37175 Sed
2x250 ml 33.01 122.4 1023.7 5.16 7.99 30-40 no flamingo's present Water
Date Sampling location
code Northing Easting taken Temp. Conductivity pressure DO pH depth Avifauna observations
dd/mm/yyyy degree degree ºC ms/cm hPa mg/L unit cm
30/10/2012 Lake Goto Loc. 11 12.22825 68.37233 Sed
2x250 ml 33.8 122.7 1023.0 5.59 8.03 30-40 no flamingo's present Water
2x1 L 34.82 121.8 1023.1 5.91 7.99 15-20
31/10/2012 Salina Tam Loc. 12 12.22200 68.39873 Sed
2x250 ml 31.23 48.6 1028.0 3.09 8.20 30-40 no flamingo's present Water
2x1 L 31.31 49.0 1028.0 5.36 8.32 15-20
31/10/2012 Salina Tam Loc. 13 12.22263 68.39967 Sed
2x250 ml 31.92 52.6 1028.1 2.72 8.04 30-40 no flamingo's present Water
2x1 L 30.73 48.8 1028.1 5.38 8.36 15-20
31/10/2012 Salina Tam Loc. 14 12.22293 68.40028 Sed
2x250 ml 30.86 48.2 1027.3 4.2 8.37 30-40
no flamingo's present, but some small birds foraging Water
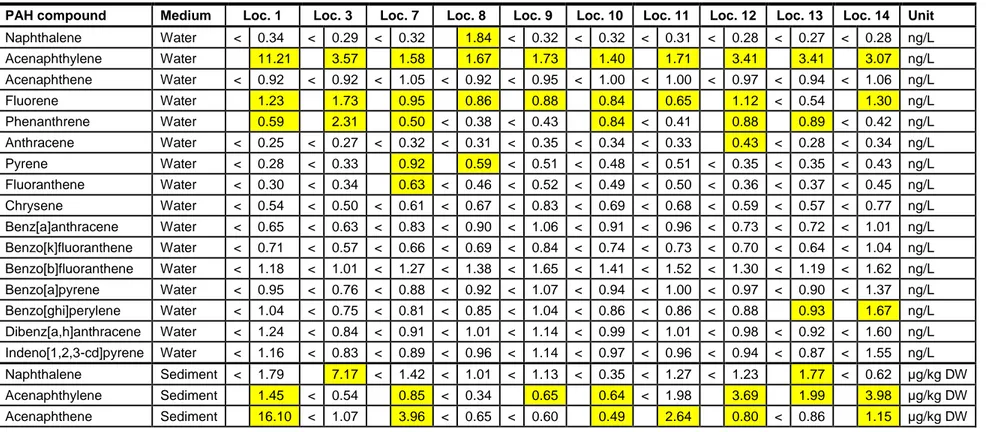
Table 7 Analytical results of the PAH measurements as performed by TNO. Yellow highlighted cells are above the limit of detection (LD).
PAH compound Medium Loc. 1 Loc. 3 Loc. 7 Loc. 8 Loc. 9 Loc. 10 Loc. 11 Loc. 12 Loc. 13 Loc. 14 Unit Naphthalene Water < 0.34 < 0.29 < 0.32 1.84 < 0.32 < 0.32 < 0.31 < 0.28 < 0.27 < 0.28 ng/L Acenaphthylene Water 11.21 3.57 1.58 1.67 1.73 1.40 1.71 3.41 3.41 3.07 ng/L Acenaphthene Water < 0.92 < 0.92 < 1.05 < 0.92 < 0.95 < 1.00 < 1.00 < 0.97 < 0.94 < 1.06 ng/L Fluorene Water 1.23 1.73 0.95 0.86 0.88 0.84 0.65 1.12 < 0.54 1.30 ng/L Phenanthrene Water 0.59 2.31 0.50 < 0.38 < 0.43 0.84 < 0.41 0.88 0.89 < 0.42 ng/L Anthracene Water < 0.25 < 0.27 < 0.32 < 0.31 < 0.35 < 0.34 < 0.33 0.43 < 0.28 < 0.34 ng/L Pyrene Water < 0.28 < 0.33 0.92 0.59 < 0.51 < 0.48 < 0.51 < 0.35 < 0.35 < 0.43 ng/L Fluoranthene Water < 0.30 < 0.34 0.63 < 0.46 < 0.52 < 0.49 < 0.50 < 0.36 < 0.37 < 0.45 ng/L Chrysene Water < 0.54 < 0.50 < 0.61 < 0.67 < 0.83 < 0.69 < 0.68 < 0.59 < 0.57 < 0.77 ng/L Benz[a]anthracene Water < 0.65 < 0.63 < 0.83 < 0.90 < 1.06 < 0.91 < 0.96 < 0.73 < 0.72 < 1.01 ng/L Benzo[k]fluoranthene Water < 0.71 < 0.57 < 0.66 < 0.69 < 0.84 < 0.74 < 0.73 < 0.70 < 0.64 < 1.04 ng/L Benzo[b]fluoranthene Water < 1.18 < 1.01 < 1.27 < 1.38 < 1.65 < 1.41 < 1.52 < 1.30 < 1.19 < 1.62 ng/L Benzo[a]pyrene Water < 0.95 < 0.76 < 0.88 < 0.92 < 1.07 < 0.94 < 1.00 < 0.97 < 0.90 < 1.37 ng/L Benzo[ghi]perylene Water < 1.04 < 0.75 < 0.81 < 0.85 < 1.04 < 0.86 < 0.86 < 0.88 0.93 1.67 ng/L Dibenz[a,h]anthracene Water < 1.24 < 0.84 < 0.91 < 1.01 < 1.14 < 0.99 < 1.01 < 0.98 < 0.92 < 1.60 ng/L Indeno[1,2,3-cd]pyrene Water < 1.16 < 0.83 < 0.89 < 0.96 < 1.14 < 0.97 < 0.96 < 0.94 < 0.87 < 1.55 ng/L Naphthalene Sediment < 1.79 7.17 < 1.42 < 1.01 < 1.13 < 0.35 < 1.27 < 1.23 1.77 < 0.62 µg/kg DW Acenaphthylene Sediment 1.45 < 0.54 0.85 < 0.34 0.65 0.64 < 1.98 3.69 1.99 3.98 µg/kg DW Acenaphthene Sediment 16.10 < 1.07 3.96 < 0.65 < 0.60 0.49 2.64 0.80 < 0.86 1.15 µg/kg DW
Fluorene Sediment 1.86 < 0.40 < 0.32 < 0.30 < 0.25 < 0.15 0.46 0.95 < 0.41 0.67 µg/kg DW Phenanthrene Sediment < 0.29 < 0.23 < 0.19 0.24 < 0.17 < 0.10 0.30 5.69 2.67 3.61 µg/kg DW Anthracene Sediment < 0.34 < 0.24 < 0.24 0.27 < 0.17 0.21 0.46 3.82 2.86 3.44 µg/kg DW Pyrene Sediment < 0.23 < 0.17 < 0.13 < 0.15 < 0.13 < 0.08 < 0.12 4.90 0.95 2.75 µg/kg DW Fluoranthene Sediment < 0.18 < 0.13 < 0.10 < 0.12 2.19 < 0.06 < 0.09 9.90 4.03 6.62 µg/kg DW Chrysene Sediment < 0.19 0.40 0.43 0.73 2.85 0.57 0.81 5.97 4.72 5.57 µg/kg DW Benz[a]anthracene Sediment < 0.19 < 0.15 < 0.12 0.21 1.92 < 0.08 0.22 2.87 2.47 2.56 µg/kg DW Benzo[k]fluoranthene Sediment < 0.17 < 0.15 < 0.12 0.21 2.00 0.11 0.22 4.11 2.37 3.39 µg/kg DW Benzo[b]fluoranthene Sediment < 0.17 0.27 0.19 0.51 2.12 0.52 1.08 6.78 3.61 5.47 µg/kg DW Benzo[a]pyrene Sediment < 0.22 < 0.16 < 0.15 < 0.16 2.03 < 0.10 0.20 5.29 2.93 5.35 µg/kg DW Benzo[ghi]perylene Sediment < 0.17 < 0.15 < 0.13 0.46 1.54 1.35 0.35 4.45 2.47 5.86 µg/kg DW Dibenz[a,h]anthracene Sediment < 0.16 < 0.16 < 0.14 < 0.15 < 0.13 0.22 < 0.11 1.15 0.58 0.89 µg/kg DW Indeno[1,2,3-cd]pyrene Sediment < 0.15 0.21 0.15 0.29 1.74 < 0.09 0.51 4.39 2.28 4.28 µg/kg DW < = Below the limit of detection (LD). LD varies with dilution factor and the recovery of internal standards.
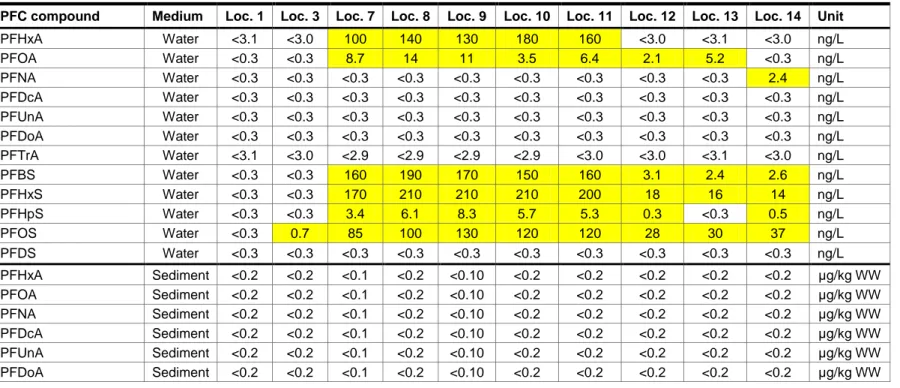
Table 8 Analytical results of the PFC measurements as performed by IMARES for water samples and wet sediment samples. The sediment concentrations calculated on a dry weight basis (lower block of data) are calculated from wet weight by a correction for sample dry weight, excluding the salt content, mainly attributable to the water phase of the sample. Yellow highlighted cells are above the limit of detection (LD). The orange highlight indicates a sediment sample with a relatively high water content.
PFC compound Medium Loc. 1 Loc. 3 Loc. 7 Loc. 8 Loc. 9 Loc. 10 Loc. 11 Loc. 12 Loc. 13 Loc. 14 Unit PFHxA Water <3.1 <3.0 100 140 130 180 160 <3.0 <3.1 <3.0 ng/L PFOA Water <0.3 <0.3 8.7 14 11 3.5 6.4 2.1 5.2 <0.3 ng/L PFNA Water <0.3 <0.3 <0.3 <0.3 <0.3 <0.3 <0.3 <0.3 <0.3 2.4 ng/L PFDcA Water <0.3 <0.3 <0.3 <0.3 <0.3 <0.3 <0.3 <0.3 <0.3 <0.3 ng/L PFUnA Water <0.3 <0.3 <0.3 <0.3 <0.3 <0.3 <0.3 <0.3 <0.3 <0.3 ng/L PFDoA Water <0.3 <0.3 <0.3 <0.3 <0.3 <0.3 <0.3 <0.3 <0.3 <0.3 ng/L PFTrA Water <3.1 <3.0 <2.9 <2.9 <2.9 <2.9 <3.0 <3.0 <3.1 <3.0 ng/L PFBS Water <0.3 <0.3 160 190 170 150 160 3.1 2.4 2.6 ng/L PFHxS Water <0.3 <0.3 170 210 210 210 200 18 16 14 ng/L PFHpS Water <0.3 <0.3 3.4 6.1 8.3 5.7 5.3 0.3 <0.3 0.5 ng/L PFOS Water <0.3 0.7 85 100 130 120 120 28 30 37 ng/L PFDS Water <0.3 <0.3 <0.3 <0.3 <0.3 <0.3 <0.3 <0.3 <0.3 <0.3 ng/L PFHxA Sediment <0.2 <0.2 <0.1 <0.2 <0.10 <0.2 <0.2 <0.2 <0.2 <0.2 µg/kg WW PFOA Sediment <0.2 <0.2 <0.1 <0.2 <0.10 <0.2 <0.2 <0.2 <0.2 <0.2 µg/kg WW PFNA Sediment <0.2 <0.2 <0.1 <0.2 <0.10 <0.2 <0.2 <0.2 <0.2 <0.2 µg/kg WW PFDcA Sediment <0.2 <0.2 <0.1 <0.2 <0.10 <0.2 <0.2 <0.2 <0.2 <0.2 µg/kg WW PFUnA Sediment <0.2 <0.2 <0.1 <0.2 <0.10 <0.2 <0.2 <0.2 <0.2 <0.2 µg/kg WW PFDoA Sediment <0.2 <0.2 <0.1 <0.2 <0.10 <0.2 <0.2 <0.2 <0.2 <0.2 µg/kg WW
PFBS Sediment <0.1 <0.1 <0.10 <0.1 <0.07 <0.1 <0.1 <0.1 <0.1 <0.1 µg/kg WW PFHxS Sediment <0.1 <0.1 1.3 0.1 0.4 0.2 3.4 <0.2 <0.1 <0.1 µg/kg WW PFHpS Sediment <0.1 <0.1 <0.1 <0.1 <0.07 <0.1 <0.1 <0.2 <0.1 <0.1 µg/kg WW PFOS Sediment <0.1 <0.1 8.1 8 26 7.4 5.4 <0.2 0.5 0.6 µg/kg WW PFDS Sediment <0.1 <0.1 <0.1 <0.1 <0.07 <0.1 <0.1 <0.2 <0.1 <0.1 µg/kg WW Dry matter in sediment 54.1% 38.4% 49.7% 45.4% 9.9% 57.6% 52.3% 15.0% 16.6% 15.5% % W/W Dry matter minus salt in sediment 52.4% 32.7% 43.7% 38.8% 5.2% 53.0% 46.8% 10.0% 11.8% 10.7% % W/W PFHxA Sediment <0.2 <0.2 <0.1 <0.2 <0.10 <0.2 <0.2 <0.2 <0.2 <0.2 µg/kg DWa PFOA Sediment <0.2 <0.2 <0.1 <0.2 <0.10 <0.2 <0.2 <0.2 <0.2 <0.2 µg/kg DWa PFNA Sediment <0.2 <0.2 <0.1 <0.2 <0.10 <0.2 <0.2 <0.2 <0.2 <0.2 µg/kg DWa PFDcA Sediment <0.2 <0.2 <0.1 <0.2 <0.10 <0.2 <0.2 <0.2 <0.2 <0.2 µg/kg DWa PFUnA Sediment <0.2 <0.2 <0.1 <0.2 <0.10 <0.2 <0.2 <0.2 <0.2 <0.2 µg/kg DWa PFDoA Sediment <0.2 <0.2 <0.1 <0.2 <0.10 <0.2 <0.2 <0.2 <0.2 <0.2 µg/kg DWa PFTrA Sediment <0.2 <0.2 <0.1 <0.2 <0.10 <0.2 <0.2 <0.2 <0.2 <0.2 µg/kg DWa PFBS Sediment <0.1 <0.1 <0.10 <0.1 <0.07 <0.1 <0.1 <0.1 <0.1 <0.1 µg/kg DWa PFHxS Sediment <0.1 <0.1 2.97 0.26 7.69 0.38 7.27 <0.2 <0.1 <0.1 µg/kg DWa PFHpS Sediment <0.1 <0.1 <0.1 <0.1 <0.07 <0.1 <0.1 <0.2 <0.1 <0.1 µg/kg DWa PFOS Sediment <0.1 <0.1 18.53 20.62 499.65 13.97 11.55 <0.2 4.25 5.62 µg/kg DWa PFDS Sediment <0.1 <0.1 <0.1 <0.1 <0.07 <0.1 <0.1 <0.2 <0.1 <0.1 µg/kg DWa < = Below the limit of quantification (LQ). LQ varies with dilution factor and the recovery of internal standards.
Sediment sample with relatively high water content Observations above the detection limit
a
Table 9 Sigma RQ risk analysis as performed for the measured PAH compounds in the sampled water bodies on Bonaire. The RQ values are calculated by dividing the measured concentrations (Appendix 2) by the compound and medium specific risk limit (RL as specified in Table 1. Concentrations below the limit of detection (DL) are omitted. For sediments the risk limits are corrected for the organic carbon content of the local sediments. The green color indicates complete absence of the risk for ecosystem damage.
PAH compound Medium RL Unit RL Loc.1 Loc. 3 Loc. 7 Loc. 8 Loc. 9 Loc. 10 Loc. 11 Loc. 12 Loc. 13 Loc. 14 Unit
Naphthalene Water 5400 ng/L 0.000 0.000 RQ Acenaphthylene Water 4000 ng/L 0.003 0.001 0.000 0.000 0.000 0.000 0.000 0.001 0.001 0.001 RQ Acenaphthene Water 1700 ng/L RQ Fluorene Water 1100 ng/L 0.001 0.002 0.001 0.001 0.001 0.001 0.001 0.001 0.000 0.001 RQ Phenanthrene Water 580 ng/L 0.001 0.004 0.001 0.001 0.002 0.002 RQ Anthracene Water 410 ng/L 0.001 RQ Pyrene Water 270 ng/L 0.003 0.002 RQ Fluoranthene Water 180 ng/L 0.004 RQ Chrysene Water 74 ng/L 0.008 RQ Benz[a]anthracene Water 64 ng/L 0.011 RQ Benzo[k]fluoranthene Water 54 ng/L 0.012 RQ Benzo[b]fluoranthene Water 53 ng/L 0.022 RQ Benzo[a]pyrene Water 53 ng/L 0.017 RQ Benzo[ghi]perylene Water 52 ng/L 0.018 0.032 RQ Dibenz[a,h]anthracene Water 36 ng/L 0.026 RQ Indeno[1,2,3-cd]pyrene Water 35 ng/L 0.025 RQ ΣRQ 0.005 0.006 0.009 0.004 0.001 0.003 0.001 0.004 0.142 0.034 RQ
Organic matter content Medium RL 10% OM Unit RL 7.2% 10.0% 8.2% 7.4% 29.8% 5.6% 12.0% 25.5% 22.6% 21.7% OM%
Naphthalene Sediment 430 µg/kg DW 0.017 0.002 RQ Acenaphthylene Sediment 510 µg/kg DW 0.004 0.002 0.000 0.002 0.003 0.002 0.004 RQ Acenaphthene Sediment 530 µg/kg DW 0.042 0.009 0.002 0.004 0.001 0.001 RQ Fluorene Sediment 580 µg/kg DW 0.004 0.001 0.001 0.001 RQ Phenanthrene Sediment 670 µg/kg DW 0.000 0.000 0.003 0.002 0.002 RQ Anthracene Sediment 710 µg/kg DW 0.001 0.001 0.001 0.002 0.002 0.002 RQ Pyrene Sediment 890 µg/kg DW 0.002 0.000 0.001 RQ
Fluoranthene Sediment 990 µg/kg DW 0.001 0.004 0.002 0.003 RQ Chrysene Sediment 1700 µg/kg DW 0.000 0.000 0.001 0.001 0.001 0.000 0.001 0.001 0.002 RQ Benz[a]anthracene Sediment 1900 µg/kg DW 0.000 0.000 0.000 0.001 0.001 0.001 RQ Benzo[k]fluoranthene Sediment 2500 µg/kg DW 0.000 0.000 0.000 0.000 0.001 0.000 0.001 RQ Benzo[b]fluoranthene Sediment 2600 µg/kg DW 0.000 0.000 0.000 0.000 0.000 0.000 0.001 0.001 0.001 RQ Benzo[a]pyrene Sediment 2600 µg/kg DW 0.000 0.000 0.001 0.000 0.001 RQ Benzo[ghi]perylene Sediment 3100 µg/kg DW 0.000 0.000 0.001 0.000 0.001 0.000 0.001 RQ Dibenz[a,h]anthracene Sediment 4700 µg/kg DW 0.000 0.000 0.000 0.000 RQ Indeno[1,2,3-cd]pyrene Sediment 4900 µg/kg DW 0.000 0.000 0.000 0.000 0.000 0.000 0.000 0.000 0.000 RQ ΣRQ 0.051 0.017 0.012 0.002 0.003 0.006 0.007 0.021 0.013 0.020 RQ