1
PBL Working Paper 17
November 2013
Analysing the options and impacts of including REDD
credits in carbon markets
Angelica Mendoza Beltran*1, Arild Angelsen2, Michel den Elzen1, Caroline Wang Gierløff2, Hannes Böttcher3
1PBL Netherlands Environmental Assessment Agency, P.O. box 30314, 2500 GH The Hague The Netherlands.
2School of Economics and Business, Norwegian University of Life Sciences (UMB). PO Box 5003, 1432 Ås, Norway.
3 International Institute for Applied Systems Analysis, A-2361 Laxenburg, Austria *Corresponding Author: mendoza@cml.leidenuniv.nl
Abstract
The issue of including avoided deforestation (REDD) credits in a future global carbon market is highly contested. Proponents point to the potential for achieving higher overall emissions reductions and/or reducing global mitigation costs, while skeptics think that REDD credits will crowd out mitigation in other sectors. This model study stresses the importance of ensuring a balance between demand and supply for REDD credits to keep a stable market and ensure sufficient flows of REDD funding. Different scenarios until 2020 are constructed using an integrated assessment model by varying the overall greenhouse gas emission reductions (varying from the current 2020 reduction proposals (pledges) to enhanced pledges that are more consistent with meeting the 2 degree targets) and the rules for including REDD credits in the market. Unrestricted supply could lead up to a 65% decrease in the carbon price. A higher overall reduction target could avoid this decrease in the carbon price and, at the same time, provide strong incentives for emissions reductions in Annex I countries (and elsewhere). In a two degrees scenario without restrictions on the share of domestic emission reductions, the carbon price in 2020 is in the range of USD 63-72 per tCO2e for scenarios including REDD credits in the market. There are environmentally and economically sound ways of including REDD credits in the market, and focus should be on the design of mechanisms rather than a polarized debate for and against inclusion. Achieving the 2 degree target without REDD inclusion is unrealistic (leading to carbon prices above USD 100 per tCO2e), while inclusion of REDD credits without more ambitious reduction targets may lead to unwanted crowding out effects.
Keywords: Climate change, emissions reduction from deforestation, carbon market, integrated
assessment model
2
1. Introduction
Including certified emissions reduction credits from Reducing Emissions from
Deforestation and Forest Degradation (REDD1 credits) in a future (global) carbon market remains one of the controversial issues in the climate debate. Such inclusion of REDD credits as part of the international carbon market can mobilize the funding needed to realize the full REDD potential (Angelsen et al., 2013; Eliasch, 2008). Since REDD is a relatively low-cost mitigation option, including REDD in a mitigation strategy allows larger global emissions reductions at the same global mitigation costs. Although a global carbon market is not established yet, and its creation hinges on progress in the United Nations Framework Convention on Climate Change (UNFCCC) climate negotiations and/or key countries taking on stronger commitments, many of the options to realize the full potential of REDD are still valid for regional or national carbon markets that are emerging.
The views in the international debate reflect different interests and ideological positions. Some parties (such as the European Union) emphasize the need to keep the carbon price at a level that provides continuous incentives for the private sector to develop and adopt low-carbon solutions (and not penalize early movers). Many fear that including cheap REDD credits may crowd out other mitigation efforts in Annex I countries by depressing the carbon price (Bozmoski and Hepburn, 2009; Fry, 2008; Murray et al., 2009). This may also have medium-long term effects in the form of hampering clean technology investments, development and innovation as explored by Bosetti et al. (2011) and Fuss et al. (2010).
A related argument by many parties (such as Brazil) and NGOs concerns
additionality; they argue that any inclusion of REDD credits must come on top of, and not replace, existing reduction commitments. Non-Annex I countries are interested in a mechanism designed to ensure substantial financial flows for REDD, although the benefits from proposed REDD mechanisms vary greatly among countries. Annex I countries, such as the US with the Waxman-Markey bill (Unites States Congress, 2009), see the
opportunity of REDD offsets as a political and economic necessity in order to take on stronger national commitments (Boyd, 2010).
Different options for including REDD credits in a future international carbon market have already been discussed in the literature and in international climate negotiations. These range from no inclusion to partial or even full (unrestricted) inclusion. An example of excluding REDD credits in a future international carbon market is given by Hare and Macey (2008), who analysed a separate, parallel international market for REDD credits, subject to own targets for global forest carbon reductions. Specifications of this option are the dual market approach (Ogonowski et al., 2007) and the Greenpeace proposal of separate credits for tropical forests (Livengood and Dixon, 2009). A major issue with these proposals is how to generate a demand for the credits.
With regard to partial inclusion of REDD credits, two options are discussed: (i) restriction on the amount of REDD credits, or (ii) value reduction of REDD credits. This paper explores one version of the second option (ii): discounted REDD credits, as proposed by the Waxman-Markey bill. With discounting, a ton of CO2 reductions from REDD is exchanged for less in the market, e.g., 2 REDD credits are needed to offset 1 credit from other sectors. This could lead to larger overall emissions reductions.
1
We use REDD rather than REDD+ in this study, as the discussion and model scenarios focus only on avoided deforestation
(and to some extent also degradation, but not ‘enhancement of forest carbon stocks’).3
The option of full (unrestricted) inclusion implies that REDD credits are fully fungible and can be traded 1:1 with other credits. In a well-functioning market, emissions reductions across sectors and countries would be allocated in a cost-efficient way. The main concern regarding this option relates to market flooding, in part because the supply of REDD credits is uncertain. The magnitude of this uncertainty depends both on how the system is designed (standards, regulations, etc. needed for any market to function), and on how countries with REDD potential are able to deal with a range of issues, including
implementing policies that will generate REDD credits. Some of these issues that need to be resolved but that are outside the scope of this paper are: measuring, reporting and verifying (MRV) standards, safeguards for rights and social impacts, setting of reference levels to ensure additionality, permanence, and design and implementation of national level institutions and policies which can deliver emissions reductions and provide an effective and equitable sharing of REDD revenues.
The option of full inclusion has extensively been analysed in the literature (Anger and Sathaye, 2008; Bosetti et al., 2011; Busch et al., 2009; den Elzen et al., 2009b; Dixon et al., 2008; Eliasch, 2008). As can be predicted by economic theory, common findings are that full inclusion reduces overall mitigation costs, lowers the carbon price, slows down deforestation, and increases capital flows to REDD countries, compared to the case of REDD credits not being included in the market.
The objective of this paper is to analyse and quantify the effect of the above options for including REDD credits in an international carbon market on total emissions reductions and the carbon price by means of a unique and new set of scenarios. The scenarios are simulated by the FAIR model (den Elzen et al., 2011a) and result from the combination of different options for: (i) REDD credits inclusion in a carbon market, and (ii) mitigation commitments of countries: a high pledge scenario based on the conditional reduction proposals put forward by the countries under the Cancún climate agreements (UNFCCC, 2010) and a set of hypothetical commitments in line with global emissions in 2020 consistent with least-cost emission pathways2 for achieving the two degree climate target. The mitigation scenarios are placed in the context of fully including, partially including3 or not including4 REDD credits as part of the international carbon market as an offsetting option for developed countries.
As analysed by Lubowski and Rose (2013), some real-world complexities suggest that REDD supply, cost savings, and net climate benefits are uncertain and will be highly dependent on policy and implementation features. This paper tries to include more realistic implementation and policy conditions by accounting for pledges scenarios, restricted carbon trading and marginal costs data for REDD that takes into account possible implementation hurdles. We also put in perspective these more real-world complex scenarios by placing in parallel scenarios of more idealistic conditions i.e. the two degrees scenarios and try to understand the implications of policy and
implementation features in the deployment and impact of REDD in the carbon market. The paper is structured as follows: Section 2 presents the scenarios, and the assumptions on the levels of including REDD credits in a carbon market and the mitigation commitment level or emission caps of countries. Section 3 describes the
2
Least-cost scenarios assume that emission reductions start immediately after the model base year, typically 2010, and are
distributed optimally over time, such that aggregate costs of reaching the climate target are minimized.3
The partial inclusion comes in two versions: (1) quantity restriction on the amount of REDD credits permitted in the
market, or (2) value reduction of REDD credits. See for more details, Angelsen et al. (2013).4
The no inclusion option implies that international funding for REDD must be raised outside the carbon market. This could
either be in the form of public funds (e.g., official development aid – ODA), voluntary contributions, or a separate market for REDD credits. See for more details, Angelsen et al. (2013).4
modeling framework, datasets and assumptions for the analysis. The results of the scenarios are presented in Section 4, and Section 5 presents some sensitivity analysis of the results. Section 6 concludes.
2. Overview of scenarios
Six scenarios were constructed (Table 1). First, we considered two mitigation
commitment levels by 2020: (i) high reduction pledges, and (ii) a global emissions target in 2020 consistent with least-cost emission pathways for achieving the two degrees climate target with a likely chance (higher than 66%). Second, three alternatives for REDD inclusion are considered: (i) no inclusion, (ii) partial inclusion, and (iii) full inclusion. Other scenarios are also possible, including a low-pledge scenario and scenarios where the carbon price or the global mitigation costs are kept constant after REDD inclusion. These are discussed in the full report on which this paper is based on Angelsen et al. (2013).
Table 1. Overview of scenarios.
Commitment Level
Level of REDD inclusion
None Partial Full
High pledges No REDD/
High pledge (1-DEFAULT) Discounted REDD/ High pledge (2) Full REDD/ High pledge (3)
Two degrees No REDD/
2 degrees (4) Discounted REDD/ 2 degrees (5) Full REDD/ 2 degrees (6) 2.1 Commitment Level
The overall commitment or emissions reduction target for both Annex I (developed) and non-Annex I (developing) countries determines to a large extent the demand for REDD credits. Under the UNFCCC negotiations urgent action was called for to limit global warming to two degrees. To date, 42 Annex I countries submitted emission reduction proposals (pledges), and 55 non-Annex I countries submitted Nationally Appropriate Mitigation Actions (NAMAs), of which 16 contained quantified economy-wide targets, which were first included in the Copenhagen Accord (UNFCCC, 2009), and later in the Cancún Agreements (UNFCCC, 2010).
Table 2 shows the commitment levels for Annex I and non-Annex I countries for all scenarios. For non-Annex I countries the reduction targets (commitment levels) differ among the scenarios of three alternatives for REDD inclusion mainly due to the
implementation of the Brazilian and Indonesian NAMAs and its composition in REDD and other reductions as well shown in Table 2, and will be explained in Section 2.2.
5
Table 2. Main assumptions for the scenarios in terms of inclusion of REDD in a carbon market and reduction targets in 2020.
Name
REDD in carbon market
Commitment Levels in 2020 (reductions including Kyoto GHGs, including deforestation
CO2 emissions) Annex I countries as a group non-Annex I countries as a group Brazil Indonesi a % below
1990 level % below BAU levels
No REDD/ High pledge (1) No 19 5 11 (0i/ 25ii) –7** (–13i/25ii) Discounted REDD/ High pledge (2)
Partial-Discounted 19 7 iii (6 iv) 22iii(19iv) 9iii(9iv) Full REDD/
High pledge (3) Full 19 6 22 9
No REDD/ 2 degree (4) No 30 14 13 (22i/25ii) 8 (9i/25ii) Discounted REDD/ 2 degree (5)
Partial-Discounted 30 14 iii (13iv) 22iii(6iv) 9iii(3iv)
Full REDD/2 degree (6) Full 30 14 22 9
i Indicates reduction excluding deforestation CO
2 emissions; ii Indicates REDD reduction; iii
Indicates reduction after discounting REDD credits; iv Indicates reduction before
discounting of REDD credits.
** Indicates that the 2020 emission levels resulting from the high pledge for Indonesia are above PBL BAU levels.
For the high pledges scenario we assume that Annex I and non-Annex I countries fully implement their high-ambition, conditional emission reduction proposals and NAMAs under strict rules, based on den Elzen et al. (2011b). This scenario is the same as the conditional pledges, strict rules scenario of the Emissions Gap report of UNEP (2012). For non-Annex I countries the methodology for calculating the reductions resulting from the NAMAs is based on den Elzen et al. (2011b), but the evaluation has been revised to reflect the PBL business-as-usual (BAU) emission scenario developed for the OECD Environmental Outlook (2012) (section 3). Special focus is given to the NAMAs of Brazil and Indonesia as they are key suppliers of REDD credits. Between 2000 and 2010, Brazil had highest net loss of forest area while Indonesia ranked third (FAO, 2010). In our BAU scenario for deforestation emissions the two countries have 37% of the global
deforestation emissions in 2020 (32% from Brazil and 5% from Indonesia). Appendix A describes the commitment levels for the high pledges scenarios in more detail.
The two degrees scenarios assume an ambitious aggregated reduction target of the Annex I countries as a group of 30% below 1990 level by 2020, and also a comparable effort by the non-Annex I countries as a group of about 15% below 2020 BAU emission levels (see Appendix A). For the allocation across the individual Annex I countries the same reduction below BAU is used. For non-Annex I countries the reduction for individual countries is differentiated according to income levels, as described in den Elzen et al. (2009a). For the case of Brazil, Indonesia, Mexico and South Korea we use the submitted high NAMAs as targets for the two degrees scenarios, as they result in more ambitious targets than the ones calculated using an equal reduction below baseline allocation.
6
2.2 Level of REDD inclusion
We analyse cases of full, no, and partial inclusion of REDD carbon credits to the global carbon market.
Scenario 1 (no REDD/high pledge) is considered as the default case. The achieved REDD (hereafter own REDD efforts) is assumed to be a fixed reduction below BAU deforestation CO2 emissions. Finance is only through fund-based mechanisms and non-compliance market sources. Scenarios 1 and 4 assume a 25% reduction of BAU
deforestation CO2 emissions based on own REDD efforts5. For example, Brazil’s high pledge leads to no reduction below our BAU excluding deforestation CO2 following den Elzen et al. (2011b), and to a reduction of 11% including deforestation CO2 due to the assumed 25% own REDD effort (Table 2). The 11% reduction is lower than the 22% reduction that results from the full implemented NAMAs.
We explore one partial inclusion option: discounting REDD credits. For discounting the high pledge and two degrees commitment levels (Scenario 2 and 5) are used, as well as a discount factor of 0.5 for REDD credits: one credit in the carbon market (Annex I reduction or Clean Development Mechanism (CDM)) is the equivalent of one ton of CO2, and this traded for half a ton of CO2 in avoided deforestation. Only traded REDD credits are discounted; REDD credits used for domestic compliance of non-Annex I are not. Full REDD inclusion means REDD credits are fully fungible and can be traded in the carbon market one to one with credits from other mitigation options. Brazil reduces 22% and Indonesia 9% below BAU including deforestation CO2 emissions, and all REDD
reductions are financed by the carbon market.
3. Modeling framework and assumptions
3.1 The FAIR model
We use the Framework to Assess International Regimes for the differentiation of
commitments (FAIR) model (den Elzen et al., 2011a) for the analysis. FAIR integrates
emissions (all Kyoto greenhouse gases) from a baseline scenario and information on marginal abatement costs (MAC curves) by all sectors and sources for 26 regions (see section 3.3)6. The abatement costs represent the direct additional costs due to climate policy, but do not capture indirect macroeconomic implications. Macroeconomic costs are more uncertain and have shown a high degree of correlation to the abatement costs, in particular at the level of aggregated regions (van Vuuren et al., 2009).
Based on the commitments (demand) and the marginal abatement costs (supply), the model calculates the carbon price in the international trading market, the regional and global abatement costs given regional greenhouse gas emission targets, and the domestic and external abatement per region. FAIR uses a cost-efficient implementation of the targets among regions, gases and sources through global trading of carbon credits, unless that in some scenarios restriction might apply on minimum domestic actions in Annex I countries and REDD credits are not fully included.
5Own REDD effort accounts for the own mitigation efforts of Brazil, Indonesia and Mexico and the abatement costs are reported as a separate item in these scenarios and not assigned to any party as funds from several sources can be used to cover the costs (e.g. private funds, ODA, non-compliance carbon markets).
6 The 26 FAIR regions are: Canada, United States of America (US), Mexico, Rest of Central America, Brazil, Rest of South America, Northern Africa, Western Africa, Eastern Africa, South Africa, Rest of Southern Africa, Western Europe, Eastern Europe, Turkey, Ukraine, Asia-Stan, Russia, Middle East, India, Korea, China, South East Asia, Indonesia, Japan, Oceania, Rest of Asia. See for country break-up: www.pbl.nl/fair
7
3.2 Business as Usual Scenario (BAU)
BAU projections (i.e., scenarios in the absence of climate policy) contain all Kyoto greenhouse gas emissions for energy, industry, agriculture and deforestation. The BAU emissions of all greenhouse gases excluding deforestation CO2 emissions is calculated by the TIMER energy model (van Vuuren et al., 2006) and the IMAGE land-use model (Bouwman et al., 2006), using the GDP projections as used for the OECD Environmental Outlook (OECD, 2012). In 2020 the BAU emissions excluding deforestation are around 53GtCO2e. The CO2 emission projections from deforestation (only in non-Annex I regions) are calculated with the G4M forestry model (Kindermann et al., 2008) of the
International Institute for Applied System Analysis (IIASA), in combination with the economic land-use model GLOBIOM and correspond to 3.3 GtCO2 in 2020 (Böttcher et al., 2011). For Annex I countries no deforestation CO2 emissions are assumed and only land-use, land-use change and forestry (LULUCF) credits from accounting rules are taken into account (Appendix C). Table B.1 shows the absolute BAU greenhouse gas emissions including and excluding deforestation for the 26 regions of the FAIR model. The country deforestation emissions from the G4M model are aggregated into the FAIR regions following the definition of countries to regions of the extended IMAGE model7.
3.3 Marginal Abatement Cost Curves (MAC curves)
The MAC curves of the energy and industry-related emissions for CO2 and Fluorinated gases are calculated in the TIMER energy model by imposing a carbon tax and recording the induced reduction of emissions. The MAC curves of the non-CO2 greenhouse gas emissions are exogenous and based on Lucas et al. (2007). The deforestation MAC curves are calculated from the IIASA’s G4M and GLOBIOM forestry model runs with tax scenarios (Böttcher et al., 2011) and recording the reduced emissions due to avoided deforestation. In this way it is modeled how the forest owner is compensated for keeping the carbon stored in forest living biomass. The deforestation MAC curves used here are derived using a linear carbon tax path. The maximum global abatement possible in 2020 is around 2.4 GtCO2 at prices higher than 50 USD/tCO2 which correspond to 84% of the BAU deforestation emissions in the same year. The regional aggregation procedure followed for the deforestation BAU emissions also took place for the MACs.
3.4 Modeling Assumptions
Key assumptions for the model calculations are described below and more details are provided in Appendix C. Most of these assumptions apply for all scenarios unless the opposite is indicated.
Full participation: We have assumed full global participation of Annex I countries in
emissions allowances trading and Joint Implementation (JI), and non-Annex I countries in CDM and REDD (used for offsetting). In the absence of REDD, non-Annex I countries only participate in CDM trading but can still undertake REDD actions for own compliance.
Carbon price: In the FAIR model, there is only one equilibrium international carbon price
for CDM, JI, REDD (when included in the carbon market). When REDD carbon units are not traded in the global carbon market, REDD activities are not affected by the global carbon price. The domestic carbon price in Annex I countries can be higher due to requirements of minimum domestic reductions.
Minimum domestic reductions in Annex I countries: All Annex I countries must
meet at least 2/3 of their target through domestic emission reductions (den Elzen et al.,
7
The country to region definition follows the extended version of the IMAGE regions which are the same as the FAIR 26
regions: See http://themasites.pbl.nl/tridion/en/themasites/image/background/regions/index-2.html8
2011a), except for the US that achieves 100% of its target with domestic actions. This assumption is based on official announcements by Annex I countries (Appendix C) and holds for scenarios using the pledges as commitment levels. For the two degrees scenarios no minimum domestic restriction was assumed given the higher reduction targets for regions.
Minimum domestic reductions in non-Annex I countries: Mexico, Brazil and Korea
meet their target fully with domestic action. After achieving their domestic target they can undertake more reductions, and sell these emission credits on the carbon market. This assumption applies for the pledges scenarios only. For the two degrees targets no minimum domestic reduction is assumed for non-Annex I countries/regions as the ambition of reduction is already higher.
Other flexible mechanisms: Besides REDD, and within the restriction of at least
two-thirds domestic reductions, Annex I countries can meet the target by either using Joint Implementation (JI) in Russia and Ukraine or implementing CDM projects in non-Annex I countries (offsetting).
Limitations of CDM supply: Only a limited amount of the CDM abatement potential
is assumed to be operationally available on the market due to the project basis of the CDM and implementation barriers, such as properly functioning institutions and project size (Michaelowa and Jotzo, 2005). We assume that the fraction of potential CDM credits supplied in the market increase for 2020, and depends on the income level of the country (Appendix C).
Limitations in REDD supply: The REDD MAC curves developed by IIASA and used in
our model include limitations on the supply due to three elements: discount rate, corruption and hurdle factors. These factors reflect the capacity of countries to
implement REDD given their national circumstances (Appendix C). The implied limitation on the REDD potential of these three factors varies with the carbon price, and ranges between 15 and 65% by 2020. The limitation shrinks with higher prices, and reaches the minimum of 15% at around USD 50/tCO2.
4 Results
4.1 Overall emissions reductions
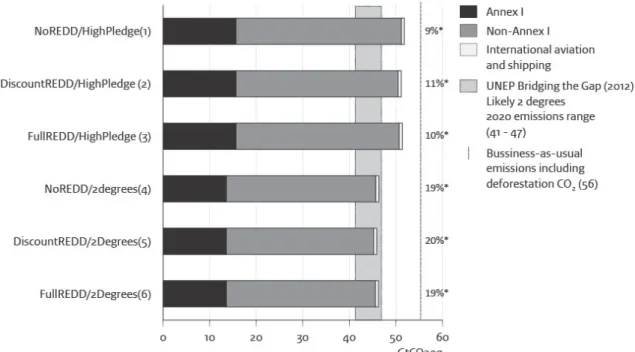
Figure 1 shows the emission levels of all scenarios including deforestation CO2 emissions. Excluding REDD credits from the carbon market combined with high pledges (default scenario 1) leads to a global reduction of 9% compared to BAU levels including
deforestation CO2 emissions, whereas discounting of REDD credits leads to a reduction of 11% and full inclusion a 10% reduction. The two degrees scenarios show global
reductions of 19 % for no REDD inclusion and full inclusion, while discounting of REDD credits drives emission reductions to 20%. The reason for the higher reduction in discounted scenario 2 is that the traded REDD credits have a real emission reduction twice their offsetting value. The impact in terms of additional global emission reductions for both the high pledge and the two degree commitment levels is 1 percentage point compared to the scenarios of full inclusion. For the discounting scenarios, global REDD actions are about 0.2 GtCO2 higher for both commitment levels. These global REDD actions correspond to reductions below BAU deforestation CO2 emission of 27% to 32% and 61% to 62% for the high pledges and two degrees targets, respectively (Table 4). Figure 1 also shows all high pledge scenarios have emission above the range of global emissions necessary in 2020 for meeting the two degrees climate target, as outlined in UNEP (2012). The increase in Annex I and non-Annex I commitment levels from the high pledges to the two degrees targets brings global emission levels consistent with
least-9
cost emission pathways for achieving the two degrees target (indicated in the figure as the UNEP range).
Figure 1. GHG emissions including deforestation CO2 in 2020 after reductions.
Note (*) gives global emission reductions below BAU including deforestation CO2.
4.2 Emission reductions, carbon price and abatement costs for regional groups
In accordance with other studies, the carbon price declines (from USD 19 to 7/tCO2e, a 60% decrease) when there is a full integration of REDD in the market and the
commitment levels remain the same except for an increase in Brazil and Indonesia’s targets given the inclusion of REDD in scenario 3 (Table 3, scenarios 1 and 3). The reduced carbon price affects the abatement costs of regions. Annex I countries have approximately 12% less net abatement costs, while net abatement costs (net effect of domestic costs and gains from financial revenues of trading credits) for non-Annex I regions more than double after full inclusion of REDD credits in the market.
10
Table 3. Main outcomes of scenarios.
USD/tCO2e Abatement costs in billions USD (% of GDPi)
Scenario
Carbon priceii
Domestic
pricesiii World Annex I non-Annex I
REDD Costsiv NoREDD/HighPledge (1) 19 25–84 71 (0.1) 59 (0.13) 9 (0.03) 2.0 DiscountedREDD/ HighPledge (2) 9 23–83 73 (0.1) 53 (0.12) 20 (0.07) FullREDD/HighPledge (3) 7 23–83 74 (0.1) 52 (0.12) 22 (0.08) NoREDD/2 degrees (4) 108 108 247 (0.34) 224 (0.5) 21 (0.08) 2.0 Discounted REDD/ 2 degrees (5) 72 72 163 (0.23) 187 (0.42) –24 (–0.09) FullREDD/2 degrees (6) 63 63 157 (0.22) 173 (0.38) –16 (–0.06)
i GDP uses Market Exchange Rates. ii Price for CDM, JI, emission trading and REDD (when
included in the carbon market) on the international carbon market. For scenarios 1 and 4 the REDD price is not presented, but is lower than the international carbon price and corresponds to marginal costs as given by the regional REDD MAC curves. iii Range of
domestic prices for different Annex I regions. iv Total abatement costs of REDD in Mexico,
Brazil and Indonesia that need financing and only hold for scenarios with no REDD inclusion in the market. REDD costs for scenarios 2, 3, 5 and 6 are included in the total non-Annex I abatement costs and are financed by the market.
There are several reasons for the higher abatement costs of non-Annex I, besides the slightly higher reduction targets for Brazil and Indonesia (achieving its full NAMA). A lower carbon price decreases the gains of traded credits from REDD and CDM. This price impact more than outweighs the slightly higher volume of trade. In the two degrees scenario, which has no restrictions for domestic reductions in Annex I countries, non-Annex I have a net gain as CDM credits are traded at higher prices. Global costs are substantially reduced after full inclusion of REDD credits in the market.
A closer look at the reductions of the full inclusion of REDD (scenario 3) versus those of the default one (scenario 1) results in similar trade volume of REDD and CDM credits (for scenario 1 only CDM credits) between Annex I and non-Annex I and around double REDD actions in non-Annex I regions (Figure 2). Countries are undertaking REDD actions, either for own compliance or for trading. As the commitment levels for non-Annex I regions other than Brazil and Indonesia remain the same, this increase in REDD actions in most Annex I regions is due to more trade of REDD credits. But non-Annex I reductions in other sectors (other reductions) are lower when REDD credits are in the market, which means that for non-Annex I it is more costs-effective to undertake REDD actions, leading to higher reduction in deforestation emissions (Table 4). For Brazil and Indonesia the increase in REDD actions from the no REDD to the full REDD inclusion scenario is due to “own compliance” in the high pledge scenarios and due to trading in the two degrees scenarios. It can be concluded from the high pledge cases that including REDD credits in the carbon market given the current caps induced by the high reduction pledges may not attractive for non-Annex I countries, i.e. higher costs, REDD crowds out CDM. Adjustment of the caps under inclusion of REDD credits is necessary.
11
Figure 2. Annex I and non-Annex I reductions and abatement costs in 2020. *Sellers in the carbon market have negative trade and financial flows (gains).
**The REDD costs are presented as separate item part of non-Annex I costs for those scenarios where REDD is kept out of the carbon market and correspond to the total abatement costs of REDD in Mexico, Brazil and Indonesia that need financing. For scenarios 2,3,5 and 6 REDD costs are already included in the domestic costs of non-Annex I and are financed by the market.
Note: the reductions are split in domestic reductions and trade for Annex I (top left) and in REDD and other reductions and trade for non-Annex I (top right). Abatement costs in 2020 for Annex I (bottom left) and non-Annex I (bottom right) corresponding to the reductions and financial flows due to carbon trading.
Discounting REDD credits results in higher reductions at almost the same global abatement costs as the full (and undiscounted) REDD inclusion scenario (Table 3,
scenarios 3 and 2). The crowding out effect is smaller than when allowing a full inclusion of REDD as the carbon price drops from USD 19 (default) to 9/tCO2e (discounted REDD) instead of USD 7/tCO2e(full REDD inclusion).
In the two degrees scenarios with partial and full REDD inclusion, the global emissions reduction (including deforestation emissions), carbon price and abatement costs increase significantly compared to the high pledges scenarios. However, non-Annex I countries increase their benefits from carbon trading for several reasons. First, the higher Annex I targets increase the demand for CDM and REDD credits. Second, there are no minimum domestic reductions for Annex I regions (unrestricted trade), i.e. reductions are done where most cost-effective. Finally, the tighter targets and the
12
resulting higher prices means that there is more “room” for REDD and particularly for CDM to coexists, i.e., they compete less with each other (Table 3). Full inclusion of REDD credits could lead to a 70% reduction in global deforestation emissions compared to 2005 levels (Table 4). It can be concluded from the two degree cases, that under a lower cap REDD inclusion can still maintain high carbon prices, and thereby strong incentives for domestic emissions reductions in Annex I countries (and elsewhere).
Table 4. Deforestation emissions reductions for different scenarios for the world, Brazil and Indonesia.
# Scenario name
Reduction of CO2 deforestation emission in
% below BAU levels in 2020 (% below 2005 levels in brackets)
World Brazil Indonesia
1 No REDD inclusion/High pledge 10 (33) 25 (37) 25 (54) 2 Discounting REDD/High pledge 32 (50) 50 (58) 8 (43) 3 Full REDD inclusion/High pledge 27 (46) 42 (51) 4 (41) 4 No REDD inclusion/2 degrees 10 (33) 25 (37) 25 (54) 5 Discounting REDD/2 degrees 62 (71) 82 (85) 95 (97) 6 Full REDD inclusion/2 degrees 61 (71) 82 (85) 95 (97)
5 Sensitivity analysis
This section explores the implications of changing policies in Annex I countries. An
additional major uncertainty relates to the cost of REDD, which impacts the magnitude of the effects in the various scenarios. There is, however, a lack of datasets on regional and global cost estimates, and we therefore do not further explore the impact of alternative MAC curves for REDD.
5.1 The US demand for REDD credits
Our scenarios assume that there is no demand of REDD credits from the US, i.e., the US meets its domestic target completely domestically. This might be rather conservative, as the US has given signals of using international offsets for compliance in their carbon reduction programs and national bills that were not ratified by the congress (Boyd, 2010). More recently the Emissions Trading System (ETS) started in the State of California also allows forest credits for compliance, with some voluntary buyers also showing interest (Air Resource Board, 2012). These signals suggest a possible demand of REDD credits from the US.
For estimating the possible demand of REDD credits from the US by 2020 national projections can be used. The US Annual Energy Outlook (AEO) (2012) gives a
greenhouse gas emission projection of about 7% below 2005 levels by 2020. If the US would achieve their full pledge (17% below 2005 levels) with only REDD offsets, the expected demand of REDD credits would be 10% of 2005 emissions at the maximum, which is about 720 MtCO2e. This could be supplied by non-Annex I regions as the total mitigation potential of REDD in non-Annex I regions by 2020 is around 2.4 GtCO2 at prices higher than 50 USD/tCO2 according to the MAC curves used here. Nonetheless, the supply is somewhat reduced by the REDD actions used for own compliance of non-Annex I countries, i.e., for scenario 1 around 300 MtCO2e. Therefore around 2 GtCO2 REDD would still be available for offsets.
13
Another way of estimating the REDD credits demand from the US is by assuming that they will purchase REDD credits in the market instead of achieving 100% of their pledge domestically, as was assumed in the calculations. If only a minimum of 60% domestic action for the US is assumed in the calculations, global REDD actions increase from around 1 to 1.25 GtCO2 as a result of the increase in the carbon price (about 2USD/tCO2e).
5.2 Minimum domestic reductions in Annex I countries
The demand of REDD credits is influenced by the policy of minimum domestic actions of Annex I countries, as shown in the previous section for the US. When no domestic
restriction is assumed for all Annex I regions and the high pledges could be achieved in a market with full REDD inclusion (like in scenario 3), the carbon price increases to 19 USD/tCO2e (from 7 USD/tCO2e). The REDD reductions increase to 1.7 GtCO2. As expected, the domestic action of Annex I countries is reduced (to around 30% of the domestic reductions in scenario 3) since including cheap REDD credits crowds out mitigation efforts in developed countries by depressing the carbon price. The trade between Annex I and non-Annex I is almost doubled and the global costs reduced substantially from 0.1% to 0.04% of global GDP. Annex I costs decrease from 0.12% to 0.09% of their GDP, while for Non-Annex I this policy change turn from a cost of 0.08% of their GDP to a gain of 0.04%.
These results show some interesting trade-offs. The removal of requirements of minimum domestic actions gives substantial cost savings, and perhaps surprisingly the relative gains (% of GDP) are highest for non-Annex I countries due to more trade and a higher international carbon price. On the other hand, the lowered domestic carbon price leads to less domestic efforts, and may slow the transition in Annex I countries towards a low-carbon economy.
6 Conclusions
This study has analysed the implications of options for introducing REDD credits in a future global carbon market. A major challenge is to introduce REDD in such way that, on the one hand, sufficient funding is mobilized to realize the REDD potential, and on the other hand, crowding out effects on other mitigation efforts are avoided. We analysed a number of scenarios, which differ with respect to global emission caps and the options to restrict the supply of REDD credits. Each of the options has different implications, and together they demonstrate that options are available to minimize the risk related to introducing REDD in carbon markets.
If REDD credits are to be fully included in the market, the global reduction effort should increase in order to balance the demand and supply of carbon credits, to avoid that REDD mitigation crowds out other mitigation efforts by lowering the carbon price. Even the ‘high pledge’ scenario is not ambitious enough to avoid a significant decline in the carbon price if REDD credits are fully included.
At the same time, getting global emissions on the track towards the two degrees target will be much more expensive (about 57% higher) and more challenging without REDD. A key message of this study is therefore that REDD inclusion and overall reduction targets must be considered simultaneously.
Partial REDD inclusion by discounting traded REDD credits could manage the
undesired effects of a full inclusion. Discounting helps to contain the flooding effect of full inclusion of REDD credits in a carbon market, but has a drawback in terms of higher global costs compared to a full inclusion. Discounting REDD credits leads to similar global
14
emission levels as full inclusion, which implies that the additionality effect of discounting is low. This is mainly due to the relatively low volume of traded REDD credits. Compared to no inclusion, the additionality of discounting is more significant.
A regional zoom in the scenario outcomes showed that inclusion of REDD credits have distributional impacts, and different consequences for Annex I and non-Annex I countries as a group. Only Annex I will financially benefit from full inclusion of REDD in a carbon market in a high pledges scenario with restrictions on offsetting. For non-Annex I regions, net abatement costs would more than double, mainly due to a lower carbon price that reduce their financial gains of traded credits from REDD and CDM. Brazil and Indonesia undertake REDD actions for own compliance in the high pledge scenarios and also for trade in the two degrees scenarios. The regional outcomes depends critically on the regional MAC curves for REDD and other mitigation options, as well as the reference levels used to established the ambition level.
The partial and full inclusion mechanisms of REDD credits show that there is a trade-off between keeping the carbon price at a higher level, by keeping REDD in a separate market and restricting the supply, and reducing global costs by fully including REDD in the carbon market. This paper clearly shows the importance of ensuring a balance between demand and supply for REDD credits and how achieving such a balance is needed to keep a stable and ‘not too low’ carbon price, which will ensure sufficient flows of REDD funding, limit crowding out and ensure additionality. These elements are essential to provide political acceptance to include REDD credits in a possible future global carbon market.
Acknowledgements
The authors would like to acknowledge the Nordic Council of Ministers and more specifically the Nordic Working Group for Global Climate Negotiations (NOAK) for their financial support and contributions, as well as Pieter Boot, Paul Lucas, Ton Manders, Jasper van Vliet and Andries Hof (all PBL) and Eirik Romstad (UMB) for their contributions and thoughts to this paper.
Appendix A. Commitment levels for the scenarios
This section describes the regional commitment levels for the two levels of ambition used in the different scenarios (den Elzen et al., 2011a).
For the high pledges all Annex I reduction targets are based on den Elzen et al. (2011b). Annex I countries have an aggregate reduction of 19% below 1990 levels. The EU pledge is 30% reduction below 1990 levels and for the US and Canada the pledge is 17% below 2005 levels. For Japan a 25% reduction below 1990 levels is used. For the Oceania region (part of the FAIR model) the pledge of Australia and New Zealand is used together leading to a 25% reduction below 2000 levels. For Russia and Ukraine the pledges are 25% and 20% below 1990 levels, respectively.
For non-Annex I the reduction targets are as well based on den Elzen et al. (2011b). The aggregate non-Annex I reduction is 5% below BAU levels by 2020.This is mainly due to China and India emission intensity targets of 45% and 25% below 2005 levels. For China the non-fossil target is included. China and India have total reductions targets of 3% and 6% respectively below BAU levels. Mexico, South Africa, Kazakhstan and Korea get reductions of 30%, 12%, 3% and 25% below BAU levels. Korea includes North and South Korea. The rest of the non-Annex I regions do not have a reduction target and follow BAU emissions in 2020.
15
For Brazil and Indonesia the high NAMAs lead to reduction targets of 39% and 41% below National BAU levels by 2020 (Government of Brazil, 2010; Ministry of Finance, 2009). We scale the end point of emission according to the reductions below the National BAU levels to the BAU used here in order to find the total reduction targets (den Elzen et al., 2012). The methodology leads to a reduction of 22% and 9% below our BAU by 2020. As the nationally provided projections are higher than our BAU projections, the calculated reductions would generally also be lower than those using the national BAU. Moreover, for Indonesia we do not take into account the national BAU for peat land emissions or the expected reduction due to the NAMAs in this sector, as they are highly uncertain.
The two degrees scenarios assume for Annex I countries an aggregated reduction target of 30% below 1990 level by 2020, and for non-Annex I countries an aggregated reduction of about 15% below 2020 BAU emission levels (den Elzen et al., 2009a). For the allocation across the individual Annex I countries the same reduction below BAU is used.
For non-Annex I countries the reduction for individual countries is differentiated dependent on income levels. The considered advanced developed regions: Rest of Central America, Rest of South America, South Africa, Turkey, Kazakhstan, Middle East and China get a 17% reduction below BAU. Other developing regions: North Africa, India, Southern Asia and Mekong region get a 7%r reduction below BAU. Finally, the least developing regions: Eastern Africa, Western Africa and Rest of Southern Africa get no reduction target. This allocation of emission reductions among countries may seem arbitrary; however results are not too sensitive to it as they are only presented at the aggregate regional level.
For the case of Brazil, Indonesia, Mexico and Korea we use the high pledges as commitment level for the two degrees scenarios. These reduction targets are more ambitious than the ones calculated using an equal reduction below baseline allocation given that Brazil, Mexico and Korea are consider as advanced developing countries and Indonesia as other developing countries.
16
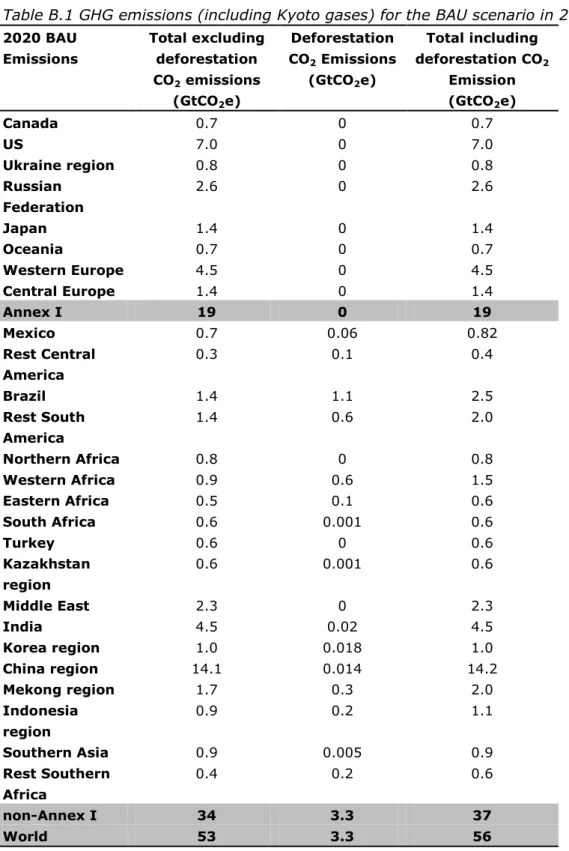
Appendix B. BAU emissions scenario in 2020
Table B.1 GHG emissions (including Kyoto gases) for the BAU scenario in 2020
2020 BAU Emissions Total excluding deforestation CO2 emissions (GtCO2e) Deforestation CO2 Emissions (GtCO2e) Total including deforestation CO2 Emission (GtCO2e) Canada 0.7 0 0.7 US 7.0 0 7.0 Ukraine region 0.8 0 0.8 Russian Federation 2.6 0 2.6 Japan 1.4 0 1.4 Oceania 0.7 0 0.7 Western Europe 4.5 0 4.5 Central Europe 1.4 0 1.4 Annex I 19 0 19 Mexico 0.7 0.06 0.82 Rest Central America 0.3 0.1 0.4 Brazil 1.4 1.1 2.5 Rest South America 1.4 0.6 2.0 Northern Africa 0.8 0 0.8 Western Africa 0.9 0.6 1.5 Eastern Africa 0.5 0.1 0.6 South Africa 0.6 0.001 0.6 Turkey 0.6 0 0.6 Kazakhstan region 0.6 0.001 0.6 Middle East 2.3 0 2.3 India 4.5 0.02 4.5 Korea region 1.0 0.018 1.0 China region 14.1 0.014 14.2 Mekong region 1.7 0.3 2.0 Indonesia region 0.9 0.2 1.1 Southern Asia 0.9 0.005 0.9 Rest Southern Africa 0.4 0.2 0.6 non-Annex I 34 3.3 37 World 53 3.3 56
17
Appendix C. Modeling Assumptions
Additional details about the key assumptions made:
Full participation: non-Annex I countries participate in CDM that have higher
accessibility factors (see below) than JI and emission allowances trading by 2020.
Minimum domestic reductions in Annex I countries: This assumption is based on:
(1) the domestic target of the European emissions trading system and EU’s
announcement that up to a maximum of 4% of the 20% target and 9% of the 30% target may be achieved by using international offsets, and (2) the announcement of the Japanese government that Japan does at least 60% domestically. In our calculations we assume however, that the US achieves 100% of its target with their domestic action, based on the announcements made at the Conference of the Parties (COP17) in Durban that the US will not make use of international offsets for meeting their reduction pledge. Due to the domestic reduction restriction, the international price of REDD and CDM credits will be lower than the price of domestic reductions in Annex I countries.
Other flexible mechanisms: CDM and JI only covers the emission reductions of all
Kyoto greenhouse gases from all sources, except from CO2 emissions from deforestation.
Joint Implementation in Russia and Ukraine: Russia and Ukraine can supply 60% of
their total potential for JI projects with other Annex I regions, which is equal to the highest CDM accessibility factor (see next paragraph). For other Annex I countries we assume full emission trading and no restriction on JI, supply if any.
Limitations of CDM supply: The CDM potential is set at 20% of the total available
potential in 2020 for the least developing regions such as Western and Eastern Africa, South Asia and Indonesia. For more advanced developing regions, such as Mexico, Central America, Northern Africa, China and South East Asia, it is assumed to be 30%. For the most advanced developing regions, such as Brazil, South Africa, and the Middle East, 60% availability is assumed.
Land Use-Land Use Change and Forestry (LULUCF) credits in Annex I countries:
Annex I countries use credits from LULUCF to fulfill their targets. Based on the work of the Joint Research Centre (JRC) the model calculation assumes a central estimate of credits arising from afforestation/reforestation and deforestation and forest management of around 350 MtCO2 credits in 2020 (den Elzen et al., 2011a).
Limitations in REDD supply: REDD MAC curves include limitations on the supply due
to three elements: discount rate, corruption and a hurdle factor. (i) The discount rate is used to calculate the net present value of opportunity costs in agriculture and forestry, and affects the supply of credits. A high discount rate can be linked to poor governance in a country, and a more myopic decision making and policies. (ii) corruption is indicative of the capacity of a country to establish an effective domestic REDD policy and thereby realize the REDD potential. (iii) The hurdle factor corresponds to a calibration factor used to reproduce historic rates of land use and smooth the effect of inconsistent input data.
18
References
Air Resource Board (2012) FINAL REGULATION ORDER. Adopt Subchapter 10 Climate Change, Article 5, Sections 95800 to 96023, Title 17, California Code of
Regulations, to read as follows: Article 5: CALIFORNIA CAP ON GREENHOUSE GAS EMISSIONS AND MARKET-BASED COMPLIANCE MECHANISMS. July 25, 2012 edn. California Environmental Protection Agency
http://www.arb.ca.gov/regact/2010/capandtrade10/finalfro.pdf#page=152.
Angelsen A, Wang C, den Elzen MGJ, Mendoza Beltran A (2013) REDD credits in a global carbon market: Options and Impacts. A report prepared for NOAK (Den nordiska arbetsgruppen för globala klimatförhandlingar – The Nordic Working Group for Global Climate Negotiations), the Nordic Council of Ministers. .
Anger N, Sathaye J (2008) Reducing Deforestation and Trading Emissions: Economic Implications for the post-Kyoto Carbon Market. Lawrence Berkeley National Laboratory Formal Report (LBNL).
Bosetti V, Lubowski R, Golub A, Markandya A (2011) Linking reduced deforestation and a global carbon market: implications for clean energy technology and policy flexibility. Environment and development economics:1-27.
Böttcher H, Gusti M, Mosnier A, Havlik P (2011) Global Forestry Emissions Projections and Abatement Costs. IIASA, Laxenburg, Austria.
Bouwman AF, Kram T, Klein Goldewijk K (2006) Integrated modelling of global environmental change. An overview of IMAGE 2.4. Netherlands Environmental Assessment Agency, Bilthoven, The Netherlands.
Boyd W (2010) Deforestation and emerging greenhouse gas compliance regimes: toward a global environmental law of forests, carbon and climate governance. in Bosetti V, Lubowski R (eds.) Deforestation and climate change: Reucing carbon emissions from deforestaiona and forest degradation. Edward Elgar Publishing Limited, Cheltenham, UK.
Bozmoski A, Hepburn C (2009) The interminable politics of forest carbon: an EU outlook. Smith School of Enterprise and the Environment paper for the Harvard Program on International Financial Systems, Forest Carbon Finance Summit 2009.
Busch J, Strassburg B, Cattaneo A, et al. (2009) Comparing climate and cost impacts of reference levels for reducing emissions from deforestation. Environmental Research Letters 4.
den Elzen MGJ, Hof AF, Mendoza Beltran A, et al. (2011a) The Copenhagen Accord: Abatement costs and carbon prices resulting from the submissions. Environmental Science & Policy 14:28-39.
den Elzen MGJ, Hof AF, Roelfsema M (2011b) The emissions gap between the
Copenhagen pledges and the 2oC climate goal: Options for closing and risks that could widen the gap. Global Environmental Change 21:733-743.
den Elzen MGJ, Höhne N, van Vliet J (2009a) Analysing comparable greenhouse gas mitigation efforts for Annex I countries. Energy Policy 37: 4114–4131.
den Elzen MGJ, Mendoza Beltran A, Piris-Cabezas P, Van Vuuren DP (2009b) Analysing the international carbon market and abatement costs by 2020 for low concentration targets: policy choices and uncertainties. Netherlands Environmental Assessment Agency (PBL), Bilthoven, the Netherlands.
den Elzen MGJ, Roelfsema M, Hof AF, Böttcher H, Grassi G (2012) Analysing the emission gap between pledged emission reductions under the Cancún Agreements and the 2 °C climate target. PBL Netherlands Environmental Assessment Agency, Bilthoven, the Netherlands, www.pbl.nl\en.
19
Dixon A, Anger N, Holden R, Livengood E (2008) Integration of REDD into the international carbon market: Implications for future commitments and market regulation. Report prepared for the New Zealand Ministry of Agriculture and Forestry.
Eliasch (2008) Climate Change: Financing Global Forests.
FAO (2010) Global Forest resource Assessment. Food and Agriculture Organization. Fry I (2008) Reducing Emissions from Deforestation and Forest Degradation:
Opportunities and Pitfalls in Developing a New Legal Regime. Review of European Community & International Environmental Law 17:166-182.
Fuss S, Szolgayova J, Golub A, Obersteiner M (2010) Options on low-cost abatement and investment in the energy sector: new perspectives on REDD. Environment and development economics:pg. 1-19.
Government of Brazil (2010) DECREE No. 7390, 9 December 2010. In:
http://www.planalto.gov.br/ccivil_03/_Ato2007-2010/2010/Decreto/D7390.htm Kindermann G, Obersteiner M, Sohngen B, et al. (2008) Global cost estimates of
reducing carbon emissions through avoided deforestation PNAS 105:10302-10307. Livengood E, Dixon A (2009) REDD and the efforts to limit global warming to 2˚C:
Implications for including REDD credits in the international carbon market. Dixon KEA3 Report prepared for Greenpeace International
Lubowski R, Rose S (2013) The Potential for REDD+: Key Economic Modeling Insights and Issues. Review of Environmental Econonomics and Policy 7:67-90.
Lucas P, Vuuren DPv, Olivier JA, Elzen MGJd (2007) Long-term reduction potential of non-CO2 greenhouse gases. Environmental Science & Policy 10:85-103.
Michaelowa A, Jotzo F (2005) Transaction costs, institutional rigidities and the size of the clean development mechanism. Energy Policy 33:511-523.
Ministry of Finance (2009) Ministry of Finance Green Paper: Economic and Fiscal Policy Strategies for Climate Change Mitigation in Indonesia. Ministry of Finance and Australia Indonesia Partnership, Jakarta,
www.fiskal.depkeu.go.id/webbkf/siaranpers/siaranpdf%5CGreen%20Paper%20Final .pdf.
Murray BC, Lubowski R, Sohngen B (2009) Including International Forest Carbon Incentives in Climate Policy: Understanding the Economics. Nicholas Institute for Environmental Policy Solutions, Duke University, Durham.
OECD (2012) OECD Environmental Outlook to 2050. OECD, Paris.
Ogonowski M, Helme N, Movius D, Schmidt J (2007) Reducing Emissions from
Deforestation and Degradation: The Dual Markets Approach. International Future Actions Dialogue Working Papers. Center for Clean Air Policy.
UNEP (2012) The Emissions Gap Report 2012. A UNEP Synthesis Report. UNFCCC (2009) Copenhagen Accord. Retrieved March 15, 2010, from
http://unfccc.int/resource/docs/2009/cop15/eng/l07.pdf.
UNFCCC (2010) Information provided by Parties relating to Appendix II of the Copenhagen Accord.
Unites States Congress (2009) American clean energy and secutirty act of 2009 to create clean energy jobs, achieve eberngy independence, reduce global warmingpollution and transition to a clean energy economy in Congress t (ed.) H.R. 2454.
Unites States of America (2012) Annual Energy Outlook. Early Release Overview. Energy Information Administration.
van Vuuren DP, den Elzen MGJ, van Vliet J, et al. (2009) Comparison of different climate regimes: the impact of broadening participation. Energy Policy 37: 5351-5362.
20
van Vuuren DP, van Ruijven B, Hoogwijk M, Isaac M, de Vries HJM (2006) TIMER 2: Model description and application. in Bouwman AF, et al. (eds.) Integrated
modelling of global environmental change. An overview of IMAGE 2.4. Netherlands Environmental Assessment Agency (MNP), Bilthoven, the Netherlands.