CSR AND NON-FINANCIAL REPORTING
Belgian Firms’ Current Financial Slacks and Future CSR Performance
Word count: 17,080
Hippolyte Djuekou Djiokep
Student number: 01806793
Promoter / Supervisor: Prof. Dr. Abigail Levrau
A dissertation submitted to Ghent University in partial fulfilment of the requirements for the degree of the
Master’s in Business Economics: Corporate Finance
Deze pagina is niet beschikbaar omdat ze persoonsgegevens bevat.
Universiteitsbibliotheek Gent, 2021.
This page is not available because it contains personal information.
Ghent University, Library, 2021.
PREFACE
This master’s dissertation is a partial requirement for the fulfilment of the Master of Science in
Business Economics: Corporate Finance, in the Faculty of Business Economics and Administration,
Ghent University, Ghent, East Flanders, Belgium.
This thesis has been one of the most challenging parts of my entire studies so far. The good thing about challenges is when you overcome them, they make you stronger. So, yes, this thesis has made me stronger. It helped me build on personal development. It gave me insights on research works and improved academic competences and my ability to work independently.
To be honest, this wouldn’t have been possible without the support of some special people whom I want to acknowledge here.
First and foremost, my sincere gratitude goes to Prof. Dr. Abigail Levrau for granting me the opportunity to work under her supervision and on a topic of my choice. She always finds the rights words to encourage and boost my moral. Her unconditional support and constructive critiques encouraged me to put in my very best in this dissertation. Thank you, Prof.
My special thanks go to my lovely wife, Jayne Katrin Marcelo, who is my main source of inspiration and to my younger brother, Raoul Ouandji Djiokep for always being there.
I would not be doing myself justice if I do not mention the names of Rodrigue Kemayou Nanwo, and Viviane Raëlle Ngoko Djiokep and my lovely parents, who have never failed in giving me their unconditional support.
Finally, I thank all the unsung people, who have supported me with unflagging commitment.
Above all, I give thanks to God Almighty for guiding me and providing me with the wisdom, stamina and health, in this time of CoVid-19 pandemic, to successfully complete my thesis.
ABSTRACT
The main purpose of this thesis is to examine if a firms’ slack resources can drive its CSR performance and to measure the level compliance of Belgian firms to the Directive 2014/95/EU which constitutes the legal framework of non-financial reporting in the European Union.
In order to do so, we developed and tested a model that establishes the relationship between a firm’s financial slacks and its future CSR performance. In addition, we also examined the level of firm’s compliance to the nonfinancial disclosure requirements of the Directive and how this level of disclosure varies across firms’ industry. We tested our hypothesis using a sample of 114 observations from 57 firms from 11 different industries between 2017 and 2018.
We find that there is a positive relationship between Belgian firms’ current available and potential financial slack resources and their future CSR performance. The study also reveals that the level of compliance of the Belgian firms to the Directive is, on average, 64.3% and has increased by 2% between 2017 and 2018. The study shows that Belgian firms focus most on environmental issues. We recommend that firms should pay more attention on the anti-corruption and bribery matters, which appears to have the least attention. Health care firms, in particular, should improve on their reporting quality. Finally, the thesis confirms that the compliance level varies across industries.
Keywords: Corporate social responsibility, financial slacks, Directive 2014/95/EU, stakeholder
theory, agency theory, stewardship theory, resources-based view, legitimacy theory, nonfinancial reporting disclosure, nonfinancial disclosure index.
TABLE OF CONTENT
CONFIDENTIALITY AGREEMENT ... I PREFACE ... II ABSTRACT ... III TABLE OF CONTENT ... IV LIST OF TABLES ... V LIST OF FIGURES ... V LIST OF APPENDICES ... VI LIST OF ABBREVIATIONS ... VIICHAPTER I: INTRODUCTION ... 1
CHAPTER II: LITERATURE REVIEW ... 3
2.1CORPORATE SOCIAL RESPONSIBILITY ... 3
2.1.1 CSR Evolution ... 3
2.1.2. Other Similar Concepts to CSR... 5
2.1.3. Belgium and CSR ... 5
2.1.4. Non-Financial Reporting Disclosure ... 6
2.1.4.1. Evolution of CSR reporting ...6
2.1.4.2. The EU Directives ...8
2.2.RELEVANT THEORIES ... 10
2.2.1. Stakeholder Theory ... 10
2.2.2. Agency and Stewardship Theories ... 11
2.2.3. Resource-based View Theory ... 12
2.2.4. Legitimacy Theory ... 12
2.3.SLACK RESOURCE AND CSR ... 13
2.3.1. Financial slack ... 14
2.4.HYPOTHESIS DEVELOPMENT ... 15
CHAPTER III: METHODOLOGY ...16
3.1SAMPLE ... 16
3.2DATA COLLECTION AND VARIABLES ... 16
3.2.1 Dependent Variables ... 18
3.2.2 Independent Variables ... 20
3.2.3 Control Variables ... 21
3.2.4 Variables Data Collection ... 21
3.2.5 Econometric Model ... 22
3.2.6 Analytical Tool and Method ... 23
3.2.7 Modelling Procedure ... 23
CHAPTER IV: DISCUSSION OF RESULTS ...25
4.1.EXPLORATORY DATA ANALYSIS ... 25
4.1.1. Industry ... 25
4.1.2. CSR Indexes Analysis ... 25
4.1.3. Financial Data Analysis ... 27
4.2.THE FINAL MODEL ... 27
4.2.1. Explanatory Power ... 28
4.2.2. Verifying the Underlying Assumptions ... 28
4.2.2.1. Number of observations ...28 4.2.2.2. Linearity Assumption ...28 4.2.2.3. Normality Assumption ...29 4.2.2.4. Homoscedasticity Assumption ...30 4.2.2.5. Multicollinearity Assumption ...30 4.2.2.6. Autocorrelation ...31
4.2.2.7. Specification Error Assumption ...31
4.2.3. Model Interpretation and Hypotheses Testing... 31
4.3.DISCUSSION OF RESULTS ... 34
CHAPTER V: CONCLUSIONS ...35
REFERENCES ... VIII APPENDIX ... XV
LIST OF TABLES
TABLE 1A:THE INTEGRATED REPORT GUIDING PRINCIPLES ... 8TABLE 1B:DIRECTIVE 2014/95/EUREQUIREMENTS FOR NON-FINANCIAL REPORTING ... 9
TABLE 1C:CONTENT ELEMENTS OF DIRECTIVE 2014/95/EU ... 10
TABLE 2:CSRPAPERS RELEVANT TO THIS STUDY ... 14
TABLE 3:INITIAL INDUSTRY LIST ... 16
TABLE 4:LIST OF KPIS FOR NFDI ... 18
TABLE 5:WEIGHT MEASURE OF NFDISUB-INDEXES ... 19
TABLE 6:OLS ASSUMPTIONS SUMMARY ... 24
TABLE 7:INDUSTRIES BY BUSINESS NATURE ... 25
TABLE 8:STEPWISE MODELS COMPARISON ... 29
TABLE 9:FINAL MODEL SUMMARY ... 33
LIST OF FIGURES
FIGURE 1:THE PYRAMID OF CORPORATE SOCIAL RESPONSIBILITY ... 4FIGURE 2:RESEARCH DESIGN ... 17
LIST OF APPENDICES
APPENDIX 1.1.:THE UNMILLENNIUM DEVELOPMENT GOALS ... XV
APPENDIX 1.2.:THE 17UNSUSTAINABLE DEVELOPMENT GOALS ... XV
APPENDIX 2.1.:LIST OF COMPANIES IN THE SAMPLE ... XVI
APPENDIX 2.2.:SAMPLE DATA (PART 1) ... XVII
APPENDIX 2.3.:SAMPLE DATA (PART 2) ... XVIII
APPENDIX 2.4.:NON-FINANCIAL INDEXES PER INDUSTRY AND PER YEAR ... XIX
APPENDIX 2.5.:DESCRIPTIVE STATISTICS ... XIX
APPENDIX 2.6.:STATISTICS SUMMARY PER YEAR ... XX
APPENDIX 2.7.:FINANCIAL DATA STATISTICS PER INDUSTRY AND PER YEAR... XX
APPENDIX 3.:BIVARIATE CORRELATION MATRIX WITH SCATTER PLOTS ... XXI
APPENDIX 4.1.:DENSITY PLOTS OF NON-FINANCIAL INDEXES ... XXII
APPENDIX 4.2.:DENSITY PLOTS OF FINANCIAL DATA ... XXIII
APPENDIX 4.3.:NON-FINANCIAL DISCLOSURE SUB-INDEXES BOX PLOTS PER INDUSTRY ... XXIV
APPENDIX 4.4.:FINANCIAL DATA BOX PLOTS PER INDUSTRY ... XXV
APPENDIX 4.5.:RESIDUALS VS.FITTED SCATTER PLOT AND QQ-NORM PLOT ... XXVI
APPENDIX 5.:FINAL MODEL SUMMARY ... XXVII
APPENDIX 6.1.:JARQUE BERA NORMALITY TEST ... XXVIII
APPENDIX 6.2.:BREUSCH-PAGAN TEST ... XXVIII
APPENDIX 6.3.:MULTICOLLINEARITY VIFTEST ... XXVIII
APPENDIX 6.4.:RUNS MANUAL AUTOCORRELATION TEST ... XXVIII
APPENDIX 6.5.:BREUSCH-GODFREY AUTOCORRELATION TEST ... XXVIII
APPENDIX 6.6.:MODEL SPECIFICATION ERROR TESTS... XXVIII
APPENDIX 7.1.:RAW DATA (SHEET 1) ... XXIX
APPENDIX 7.2.:RAW DATA (SHEET 2) ... XXX
APPENDIX 7.3.:RAW DATA (SHEET 3) ... XXXI
APPENDIX 7.4.:RAW DATA (SHEET 4) ...XXXII
APPENDIX 7.5.:RAW DATA (SHEET 5) ... XXXIII
APPENDIX 7.6.:RAW DATA (SHEET 6) ...XXXIV
APPENDIX 7.7.:RAW DATA (SHEET 7) ... XXXV
APPENDIX 7.8.:RAW DATA (SHEET 8) ...XXXVI
APPENDIX 7.9.:RAW DATA (SHEET 9) ... XXXVII
LIST OF ABBREVIATIONS
ACB Anti-Corruption and Bribery
ACBI Anti-corruption & Bribery Index
ACCA Association of Chartered Certified Accountants
BM Basic materials firms
BEL 20 Benchmark index of the 20 most traded companies in EURONEXT
BEL MID Companies not in BEL 20 but with highest net return index
BEL SMALL Companies not in BEL 20 but with highest gross return index
BLUE Best Linear Unbiased Estimator
CC Consumer Cyclical firms
CD Consumer Defensive firms
CERES Coalition for Environmentally Responsible Economies
CR Current ratio
CSR Corporate Social Responsibility
DA Debt-to-asset ratio (leverage)
EMP Employee
EMPI Employment Index
ENV Environmental
ENVI Environmental Index
EU European Union
EURONEXT Brussels Belgian Stock Exchange
EY Ernst and Young
FMA Financial Services and Markets Authority
GRI Global Reporting Initiative
GSSB Global Sustainability Standards Board
H0 Null hypothesis
H1 Alternative hypothesis
HC Health Care firms
HRI Human Rights Index
IND Industrials, Energy firms and Utilities firms
IR International Integrated Reporting Framework
IIRC International Integrated Reported Council
JB Jarque-Bera
KPI Key Performance Indicator
LM Lagrange Multiplier
lnTA Natural log of total assets
MDG Millennium Development Goal
n Number of observations in the sample
NFDI Non-Financial Disclosure Index
NFR Non-financial reporting
NGO Non-Governmental Organizations
OLS Ordinary least squares
PIE Public-interest entities
PwC PricewaterhouseCoopers
SDG Sustainable Development Goal
SOC Social
SOCI Social Index
TA Total assets
TCOM Technology firms and Communication Services firms
UN United Nations
WCS Working-capital-to-sales
Yeart Current Year
Yeart+1 Next Year
Chapter I: INTRODUCTION
This chapter aims at framing the study both within current research and within practice.
Corporate Social Responsibility (CSR) has become a hot topic on which many scholars and professionals have been working, since the last century. From “pure socialism” (Friedman M. , 1970) to an integral part of the firm’s strategy, and from voluntary to mandatory reporting, CSR has tremendously evolved to date. The main purpose of running a company today goes beyond profitability as firms are integrating the concept of sustainability with more consideration to the people and the planet (Bedenik & Barišić, 2019). Firms are beginning to be considered socially friendly when they are law-abiding and integrates the societal expectations into their business strategies. This, perhaps, explains why Governments, organisations and companies are more and more committing to CSR and incorporating it into their strategy. A study argues that the relationship between CSR, as part of the business operations, and the firm’s financial performance is positive (Burke & Logsdon, 1996).
CSR is a very important topic in the European Union, of which Belgium is a member. For the purpose of harmonization and comparability, many frameworks have been developed as the society is more
and more demanding for transparency and accountability from companies (Ashforth & Gibbs, 1990).
It is in this perspective that the European Union has adopted the Directive 2014/95/EU which constitutes the legal framework of non-financial reporting in the European Union. According to this Directive, the “…disclosure of non-financial information is vital for managing change towards a
sustainable global economy by combining long-term profitability with social justice and environmental protection. In this context, disclosure of non-financial information helps the measuring, monitoring and managing of undertakings' performance and their impact on society…”
(EU, 2014). The Directive was enforced on December 5th, 2014, but the mandatory public disclosure
of the CSR activities in the EU has only been from 2017. This was transposed into the Belgian Laws
since September 3rd, 2017 with a Royal Act signed by the King.
Barely three years later, the scarcity of literature on the level of compliance of firms to this Directive and on the potential determinants of the quality of the disclosure’s content, is no surprise. Previous research on CSR have elaborated on its relationship with the firm’s performance, that is the effect of CSR (Wood, 2010). Meanwhile, very few researchers have been interested in investigating on the drivers of a firm’s CSR performance (Margolis & Walsh, 2003).
The financial resources that can be allocated to finance the CSR activities are determined by the interests and the values different stakeholders have for the company. This summons a series of questions such as: why do some firms invest in CSR? or what could be a good predictor of a firm’s future CSR level of disclosure? Hence, we primarily investigate on the potential drivers of CSR
performance in a firm. Considering that the management of slack resources is very important for a firm to bridge the legitimacy gap when the society’s expectations or global environment change, this thesis aims at providing an answer to the following research question: Is there a positive
relationship between Belgian firms’ current financial slacks and their future CSR performance? to
this effect, we explore both the level of compliance to the Directive 2014/95/EU in Belgium and whether a firm’s financial slack resources can drive its CSR performance. The remainder of this thesis is structured as follows:
Chapter 1: Introduction
This chapter aims at framing the study both within current research and within practice.
Chapter 2: Literature Review
In this chapter, the study establishes the theoretical framework intended to familiarize the reader with relevant theories required to understand the underpinnings of this study. It ends with the formulation of the hypothesis to be tested.
Chapter 3: Methodology
This chapter briefly motivates the choice for a quantitative research method. Then, the sample choice, method and sources of data collections, econometric model, analytical tool and modelling procedure is discussed. All assumptions made in this study are described herein.
Chapter 4: Discussion of Results
This chapter provides explanatory analysis of data, model’s selection, building and diagnostics. Results from the model are then presented and discussed in connection with theory and previous research.
Chapter 5: Conclusions
This chapter provides an answer to our research question, practical limitations and suggestions for future research to be conducted based on the results, analysis and discussion provided in the study.
References
This part provides a list of books, papers, websites used or cited during the study
Appendix
Chapter II: LITERATURE REVIEW
In this chapter, the study establishes the theoretical framework intended to familiarize the reader with relevant theories required to understand the underpinnings of this study. It ends with the formulation of the hypothesis to be tested.
2.1 Corporate Social Responsibility
Corporate Social Responsibility (CSR) has become a hot topic for the press, among business and political leaders, and in academic literature and research. CSR is, indeed, the subject on which many scholars and professionals have been working since the last century (Donham, 1927).
“Corporate Social Responsibility (CSR) can be defined as a concept whereby
com-panies integrate social and environmental concerns in their business operations and in their interaction with their stakeholders on a voluntary basis” (European
Commission, 2011). CSR is also “the obligations of businessmen to pursue those
policies, to make those decisions, or to follow those lines of action which are desir-able in terms of the objectives and values of our society” (Bowen, 1953).
Firms are thus considered socially friendly when they are law-abiding and integrates the societal expectations into their business strategies.
2.1.1 CSR Evolution
CSR is “pure socialism” (Friedman M. , 1970) and is a waste of resources for the firm because the raison d’être of a company is to amass as much wealth as possible for its shareholders (Friedman M. , 1962). For many decades, the common practice of companies has been to increase their corpo-rate wealth. Firm’s performance was mainly measured by how much more money was made; how much more profit was realized; how much more wealth was amassed. This was done at the detri-ment of the societal well-being.
CSR is still an ambiguous topic (Lee L. , 1987), which does not necessarily refer to the same thing to everyone (Votaw, 1973). CSR should be prescriptive (Sethi, 1975): that is, firms’ behaviour should be in line with the norms, values and expectations of the society. Another paper argues that CSR should instead be operational: that is, it should be part of the day-to-day business activities of the firms (Jones, 1980).
Carroll’s developed a hierarchical order in the responsibilities of a firm in 1979 in a form of a pyramid (Figure 1). This concept remains a reference to better understand the notion of CSR (Carroll A. , 1991). This pyramid of CSR defines the firm’s responsibilities at four (4) different levels: economic, legal, ethical and philanthropical, as shown in below figure. In other words, the pyramid highlights different firm’s obligations towards the society in which it operates.
• At the foundation of the pyramid, we have the economic responsibility upon which the other layers depend. The firm must be profitable in order to stay in business and to sustainably support the society.
• The legal responsibilities in CSR simply mean that firms must operate in accordance with different local, national, regional, and international laws and regulations in their course of doing business.
• The ethical responsibilities in CSR go beyond observing laws and regulations. Firms must do what is right, fair and just. They must meet the expectations of the society and respect its norms, values, culture and standards.
• Finally, after achieving the economic, legal and ethical responsibilities, the next step is the philanthropic responsibilities which include discretionary activities voluntarily carried out by the firm, making them a good corporate citizen. These activities include charities and dona-tions.
FIGURE 1:THE PYRAMID OF CORPORATE SOCIAL RESPONSIBILITY
Source: Archie B. Carroll (1991)
A study argued that CSR activities, as business operations, are positively correlated with the firm’s financial performance (Burke & Logsdon, 1996). This might explain why, nowadays, companies are more and more committing to CSR and incorporate it into their business strategy.
More so, in recent years there has been the tendency of moving the world that we live-in to be more sustainable; a tendency which received the attention of global markets. This movement is framed into the CSR notion in that companies could not maintain their legitimacy without taking into con-sideration their stakeholders’ expectations.
2.1.2. Other Similar Concepts to CSR
CSR began to be more a global topic with the United Nations (UN) Secretary General’s speech during the World Economic Forum: “I propose that you, the business leaders gathered in Davos, and we,
the United Nations, initiate a global compact of shared values and principles, which will give a hu-man face to the global market” (Annan, 1999).
This led to the launching of the United Nations Global Compact (UNGC) in July 2000 as an instrument to integrate universal values into the corporate world with focus on human rights, social and envi-ronmental issues. This was followed by the adoption of the eight Millennium Development Goals (MDGs), in September 2000, to enhance the ‘war’ against poverty, hunger, disease, illiteracy, envi-ronmental degradation, and women discrimination (WHO, n.d.). By these MDGs (Appendix 1.1), the UN set the international agenda for the subsequent 15 years (till 2015).
Due for 2015 and as a follow-up to these MDGs, the UN formulated 17 new Sustainable Develop-ment Goals (SDGs) on September 25, 2015, for another 15 years (that is till 2030). In fact, the then UN Secretary General, proclaimed that these goals are “a shared vision of humanity and a social
contract between the world's leaders and the people” and “they are a to-do list for people and planet, and a blueprint for success” (Ki-Moon, 2015). In line with the MDGs, the SDGs (Appendix 1.2)
were also aiming at eradicating poverty, protecting the planet while ensuring prosperity for all. Environmental, Social, and Governance (ESG) is another concept, which refers to the assessment and management of risks (compliance, regulatory, environmental, strategic and operational) associated with CSR (Ho, 2016). These criteria are better tools to estimate the risks and return of a project. Some papers even use ESG as a proxy to measure CSR (Han et al., 2016).
In a nutshell, ESG focusses on the assessment and management of risks associated with CSR activi-ties of the firm that concur towards meeting the UN’s SDGs which are globally accepted framework for future generations.
2.1.3. Belgium and CSR
Belgium, an EU member, is a federal state with three communities (Flemish, French and German) with an atypical institutional structure. The Federal Government is responsible for all matters of national interest like control of air pollution, while the regions define most socio-environmental policies. Traces of CSR in embryonic form begins in the 1970s with the FEBECOOP (Fédération Belge de l'Economie Sociale et Coopérative) pioneering and promoting CSR in Belgium. In the 1990s, en-vironmental legislation started to emerge and led to the adoption of the 5 May 1997 Act as a legal framework on ‘sustainable development’. (Louche, et al., 2007)
It is only in the early 2000 that the concept of ‘Corporate Social Responsibility’ started to be vulgar-ized with ‘The Circle – Enterprise and Sustainable Development’ project organvulgar-ized by the King Bau-douin Foundation to accompany Belgians firms translating the concept into business activities. This
led to the adoption of the first reporting framework with a set of 15 KPIs, in 2005, to enhance the CSR reporting quality of Belgian firms (Louche, et al., 2007). “The development of CSR in Europe has
been accompanied and stimulated by a general increase in concerns about ethics, heightened aware-ness of risk and risk management, the growth in media exposure concerning CSR and the rise of NGOs that has increased pressure on firms to take certain soft issues into account” (Louche, et al.,
2007).
Moreover, with the integration in the EU and new concepts like MDGs, SDGs and ESGs, CSR has become a very important parameter of the Belgian economy today. A survey revealed that over 96% of companies have at least integrated CSR in their business activities (SDG Barometer Belgium, 2018).
2.1.4. Non-Financial Reporting Disclosure
Nowadays, the main purpose of running a company goes beyond profitability. Investors, regulators and the society (in general) want to know the socio-environmental impact of the firms’ activities impact. This is, perhaps, the reason why we most governments adopting regulations requiring from firms to frequently report their CSR activities (Baron, 2014). By complying with these regulations, firms protect their reputation as they strive to dissociate themselves from those companies with detrimental social and environmental footprint.
2.1.4.1. Evolution of CSR reporting
Non-financial reporting (NFR) is a relatively new topic in the business practice which has evolved a couple of decades ago. Initially, NFR was mostly disclosed on a voluntary basis. Because of deeper awareness regarding climate change and environmental challenges, alongside the pressure from investors, customers, and competition, nonfinancial reporting developed from a voluntary to a man-datory and highly standardized practice. There has been a paradigm shift from profitability toward sustainability as adopting a holistic perspective, respecting people and the planet. (Bedenik & Barišić, 2019)
As the world is becoming more concerned about pollution and global warming, firms, which were previously only focussed on providing the financial information to its stakeholders, are starting to report on their environmental activities as a mean to consolidate their legitimacy and transparency (Ashforth & Gibbs, 1990).
In the late 90’s there was another mutation, with firms having to enlarge their sustainability scope from the environmental perspective to the triple bottom line concern including economic, social and environmental issue. Recent reporting framework was initiated by the Coalition for Environ-mentally Responsible Economies (CERES) with the Global Reporting Initiative (GRI) project, which aimed at holding firms accountable for their behaviour towards the environment (GRI, n.d.). GRI, an international independent organization, has been accompanying businesses, governments, and
other organisations in communicating on sustainability issues: climate change, pollution, human rights, corruption, etc.
GRI launched the first global standards for CSR reporting, in 2016, to enable firms to publicly disclose their report on how they contribute towards sustainable development. It enables stakeholders measure the economic, environmental and social impacts of the firm on its society. This GRI Stand-ards, developed by the Global Sustainability Standards Board (GSSB), can be seen as a reliable ref-erence for companies and policy makers. Its latest Guidelines offers Reporting Principles, Standard Disclosures and an Implementation Manual for the preparation of nonfinancial reports by organiza-tions of any size or sector. These standards are the fruits of a collaboration between various gov-ernments, multinationals, NGO’s, etc. and include all the main concepts and disclosures from its Guidelines, enhanced with a more flexible structure, clearer requirements, and simpler language (GRI, n.d.).
In the executive summary, page 4, of its 2017 Survey of Corporate Responsibility (CR) Reporting on N100 companies (the largest 100 companies in 49 countries, i.e. a total of 4900 companies) and G250 companies (the largest 250 companies in the world), KMPG found that about two-third of the reports analysed in the said survey apply the GRI standards. In fact, they argue that GRI remains the most popular framework for CR Reporting with 63% of N100 reports and 75% of G250 reports ap-plying it (Blasco & King, 2017).
A survey’s findings revealed about 95% of the 260 responding investors around the world regard the integrated report as an important tool for non-financial information (EY, 2018). An earlier survey found that 84% of investors from 18 countries, including Belgium, believed that a standardized re-porting framework should be used by companies, while 92% of the said investors recommended an integrated reporting (ACCA, 2013).
The next expected evolution is the integrated reporting, which merges both financial information and non-financial information in one and single report. The International Integrated Reporting Framework (IR) is more than merging of financial and non-financial reporting information. It is about disclosing value, and it enhances the way organizations think, plan and report the story of their business. Designed by the International Integrated Reported Council (IIRC), integrated report is “a
concise communication about how an organization’s strategy, governance, performance and pro-spects, in the context of its external environment, lead to the creation of value in the short, medium and long term” (IIRC, 2013).
Table 1a: The Integrated Report Guiding Principles
Guiding Principles Description
Strategic focus and future orientation
IR should provide insight into the organization’s strategy, and how it relates to the organization’s ability to create value, and to its use of and effects on the capitals
Connectivity of information
IR should show a holistic picture of the combination, interrelatedness and dependencies between the factors that affect the organization’s ability to create value over time
Stakeholder relationships
IR should provide insight into the nature and quality of the organization’s relationships with its key stakeholders, including how and to what extent the organization understands, considers and responds to their legitimate needs and interests
Materiality IR should disclose information about matters that substantively affect the
organization’s ability to create value
Conciseness An integrated report should be clear and concise
Reliability and completeness
IR should include all material matters, both positive and negative, in a bal-anced way and without material error
Consistency and comparability
: IR information should be consistent over time and should facilitate com-parability with other firms or organizations
Source: IRCC 2013 Report
The objective of IR is to show how CSR can positively correlate with financial performance through a sustainable business process (Veltri & Silvestri, 2015). IR gives a broad picture of the company, highlights the connections between management and future aims, and shows financial performance and its long-term effects on decision-making.
2.1.4.2. The EU Directives
CSR is an important topic in the European Union, for which Belgium is a member. The Directive 2014/95/EU, also known as non-financial reporting directive (NFRD), published in 2014 by the Euro-pean Parliament and The Council on 22 October 2014, defines disclosure standards as it is required from companies to include non-financial information in their annual reports from 2017 onwards. Hence, the year 2017 marks the transition from a voluntary to a mandatory CSR reporting in accord-ance with the Directive 2014/95/EU (Arraiano & Hategan, 2019). Enforced on December 5th, 2014, the mandatory public disclosure of CSR activities set by the Directive in the EU was transposed into
the Belgian Laws since September 3rd, 2017 with a Royal Act signed by the King.
This mandatory move concerns roughly 6,000 firms in the EU. These are listed companies and other private firms designated by the national authorities as public-interest entities (PIEs) meeting the following conditions (EU, 2014):
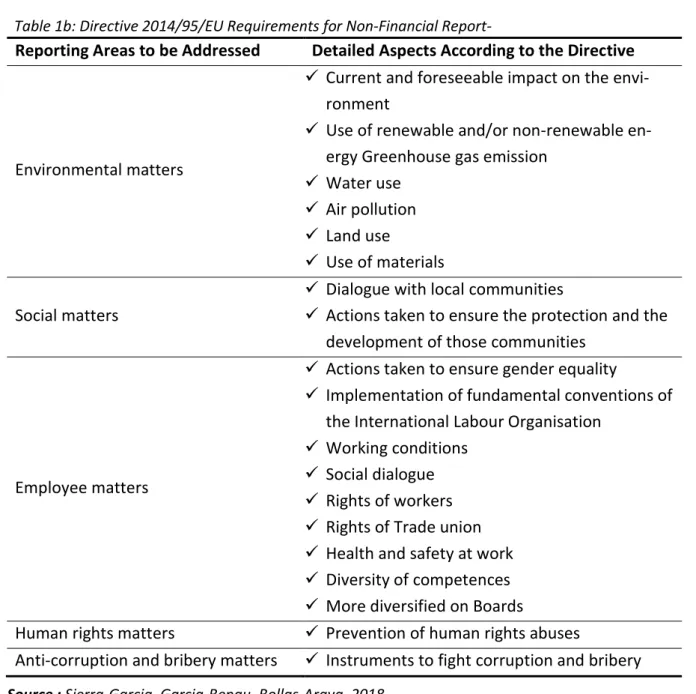
Table 1b: Directive 2014/95/EU Requirements for Non-Financial Report-ing
• Firm’s size of at least € 17 million in total assets • A minimum a net turnover of € 34 millions
Reporting Areas to be Addressed Detailed Aspects According to the Directive
Environmental matters
✓ Current and foreseeable impact on the envi-ronment
✓ Use of renewable and/or non-renewable en-ergy Greenhouse gas emission
✓ Water use ✓ Air pollution ✓ Land use ✓ Use of materials Social matters
✓ Dialogue with local communities
✓ Actions taken to ensure the protection and the development of those communities
Employee matters
✓ Actions taken to ensure gender equality
✓ Implementation of fundamental conventions of the International Labour Organisation
✓ Working conditions ✓ Social dialogue ✓ Rights of workers ✓ Rights of Trade union ✓ Health and safety at work ✓ Diversity of competences ✓ More diversified on Boards
Human rights matters ✓ Prevention of human rights abuses
Anti-corruption and bribery matters ✓ Instruments to fight corruption and bribery
Source : Sierra-Garcia, Garcia-Benau, Bollas-Araya, 2018
The 5 main areas of concern of this Directive are related to environmental matters, social and em-ployee matters, human rights, active and passive anti-corruption and bribery matters as shown in
Table 1b above.
The non-financial disclosures reported by these large firms as prescribed by the above should in-clude the following as shown in Table 1c below (EU, 2014).
However, it is worth noting that firms still have flexibility in the content of the information they wish to disclose, which should in any case be of high quality for comparability purpose (European Commission, 2017).
Table 1c: Content Elements of Directive 2014/95/EU
Content Elements Description
Business Model A brief description of the undertaking’s business models
Policies and Due Diligence Policies definition and resources allocation for projects execution
Outcomes the outcome of those policies
Risks and Risk Management Identification, measurement and management strategies of risks
Key Performance Indicators Non-financial KPIs relevant to a specific business
Source: Directive 2014/95/EU
2.2. Relevant Theories
2.2.1. Stakeholder Theory
A stakeholder refers to “any group or individual who can affect or is affected by the achievement of
the organization's objectives” (Freeman & McVea, 1984). There are three different dimensions from
which the stakeholder theory could be analysed: descriptive, instrumental and normative theory (Donaldson & Preston, 1995).
• The theory is descriptive in the sense that it explains the firm’s behaviour, management and features (Brenner & Cochran, 1991).
• As an instrument, the theory helps to measure the impact of stakeholders’ management and the firm’s performance, which are positively correlated (Donaldson & Preston, 1995). • The normative character of this theory is based on what is correct and normal. This is capital
in assessing the firm’s commitment in social activities (Margolis & Walsh, 2003).
The intrinsic value and legitimate stakes of stakeholders depend on the size of their interests in the firm (Donaldson & Preston, 1995). A study argued that the relationship between the firm’s perfor-mance and the interest maximization of individual stakeholder is positive (Ogden & Watson, 1999). The financial resources that can be allocated to finance the CSR activities is determined by the in-terest and the value different stakeholders have for the company. A study theorized the concept of ‘power, legitimacy, and urgency’, in which a stakeholder’s salience can be defined as “the degree to
which managers give priority to competing stakeholder claims” (Mitchell, Agle, & Wood, 1997).
Sa-lient stakeholders can facilitate CSR integration in the firm’s core business operations with opera-tional capital allocation. The expectations of less salient stakeholders, on the other hand, can only be tackled with financial resources not committed for operational activities.
In a nutshell, the theory simply recapitulates the sustainability responsibilities of every firms to-wards its various stakeholders: that is, the shareholders (Freeman & Dmytriyev, 2017).
2.2.2. Agency and Stewardship Theories
Considered as the founders of the agency theory, Jensen and Meckling define the relation of agency as “a contract in which one (or several people) has recourse to the services of another person to
achieve on her behalf an unspecified task, which implies a delegation of decisional nature to the agent” (Jensen & Meckling, 1976). Thus, central to the agency theory are the ‘principal’ and the
‘agent’, with the agent acting on behalf of the principal. The theory aims at understanding the relationship between the agent and the principal. Conflict of interest between stakeholders is the key element in the agency theory of the firm: different stakeholders have different incentives which can push firms to undertake actions advantageous one group but at the detriment of another group. The risks are as a result of both parties trying to maximize their utilities. A study suggested the institution of incentive schemes for the management and a platform for regular monitoring of its activities as a mitigation strategy of the problem (Jensen & Meckling, 1976).
Information asymmetry is one of the main causes of the agency issue in a firm (Eisenhardt, 1989). The agent has better insights of the business the principal, making it difficult for the latter to control the agent’s actions. In other words, the information asymmetry problem could be explained with management engaging in more risky projects which negatively affects the financial resources of the firm and hence the principal’s returns: moral hazard (Fox & Hamilton, 1994).
Unlike in the agency theory, the stewardship theory considers the agent as a motivated and loyal ‘steward’ committed to achieve the principal’s goal (profit, social good, etc.). In other words, in the stewardship theory the management (agent) works in the sole interest of the shareholders (princi-pal) and does not envisage to maximize their own selfish interests (Davis, Schoorman, & Donaldson, 1997). The shareholders simply need to monitor and control the firm’s activities to ensure the in-terests alignment of the management at all time (Van Puyvelde, Caers, Du Bois, & Jegers, 2012). In this case, no incentive scheme is required to motivate the agent but can be used to sustain perfor-mance (Donaldson & Davis, 1991).
Nowadays, a firm can achieve sustainability by finding and applying the ideal mix between financial and environmental resource (Aras & Crowther, 2009). The principal sets the vision of the firm while the agent ensures its operationalization. Management is therefore responsible for the CSR policies, activities and investment decisions of the firm. Since the agent is not engaged in self-interest activ-ities but for those of the principal, investing on CSR activactiv-ities is only justified if it enhances the fi-nancial performance of the firm while polishing its public image (Friedman M. , 1970). This would mean more financial slack at firm’s disposal. In order words, management is vital for the firm’s sus-tainability as it is the steward for its resources (Bocken, Short, Rana, & Evans, 2013).
2.2.3. Resource-based View Theory
The resource-based view is a management framework used to establish the correlation between a firm’s strategic resources and its competitive advantage. This competitive advantage is subject to the uniqueness of the firm’s resources (Conner, 1991). A previous study theorized the concept of scarcity and the difficult-to-imitate attributes of a firm’s resources being capital to achieve compet-itive advantage (Barney, 1986). In our case, financial slack measures the level of the firm’s strategic resources while CSR is considered as the firm’s competitive advantage.
This theory argues that a firm reallocating its slack resources on innovation, will enhance its perfor-mance (Cheng & Kesner, 1997). Another perspective instead argues that slack resources when not used might lead to inertia that might negatively affect the firm’s performance (Leonard-Baton, 1992).
The firm must be willing to allocate its slack resources to CSR, and the senior management should define strategies and activities on CSR to be able to ensure legitimacy. Decisions about these slack resources’ allocation can be difficult to make when there is uncertainty or risk. It is the choice of the shareholders to determine how profit and resources are reallocated to CSR activities (Reinhardt, Stavins, & Vietor, 2008). Most companies benchmark their performance on competitors and the industry average (Lant, 1992). The owners’ satisfaction is measured by the firm’s performance day, which in turn determines the amount of the resources that can be spent on CSR activities to-morrow.
2.2.4. Legitimacy Theory
“Legitimacy is a generalized perception or assumption that the actions of an entity are desirable, proper, or appropriate within some socially constructed system of norms, values, beliefs, and definitions" (Suchman, 1995).
Legitimacy theory is a system-oriented theory describing the impact a firm has on the society in which it operates, and vice versa (Hoque, 2006). ‘Social contract’ is one of the capital elements of the legitimacy theory, and it describes the relationship that invisibly exists between a firm and the society (Hoque, 2006). It determines the firm’s capacity to raise funds, and to attract customers, suppliers, investors, employees, etc.
Furthermore, “time’ and ‘place’ are two key factors to always consider when analysing a firm’s legitimacy (Hoque, 2006). The reason being the dynamic expectation of the people which evolve both with time and across societies. A legitimate initiative today does not necessarily remain legitimate tomorrow. Likewise, a legitimate initiative undertaken in Belgium will not necessarily be considered as such in my home country, Cameroon. A study argues that the raison d’être of a firm’s
existence is to meet the society’s expectations (Suchman, 1995). In order words, every society has expectations which firms are required to fulfil in order to achieve their legitimacy.
As aforementioned, the society’s expectations evolve with both time and places. As such there is likely to be a disparity between the society’s expectation at a specific point in time and the firm’s actual behaviour. This “legitimacy gap will fluctuate without any changes in action on the part of
the corporation. Indeed, as expectations of the relevant publics change the corporation must make changes or the legitimacy gap will grow as the level of conflict increases and the levels of positive and passive support decreases” (Lindblom, 1994). Thus, the gap can be as a result of firms behaving
the same way without integrating the change in time reality nor the fact that different society might have different expectations.
Legitimacy is a real threat to the firm’s survival and existence. Lindblom further argues that a firm can only maintain or regain its legitimacy through transparency and public disclosure of its CSR activities (Lindblom, 1994). This could explain why many firms have integrated the public disclosure of CSR information in their strategy, which helps in measuring the gap with the society’s expectations, and hence determining the firm’s legitimacy at a specific point in time. Thus, complying with society’s expectations is important, but disclosing the firm’s CSR performance in the annual report sends an appropriate response about firms’ behaviour. Legitimacy implies, beyond profit-making, a socially responsible behaviour of firms toward the society via an appropriate communication strategy.
The implementation of CSR into the business strategy requires allocation of capital and resources. The question here is to know whether those resources are sourced with financial slack.
2.3. Slack Resource and CSR
Organizational slack is “that cushion of actual or potential resources which allows an organization
to adapt successfully to internal pressures for adjustment or to external for change in policy as well as to initiate changes in strategy with respect to the external environment” (Bourgeois, 1981). Every
firms uses four main types of slack: operational, financial, human resource, and customer-relational slacks (Voss, Sirdeshmukh, & Voss, 2008). This study focuses on financial slack resources which hap-pen to be the one commonly used by researchers (Sharfman, Wolf, Chase, & Tansik, 1988).
Slack resources are “potentially utilizable resources that can be diverted or redeployed for the
achievement of organizational goals” (George, 2005).
A study further theorized the concept of slack resources to highlight how these ‘potentially utiliza-ble’ resources can be deployed on a firm’s CSR and other discretionary activities to create competi-tive advantage (Waddock & Graves, 1997).
Table 2: CSR Papers Relevant to this Study 2.3.1. Financial slack
The financial slack can be defined as the “financial resources in excess of what is required to maintain
the organization” (Ang & Straub, 1998).
A study posits that the non-homogenous characteristics of a firm’s financial slacks can be divided into three main group: available, recoverable and potential slacks (Bourgeois & Singh, 1983). Avail-able slack refers to all unabsorbed financial resources and without any commitment in any specific activity (e.g.: cash and short-term investments). Potential slack refers to a firm’s financial resources that determine its ability to raise additional external finance. Recoverable slack, on the other end, consists of financial resources that have been absorbed by certain firm’s activities but can be recov-ered and different activities (e.g. receivables, inventories).
One of the main advantages of slack resources is that it offers financial flexibility to the firm. The financial flexibility in turn, is a key factor that management takes into account when taking decisions for the firm (Bancel & Mittoo, 2004). Financial slack is a buffer for firms as it measures the level of additional financial resources available to support corporate development and growth. Firms with higher financial flexibility stand a better chance to grab juicy investment opportunities. These firms can better invest in their discretionary activities and innovation without compromising their main business activities.
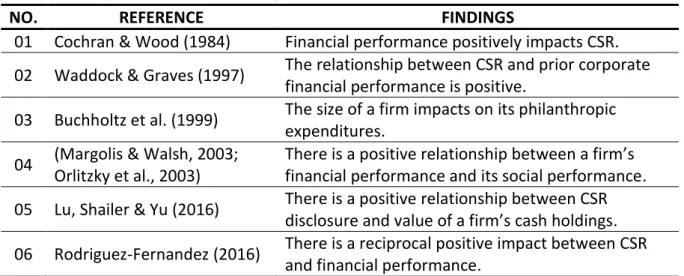
The Table 2 below gives, from a theoretical point of view, a summary of previous CSR research pa-pers relevant to this study.
Previous research on corporate social responsibility can be classified into two main theoretical per-spectives. Some researchers have examined the impact of CSR on the firm’s performance, while others focused on identifying the determinants of CSR performance (Waddock, Tribo, & Surroca, 2010). From the impact of CSR on firm’s performance perspective, considered as the most dominant focus of CSR research by Wood D.J. (2010), has raised questions of whether one can ‘do well by
NO. REFERENCE FINDINGS
01 Cochran & Wood (1984) Financial performance positively impacts CSR.
02 Waddock & Graves (1997) The relationship between CSR and prior corporate
financial performance is positive.
03 Buchholtz et al. (1999) The size of a firm impacts on its philanthropic
expenditures. 04 (Margolis & Walsh, 2003;
Orlitzky et al., 2003)
There is a positive relationship between a firm’s financial performance and its social performance.
05 Lu, Shailer & Yu (2016) There is a positive relationship between CSR
disclosure and value of a firm’s cash holdings.
06 Rodriguez-Fernandez (2016) There is a reciprocal positive impact between CSR
doing good’. That is to know if the firm’s capacity to meet up with its society’s social and environ-mental expectations, has a positive effect on its performance. This is the more reason why govern-ments and many other organizations are advocating for CSR to be a reality in the business milieu (Carroll & Shabana, 2010).
In contrast, few researchers have been interested in investigation possible drivers that cause firms to do good (Margolis & Walsh, 2003). This is where we position our study, by trying to identify driv-ers of CSR performance in a firm. We argue that management of slack resources is very important for firm to bridge the legitimacy gap when the society’s expectations or global environment change.
2.4. Hypothesis Development
The afore-detailed literature review is aimed at pointing out the importance of CSR for companies and stakeholders, elaborating on different relevant theories, defining financial slack resources and discussing recent trends in non-financial disclosure. This study in this thesis investigates financial patterns and the relationship between financial slacks and CSR performance for Belgian companies. Thus, the research question for this thesis is the following: “Is there a positive relationship between
Belgian firms’ current financial slacks and their future CSR performance?”.
CSR could be crucial in intertemporal profit maximization, shifting focus from the short, to medium and long-term investment horizons (Bénabou & Tirole, 2010). The resources-based view theory ar-gues that CSR is a resource which is beneficial to the company and relatively expensive and hard to copy, strengthening the competitive position of the company. This theory considers CSR as a com-petitive advantage. The behavioural theory of the firm posits that there is a positive effect of slack resources on the firm’s performance. Financial slack is a source of capital which the firm can invest into a wide range of activities to achieve competitive advantage.
“Time” being an essential variable of the legitimacy theory (Hoque, 2006), it is rational to assume that every firm raises the amount of financial slack, required to attain a desirable CSR performance, months or even years in advance. Thus, the hypothesis, our study investigates, can be stated as follows:
• H0. There is no positive relationship between a firm’s current financial slacks and its future
CSR performance.
• H1. There is a positive relationship between a firm’s current financial slack and its future CSR
performance
In order words, the main objective of this study is to determine if an increase in a firm’s current level of financial slack leads to an increase of in future CSR performance measured by the non-financial disclosure index (NFDI) score. Testing and investigating this hypothesis are the focus of this thesis.
Chapter III: METHODOLOGY
This chapter primarily motivates the choice for a quantitative research method. Then, the sample choice, method and sources of data collections, econometric model, analytical tool and modelling procedure is dis-cussed. All assumptions made in this study are also described herein.
This master’s thesis strives at establishing if a firm’s financial slacks can be a good predictor for its CSR performance. Our objective during this research is thus to establish if there is any relationship or correlation between financial slack of a firm and its CSR performance. And if there is any, we are also interested to find the direction of such relationship. During this study, we use quantitative methods to address our research question by properly testing our above-mentioned hypothesis. As an empirical study, this quantitative research involves the following: sample identification, data col-lection and analysis, then the interpretation and discussion of the obtained results (Creswell, 2014).
3.1 Sample
This master thesis strives at establishing if a firm’s financial slacks can be a good predictor for its CSR performance. The study focusses on Belgian public firms that are subject to the Directive 2014/95/EU, and that meet the following requirements:
- Firm must have at least 500 employees
- Firm’s size, in terms of total assets, must exceed €17 million - Firm must have a minimum net turnover of € 34 million
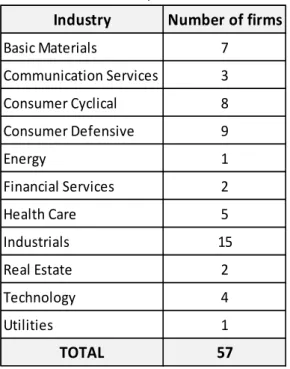
Our sample consists of Belgian public companies listed on BEL 20, BEL MID and BEL SMALL as provided on the web-site of Euronext Brussels, plus those private companies considered as public interest firms by the Belgian supervi-sory authority FSMA (Financial Services and Markets Au-thority). Based on the foregoing, we initially obtained a sample of 141 companies. The afore-mentioned Di-rective’s criteria (i.e. firm’s size, turnover and number of employees) reduced to 61 companies. Four of these com-panies were further dropped: one for non-availability of an English-version report, and the other three because our independent variables could not be explicitly estimated. Thus, the resulting sample considered for our analysis con-sists of 57 companies with frequencies of corresponding industries displayed in Table 3 and Appendix 2. 1..
3.2 Data Collection and Variables
This study relies on the quantitative method as the empirical research takes into account the entire process of identifying a sample, collecting data, analysing data, then presenting and interpreting the
Table 3: Initial Industry List
Industry Number of firms
Basic Materials 7 Communication Services 3 Consumer Cyclical 8 Consumer Defensive 9 Energy 1 Financial Services 2 Health Care 5 Industrials 15 Real Estate 2 Technology 4 Utilities 1 TOTAL 57
numerical results of the analysis (Creswell, 2014). Our research design, data collection process and methodology are illustrated in the figure below.
The Directive 2014/95/EU posits that firms publish their CSR report starting 2017. Thus, in addition to the selected 57 companies consisting of both public and private (considered to be public interest) firms, we collected our data from annual reports available on each company’s corporate website.
Identify Belgian public and public-interest companies
Collect characteristics on those companies’ industries
Check if each identified company meet the size, turnover and employment requirements
Check availability of both financial and non-financial reports for the period 2016 to 2018 (integrated and separate)
Build up our sample with companies meeting the Directive’s requirements
Collect firms’ information on current assets, current liabilities, total assets, total debts and sales
Compute the current ratio, working-capital-to-sales ratio, debt-to-assets ratio and size of the firm for each given year
Gather all the firm’s available reports during 2016 to 2018 periods
Determine the sub-indices for the non-financial report evaluation
Determine the related Key Performance Indicators (KPIs) for each sub-index
Rating each of the five sub-indices’ KPIs for every firm of the sample
Construct and calculate each firm’s Non-Financial Disclosure Index (NFDI)
Build our regression models and test the hypotheses FIGURE 2:RESEARCH DESIGN
We were interested in reports that contain the yearly financial and non-financial information of the company, published either as integrated or separate reports.
In this empirical study, our model consists of dependant, independent and control variables. Our dependent or response variable measures the CSR performance of the firm, while the independent variables indicate the firm’s financial slacks level.
3.2.1 Dependent Variables
KPI Description
1. Environmental (ENV)
ENV1 Current and foreseeable impact on the environment
ENV2 Use of renewable and/or non-renewable energy
ENV3 Greenhouse, gas emission
ENV4 Water use
ENV5 Air pollution prevention and control
ENV6 Waste management
ENV7 Development of green products and services
2. Social (SOC)
SOC1 Community relations, including social and economic development of local
communities
SOC2 Company clearly defines the company objective regarding the society
SOC3 Information about the stakeholders’ opinions: management, employees,
inves-tors, external advisors
SOC4 Consumer relations, including consumer satisfaction, possible effects of
prod-ucts on consumers' health and safety
SOC5 Reports of partners, investors, and suppliers which contain CSR information
SOC6 Information about provided aid, charity, donations
3. Employee (EMP)
EMP1 Actions taken to ensure gender equality
EMP2 Health and safety at work
EMP3 Rights of workers
EMP4 Social dialogue, including respect of trade union rights
EMP5 Working conditions
EMP6 Implementation of fundamental conventions of the International Labour
Or-ganisation
EMP7 Diversity issues
4. Human Rights (HR)
HR1 Declaration about position respect to Human Rights
HR2 Prevention of human rights abuses, implemented policies
5. Anti-Corruption and Bribery (ACB)
ACB1 Anti-corruption policies, standards and procedures
ACB2 Anti-fraud process
ACB3 Criteria used in corruption-related risk assessments
ACB4 Compliance with legal regulations
Source: Development from both Directive 2014/95/EU; Herrador-Alcaide & Hernández-Solís, 2019.
Table 5: Weight Measure of NFDI Sub-Indexes
The response variable, CSR performance, is proxied by the Non-Financial Disclosure Index (NFDI). This study only considers the NFDI for the years 2017 and 2018.
In order to quantify the NFDI, a scoring system with specific key performance indicators (KPIs) is used. Each KPI measures the presence or not of each of the in the 5 dimensions of the NFR as indi-cated by the Directive 2014/95/EU namely environmental, social, employee, human rights and anti-corruption & bribing. It is worth noting that the KPIs of each of the 5 categories used in this thesis also take into account the approaches used by other previous studies (Saraykina, 2019) and (Herrador-Alcaide & Hernández-Solís, 2019).
NFDI Sub-Index Code Weight
Environmental Index Social Index
Employment Index Human Right Index
Anti-corruption & Bribery Index
ENVI SOCI EMPI
HRI ACBI
7 KPIs ≈ 27% of the NFDI 6 KPIs ≈ 23% of the NFDI 7 KPIs ≈ 27% of the NFDI 2 KPIs ≈ 7.7% of the NFDI 4 KPIs ≈ 15.3% of the NFDI
The above Tables 4 & 5 give us a total of 26 KPIs for the NFDI with their respective weight spread. Data for each of the sub-index KPI were collected from the firm’s annual report on its corporate website for the years 2017 and 2018. Each firm has its non-financial information either in a single report with its financials or as a separate document. The published reports for both years 2017 and 2018 of each of the firm’s report were scrutinized.
The level of disclosure of the non-financial information is measured by rating each KPI of the 5 dimensions with a score of either ‘0’ or ‘1’ to indicate respectively the absence or presence of re-ported actions relating to respective KPI in the firm’s non-financial reports. In order words, to be rated ‘1’, the company must have explicitly indicated actions it has taken with respect to a specific KPI. These actions will not be required for KPIs explicitly limited to an information or a declaration. Each of the 5 sub-indices is obtained by means of average; that is, by dividing the score obtained by the number of KPIs. This means that the score for each sub-index (ENVI, SOCI, HRI, EMPI, ACBI) ranges between [0:1]. That is, the minimum and maximum possible score are ‘0’ and ‘1’ respectively. Finally, the NFDI for each firm is obtained by adding up the weighted score of each sub-index and multiplying the result by 10. That is, the sum of each sub-index multiplied by its corresponding KPI weight as given in the table above, and then multiplied again by 10. Thus, the NFDI of each firm lies between 0 and 10. The formula can be summarized as below:
Similar index design and rating methods have been used in recent research papers, (Herrador-Al-caide & Hernández-Solís, 2019; Sierra-Garcia et al., 2018; Rivera-Arrubla et al., 2017; Matuszak & Różańska, 2017), on firms’ compliance to the Directive 2014/95/EU.
Besides providing information on the level of compliance to the Directive and revealing which of the 5 dimensions is most disclosed in Belgium, the NFDI is used in our study to help determine factors that could help predict firm’s CSR performance.
3.2.2 Independent Variables
The considered independent variables represent the level of the firm’s financial slacks one year prior to the CSR performance measurement. This study measures financial slack variables by looking into those financial slack resources that are available to the firm, and those that are potentially accessi-ble to the firm (Daniel, Lohrke, Fornaciari, & Turner, 2004) and (Gral, 2014).
We use the current ratio and the working capital as proxy measures to the available slacks. The current ratio (CR) is simply obtained by dividing the firm’s current assets by its current liability:
𝑪𝑹 = 𝑪𝒖𝒓𝒓𝒆𝒏𝒕 𝑨𝒔𝒔𝒆𝒕𝒔
𝑪𝒖𝒓𝒓𝒆𝒏𝒕 𝑳𝒊𝒂𝒃𝒊𝒍𝒊𝒕𝒊𝒆𝒔
Current ratio measures the firm’s liquidity. That is, it measures the firm’s ability to settle its short-term financial obligations using its current (or liquid) assets. An increase in the current ratio means there is an additional resource or extra financial slack for the firm (Bourgeois & Singh, 1983). Thus, one would expect a positive relationship between current ratio of the firm and its CSR performance. Working capital, the other available slack indicator, measures the financial needs required by the firm to run its day-to-day activities. Working capital is usually measured as a percentage of sales. Thus, this study uses the working-capital-to-sales (WCS) ratio as measurement. WCS is obtained by dividing the firm’s working capital by the amount of sales generated.
𝑾𝑪𝑺 =𝑾𝒐𝒓𝒌𝒊𝒏𝒈 𝑪𝒂𝒑𝒊𝒕𝒂𝒍
𝑻𝒐𝒕𝒂𝒍 𝑺𝒂𝒍𝒆𝒔 =
𝑪𝒖𝒓𝒓𝒆𝒏𝒕 𝑨𝒔𝒔𝒆𝒕𝒔 − 𝑪𝒖𝒓𝒓𝒆𝒏𝒕 𝑳𝒊𝒂𝒃𝒊𝒍𝒊𝒕𝒊𝒆𝒔 𝑻𝒐𝒕𝒂𝒍 𝑺𝒂𝒍𝒆𝒔
There is also a positive correlation between a firm’s working capital and the size of its financial slack (Bourgeois, 1981). However, a firm with high working capital requirement indicates requires high amount of liquidity to settle its suppliers before customers pay in. This means high-risk for the com-pany (Mousa & Reed, 2013). In order words, this high-risk situation caused by the high capital re-quirement for daily operations, will limit the firm’s deployment in discretionary activities. Hence, one can legitimately expect a negative relationship is between WCS and CSR performance.
Debt-to-asset ratio, on the other hand, is used to proxy the potential financial slack measurement in this study. The debt-to-asset (DA) ratio or leverage ratio is obtained by dividing the firm’s total debts by its total assets and its equity respectively:
𝑫𝑨 =𝑵𝒆𝒕 𝐈𝐧𝐭𝐞𝐫𝐞𝐬𝐭 𝐁𝐞𝐚𝐫𝐢𝐧𝐠 𝑫𝒆𝒃𝒕𝒔
𝑻𝒐𝒕𝒂𝒍 𝑨𝒔𝒔𝒆𝒕𝒔
DA is a leverage ratio which measures a firm’s debt level and is also used to evaluate the firm’s risks. Low debt level mean for a firm less cash outflow for interest payment and further indicates that the firm is low-risk and stands a better chance to obtain external financing if required (Bromiley, 1991). In order words, there is a negative relationship between DA and the financial slack level of the firm. As such, one can also expect a negative relationship between the firm’s leverage and its CSR score.
3.2.3 Control Variables
As control variables, this study uses the size of the firm. We also control for the firm’s industry. Large firms are usually followed by specialized financial analysts or covered by media, and as such face less information asymmetry problem than small firms. (Chae, (2005). In order words, large firms have better access to external finance with better negotiating power: that is higher financial slack level than small firms. Beside attracting more finance, large are very concerned with their image and reputation. In a survey carried out by Accenture and UNGC (2010, p.14), 72% of respondent CEOs considered “brand, trust and reputation” as one of the main reasons why firms engage in sustainability activities. Hence, we can expect an increase in CSR performance when the size of the firm becomes larger: positive correlation. In this study, the size of the firm is measured by the nat-ural logarithm of its total assets to uniformize the scale with all other variables (Rodriguez-Fernandez, 2016; Flammer, 2011; Lee S. , 2012):
𝑺𝒊𝒛𝒆 = 𝐥𝐧 (𝑻𝑨)
We also control for the year and the industry by using industry dummies. The industries are simply based on the business sector of the firm (Tables 3 & 7). The level of financial slack may on average differ from one industry to another, and the NFDI score may also significantly change from one year to another (Bradley, Shepherd, & Wiklund, 2011). The DA, CR or leverage of a firm could on average be similar within an industry and vary significantly across industries (Cochran & Wood, 1984).
3.2.4 Variables Data Collection
Our variable’s data for this study were mainly collected from the corporate website of each com-pany. The variables are basically they are made Data for each of the sub-index KPI were collected from the firm’s annual report made up of financial information (CR, WCS, DA and size) and non-financial information (ENVI, SOCI, HRI, ACBI, EMPI, NFDI and industry).
The industry represents the business sector of the firm. Each firm publishes its financial and non-financial information either in a single report or as separate documents.
For non-financial information, this study considers information disclosed in the firms’ 2017 and 2018 reports. We could not include 2019 because most of the firms’ 2019 report were not yet available. The reports were thoroughly scrutinized in order to assign the appropriate and corresponding score for each of the sub-indexes (ENVI, SOCI, HRI, ACBI, and EMPI) from which the dependant variable (NFDI) is derived. The NFDI from a previous research study (Saraykina, 2019) was also used to cross-check the 2017 index scores since that study only focussed on 2017 data.
The study assumes that financial slacks are measure at Yeart in order to predict CSR performance at
Yeart+1. Hence, all our financial information on respective companies were collected from their
an-nual financial report found in their websites for the years 2016 and 2017 in order to predict the CSR performance of the years 2017 and 2018 respectively. This financial information was collected from the firm’s consolidated statement of financial position (balance sheet) and include the “total current assets”, the “total current liabilities”, the “total operating sales/revenue/turnover”, the “total as-sets”, and the “total debts” (interest-bearing liabilities).
Both the response and independent variables were computed manually using a Microsoft Excel spreadsheet to create our database that is used for the analysis. The raw data can be found in
Ap-pendices 7.1. to 7.10..
3.2.5 Econometric Model
In order to provide an adequate answer to our research question, which is to find out if there a positive relationship between a firm’s current financial slack and its future CSR performance, the following hypothesis is tested:
• Ho: No positive relationship between current financial slacks and future CSR performance
• H1: Current financial slacks and future CSR performance have a positive relationship
In line with the legitimacy theory which considers “time” as an important parameter (Hoque, 2006), this study considers that the amount of financial slack required to attain a desirable CSR perfor-mance, was available within the year preceding the analysed period. In order words, the 2016 and 2017 financial slack resources are used to measure the 2017 and 2018 CSR performance respec-tively. Thus, our baseline econometric model is as follows:
NFDIi,t+1 = β0 + β1*CRi,t + β2*WCSi,t + β3*DAi,t + β4*Sizei,t + β5*Yeari + αj*IndustryDummyi + εi
where β and α are estimated coefficients; i represents a given company (i=1, 2, …, 57); t represents the current year for financial variables, while t+1 is the following year for the CSR performance; j represents a specific industry dummy, ranging from 1 to 6 as one dummy is used as reference in the model; 𝜖𝑖 represents error terms assumed to follow a normal distribution. Remember, we want to