AssEssmENt of thE
ENviroNmENtAL imPActs
ANd hEALth BENEfits
of A
NitrogEN EmissioN coNtroL
ArEA iN thE North sEA
Assessment of the environmental
impacts and health benefi ts of a
nitrogen emission control area in the
North Sea
P. Hammingh M.R. Holland G.P. Geilenkirchen J.E. Jonson R.J.M. MaasAssessment of the environmental impacts and health benefits of a nitrogen emission control area in the North Sea
© PBL Netherlands Environmental Assessment Agency The Hague/Bilthoven, 2012 ISBN: 978-90-78645-99-3 PBL publication number: 500249001 Corresponding author pieter.hammingh@pbl.nl Authors
Hammingh P.1, Holland M.R.2, Geilenkirchen G.P.1, Jonson J.E.3, Maas R.J.M.4
1 PBL Netherlands Environmental Assessment Agency 2 Ecometrics Research and Consulting (EMRC), United Kingdom
3 The Meteorological Synthesizing Centre - West (MSC-W) of the European Monitoring and Evaluation Programme (EMEP) under the Convention on Long-Range
Transboundary Air Pollution (CLRTAP), hosted by the Norwegian Meteorological Institute
4 The Dutch National Institute for Public Health and the Environment (RIVM)
Contributors
R. Molenaar and A. Snijder (DCMR Environmental Protection Agency Rijnmond Netherlands), M. Posch, G.J.M. Velders and J.M.M. Aben (The National Institute for Public Health and the Environment – RIVM, the Netherlands).
Funding organisations
The authors would like to thank the following
organisations for their financial support to this study: the UK Department for Environment, Food and Rural Affairs; the Norwegian Ministry of the Environment; the Dutch Ministry of Infrastructure and the Environment; and the Dutch National Institute for Public Health and the Environment.
Acknowledgements
The authors would like to acknowledge the North Sea NECA Consultation Group as the commissioner of this study and the terms of reference, and thank them for their constructive comments on earlier versions of this report. In addition, we appreciate the fruitful cooperation with the Danish Environmental Protection Agency, Incentive Partners and Litehauz, which carried out the assessment of the direct and indirect economic impacts.
We owe a great debt of gratitude to Jan Hulskotte of the Netherlands Organisation for Applied Scientific Research (TNO), Anke Cotteleer of the Maritime Research Institute Netherlands (MARIN) and Jukka-Pekka Jalkanen of the Finnish Meteorological Institute ((FMI) and associated with the Baltic Sea Region Innoship programme), for their involvement in issues related to the emission inventories and projections as used in this study. Furthermore, we would like to thank the Coordination Centre for Effects (CCE) under CLRTAP (at RIVM) for their contributions to the analysis of impacts of nitrogen deposition on ecosystems and biodiversity. Finally, we would like to thank the following persons for their review of draft texts of this report: Christer Ågren, Pieter Boot, Leendert van Bree, Janusz Cofala, Sef van den Elshout, Anton van der Giessen, Robert Koelemeijer, Dorien Manting, Jan Matthijsen, Jacqueline Timmerhuis, Johan Sliggers and Rick Wortelboer.
English-language editing Serena Lyon, Annemieke Righart Graphics
Jan de Ruiter, Marian Abels, Durk Nijdam, Filip de Blois, Raymond de Niet
Production coordination PBL Publishers
Layout Studio RIVM
This publication can be downloaded from: www.pbl.nl/en. A hard copy may be ordered from: reports@pbl.nl, citing the PBL publication number or ISBN.
Parts of this publication may be reproduced, providing the source is stated, in the form: Hammingh, P. et al. (2012),
Assessment of the environmental impacts and health benefits of a nitrogen emission control area in the North Sea, The Hague: PBL Netherlands Environmental Assessment Agency. PBL Netherlands Environmental Assessment Agency is the national institute for strategic policy analysis in the field of the environment, nature and spatial planning. We contribute to improving the quality of political and administrative decision-making, by conducting outlook studies, analyses and evaluations in which an integrated approach is considered paramount. Policy relevance is the prime concern in all our studies. We conduct solicited and unsolicited research that is both independent and always scientifically sound.
Contents
Assessment of the environmental impacts and health benefits of a nitrogen emission control area in the North Sea 6
Summary 6 Introduction 7
Emission inventories, baseline and scenarios 9 Air quality, health and ecosystem impacts 11 Costs and benefits 14
Sea-based versus land-based air quality measures 16 Uncertainties 18 1 Introduction 22 1.1 Policy context 22 1.2 Objectives 24 1.3 Method 24 1.4 Reader 24
2 Emission inventory, baseline and scenarios 26
2.1 Emissions from North Sea shipping in 2009 26 2.2 Emission baseline for North Sea shipping in 2030 30 2.3 Scenarios in 2030 for North Sea shipping 34 2.4 Emission baseline for other European seas 35 2.5 Emissions for land-based sources 35
3 Air quality, health and ecosystem impacts 38
3.1 Air quality and deposition impacts 38 3.2 Health impacts 44
3.3 Terrestrial ecosystem impacts 48 3.4 Marine ecosystem impacts 50
4 Costs and benefits 54
4.1 Health benefits 54 4.2 Benefits to crops 56
4.3 Benefits to marine and terrestrial ecosystems 58 4.4 Costs of a nitrogen oxide emission control area 59
4.5 Comparing costs and benefits of a nitrogen oxide emission control area 60 4.6 Costs and benefits of land-based air quality measures 61
5 Uncertainty analysis 68
5.1 Emission inventory, projection and scenario assumptions 68 5.2 Air quality model resolution 69
5.3 Uncertainties that have the potential to increase benefits 69 5.4 Uncertainties that have the potential to decrease benefits 70 5.5 Synthesis of the uncertainty analysis 71
EEN
References 72
Annexes 77
Annex 1: IMO criteria for a proposal for designation of an emission control area 77 Annex 2: Background information on emission projections for North Sea shipping 78 Annex 3: Emissions from international shipping in the North Sea and in ports 84 Annex 4: Emissions on land and at sea in Europe 85
Annex 5: Concentrations and depositions in Europe 89
Annex 6: Health and terrestrial ecosystem impacts in Europe 96
5 |
EEN
FI
N
d
IN
gs
FIN
d
IN
gs
References 72 Annexes 77Annex 1: IMO criteria for a proposal for designation of an emission control area 77 Annex 2: Background information on emission projections for North Sea shipping 78 Annex 3: Emissions from international shipping in the North Sea and in ports 84 Annex 4: Emissions on land and at sea in Europe 85
Annex 5: Concentrations and depositions in Europe 89
Annex 6: Health and terrestrial ecosystem impacts in Europe 96
Assessment of the
environmental impacts and
health benefits of a
nitrogen emission control
area in the North sea
Summary
In the last five to ten years, concerns about the health and ecosystem effects of air polluting emissions from ships have grown in international policy debate regarding further air pollutant emissions control. As an outcome of the debate, the International Maritime Organisation adopted more stringent emission standards in 2008 to further control air pollution from sea shipping. For example, their most stringent nitrogen oxide emission standards are about 75 per cent lower than the standards for current ships. However, these most stringent standards are only mandatory in specific emission control areas designated by the IMO. Such specific areas aim to protect densely populated areas and sensitive ecosystems from air pollution from nearby international shipping. Prior to a possible application for designation of a nitrogen oxide emission control area, the eight North Sea countries commissioned an assessment of the environmental impacts and health benefits (this report) and the
economic impacts and costs (Danish EPA, 2012). The main conclusions of this assessment are presented and concisely explained below. A detailed elaboration of the work carried out, the results and the uncertainties can be found in ‘Full results’.
Cost-benefit analysis
• The introduction of a nitrogen emission control area in the North Sea from 2016 onwards would improve the air quality in the surrounding countries and would lead to net benefits in Europe. In 2030, the health benefits would exceed the costs to international shipping by a factor of two, according to the main estimates. The cost-benefit test is also passed in the least favourable situation, with a low value attributed to health impacts and a high cost estimate.
Comparing sea-based and land-based emission
control measures
• The comparison of health benefits and costs between a nitrogen emission control area and additional land-based emission control measures indicates that there is still substantial potential for land-based emission control measures that yield higher health benefits on land at lower costs. In particular, such land-based emission control measures include ammonia measures in agriculture, a limited number of relatively cheap nitrogen oxide measures in industry and some particulate matter measures in industry and agriculture.
• Furthermore, the comparison indicates that, if air policy aims to simultaneously abate eutrophication,
acidification, ozone and health impacts, nitrogen control at sea is about as cost-effective as nitrogen control in a medium air quality ambition for stationary land-based sources. This implies that a nitrogen emission control area fits a medium ambition for air quality improvement in Europe, or any higher ambition.
• Compared with land-based emission control measures in the North Sea coastal countries, a nitrogen emission control area in the North Sea provides a larger potential for relatively cheap nitrogen oxide reductions in the longer term (after 2030) if more and more old ships are gradually replaced by new ships with strict nitrogen control measures. The sooner a nitrogen emission control area is designated in the North Sea, the larger the reduction would be in subsequent years.
Health and ecosystem impacts
• A nitrogen emission control area would reduce the total years of life lost due to air pollution in the North Sea coastal countries by almost one per cent by 2030, and even further in subsequent years. For comparison, a low and medium ambition for land-based emission control
7
Findings |
measures reduces the total years of life lost in the North Sea coastal countries by approximately 5 and 11 per cent respectively in the short term (2020).
• Impacts of eutrophication on the biodiversity of terrestrial ecosystems are still expected to occur on a wide geographical scale in Europe in 2030, by which time North Sea shipping will contribute nearly seven per cent of the excess nitrogen loads in the ecosystems of North Sea coastal countries. A nitrogen emission control area would reduce this contribution by about one third by 2030 (two percentage points) and even further in subsequent years.
• In contrast to eutrophication problems on land, it is not clear whether eutrophication in North Sea waters is still a problem in 2030. The North Sea countries currently aim to solve such problems before 2020. The contribution of a nitrogen emission control area to reducing
atmospheric inputs is limited in the period up to 2020. This is explained by the slow replacement of ships with new and cleaner ships.
Contributions to air quality
• Nitrogen oxide emissions from North Sea shipping are responsible for 7–24 per cent of country-average nitrogen dioxide concentrations in North Sea coastal countries in 2030. Contributions to nitrogen deposition range from two to five per cent. Nitrogen oxide emissions from ships are also responsible for one to five per cent of the particulate matter concentrations (PM2.5) in the North Sea countries. A nitrogen emission control area in the North Sea would reduce all these North Sea shipping
contributions by about one third. Compared with the contribution made by North Sea shipping to nitrogen dioxide concentrations, the contribution to nitrogen deposition and particulate matter concentrations is relatively lower due the relatively higher contributions from various land-based sources.
Uncertainties
• The uncertainty analysis shows that the above cost-benefit analysis is rather robust against a number of potentially large uncertainties in the emission inventories, emission projections, emission scenarios and the applied air quality model resolution.
• New insights into the assumed harmfulness of specific particle species within particulate matter can change the conclusions reached as to whether a nitrogen emission control area would pass a cost-benefit analysis test. On the other hand, long-term exposure to low
concentrations of ozone might prove to be more harmful to human health than currently assumed. The latter would give more emphasis to nitrogen oxide reductions as this pollutant is an ozone precursor, together with volatile organic compounds.
• The lack of a proper methodology to quantify the ecosystem benefits related to a nitrogen emission control area leads to a bias towards underestimation of the monetised benefits in this study.
Introduction
Policy context: emission and fuel standards for
international shipping lag behind those of
land-based sources
In the last five to ten years, concerns about the health and ecosystem effects of air polluting emissions from ships have grown in international policy debate regarding further air pollutant emissions control. The debate is taking place in a context in which emission and fuel standards for international shipping lag behind those of land-based sources. As an outcome of the debate, the International Maritime Organisation (IMO) adopted more stringent requirements in 2008 to further control air pollution from sea shipping (IMO, 2008). For example, their most stringent nitrogen oxide emission standards are about 75 per cent lower than the standards for current ships. However, these most stringent requirements for sulphur dioxide and nitrogen oxides are only mandatory in emission control areas (ECA).
The Baltic Sea and the North Sea (including the English Channel) were designated as sulphur oxide emission control areas (SECA) in 2006 and 2007, respectively. The coastal countries of the Baltic Sea are currently involved in a decision-making process over an application to the IMO to designate the Baltic Sea as a nitrogen oxide emission control area. A North-American ECA for sulphur dioxide and nitrogen oxides (SECA and NECA) will become active on 1 August 2012.
In March 2011, the North Sea NECA Consultation Group commissioned an assessment of the environmental impacts and benefits of a nitrogen emission control area (this report) as well as the economic impacts (Danish EPA, 2012). The group consists of the eight coastal countries that surround the North Sea. The assessments aim to support the decision-making process of the North Sea countries for a common application to the IMO to designate the North Sea (including the English Channel) as a nitrogen emission control area.
Objectives based on IMO criteria
The objectives of the environmental impact and benefit assessment are based on the IMO criteria for designation of an emission control area by the IMO (Annex 1): • estimate the contribution of North Sea shipping to air
pollution within the coastal countries and beyond and to nitrogen deposition to the North Sea waters;
• assess the environmental impacts and benefits of introducing a nitrogen oxide emission control area in the North Sea;
• compare the benefits of a nitrogen oxide emission control area in the North Sea with the costs, as presented by the economic impact assessment (Danish EPA, 2012);
• compare the cost-effectiveness of a nitrogen oxide emission control area with land-based emissions control measures.
Integrated assessment method aligned with other
European air policy studies
Our integrated assessment method involved (see Section 1.3) the construction of emission baselines for North Sea shipping and scenarios describing the impacts of a nitrogen emission control area on emissions, air quality modelling, determining impacts on health and ecosystems through dose-response relationships, and estimating benefits by valuing health impacts. The comparison with land-based emission control measures was made using another cost-benefit assessment recently carried out within the framework of the revision of the national air pollutant emissions ceilings under the Gothenburg Protocol of the UNECE. To optimise the
Figure 1
Nitrogen oxide emissions projected for the North Sea, 2030
Nitrogen oxide emissions (tonnes per grid cell of 5x5 km2) ≤ 0.05 0.05 – 0.1 0.1 – 0.25 0.25 – 0.5 0.5 – 1 1 – 2.5 2.5 – 5 5 – 10 10 – 25 25 – 100 > 100
North Sea boundaries
9
Findings |
the world’s third port measured by total cargo volume in 2009 (AAPA, 2010). The busiest shipping lanes can be clearly identified in the spatial distribution of projected nitrogen oxide emissions from North Sea shipping in 2030 (Figure 1). Total nitrogen oxide emissions in the North Sea are estimated at 472 and 446 thousand tonnes in 2009 and 2030 respectively (see Section 2.1). Of these total ship emissions, 32% are released within 12 nautical miles of the shore, 89% within 50 nautical miles and 97% within 100 nautical miles. Almost 90% of the nitrogen oxide emissions take place at open sea and 10% in ports (Figure 2). Container ships are the largest single
contributor to nitrogen oxide emissions in the North Sea and in ports (Figure 2), ranging from a 30% contribution in 2009 to 40% by 2030.
The emission inventory for 2009 by the Maritime Research Institute Netherlands (MARIN) was based on monitoring data from the Automatic Identification System (AIS) for 2008 and 2009, traffic data from the Lloyds Marine Intelligence Unit (LMIU) for 2008 and ship characteristics from the Lloyds List Group (LLG) database of October 2010. Emission factors were determined by the Netherlands Organisation for Applied Scientific Research (TNO) for the main and auxiliary engines. Different models were used to construct the emission inventory.
The MARIN inventory was validated with the emission inventory by the Finnish Meteorological Institute (FMI) that was used in the economic impact assessment (FMI, 2011). This showed that the ship activities of MARIN and comparison, we aligned our methods as much as possible
with their well-accepted methods.
Harmonisation with economic impact assessment
The assessment of the environmental impacts and benefits of a nitrogen oxide emission control area in the North Sea as presented in this report has been developed and harmonised with the assessment of the economic impacts and costs by the Danish Environmental Protection Agency (2012).
Consortium
The assessment presented in this report was conducted by a consortium consisting of the PBL Netherlands Environmental Assessment Agency, the UK Ecometrics Research and Consulting, the European Monitoring and Evaluation Programme (EMEP) hosted by the Norwegian Meteorological Institute, the Dutch National Institute for Public Health and the Environment and the Dutch DCMR Environmental Protection Agency Rijnmond.
Emission inventories, baseline and
scenarios
Busy shipping lanes in 2009 caused relatively high
emissions along North Sea shores
The North Sea, including the English Channel, is one of the busiest seas in the world. The traffic intensity is particularly high in the southern section. Every day, 400 commercial vessels pass through the busiest seaway in the world, the Strait of Dover. The port of Rotterdam is
Figure 2
Container ships Chemical/LNG tankers Oil tankers RoRo Cargo ships General dry cargo carriers Bulk carriers Passenger ships Reefers Miscellaneous Tug and supply boats Total
0 100 200 300 400 500
thousand tonnes
On the North Sea
Manoeuvring / sailing in and out of ports At berth
Nitrogen oxide emissions over the North Sea, per type of vessel, 2009
FMI compare reasonably well for 2009, but that the estimates for installed auxiliary engine power and fuel use and associated nitrogen oxide emissions differ substantially (by 38%; see Section 2.1). Since all experts at MARIN, TNO and FMI agree that these estimates are rather uncertain, we decided to include this uncertainty in a sensitivity analysis, summarised below and described in detail in Section 5.1. Another comparison was made with an inventory by the International Institute of Applied Systems Analysis (IIASA) that is currently widely used in European air policy studies (Wagner et al., 2010; Cofala et al., 2007). The comparison with the IIASA inventory showed that their nitrogen oxide emissions at sea are higher, mainly because of overestimated sailing speeds and higher growth assumptions.
Our emission baseline was based on the above emission inventory of shipping activities in 2009 (Chapter 2; MARIN, 2011a, b) and a number of assumptions (Table 1). Most of these assumptions were based on the Second IMO Greenhouse Gas Study (Buhaug et al., 2009). The year 2030 was chosen as the target year for our baseline mainly because the best available emission baselines for land-based emission sources also have 2030 as their target year. This allows for a sound assessment of the impacts of a nitrogen emission control area on the projected air quality in 2030 in the North Sea region. Nitrogen oxide emissions on land will halve by 2030, whereas emissions on the North Sea will decrease only slightly
Based on the above emission inventory and assumptions, we calculated baseline emission growth from 2009 to 2030 for North Sea shipping (see Section 2.2). The baseline for land-based emissions was taken from the Primes 2009 scenario (Capros et al., 2008; CIAM, 2011a). The land scenario estimates that most of the air polluting emissions in the countries surrounding the North Sea decrease substantially, with the exception of ammonia (Figure 3). In the North Sea, sulphur and particulate
matter emissions are expected to decrease due to the use of cleaner fuels as enforced in the sulphur emission control area. Despite a moderate growth in shipping transport, we estimate that nitrogen oxide emissions decrease slightly between 2009 and the 2030 baseline. This is caused by the assumed efficiency improvements, the Tier II nitrogen oxide emission standards for ships and the higher assumed use of LNG as a clean fuel.
Policy scenarios for a nitrogen emission control
area and contributions from shipping
Our main scenario is the nitrogen emission control area scenario (NECA), which simulates compliance with the IMO regulations in 2030 when only the new ships built after 2015 must meet the Tier III nitrogen oxide emission standards. A second scenario simulates a maximum feasible reduction at sea (MFR) where all the ships meet the Tier III emission standards in 2030. This scenario was only created to outline the long-term potential
improvements in air quality, health and ecosystem impacts when all ships are equipped with the strictest nitrogen control measures. This MFR scenario was therefore not included in the cost-benefit analysis. The NECA and MFR scenarios reduce nitrogen oxide emissions by 129 and 300 thousand tonnes respectively in 2030 (a respective 30% and 67% reduction relative to the baseline).
The total contribution of air polluting emissions from North Sea shipping to air quality and deposition in 2030 was determined using two cases. In the first case, only nitrogen oxide emissions from North Sea shipping were set to zero. The other air polluting emissions on land and in other sea areas in 2030 were not changed in the air quality modelling. In the second case, all air polluting emissions from North Sea shipping were set to zero (nitrogen oxide, sulphur dioxide, particulate matter, carbon monoxide and volatile organic compounds). Again, air polluting emissions on land and in other sea areas were not changed.
Table 1
Central assumptions in this assessment
Parameter Assumptions
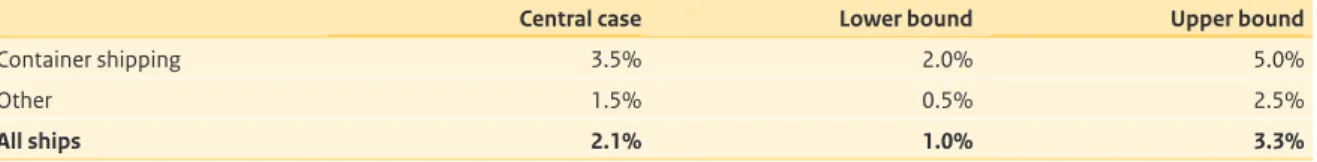
Growth in shipping 2009–2030 2.1%/year average (3.5% container ships, 1.5% other ship types)
Efficiency improvements 2009–2030 0.96%/year (through efficiency of scale, speed reductions and technological and
operational improvements)
Share of LNG in 2030 25% in coastal shipping, 10% in oil, chemical and gas tankers
Shore-side electricity applied to 5% of ships at berth
Emission standards current IMO and EU legislation
Price year / discount rate 2012 euros, discount rate is 4%
11
Findings |
Air quality, health and ecosystem
impacts
Contributions from shipping vary by impact and
distance to the North Sea and also depend on other
contributing sectors
Based on the two ‘contribution cases’ as described above, we determined that nitrogen oxide emissions from ships are responsible, via atmospheric nitrate formation, for between one and five per cent of country-average particulate matter concentrations (PM2.5) in 2030 (see Table 2 and Section 3.1). This contribution is significant in for example the Netherlands, where sectors such as road transport and industry make similar contributions in 2030 (Velders et al., 2012). The relative contributions to the estimated health effects (loss of life expectancy expressed as Years of Life Lost – YOLL) via exposure to PM2.5 are somewhat larger (see Section 3.2). This indicates the presence of higher population densities near the North Sea.
The absolute contribution of nitrogen oxide emissions from North Sea shipping to the loss of life expectancy in Europe (via PM2.5) is estimated at about 18 300 years. A nitrogen emission control area would prevent about 4 870 years of life lost in Europe in 2030. This amounts to 0.9% of the total life years lost in the North Sea coastal countries in 2030 (about 0.5 million years), and 0.5% of the total years of life lost in Europe (about 1 million years). These reductions would double after 2040, when all ships comply with the requirements of a nitrogen emission
control area while assuming that other emissions sources in Europe do not change. An outline of such long-term health benefits in the MFR scenario is shown in Figure 4. Particulate matter is currently estimated to be associated with the highest disease burden in Western Europe, followed by second-hand smoke, traffic noise and radon (Hänninen O. and Knol A. (eds.), 2011).
Based on the two ‘contribution cases’ as described above, we determined that North Sea shipping contributes up to 25% of the nitrogen dioxide concentrations in certain coastal areas close to busy shipping lanes (see Section 3.1 and Figure 5). Contributions to country-average
concentrations range from 7% to 24% in the North Sea coastal countries. Contributions to nitrogen deposition range from 2% to 5% (see Section 3.1). The contribution to nitrogen deposition above the critical load for
eutrophication in ecosystems is a little higher (see Section 3.3), which indicates the relative higher contribution to ecosystems in the vicinity of the North Sea. Large parts of Europe are expected to face nitrogen depositions above the critical loads of ecosystems for nitrogen in 2030 (Figure 6). The largest reductions in an MFR scenario are seen east of the major shipping lanes.
Figure 3 2009 2030 2009 2030 2009 2030 2009 2030 2009 2030 0 1000 2000 3000 4000 5000 thousand tonnes
North Sea shipping Coastal countries
Air pollutant emissions in the North Sea and the coastal countries, 2009 and 2030 baseline
NOx SO2 VOC NH3 PM2.5
A nitrogen emission control area in the North Sea in 2030 would reduce all the contributions mentioned in Table 2 by about one third. An MFR scenario would reduce the contributions by two thirds.
Nitrogen oxide emissions from North Sea shipping also contribute to higher ozone concentrations. The contribution of North Sea shipping in 2030 to a health-related and a crop-health-related ozone indicator is 4% and 11% respectively (see Section 3.1). Due to the non-linearity of atmospheric ozone formation, a nitrogen emission
control area does not lead to a one-third reduction in the total contribution in 2030, but less.
Small contribution of a nitrogen emission control
area to short-term eutrophication targets in North
Sea
Eutrophication still posed a threat to North Sea ecosystems in coastal areas and a number of more distant offshore locations in 2009 (see Section 3.4). It has resulted in a range of undesirable disturbances in the
Figure 4
Potential reduction in years of life lost under MFR scenario, 2030
Reduction in years of life lost 0 0 – 10 10 – 20 20 – 40 40 – 334 Absolute reductions
13
Findings |
marine ecosystem, including shifts in the composition of flora and fauna, which affects habitats and biodiversity, as well as oxygen depletion, which causes the death of fish and other species. Within the framework of the OSPAR Commission and the European Union, the North Sea countries aim to solve these eutrophication problems before 2020. These countries are therefore developing
policies or support measures to reduce both riverine and atmospheric inputs of nitrogen to North Sea waters. In 2009, rivers and direct tributaries discharged 814 thousand tonnes of nitrogen into the North Sea and atmospheric deposition contributed about 350 thousand tonnes in the same year. The total atmospheric
Table 2
Contributions of nitrogen oxide emissions from North Sea shipping to air quality and impacts in the 2030 baseline (derived using the contribution cases)
Country Particulate matter
(PM2.5)
Health effects by
PM2.5 (years of life
lost)
Nitrogen dioxide Nitrogen
deposition Nitrogen deposition above critical loads % Belgium 3.4 3.7 15.4 3.2 11.2 Denmark 3.3 3.4 18.5 4.1 11.4 France 2.0 2.2 8.1 1.4 5.0 Germany 2.1 2.2 7.3 1.9 7.0 Netherlands 5.2 6.1 24.1 3.2 8.4 Norway 1.3 2.2 13.1 4.8 42.1 Sweden 1.1 1.5 8.9 3.5 16.0 United Kingdom 4.4 5.5 17.3 3.2 21.4 Average 2.4 3.3 11.4 2.3 6.7
Source: PBL (based on NMI-EMEP calculations)
Figure 5 Concentration (µg/m3) ≤ 2 2 – 4 4 – 6 6 – 8 > 8 Baseline Contribution (%) ≤ 10 10 – 15 15 – 20 20 – 25 > 25
Contribution of NOx from shipping to NO2
Average annual nitrogen dioxide concentrations, 2030
deposition in 2030 is estimated to decrease to about 286 thousand tonnes. North Sea shipping will contribute 6% (16 thousand tonnes) to this deposition. This contribution can be reduced by an emission control area in 2030 by about one third. The contribution of an emission control area is much more limited in the period up to 2020 due to the slow replacement of current ships with new and cleaner ships.
Costs and benefits
Health benefits are largely determined by reduced
particulate matter impacts
The total health benefits of a nitrogen emission control area were estimated at 484 million euros (2012 euros) with a range of 380 million to 954 million euros (see Section 4.1). These benefits may also be expressed in kilograms of reduced nitrogen oxide and amount to 3.9 euros per kilogram of reduced nitrogen oxide, with an uncertainty range of about 0.2 euros per kilogram (± 6%). Nearly 98% of the health benefits were related to mortality (69%) and morbidity (29%) caused by exposure to particulate matter, and 2% were related to ozone. Of
the total benefits, 85% are seen in the North Sea coastal countries and 15% in other European countries.
The monetisation of health impacts from a nitrogen emission control area covers the:
• costs of pain, suffering, aversion to the risk of ill health or premature death;
• costs of medication and medical care; • costs of lost productivity.
The main form of health damage in air pollution assessments, when impacts are converted to their monetary equivalent, concerns effects on mortality. This parameter was valued as the loss of life expectancy that results, using the value of a life year (VOLY). To reflect the importance of this element of the analysis, we performed a sensitivity analysis exploring the consequences of different positions for mortality valuation. We applied the European average value of 67,146 euros for the value of a life year (mortality), with a range of 47,120 to 156,674 euros. A sensitivity analysis based on a different valuation approach (Value of a Statistical Life – VSL) is reported briefly in Section 4.1 and summarised in the benefit to cost comparison and figures.
Figure 6
Exceedance of critical loads (mol/ha) No exceedance ≤ 100 100 – 200 200 – 300 300 – 500 > 500 Baseline Reduction (mol/ha) ≤ 1 1 – 10 10 – 20 20 – 40 30 – 40 > 40
Potential reduction under MFR scenario
Average annual accumulated excess deposition of nitrogen loads, 2030
15
Findings |
Ecosystem benefits not monetised
The monetary benefits of reduced terrestrial and marine ecosystem impacts and reduced impacts on crops due to a nitrogen emission control area were not, or only tentatively, estimated since sound methods and necessary data were lacking. However, it is clear from several studies that crops are affected and that people in the North Sea coastal countries are willing to pay for improved ecosystems. Nature areas on land are being restored and measures are being taken to reduce marine pollution and clean the seas. The lack of a proper quantification leads to a bias towards underestimation of the total benefits.
The costs of a nitrogen emission control area
The total costs of a nitrogen emission control area were estimated at 282 million euros for 2030, with a range from 127 million to 389 million euros, based on a low and high cost estimate (Danish EPA, 2012). The
cost-effectiveness was estimated at 1.9 euros per kilogram of reduced nitrogen oxide, with a range of 0.8 to 2.6 euros per kilogram, based on a low and high cost estimate. The above costs of a nitrogen emission control area in 2030 were calculated by the Danish EPA based on a future fleet age profile that was derived from specific ship age
data for the North Sea in 2010. In this assessment study, we derived the future fleet age profile for container ships and other ship types by 2030 from current global ship data. This resulted in a somewhat older fleet age for this assessment, and therefore a somewhat smaller
proportion of ships that must meet the nitrogen emission control area requirements by 2030 (see Section 2.2). A smaller share of Tier III compliant ships in 2030 would lead to a smaller reduction in nitrogen oxide emissions (about 16%), to lower nitrogen oxide abatement costs (about 16%), but also to a almost linear decrease in health benefits (also about 16%) (see Sections 4.4 and 5.1). We therefore found that the benefit to cost ratio and the cost-effectiveness of a nitrogen emission control area do not change significantly under these different fleet age profile assumptions. Only the absolute costs and benefits would change under different fleet age profile
assumptions for 2030 by about 16%. To compare the benefits and costs in this assessment we adjusted the above cost estimates of the Danish EPA downwards to account for the effect of the older fleet age profile used in this study. Vice versa, the benefits found in this study were adjusted upwards to account for the effect of the younger fleet age profile used in the Danish EPA study (see Section 4.1).
Figure 7
VSL
valuation valuationVOLY Costs 0 400 800 1200 1600 2000 million euros
Mid (best) values Benefits Costs
Younger fleet age profile
Costs and benefits of a nitrogen emission control area in the North Sea, 2030
VSL
valuation valuationVOLY Costs 0 400 800 1200 1600 2000 million euros
Range in cost–benefit estimates
Older fleet age profile
The benefits of a nitrogen emission control area
exceed the costs
The monetised health benefits were compared with the costs of a nitrogen emission control area, while accounting for the applied ranges in the valuation of health impacts and the upper and lower range in cost estimates (see Section 4.5). Moreover, the impact of a relatively older or younger fleet on the benefits and costs is shown for 2030.
The benefits and costs show that the introduction of a nitrogen emission control area in the North Sea from 2016 onwards would be cost-effective as it would lead to net benefits by 2030 for Europe (Figure 7). These benefits would exceed the costs by a factor of two, based on an estimate towards the lower end of the range adopted here for mortality valuation (middle VOLY value) and a middle value for costs. The cost-benefit test is also passed in the least favourable situation (a factor of 1.1), with a low value attributed to health impacts and a high cost estimate. Much higher benefit-to-cost ratios were found in the most favourable situation, with a high value (VSL value) attributed to health impacts and a low cost estimate. The benefit-to-cost ratios do not change for a
relatively older or younger fleet in 2030, only the absolute benefits and costs differ by about 16%. The above benefit estimates exclude benefits for ecosystems and crops.
Sea-based versus land-based air quality
measures
Nitrogen oxide emission control at sea more
cost-effective in the longer term
The costs and benefits and the cost-effectiveness of the nitrogen emission control area by 2030 could only be compared with those of recent European air policy scenarios with land-based emissions control measures for 2020 (see Section 4.6). These policy scenarios for land target not only nitrogen oxide reductions but also ammonia, particulate matter, sulphur dioxide and non-methane volatile organic compounds. The different target years and different pollutant control measures compel us to some caution with regard to drawing conclusions from the comparison. The European air policy scenarios on land emissions were recently explored in the context of the revision of the Gothenburg Protocol (GP) under the UNECE Convention on Long-Range
Figure 8 0 10 20 30 40 Ratio
Maximum Feasible Reduction (MFRL) in land emissions High*
Mid Low
Nitrogen Emission Control Area (NECA)
Benefit – cost ratio
Comparison between air quality policy ambitions in the eight North Sea countries and for the North Sea
Ambition land emissions 2020 Ambition sea emissions 2030 0 2 4 6 8 10 12 euro/kg NOx
Cost per unit reduced emission
Ambition land emissions 2020 Ambition sea emissions 2030
17
Findings |
Transboundary Air Pollution (CLRTAP). The ambition levels of the land-based policy scenarios, aiming to improve health and ecosystem impacts by 2020, were positioned between the baseline, assuming current air policies, and the maximum feasible technical reduction (MFRL) from land-based sources. The ambition levels were indicated as low, medium and high.
The comparison of costs and health benefits between a nitrogen emission control area and additional land-based emission control measures indicates that there is still a substantial potential for land-based emission control measures that yield higher health benefits on land at lower costs (Figure 8, left). In particular, such land-based emission control measures include ammonia measures in agriculture, a limited number of relatively cheap nitrogen oxide measures in industry and some particulate matter measures in industry and agriculture. The low and medium ambitions for land-based emission control measures reduce the total years of life lost in the North Sea coastal countries in the short term (2020) by approximately 5 and 11 per cent respectively. As shown above, a nitrogen emission control area would reduce the total years of life lost due to air pollution in the North Sea coastal countries by almost one per cent by 2030, and even further in subsequent years.
A comparison of cost-effectiveness indicated that, if air policy aims to simultaneously abate eutrophication, acidification, ozone and health impacts, nitrogen control at sea is about as cost-effective1 as nitrogen control in a
medium air quality ambition for stationary land-based
sources (Figure 8, right). This implies that a nitrogen emission control area fits a medium ambition for air quality improvement in Europe in addition to current legislation, or any higher ambition. A low ambition for air quality improvement would probably not include a nitrogen emission control area if cost-effectiveness was the only criteria.
Another comparison shows that a nitrogen emission control area in the North Sea provides a larger potential for relatively cheap1 nitrogen oxide reduction in the longer
term (2035–2045) if more and more old ships are gradually replaced with new ships with strict nitrogen control measures (Figure 9). The sooner a nitrogen emission control area is designated in the North Sea, the larger the reduction would be in subsequent years. The potential for relatively cheap1 nitrogen oxide reductions by land-based
control measures in the North Sea coastal countries is estimated to be more limited in the longer term. A last comparison of the costs per unit nitrogen oxide reduction between specific land and sea-based control technologies shows that a number of mandatory technologies at existing and new land-based sources (in power production and traffic) are already more expensive than the technologies needed on ships in a nitrogen emission control area (see Section 4.6). Examples of the more expensive technologies are selective catalytic reduction at power plants fuelled by gas, biomass or heavy fuel oil, or nitrogen oxide abatement in Euro-6 diesel passenger cars.
Figure 9 0 50 100 150 200 250 300
thousand tonnes per year
On land
Nitrogen Emission Control Area (NECA)
Potential nitrogen oxide reductions on land and at sea, applying an equal cost-effectiveness (1.9 euro/kg)
2020 to 2030 Potential for land emissions
In
2030 Beyond2040 Potential for sea emissions
Such more expensive land-based control measures could be defended for those emission sources that are closer to densely populated areas and ecosystems than shipping lanes. However, one could question the logic of more expensive land-based emission control measures for large-scale point sources that have high stacks and are located close to the shore and to shipping lanes. The above indicates that the air policies in the EU are not always designed in the most cost-optimal way. This is because other elements also play a role in policy development, such as a level playing field for land-based sources, the availability of technologies for sources on land and at sea, political support or the legal mandate of the various governments or intergovernmental
organisations involved.
Uncertainties
Uncertainties in emission inventories and
projections do not change the outcome of the
cost-benefit analysis
This study examined the extent to which a number of identified uncertainties could change the outcome of the cost-benefit analysis (Chapter 5). Some of the identified uncertainties are described comprehensively in Chapter 2 and comprise uncertainties of 2009 emission inventories, auxiliary engine power estimates and related fuel use, younger or older fleet age profiles, higher or lower growth rates and efficiency improvements, and larger or smaller shares of LNG fuel use in 2030. All of these uncertainties can increase or decrease the nitrogen oxide reductions resulting from a nitrogen emission control area in the North Sea, while recognising that such a change would also result in an increase or decrease in abatement costs.
The important question now is whether a lower (or higher) projected nitrogen oxide reduction due to a nitrogen emission control area results in a linear decrease (or increase) in the monetised health benefits. Based on various baselines and nitrogen oxide reductions due to a nitrogen emission control area, we computed the resulting impacts on the health benefits. These results show that the relation between nitrogen oxide reductions at sea and health benefits on land is close to linear for a large number of these uncertainties (see Section 5.1). If nitrogen oxide reductions were to increase, benefits would increase, and vice versa. The maximum difference found in the relation was about 12%.
Under the fair assumption that a change in emission reductions at sea is linearly related to a change in costs, we find that the relation between the cost of nitrogen oxide abatement in the North Sea and the associated
health benefits is close to linear. This means that the benefit to cost ratio of a nitrogen emission control area does not change significantly due to the above
uncertainties. Only absolute costs and absolute benefits would increase at the same rate, for instance, as a result of a larger amount of installed auxiliary engine power or a larger share of cleaner ships in 2030.
Health benefits sensitive to assumptions on
harmfulness of particulate matter and ozone
The above estimated health benefits are sensitive to the assumption that all particles, irrespective of source and chemical composition, are equally harmful (see Section 5.4). This assumption is currently advised by the World Health Organisation and accepted by the European Commission, and is central in European policy
assessments. However, there are indications that some carbonaceous particles are more harmful than nitrate particles from nitrogen oxide emissions (from shipping and other sources). This could reduce the
cost-effectiveness of nitrogen oxide measures compared with other measures. On the other hand, there are also indications that long-term exposure to low ozone concentrations is more harmful to human health than previously thought. In this situation, nitrogen oxide, as an ozone precursor, might become more important.
Health benefits in this study less sensitive to model
resolution
The above estimated health benefits due to a nitrogen emission control area were found to be rather insensitive to the resolution of the air quality modelling (see Sections 3.1 and 5.2). A nitrogen emission control area contributes to less particulate matter through reduced secondary particulate matter. In contrast to primary particles, which are directly emitted by sources, secondary particles are formed by the chemical transformation of certain pollutants in the atmosphere. For instance, a part of the nitrogen oxide emissions from ships will be transformed into particulate nitrate (NO3-). Reductions in particulate nitrate explain how a nitrogen emission control area contributes to less particulate matter. Particulate nitrate has a relatively long lifetime in the atmosphere, which causes a relatively flat spatial distribution. This implies that a higher model resolution does not bring much more detail into the assessment of the impacts of a nitrogen emission control area on secondary particulate matter concentrations. This also means that the health impacts and benefits due to reduced human exposure to secondary particulate matter are relatively insensitive to a lower or higher model grid resolution.
On the contrary, the modelled nitrogen dioxide
concentrations and nitrogen deposition were found to be rather sensitive to the model resolution. This means that
19
Findings |
a higher model resolution would provide a better picture in coastal areas and beyond of the reduced impacts due to a nitrogen emission control area.
Note
21 Findings |
Full r
Esul
ts
Full r
Esul
ts
ONE
Introduction
1.1 Policy context
In the last five years, concerns about health and ecosystem effects due to air polluting emissions1 from
ships have magnified international policy debate regarding further emission control. The debate is taking place within a context where emission and fuel standards for international shipping lag behind those of land-based transport modes. As an outcome of the debate, the International Maritime Organisation (IMO) adopted more stringent requirements to further control air pollution from sea shipping in 2008 (IMO, 2008). The requirements apply to the sulphur content of fuels and maximum allowable emissions of nitrogen oxides. Particulate matter emissions are mostly co-reduced through the use of cleaner fuels containing less sulphur. The most stringent requirements for sulphur dioxide and nitrogen oxide are only mandatory in emission control areas (ECA). An ECA is an area where special mandatory measures apply that aim to reduce the exposure of sensitive ecosystems or urban areas to air pollution from international shipping.
Within Europe, the Baltic Sea and the North Sea (including the English Channel) were designated as sulphur oxide emission control areas (SECA) in 2006 and 2007, respectively. Since 2010, the coastal countries of the Baltic Sea have been involved in a decision-making process over an application to the IMO to designate the Baltic Sea as a nitrogen emission control area (NECA) (HELCOM, 2010a). The Baltic countries have invited the
North Sea countries to consider establishing a NECA in the North Sea, as well. This would reduce air pollution in the Baltic Sea region and enhance the level playing field for ship owners and operators in European waters. In March 2011, the coastal countries of the North Sea commissioned an environmental impact assessment (this report) and an economic impact assessment (Danish EPA, 2012). These studies are aimed to support a possible decision-making process in the North Sea countries concerning an application to the IMO to designate the North Sea (including the English Channel) as a nitrogen emission control area. The coastal countries of the North Sea are France, Belgium, the Netherlands, Germany, Denmark, Sweden, Norway and the United Kingdom. The information from the above assessments is also valuable for the Oslo–Paris Commission for the Protection of the Marine Environment of the North-East Atlantic (OSPAR) and the European Union. In September 2010, the OSPAR Commission called for an assessment of the contribution of a nitrogen emission control area to the eutrophication status of the North Sea (OSPAR, 2010). One of the objectives of the OSPAR Commission is to achieve and/or maintain the status of ‘non-problem area’ with regard to eutrophication, for all parts of the OSPAR maritime area, by 2020. The European Union’s Marine Directive has a similar goal, stating that human-induced eutrophication should be minimised before 2020, particularly regarding the adverse effects this has on the marine environment.
23
Introduction |
ONE ONE
Another relevant policy development in the context of this assessment is the recent adoption by the IMO of a package of mandatory technical and operational measures to reduce greenhouse gas (GHG) emissions from international shipping (IMO, 2011). These measures aim to improve the energy effi ciency of marine transport, thus reducing fuel consumption which, in turn, yields the co-benefi ts of reducing emissions of local and regional air pollutants. Such measures also lead to cost reductions for ships in emission control areas.
The above developments have the interest of and are supported by the European Commission (EC), which has a limited jurisdiction to impose emission control measures on ships in the territorial waters of the Member States, ports and open seas. Emission control measures for
land-based sources in Europe are regulated in a number of European Union (EU) directives and United Nations Economic Commission for Europe (UNECE) protocols. A relevant policy development in this context is the current revision of the national air pollutant emissions ceilings under the UNECE Gothenburg Protocol (GP) and the announced revision of the EU National Emission Ceilings Directive (NECD) in 2013. The revision of the GP aims to set national emission reduction obligations for air pollutants by 2020 relative to 2005. It is not clear yet whether the revision of the NECD in 2013 will aim to set such reduction obligations for the year 2020 or later (2025 or 2030). Results from the cost–benefi t analysis of land-based emission control measures carried out for the GP revision are used here to indicate how the costs and benefi ts of a nitrogen emission control area in the North
23
Introduction |
Figure 1.1
Overview of the applied method in this assessment
Emission inventory 2009, emission baseline projection 2030 and policy scenarios 2030
Comparison of costs and benefits NECA North Sea
Comparison of costs and benefits from land-based controls in the North Sea countries (CIAM 2011; Holland et al., 2011)
Air polluting emissions North Sea
Dispersion modelling
Air quality and depositions of nitrogen and acid compounds
Exposure
People, ecosystems, crops
Benefits
Health benefits, damage costs
Costs
Total costs of a NECA at the North Sea from the economic
impact assessment (Danish EPA, 2012)
Reduced impacts
Health loss due to particulate matter and ozone, exceedance of critical
loads of accidification and eutrophication, eutrophication status
North Sea waters
ONE
Sea compare (CIAM, 2011a; Holland et al., 2011). The results of this study might therefore be useful as background material within the comprehensive review of European air policy by the EC that started in 2011 and should be finalised by 2013.
Finally, there has been a recent development outside Europe that is relevant to the above policy process of the eight North Sea countries. On 1 August 2011, an emission control area for sulphur dioxide and nitrogen oxide entered into force around the United States and Canada. The North American ECA will become active on 1 August 2012. Moreover, the United States has also submitted a proposal to the IMO to designate an area off the coasts of Puerto Rico and the US Virgin Islands as an ECA for nitrogen oxides and sulphur dioxide.
1.2 Objectives
The following objectives of this assessment of
environmental impacts and health benefits were based on the IMO criteria for designation of an emission control area (Annex 1):
• estimate the contribution of North Sea shipping to air pollution in the coastal countries and beyond, and to nitrogen deposition to the North Sea waters;
• assess the environmental impacts and health benefits of introducing a nitrogen oxide emission control area in the North Sea;
• compare the benefits of a nitrogen oxide emission control area in the North Sea with the costs, as presented by the economic impact assessment (Danish EPA, 2012);
• compare the cost-effectiveness of a nitrogen oxide emission control area with land-based emission control measures.
1.3 Method
The integrated assessment method applied in this study is as much as possible aligned with the method used in recent integrated assessment studies that support the EU air policy developments (CIAM, 2011a, b; Holland et al., 2008, 2011) (Figure 1.1). The starting point here was an existing emission inventory for shipping activities on the open sea in 2009, complemented with data on port emissions. Based on this inventory, an emission baseline for 2030 and a number of nitrogen emission control scenarios for the North Sea were developed. Emission data on 2009 and projections for 2030 for land-based sources were taken from other recent integrated assessment studies (CIAM, 2011a; IIASA, 2011). Dispersion modelling of air polluting emissions subsequently was
carried out to calculate changes in air quality and pollutant depositions. The modelling results were combined with maps for populations and ecosystems and dose–response relationships to derive impacts on health and ecosystem indicators. The impacts from air pollution on years of life lost, morbidity and damage to crops were monetised. Last but not least, the costs and benefits of the nitrogen emission control area were compared with the costs and benefits of air policy packages for land-based sources.
1.4 Reader
Chapter 2 discusses the emission inventory used in this study and describes how we derived the emission baselines for North Sea shipping and the policy scenarios for a nitrogen emission control area. It also presents the comparison between air polluting emissions at sea and on land. Chapter 3 presents the results from air quality modelling and impacts on health and marine and terrestrial ecosystems. Chapter 4 details the monetised health benefits of a nitrogen emission control area and presents information on benefits to crops and
ecosystems. A summary is given of the cost estimates for a nitrogen emission control area from the economic impact assessment by the Danish EPA (2012).
Subsequently, the cost-benefit analysis is presented. The costs and benefits at sea are compared with those of land-based air policy packages. Finally, Chapter 5 presents a discussion and summary of the uncertainties.
Note
1 Sulphur dioxide, particulate matter, nitrogen oxides and
TWO
Emission inventory,
baseline and scenarios
This chapter explains the emission inventory developed and validated for carbon dioxide and air polluting emissions. It describes the main assumptions that were used to derive the emission baselines for North Sea shipping considering current air policies only and the policy scenarios for a nitrogen emission control area. The baseline for land-based air polluting emissions is also discussed and compared with emissions at sea.
2.1 Emissions from North Sea
shipping in 2009
The emission inventory for 2009 is based on the activities of international shipping in the North Sea (including the English Channel) and in ports. The inventory is provided by the Maritime Research Institute Netherlands (MARIN) and the emission factors by TNO (MARIN, 2011a, b), see Figure 2.1. These data include the number of kilometres travelled, sailing speeds and shipping routes, determined for 12 different ship types and 8 different ship size classes. The main data sources for these activities are monitoring data from the Automatic Identification System (AIS) for 2008 and 2009, traffic data from the Lloyds Marine Intelligence Unit (LMIU) for 2008 and ship characteristics from the Lloyds List Group (LLG) database of October 2010.
The AIS system is the preferred source for this type of study since it provides detailed information on shipping
activities, such as ship name, IMO number, ship type, ship size, real-time position and course, speed and destination. However, MARIN only has access to AIS data on the Dutch part of the North Sea. The necessary activity data for the rest of the North Sea was therefore generated from LMIU data and the MARIN SAMSON ship traffic model (MARIN, 2011a). This model generates spatial activity data for the various ship types and sizes using LMIU data as input. LMIU data provide spatial and temporal information on port arrivals and departures. The incomplete LMIU data on ferries that cross North Sea waters more than once a day were supplemented with ferry data from the EU Marnis project (Marnis, 2008). A correction for ship type and size class was made for the change in activity between the year for which the LMIU data were available and the year of study. As well as ship activities, emission factors are also needed to calculate emissions of carbon dioxide and air pollutants from ships on the North Sea and in ports.
Emission factors for carbon dioxide and air pollutants have been determined by the Netherlands Organisation for Applied Scientific Research (TNO) for main and auxiliary engines (Annex 1 in MARIN, 2011a). The main engine propels a ship, whereas auxiliary engines provide the electrical power or heat to the ship’s systems. Emission factors depend on variables, such as engine power, engine load, year of construction of the engine, engine type, engine speed and the type of fuel used. Emission factors for each air pollutant are determined for the main and auxiliary engines of ships in the ship
27
Emission inventory, baseline and scenarios |
TWO TWO
characteristics LLG database. The scarce data on auxiliary engines in the database are supplemented with additional estimates based on empirical relationships between auxiliary and main engine power for the various ship types and sizes (Buhaug et al., 2009).
In addition to ship emissions on the open sea, emissions in ports from manoeuvring and while at berth have been estimated by MARIN using the aforementioned data sources and information or assumptions on the time at berth (MARIN, 2011b). When berthed, a ship’s main engine is stopped although the auxiliary engines are generally kept in service. The use of shore-side electricity instead of auxiliary engines was limited in 2009 to a small number of North Sea ports.
The complete emission inventory for 2009 for the North Sea and its ports includes emissions of carbon dioxide and air pollutants and their spatial distribution for 12 ship types and 8 size classes. The spatial resolution of the inventory at sea is 5x5 km2 and within ports 0.5 x 0.5 km2. The most concentrated shipping lanes with the highest nitrogen oxide emissions are located in the English Channel and in front of the coasts of Belgium and the Netherlands (Figure 2.1). Total nitrogen oxide emissions are estimated at 472 thousand tonnes in 2009 (Figure 2.2). It is estimated that 32% of the total ship emissions are released within 12 nautical miles of the shore, 89% within 50 nautical miles and 97% within 100 nautical miles. Almost 90% of the nitrogen oxide emissions take place at open sea and 10% in ports. Container ships are
Figure 2.1
Nitrogen oxide emissions projected for the North Sea, 2030
Nitrogen oxide emissions (tonnes per grid cell of 5x5 km2) ≤ 0.05 0.05 – 0.1 0.1 – 0.25 0.25 – 0.5 0.5 – 1 1 – 2.5 2.5 – 5 5 – 10 10 – 25 25 – 100 > 100
North Sea boundaries
TWO
the largest single ship type contributor (30%) to the nitrogen oxide emissions in the North Sea and in ports. Rotterdam is the port with the highest nitrogen oxide emissions by ships at berth in 2009 (Figure 2.3). The total emissions of other air pollutants are given in Annex 3.
Validation of the MARIN emission inventory with
other sources
The activity and emission inventory from MARIN has been validated in a number of comparisons with other
data sources and studies. These comparisons support the usability of the MARIN inventory in this study but also highlight the need for an uncertainty analysis with regard to emissions from auxiliary engines.
In MARIN (2010), results from the SAMSON model for 2008 were compared with AIS monitoring data for the Dutch part of the North Sea. This comparison showed good agreement for emissions with differences of only a few per cent. However, the SAMSON model
Figure 2.2
Container ships Chemical/LNG tankers Oil tankers RoRo Cargo ships General dry cargo carriers Bulk carriers Passenger ships Reefers Miscellaneous Tug and supply boats Total
0 100 200 300 400 500
thousand tonnes
On the North Sea
Manoeuvring / sailing in and out of ports At berth
Nitrogen oxide emissions over the North Sea, per type of vessel, 2009
Source: PBL (based on MARIN 2011b)
Figure 2.3 Rotterdam Antwerp Hamburg Amsterdam Le Havre Bremerhaven Zeebrugge Immingham Southampton Mongstad Other ports 0 2 4 6 8 10 12 thousand tonnes
Nitrogen oxide emissions from vessels at berth in North Sea ports, 2009
29
Emission inventory, baseline and scenarios |
TWO TWO
underestimated the number of smaller ships (pilot tenders, tugs, service vessels, dredgers) by more than 5%. The reason for this is the absence of these non-route bound ships in the LMIU data that is used as input for the SAMSON model. The effect on total emissions was found to be negligible.
The MARIN inventory for 2009 has also been validated. This inventory is based on their 2008 inventory and adjusted for changes in traffic volume and behaviour between 2008 and 2009. These changes were extracted from AIS monitoring data for the Dutch part of the North Sea. This assumes that the monitored traffic changes in the Dutch part of the North Sea are representative for the whole of the North Sea. This assumption could be validated using another recent inventory by the Finnish Meteorological Institute (FMI) that had AIS data for 2009 covering most of the North Sea (FMI, 2011). For instance, the total travelled distances in the North Sea compare reasonably well for the main ship types aggregated over all the size classes (Figure 2.4). The comparison confirmed the above finding that the SAMSON model
underestimates the number of smaller ships. The ship activities from the FMI inventory are used as a base for the cost calculations in the economic impact assessment (Danish EPA, 2012) for the nitrogen oxide emission control area. The FMI inventory was created using the FMI Steam model (Jalkanen et al., 2009, 2011).
Although the estimated travelled kilometres were similar, there was a substantial difference in the estimates of total nitrogen oxide emissions from the North Sea over
2009. The FMI estimate (652 thousand tonnes) was 38% higher than the MARIN estimate (472 thousand tonnes). The main explanation was found in the different methodologies that were applied to supplement the scarce data on auxiliary engine power in the ship characteristics database. MARIN applied the
aforementioned methodology of Buhaug et al. (2009), whereas FMI applied a detailed estimate of auxiliary engine power profiles per ship type and per operation mode as described in Jalkanen et al. (2009, 2011). The FMI methodology results in a fuel use for auxiliary engines in North Sea shipping that is roughly two times more than the fuel use estimated using the MARIN methodology. Since all experts at MARIN, TNO and FMI recognise that inventories on auxiliary engines are rather uncertain, the impact of this uncertainty on the final outcome of this study is analysed in Chapter 5.
In MARIN (2011b), a further comparison is made with other inventories and in more detail with the widely applied IIASA emission inventory for international shipping in EU seas (Cofala et al., 2007; Wagner et al., 2010). The IIASA inventory is an adjusted version based on earlier work by Entec (2002, 2005). The IIASA–Entec inventories have been used for several years now; for example, in major European air policy studies for the EC. Their most recent estimate for nitrogen oxide emissions in 2010 is 785 thousand tonnes, while MARIN estimates 472 thousand tonnes for 2009. Three causes have been identified that largely explain this difference.
Figure 2.4
General dry cargo carriers Chemical/LNG tankers Container ships RoRo Cargo ships Oil tankers Bulk carriers Passenger ships Miscellaneous Reefers Tug and supply boats Fishing boats Non-merchant ships Small boats Total 0 40 80 120 160 200 million km Activity inventory by
Maritime Research Institute Netherlands (MARIN) Finnish Meteorological Institute (FMI)
Distances travelled on the North Sea, per type of vessel, 2009
TWO
The main cause is explained by the IIASA–Entec assumption that ships sail at their designed service speed1, which does not agree with the AIS monitoring
data for the period 2007–2010 (Figure 2.5). In the pre-crisis year 2007, ships sailed at speeds of about 87% of their service or design speed. A lower sailing speed leads to lower fuel use and nitrogen oxide emissions. In the first years (2009 and 2010) of the current economic crisis, larger ships in particular (e.g. container ships) reduced speed to save fuel. The abundant transport capacity in the marine market could also explain part of the reduction in sailing speeds in 2010.
Other causes that explain the higher IIASA–Entec emissions are the use of an average speed for all size classes within a ship type category and too high assumptions for the growth rate of shipping (fuel use) between 2000 and 2010. The comparison showed that emission factors do not differ significantly between the inventories. Overall, this comparison supports the credibility of the MARIN inventory.
Figure 2.5 100 – 1,000 1,000 – 1,600 1,600 – 5,000 5,000 – 10,000 10,000 – 30,000 30,000 – 60,000 60,000 – 100,000 100,000 and more Total
Size class (gross tonnage)
0 20 40 60 80 100
Sailing speed (% of service speed)
2007 (Jul – Dec) 2009 (Jan – Jun) 2009 (Jul – Dec) 2010 (Jul – Dec)
Monitored sailing speeds of vessels on the North Sea
Source: PBL (based on MARIN 2011b)
2.2 Emission baseline for North Sea
shipping in 2030
An emission baseline for ship emissions in the North Sea was developed for the year 2030. The year 2030 was chosen as this is a compromise between the following arguments:
• The impact of a nitrogen emission control area on nitrogen oxide reductions increases gradually as only new ships (built after 2015) need to comply with mandatory nitrogen oxide standards. Moreover, sea ships are replaced slowly due to an average lifetime of 25 to 30 years. The full effect of the control area is therefore reached beyond 2040, which pleads for a scenario year in the far future.
• To make reasonable estimates of the environmental impacts of a nitrogen emission control area in the North Sea, we also need projections for land-based emissions sources. Currently, the best available long-term scenarios for air emissions are made for 2030. Since these scenarios are also used as a base for European air policy studies, the application of these scenarios in this study enhances comparability between land and sea-based emission reduction measures.