Hier komt bij voorkeur een flaptekst te staan, in plaats van deze algemene tekst
Het Planbureau voor de Leefomgeving is hét nationale instituut voor strategische beleidsanalyses op het gebied van milieu, natuur en ruimte.
Het PBL draagt bij aan de kwaliteit van het strategi-sche overheidsbeleid door een brug te vormen tussen wetenschap en beleid en door gevraagd en ongevraagd, onafhankelijk en wetenschappelijk gefundeerd, verken-ningen, analyses en evaluaties te verrichten waarbij een integrale benadering voorop staat.
Planbureau voor de Leefomgeving Locatie Bilthoven Postbus 303 3720 AH Bilthoven T: 030 274 274 5 F: 030 274 4479 E: info@pbl.nl www.pbl.nl
‘Meeting the 2 °C target: From climate objective to emission reduction measures’
Limiting temperature increase to a maximum of 2 °C has been proposed to avoid dangerous anthropogenic climate change. Without additional policy, trends in greenhouse gas emissions will result in a temperature far above this target. In order to have at least a 50% chance of staying below 2 °C, atmospheric greenhouse gas concentrations need to be limited to between 400 and 450 ppm CO2 eq, or lower, in the long run. For this, the increase in global greenhouse gas emissions will need to be halted by around 2020. In 2050, global emissions would need to be reduced by 35 to 55%, compared to 1990. Meeting such targets requires considerable emission reductions in high-income countries, but also early involvement of other major economies in climate policy. The emission reductions can be achieved with known techniques. The overall macro-economic impacts of stringent climate policy are expected to be modest on a global level, although considerable investments are needed. The most significant challenges are to reach consensus on the contributions from different countries and sectors, and to put into place the right policies that lead to innovation and fundamental transitions.
M ee tin g t he 2 °C ta rg et
Meeting the 2 °C target From
climate objective to emission
reduction measures
Meeting the 2 °C target
From climate objective to
emission reduction measures
Second print
The following changes have been made:
Figure 2.3. The original title has been changed to “Energy-related CO2 emissions” (to clarify that the data refer to energy-related CO2 emissions only)
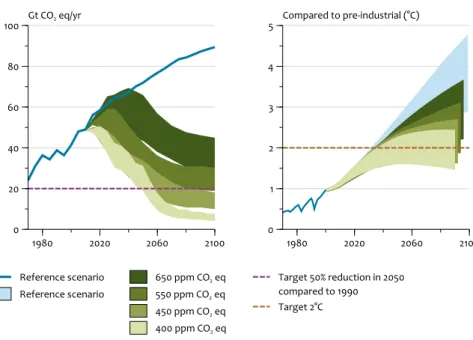
Figure 3.4. The figure has been revised. Emissions are now in GtCO2-eq (instead of GtC-eq)
Meeting the 2 °C target. From climate objective to emission reduction measures
© Netherlands Environmental Assessment Agency (PBL), Bilthoven, December 2009 PBL publication number 500114012
Corresponding authors:
D.P. van Vuuren (detlef.vanvuuren@pbl.nl), A.F. Hof (andries.hof@pbl.nl) and M.G.J. den Elzen (michel.denelzen@pbl.nl)
ISBN: 978-90-78645-28-3
Parts of this publication may be reproduced, providing the source is stated, in the form: Netherlands Environmental Assessment Agency: Meeting the 2 °C target. From climate objective to emission reduction measures, 2009
This publication can be downloaded from our website: www.pbl.nl/en. A hard copy may be ordered from: reports@pbl.nl, citing the PBL publication number.
The Netherlands Environmental Assessment Agency (PBL) is the national institute for strate-gic policy analysis in the field of environment, nature and spatial planning. We contribute to improving the quality of political and administrative decision-making by conducting outlook studies, analyses and evaluations in which an integrated approach is considered paramount. Policy relevance is the prime concern in all our studies. We conduct solicited and unsolicited research that is both independent and always scientifically sound.
Office Bilthoven PO Box 303 3720 AH Bilthoven The Netherlands Telephone: +31 (0) 30 274 274 5 Fax: +31 (0) 30 274 44 79 Office The Hague PO Box 30314 2500 GH The Hague The Netherlands Telephone: +31 (0) 70 328 8700 Fax: +31 (0) 70 328 8799 E-mail: info@pbl.nl Website: www.pbl.nl/en
Foreword
International climate policy-making has entered a crucial phase. Over the last years, it has become clear that climate change may lead to severe impacts. In response, policymakers have expressed interest in a goal to avoid an increase in global mean temperature of more than 2 °C, as a means for operationalising the ambition of the UN Framework Convention on Climate Change (to ‘avoid dangerous anthropogenic climate change’). This ‘2 °C’ target has gained more support, but also raised several questions; is this target sufficient to avoid severe impacts? What is needed to achieve this target? When do emissions need to be reduced and to which level? The Netherlands Environmental Assessment Agency (PBL) has published several analyses over the last few years that provide answers to some of these questions. In 2006, the publication ‘From Climate Objective to Emission Reduction’ combined a broad range of scientific information, to provide insight into the implications of various climate goals. The current publication provides not only an update including material that has become available since 2006, but also more explicitly focuses on the implication of such a 2 °C target. The publication has been systematically organised around the causal chain of climate change: from impacts to global emission reductions to regional emission reduction to implementation of various reduction measures and associated costs and, finally, to instruments to implement these measures.
Consistent with former publications, this report also shows that there is a large potential for reducing global greenhouse gas emissions to a level necessary for achieving the 2 °C target with high probability. The true challenge, however, lies not in the technical or economic aspects of emission reduction, but in agreeing upon and organising the institutional arrangements and policy instrumentation that would make these reductions feasible on both a worldwide and a local scale. With this publication we aim to provide a useful point of reference to the current state of climate science for people interested in climate policy. As to the question of whether the 2 °C target will indeed be achieved, much will depend on the clarity with which climate strategies are introduced, and on the creativity of finding ways to make these commitments enduring and firm, in the years to come.
Maarten Hajer
Contents
Foreword 5 Summary 9 1 Introduction 17 2 The 2 °C climate target in relation to expected impacts 21
2.1 Temperature increase and climate impacts without climate policy 21 2.2 From the ambition to avoid dangerous impacts to the 2 ºC target 25
3 From climate objective to emission reduction targets 35
3.1 From temperature target to concentration level 35 3.2 From concentration level to emission reduction targets 39
4 From emission reduction targets to reduction measures 45
4.1 The potential of various emission reduction categories 46 4.2 Integrated analysis of mitigation strategies 55
4.3 Synergies and trade-offs in climate policy 61
5 From global to regional targets 67
5.1 Regional efforts and costs: 2020 68 5.2 Regional efforts and costs: 2050 74
5.3 Financing adaptation costs in low-income countries 78
6 Policy instruments and implementation 81
6.1 Possible policy instruments and strategies 81 6.2 Implementing policies on different scales 87
Appendix Abbreviations and definitions 91
References 93
Without additional policy, expected trends in greenhouse gas emissions are likely to lead to an expected increase in average global temperature of 2.5 to 6 °C, by 2100. Such a change in climate will lead to considerable risks, such as loss of valuable ecosystems, impacts on the global food supply, and large-scale disturbances of the current climate system.
It is possible to change current trends in emissions. In the long term, atmospheric greenhouse gas concentration can be limited to 400 to 450 ppm CO2 eq, corresponding to around 70 and 50% probability of staying below the 2 °C temperature increase above the pre-industrial level. This requires the implementation of policy packages aiming at zero-carbon energy options, energy efficiency, reducing non-CO2 emissions, avoiding deforestation, and lifestyle changes. On a global level, the overall macroeconomic impacts are expected to be modest, although considerable investments are needed.
In order to achieve this, it is necessary to halt the increase in global greenhouse gas emissions around 2020. This requires meaningful participation in climate policy by all major greenhouse gas emitting countries. By 2050, global greenhouse gas emission reduction would need to be between around 35 and 55%, compared to 1990 levels.
The most significant challenges are to reach consensus on the contribution from different countries and sectors, and to put into place the right policies to spur off the shift to innovation and
fundamental transitions that will help bring about the required emission reduction. Effective climate policies in this context require political ambition to meet the 2 ºC target, long-term emission targets, and strict regulations to reach these. Integrated approaches are required to help harvesting the synergies between climate change mitigation, biodiversity protection, energy security and air pollution contol, and avoid trade-offs between these and other policy objectives.
The 2
oC target and climate impacts
Human society will face severe problems when global trends in climate change continue
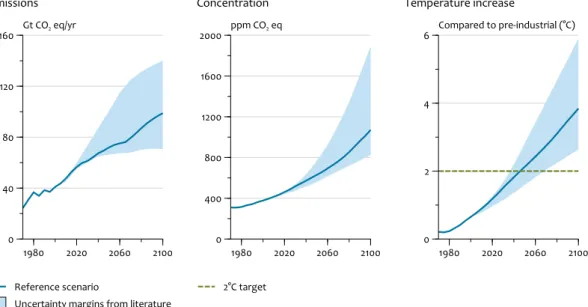
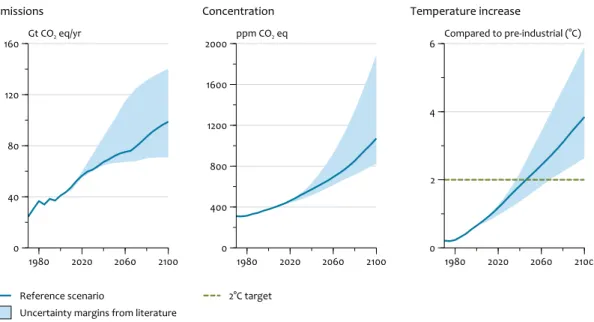
The current increase in average global temperature is around 0.8 °C compared to pre-industrial levels. If left unchecked, anthropogenic greenhouse gas emissions are likely to cause an increase in average global temperature of 4 °C, by the end of this century, with a full range of 2.5 to 6 °C reflecting the uncertainty in emissions and climate sensitivity (Figure S1). Such an increase in average global temperature is likely to lead to serious climate risks, including the loss of valuable ecosystems, impacts on the global food supply, the risk of more than 1 metre sea level rise and large-scale disturbances of the current climate system. A significant temperature
rise also increases the risk of critical thresholds being crossed in the climate system, such as the melting of the Greenland Ice Sheet, the release of methane in tundra, and the dieback of the Amazon forest.
A maximum increase in average global temperature of 2 °C, compared with pre-industrial levels, has been proposed as a limit to avoid dangerous anthropogenic climate change
The objective of the United Nations Framework Convention on Climate Change (UNFCCC) is to avoid ‘dangerous anthropogenic climate change’. Limiting average global temperature increase to a maximum of 2 °C, compared to pre-industrial levels, has been proposed as an interpretation of this objective. The EU accepted this 2 °C target as the long-term objective of its climate policy. At the G8 Summit in July 2009, the major economies adopted the same target as a guideline for international climate policy. Setting long-term targets for climate change involves an interpretation of risks, valuation of different types of impacts and a valuation of future costs, elements that need (normative) societal and political choices, to which science can provide factual input. The 2 °C target has been mostly based on risk considerations, by considering the decrease in risks from a ‘business-as-usual’ situation to those associated with a 2 °C target. The 2 °C target may also be consistent with the outcome of cost-benefit analyses, but this strongly depends on The uncertainty range for increases in concentration and temperature includes the uncertainty in the carbon cycle feedbacks and climate sensitivity (equilibrium temperature increase for a doubling of the pre-industrial CO2 concentration levels). The range is slightly upward on the low side compared to IPCC, accounting for recent scenarios only. Source: van Vuuren et al. (2008; 2009b).
Figure .1 1980 2020 2060 2100 0 40 80 120 160 Gt CO2 eq/yr Reference scenario
Uncertainty margins from literature Emissions
Global greenhouse gas emissions, concentration and temperature change
1980 2020 2060 2100 0 2 4 6 Compared to pre-industrial (°C) 2°C target Temperature increase 1980 2020 2060 2100 0 400 800 1200 1600 2000 ppm CO2 eq Concentration Figure S1
choices in the discount rate (i.e. value attached to future losses), the value attached to different damages and the actual assessment of risks involved.
From the 2 °C target to emission reduction targets
In order to have a reasonably chance of achieving the 2 °C target, the increase in global emissions should be halted around 2020 and emissions should decrease afterwards
In the long run, greenhouse gas concentration levels of 400 to 450 ppm CO2 eq, or less, are needed to keep a reasonable chance of staying below the 2 °C target. A 450 ppm CO2 eq level corresponds to about 20 to 70% probability of staying below this target, a 400 ppm CO2 eq level corresponds to a probability of between 40 and 90%. These concentration levels are consistent with CO2-only concentration of 350 and 400 ppm. For comparison, the present CO2 concentration is around 390 ppm and the pre-industrial level was 280 ppm.
Such low concentration levels can only be achieved after an initial overshoot to a peak concentration of around 500 ppm CO2 eq. A temporary, limited overshoot of greenhouse gas concentrations has only limited environmental implications. However, a more sustained and larger overshoot, could lead to a more irreversible response. In order to achieve the 450 and 400 ppm CO2 eq targets, the increase in global greenhouse gas emissions should be halted around 2020 and emissions should decrease afterwards. Some flexibility around the peak year exists, based on assumption of negative emissions in the second half of the century (using, for instance, bio-energy and carbon capture and storage), but this flexibility is not unlimited. Model calculations show that a 10 year delay in peaking would imply a substantial decrease in the probability of achieving the 2 °C target.
The 2 °C target corresponds to a reduction in global emissions of around 50%,by 2050, compared with 1990 levels
In the long term, emissions need to be reduced by around 35 to 55%, by 2050, compared with 1990 levels, to reach concentration levels of 400 to 450 ppm CO2 eq. These reductions are allowing a limited overshoot of the concentration levels, based on costs considerations, and take advantage of inertia in the climate system. As such, the range is slightly lower than earlier numbers reported by IPCC (which were based on very few model runs). Further reduction in 2050 would be even more challenging – but to the benefit of increasing the probability of staying below the 2 °C target. Failure of meeting the reduction requirements by 2050 would imply that the overshoot in concentration levels more fundamentally determines the long-term temperature increase, significantly reducing the probability of staying below 2 °C.
Even with greenhouse gas concentrations of 400 or 450 ppm CO2 eq, it might be useful to take the risk of 3 to 4 ºC into account in adaptation policies
While a 400 or 450 ppm CO2 eq scenario gives a reasonable chance of staying below 2 °C, the uncertainty in climate sensitivity implies that such a scenario could still result in a temperature increase of 3 °C or more. For policy-making, this implies that even if the 2 °C target is selected as an objective for mitigation policies, it might be
useful to take the risk of 3 to 4 ºC temperature increase into account in adaptation policies. Several uncertainties with respect to climate sensitivity need to be taken into account, such as the risk of a stronger impact of climate change on the carbon cycle, regional variations in climate effect, and time delays in society’s adaptation to climate changes.
From emission reduction targets to mitigation measures
Reducing global greenhouse gas emission requires, above all, a rapid increase in energy efficiency, as well as a decarbonisation of power supply
The ambition to reduce greenhouse gas emissions by around 50%, by 2050, implies that, for the energy system, the annual rate of decarbonisation needs to be increased to 5%, up from the historical average of 2%. It is possible to achieve such a reduction by rapidly increasing energy efficiency, replacing fossil-fuel technologies by zero-carbon technologies, and by introducing carbon capture and storage (CCS) techniques (Figure S2). In addition, greenhouse gas emissions from agriculture and deforestation can be reduced. In other words, a broad portfolio of measures needs to be introduced – and the future energy supply will be very different from that of today.
Example of a reference scenario and a scenario leading to 2 ºC. Source: van Vuuren et al. (2007) Figure S2 1980 2020 2060 2100 0 400 800 1200 1600 EJ/yr
Wind, solar and hydropower Nuclear Bio-energy
Natural gas with CCS Oil with CCS Coal with CCS Natural gas Oil Coal Reference scenario
Global energy consumption by energy carrier
1980 2020 2060 2100 0 400 800 1200 1600 EJ/yr 450 ppm CO2 eq
The potential to increase energy efficiency is considerable, but its realisation requires ambitious standards for appliances, vehicles, and houses. There is also a large scope to reduce greenhouse gas emissions from power generation. Development of a connecting super grid on a continental scale, combined with a smart grid at local scale, would facilitate penetration of large-scale renewable power production, but also allow for a combination with decentralised power generation (by accommodating the variations in power production resulting from weather variations). This also requires the integration of storage systems, as well as the assurance of grid access. The important role of CCS in a shift towards a low-carbon society, even only as a ‘transition technology’, calls for experiments with this technology in the short term. Combined policies to reduce air pollution and climate change will lower costs and lead to considerable gains in life expectancy, especially in low-income countries.
The annual additional abatement costs for climate policy are likely to be between 1 and 2% of global GDP
A considerable and global effort is required to reduce greenhouse gas emissions by 50%, by 2050. Additional global investment needs for climate policy are estimated to average around 1,200 billion USD per year in the 2005-2050 period, which is, on average, about 1.4% of global GDP. In addition, estimated average costs for climate change adaptation range between 50 and 160 billion USD per year. To put these figures into perspective, these investments are similar to current spending on environmental protection and are lower than the expected expenditure on extension and renewal of the energy system that is required even in the absence of climate policy. It should be noted that these estimates are highly uncertain, but provide an indication of order of magnitude. Macroeconomic impacts are even more uncertain; typical values of around 0.1% reduction in annual economic growth are reported for ambitious climate policy scenarios.
From global to regional targets
In translating global climate targets into national and regional targets, agreements need to be made, among other things, with respect to short-term reductions, long-term ambitions and financing of adaptation measures in developing countries. In 2020, on average, studies show a 25 to 40% reduction target, below 1990 levels (for a 2 ºC target) for high-income countries. To achieve the 2 ºC target, also meaningful participation of large emerging economies in international climate policy is required
The emission reductions required to reach the 2 °C target are large. First, it is necessary that all major emitting countries participate in a meaningful climate policy agreement. This not only includes today’s high-income countries (OECD), but also Brazil, Russia, India and China. Studies that depart from the principle that high-income countries take the lead in reducing emissions, on average, come to a reduction target for this group of countries of 25 to 40% below 1990 levels, by 2020 (for 450 ppm CO2 eq). It should be noted, however, that this strongly depends on the expected emission development without climate policy, and on the underlying concepts of what constitutes a fair distribution of efforts.
In addition, emissions for the group of low-income countries would need to be reduced. Corresponding to the above mentioned range for high-income countries would be a reduction of 15 to 30% for low-income countries, compared to business-as-usual emission projections for 2020. Within this group of countries, the burden of effort can be divided according to capacity; the more advanced low-income countries could reduce emissions more strongly than other low-income countries, while the lowest-income countries could be exempt from reductions until 2020. Part of the emission reductions might be financed through revenues from a Climate Fund, generated by a global greenhouse gas tax or trading system, or direct contributions from high-income countries.
In 2050, emission reductions for high-income countries would need to be around 80 to 90% below 1990 levels, according to most studies
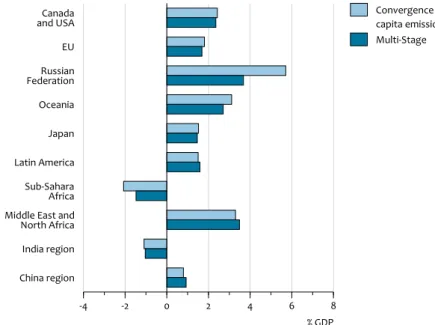
By 2050, the emission reduction target for high-income countries should be around 80 to 90% below 1990 levels, by 2050, according to most studies that take into account different proposals to allocate future emissions (Figure S3 shows an example of 2 such proposals). For low-income countries, emission reduction allocations vary widely, from allowances for the lowest-income countries of far above the 1990 level, to about 20% below this level for more advanced low-income countries.
Abatement costs are relatively high for carbon-intensive and fossil-fuel exporting regions, while the lowest-income countries may even reap net benefits
Distribution of emission reduction costs is a highly sensitive issue. If emission reduction targets are allocated to regions based on convergence of per-capita emissions, high carbon-intensive and fossil-fuel exporting regions, such as Russia and the Middle East, are expected to bear higher costs, even when there participation in the climate regime starts at a later stage (Figure S3). However, the lowest-income regions, such as India and Sub-Saharan Africa, may benefit due to the sale of emission rights credits. Moreover, these regions are also most vulnerable to climate change impacts, and net benefits from reduced climate change would most likely surpass costs for these countries, in the long run. The currently available funds for international financing of adaptation needs in low-income countries are far from their projected needs
Since the most severe impacts of climate change are projected to occur in the most vulnerable low-income countries, adaptation to climate change is especially important in those countries. The adaptation needs of low-income countries is estimated at 75 to 100 billion USD a year, which is far more than the current financing of the Adaptation Fund via a levy on CDM. A similar levy in all forms of emission trading would also not be able to create sufficient financing. Alternative proposals to finance adaptation have also been made, among other things, based on historic responsibility for climate change.
Instrumentation and implementation
Effective climate policies require long-term targets that are translated into short-term goals that are predictable and strictly enforced
Long-term targets help to create a strategic focus in current policies and to increase policy predictability for stakeholders involved. Targets for 2050 provide the direction of policy implementation, thus indicating where investment needs and innovation efforts will need to be directed in the long run. This creates a level playing field for creative stakeholders to exploit the new possibilities of a society with low greenhouse gas emissions. A whole range of policy instruments are available to translate long-term targets into short-term goals. Putting a price on emissions constitutes an important measure of effective climate policy. In addition, standards can be useful to directly influence emissions and encourage innovation. Realistic climate policies aims to find a balance with other public policy areas Public policy weighs the requirements of climate policy against other objectives of public interest. For instance, energy policy balances climate change objectives Average mitigation costs (2050) for two selected allocation approaches as illustration of possible outcomes. The Convergence approach involves a convergence of per-capita emissions by 2050. The Multi-Stage approach is an allocation method in which countries start to participate in emission reductions based on income or emission criteria. In the long run, also this allocation method leads to a convergence of per-capita emission credits. Negative costs result from the sale of emission credits through emission trading or the CDM. Source: den Elzen et al. (2008b).
Figure S3 Canada and USA EU Russian Federation Oceania Japan Latin America Sub-Sahara Africa Middle East and North Africa India region China region -4 -2 0 2 4 6 8 % GDP Convergence per capita emissions Multi-Stage
against those on security of energy supply and cost issues. Similarly, climate policies interact with land-use and agricultural policies, industry and innovation policies, transport policies and energy security policies. There are considerable co-benefits between these different policy areas, such as the impacts of climate policy on air pollution, and the mitigation expansion of agricultural land (for climate and biodiversity). In some cases, there are also clear trade-offs (such as possibly around bio-energy). This calls for an integrated approach to domestic climate policy implementation.
The most significant political challenge is to decide on a joint and preferably global commitment to implement ambitious climate policies
The overview presented in this report shows that a low-carbon economy can be achieved with currently identifiable technologies, and with moderate economic costs. However, many other barriers exist: a key challenge is to achieve the right policy conditions and institutional settings to further significant emission reductions, and stimulate innovation. The challenge for finding solutions to these barriers is considerable, but it needs to be met in order for climate policies to succeed.
Introduction
The 2 °C target has been proposed as a reasonable limit to man-made climate change
The earth’s climate is changing, and while our understanding of the climate system is still far from complete, current knowledge is advanced enough for the Inter- governmental Panel on Climate Change (IPCC) to conclude with very high confidence that human activities are the main cause of the observed changes (IPCC, 2007a). Human activities that contribute to climate change include fossil-fuel combustion, agriculture and deforestation. These activities have significantly raised the concen-tration of greenhouse gases in the atmosphere and they are expected to lead to a further increase in the future, if current trends are left to go unchecked.
The activities that cause climate change can be influenced. However, this is not easy and requires taking difficult policy decisions. An important complication of climate policy-making is that the causes of climate change are separated from the conse-quences. First of all, greenhouse gas emissions from one country affect the climate of the whole world. Therefore, climate change policy can only succeed through an international approach. Second, most of the impacts of climate change occur far into the future as a result of the slow response time of the climate system. This implies that decision makers need to take account of impacts for future genera-tions on the basis of uncertain scenarios.
The international community has acknowledged the threats posed by climate change and agreed on the United Nations Framework Convention on Climate Change in 1992 (UNFCCC, 1992). This convention aims to prevent dangerous anthro-pogenic interference in the climate system, in order to protect food production, biodiversity, and sustainable economic development. It is not possible, however, to unambiguously determine how much global warming can be tolerated without causing ‘dangerous anthropogenic interference’. This is partly due to uncertainties in the climate system, but also because of differences of opinion on what should be protected, how much risk can be accepted and how much risk can be avoided by measures other than reducing greenhouse gas emissions (such as adaptation). The EU has selected a maximum increase of 2 °C above pre-industrial levels as a practical target for international climate policy (EU, 2005). This 2 °C target may in fact be seen as a compromise between the risks of climate change and the required efforts to reduce greenhouse gas emissions. Several countries worldwide have endorsed the same target. The G8 Summit and major economies also adopted the 2 °C target as a guideline for international climate policy during their summit in July 2009, in L’Aquila, Italy (MEF, 2009).
Meeting the 2 °C target; from climate objective to reduction measure
This report responds to increasing political support for the 2 °C target, by picturing its implications in terms of risks of climate change, emission reductions, mitigation measures and costs. The report does so, mostly by discussing recent publications of the Netherlands Environmental Assessment Agency (PBL). The report also indicates the societal choices that will need to be made to achieve such a target. Crucial topics include the probability of reaching the target, the type of measures that could be taken, the required international cooperation, and agreements on burden-sharing.
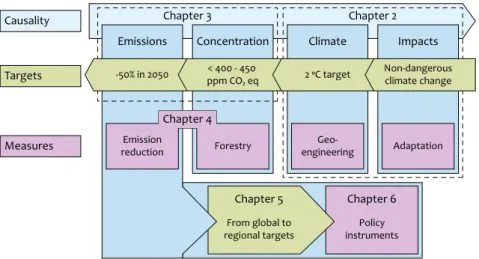
For this report, we followed a step-wise approach, organised around the causal chain of climate change (see Figure 1.1). This chain runs from emissions via greenhouse gas concentration to climate change and, finally, to impacts. As indicated above, we assume that the overall goal of international climate policy (to avoid ‘dangerous anthropogenic interference in the climate system’) is translated into an ambition to limit global temperature increase to a maximum of 2 °C. Deriving more concrete reduction measures starting from the 2 °C target implies going in the reverse direction of the causal chain as indicated in the figure (targets). First, Chapter 2 discusses the implications of accepting the 2 °C target, in relation to the ambition to avoid (non-dangerous) climate change impacts. Moreover, it also indicates how ‘business-as-usual’ trends compare to the 2 °C target. In translating the 2 °C target to implications for emission reductions, it is important to account for the uncertainties that play an major role in the causal chain, such as the response of the terrestrial biosphere to climate change, and the so-called ‘sensitivity’ of the climate system to greenhouse gas concentrations. This is the topic of Chapter 3. Next, Chapter 4 presents what would be required to achieve these emission reductions from a global perspective. There are different categories of possible measures, related to the two main emission sources: land-use and the energy sector. Emissions can be reduced in both categories by changes in demand and production. It should be noted, however, that climate policies will need to be formulated on a regional or national level.
Figure 1.1 Causality, targets and measures of climate change
Chapter 4 Emissions Chapter 3 Chapter 5 Chapter 6 Chapter 2 Targets Measures Causality
Concentration Climate Impacts -50% in 2050 < 400 - 450 ppm CO₂ eq 2 oC target Non-dangerousclimate change
Emission reduction Forestry Policy instruments Geo-engineering Adaptation Chapter 4 From global to regional targets
As a result, actual policies depend on the allocation of emission reduction efforts to different regions, countries and/or sectors. Chapter 5 provides the available information on this issue. Lastly, Chapter 6 indicates what further issues could arise if policies are finally formulated on a national level.
Summarising, the following questions are specifically addressed:
How does the 2 °C target relate to expected impacts of climate change? (Chapter 2)
How much do emissions need to be reduced to achieve the 2 °C target? (Chapter 3)
How and at which costs can these emission reductions be reached? (Chapter 4) How can global emission reductions be translated into regional reductions?
(Chapter 5)
What are the policy instruments available? (Chapter 6)
Abbreviations and terms used in this report are defined after Chapter 6 (see
Appendix). This mainly concerns the references to two main country groupings (low and high-income countries) and the naming of scenarios.
The 2 °C climate
target in relation to
expected impacts
Business-as-usual is expected to lead to an increase in global mean temperature of 2.5-6 °C by 2100, with further increase thereafter. This would lead to serious climate risks, including the loss of valuable ecosystems, impacts on the global food supply and large-scale disturbances of the current climate system.
A maximum increase in average global temperature of 2 °C has been proposed as a reasonable limit for managing climate risks.
It seems more useful to regard mitigation and adaptation as complements rather than substitutes. As there are limits to what adaptation can achieve, mitigation can help to keep adaptation strategies realistic. At the same time, as mitigation will only reduce the level of climate change and not prevent it, adaptation will be needed under each scenario.
What constitutes the ambition to prevent ‘dangerous anthropogenic interference with the climate system’ depends on the risks involved in climate change and their appraisal. Climate change impacts occur not only in the absence of climate policy, but also with ambitions climate policy. This chapter first presents possible developments assuming no international climate policy (as a reference) and next indicates how the 2 °C target compares to different ways of looking at the impacts of climate change.
2.1 Temperature increase and climate impacts without climate policy
Population growth and economic growth are expected to lead to rapid growth in energy useEmission developments over the coming century are uncertain. High economic and population growth and energy-intensive consumption patterns are factors that can lead to higher emissions. However, fast technological development, depletion of fossil fuels or less energy-intensive consumption patterns can lead to lower emissions. Scientific studies try to gain insights into the potential development of emissions by developing various reference projections or scenarios. The main
Source: van Vuuren et al. (2009b) and Nakicenovic et al. (2006). Figure 2.1 1850 1900 1950 2000 2050 2100 0 400 800 1200 1600 2000 EJ/yr Trend scenario
Uncertainty margins from literature Total
Global energy consumption, Reference scenario
1850 1900 1950 2000 2050 2100 0 400 800 1200 1600 2000 EJ/yr Hydropower Solar and wind Nuclear Modern bio-energy Traditional bio-energy Natural gas Oil Coal By energy carrier
reference scenario used in this report is representative for the medium range of scenarios in the literature (van Vuuren et al., 2009b). Population in the reference scenario reaches 9.1 billion by 2050, after which it stabilises at about 9.2 billion, up to 2100 (UN, 2008). Typical reference projections, such as the one used in this report, assume high economic growth in low-income regions: this is especially the case in Asia and Latin America early on in the scenario period, followed later by Africa. Despite these rapid growth rates, the current high-income economies are projected to remain the richest in per-capita terms. In terms of total economic activity, however, the economies of current low-income regions (based on their large contribution to the world population) will dominate the world economy for most of the century.
This increase in economic activity will also lead to an increase in energy use, again mostly in low-income regions. A typical projection of world energy consumption shows an increase by a factor of 2 to 3, over the 21st century (Figure 2.1; Fisher et al., 2007). Assuming no change in current policies, it is expected that fossil fuels continue to hold a large market share, as their average prices will remain below those of alternative fuels. In the reference scenario used for this report, in the coming decades, the consumption of oil, natural gas and coal will all increase. Depletion and resulting price increases, however, would lead to a stabilisation of oil and natural gas usage around the middle of the century. For coal, resource
scarcity is not expected to limit usage or lead to increasing costs in the foreseeable future. As a result, coal use may strongly increase in the absence of climate policy. Although non-fossil energy production – including nuclear, biomass and other renewables – is likely to increase substantially, as well, their share will remain limited.
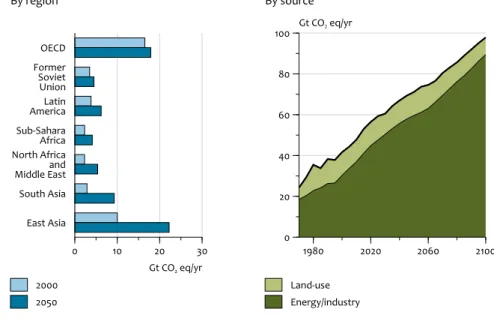
The growth in energy use will contribute to increasing greenhouse gas emissions At this moment, most greenhouse gas emissions can be attributed to fossil-fuel combustion and industrial emissions. Therefore, the expected increase in fossil-fuel use will lead to increasing greenhouse gas emissions (Figure 2.2). Typically, scenarios without climate policy project roughly a doubling of greenhouse gas emissions by the end of the century – including the reference scenario used here (see also Figure 2.4 and Box 2.1). The contribution from land-use change and agriculture is expected to drop somewhat, mostly because of decreasing emissions from deforestation. The latter is a result of a declining growth rate in agricultural area. Although most of the increase in greenhouse gases occurs in low-income countries, per-capita emissions remain highest in the OECD countries. The impact of the current economic crisis is believed to be mostly a short-term one (see Box 2.2). The 2 °C target is already likely to be exceeded by the middle of the century in the reference case
As a consequence of these emission trends, greenhouse gas concentration will continue to rise throughout the 21st century (Figure 2.4). Values for reference scenarios vary over a rather wide range, given the uncertainty in emission
Source: van Vuuren et al. (2009b).
Figure 2.2 OECD Former Soviet Union Latin America Sub-Sahara Africa North Africa and Middle East South Asia East Asia 0 10 20 30 Gt CO2 eq/yr 1980 2020 2060 2100 0 20 40 60 80 100 Gt CO2 eq/yr Land-use Energy/industry By source 2000 2050 By region
Box 2.1: What do current emission trends imply for the long term
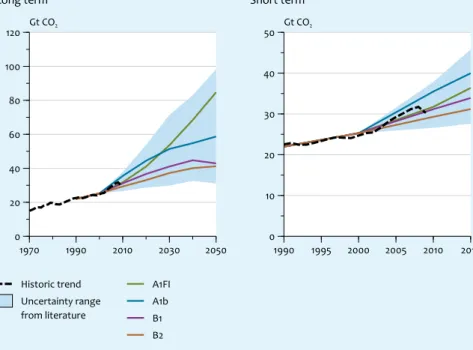
The rapid growth of CO2 emissions since 2000, at a rate of above 3% annually, has recently attracted considerable scientific and policy attention. Raupach et al. (2007) and Sheehan (2008), for example, suggest that the rapid growth may indicate a trend reversal and thus postulate the beginning of a significant break, away from the long-term historic trends of improving carbon and energy intensities. Comparing short-term trends with long-term scenarios, however, needs to be done with care. After looking at current trends, van Vuuren and Riahi (2008) concluded that there is no reason to believe that emissions will remain outside the (wide) range of long-term projections drawn up in the IPCC-SRES scenarios. Since their publication, the financial crisis in 2008 has slowed down emissions so much that by now emissions are again well within the SRES rangeHistoric trends based on CDIAC, extended up to 2008 by data of the EDGAR database and projection for 2009 (IMAGE/TIMER). Source: van Vuuren and Riahi (2008).
Figure 2.3 1970 1990 2010 2030 2050 0 20 40 60 80 100 120 Gt CO2 Historic trend Uncertainty range from literature A1FI A1b B1 B2 Long term
Energy-related CO2 emissions, IPCC scenarios and historic trend
1990 1995 2000 2005 2010 2015 0 10 20 30 40 50 Gt CO2 Short term
development and carbon cycle feedbacks. Typical values are in the order of 800 to 1800 ppm CO2 eq, by 2100. After 2100, concentrations will continue to rise. Despite these uncertainties, scientific knowledge leaves little doubt that a consequence of an increase in atmospheric greenhouse gas concentration would be a steady
increase in global mean temperature. The 2 °C target is likely to be exceeded by the middle of this century, after which temperature levels increase further. Based on the uncertainty in emissions and the relationship between greenhouse gas concentration and temperature increase (the so-called climate sensitivity), the temperature increase may be 2.5 to 6 °C near the end of the century, relative to pre-industrial levels. The uncertainty is especially large at the high-end range of this estimate, so that even higher values cannot be excluded (van Vuuren et al., 2008). Temperature levels of all reference scenarios are still rapidly increasing by the end of the century: in other words, temperature is expected to increase further after the end of the century.
2.2 From the ambition to avoid dangerous impacts to the 2
oC target
Higher temperatures mean higher risks of a whole range of adverse effects The risks of climate change can be mapped as a function of global mean
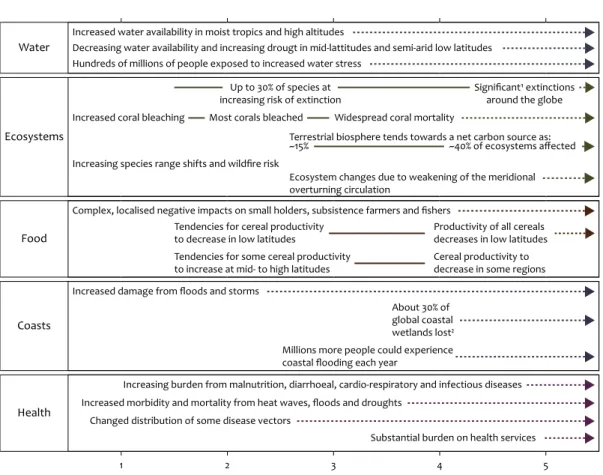
temperature increase. IPCC recently updated its earlier assessment of the risks of climate change (Figure 2.5). Although there are still considerable uncertainties, it is expected that at a low increase of global mean temperature, impacts will mostly concern sensitive ecosystems, such as coral reefs, and mainly will have local effects (for example, the effects on coastal systems from the increase in extreme weather events). Further climate change increases the risks of more radical and large-scale effects, such as the melting of Arctic ice, negative effects on food production, or the collapse of the thermohaline circulation. For the 21st century, unchecked climate change may lead to a sea level rise of 50 centimetres to over 1 metre; in the long run, it may even lead to an increase of more than 6 metres. Moreover, there is
Box 2.2: The impact of the 2008/2009 economic crisis
The present economic recession not only features a downturn in worldwide economic activity, but also has strong environmental impacts. Emissions in high-income regions have declined, while emissions increase less strongly than expected in most low-income regions. The net result has been a significant decrease in global emissions between 2007 and 2009 (see Figure 2.3). PBL calculations show, however, that if the economy recovers, greenhouse gas emissions are expected to rise again. As such, the crisis on a global scale mainly causes a few years delay in emission growth and a related impact on concentration and temperature. By itself, this impact would make short-term targets (e.g. 2020) slightly easier to achieve –with little long-term impacts. However, some evidence exists that the crisis also has negatively impacted private investments in clean energy (PBL, 2009c). Worldwide, in 2008, about 111 billion euros was invested in renew-able energy; a modest annual rise of 5%, compared to annual growth rates of over 50% in previous years (Science for Environmental Policy, 2009). Investments in greenhouse gas emission reduction in sectors within the European Emission Trading Scheme (EU ETS) are also likely to decline due to very significant drops in CO2 prices.It is important to prevent that the economic crisis would make long-term targets more difficult to achieve due to reduced investments, in the short-term.
considerable risk of passing critical thresholds for survival of the Amazon forest, the release of methane from tundra/permafrost, and for the stability of the Greenland and west Antarctic ice sheets. The largest effects of climate change are expected to take place in low-income countries. The reason for this is not only because the most severe impacts often occur in these countries (changes in precipitation or impacts on yields), but also because they are the most vulnerable due to their considerable dependence on climate-sensitive economic sectors, such as agriculture. By comparing the projected 21st century temperature increase in Figure 2.4 with the impacts in Figure 2.5, insight on possible impacts during this century can be obtained.
Impacts of climate change, to a certain extent, can be reduced by adaptation measures
Where mitigation aims to reduce the above-mentioned risks by reducing climate change, adaptation aims to reduce vulnerability by adjusting to higher temperatures or changes in precipitation patterns. Ecosystems and society, to some extent, have the capacity to adjust to climate change. Adaptation can be stimulated by policies. Some forms of adaptation are relatively cheap and can be introduced rapidly without much difficulty. These measures, such as changes in heating and cooling practices in buildings, are introduced mostly by a large number of private actors (and thus require little government action). Other examples include changes in crops and improving irrigation systems. An important feature of The literature range refers to scenarios without climate policy; for concentration and temperature, the indicated range includes the uncertainty in emissions, carbon cycle feed-back and climate sensitivity. Source: van Vuuren et al. (2008; 2009b).
Figure 2.3 1980 2020 2060 2100 0 40 80 120 160 Gt CO2 eq/yr Reference scenario
Uncertainty margins from literature Emissions
Global greenhouse gas emissions, concentration and temperature change
1980 2020 2060 2100 0 2 4 6 Compared to pre-industrial (°C) 2°C target Temperature increase 1980 2020 2060 2100 0 400 800 1200 1600 2000 ppm CO2 eq Concentration Figure 2.4
this type of adaptation measures is that they can reduce the risks of climate change in the near future. Mitigation, in contrast, reduces long-term climate risks, due to the slow response time in the climate system.
The relation between adaptation and mitigation is shown schematically in Figure 2.6. The figure introduces 4 hypothetical strategies in response to climate change: 1) doing nothing, 2) only adapt, 3) only mitigate and 4) mitigate and adapt. The figure shows, in qualitative terms, the results of these strategies in terms of total climate costs, which consists of the costs of damage from climate change, the adaptation costs and the costs of mitigation. As shown in Figure 2.6, the cost level and the time profile varies depending on the type of climate policy. If no action is taken (neither mitigation nor adaptation), in the long run, climate damages will be Impacts will vary by extent of adaptation, rate of temperature change and socio-economic pathway. Source: IPCC (2007a).
Figure 2.4 Examples of impacts associated with global average temperature change
Global average annual temperature change relative to pre-industrial (oC) 5 4 3 2 1 Water
Increased water availability in moist tropics and high altitudes
Decreasing water availability and increasing drougt in mid-lattitudes and semi-arid low latitudes Hundreds of millions of people exposed to increased water stress
Ecosystems
Up to 30% of species at
increasing risk of extinction Significant¹ extinctionsaround the globe Increased coral bleaching Most corals bleached Widespread coral mortality
Terrestrial biosphere tends towards a net carbon source as: Increasing species range shifts and wildfire risk
Ecosystem changes due to weakening of the meridional overturning circulation
~15% ~40% of ecosystems affected
Food
Complex, localised negative impacts on small holders, subsistence farmers and fishers Tendencies for cereal productivity
to decrease in low latitudes Productivity of all cerealsdecreases in low latitudes Tendencies for some cereal productivity
to increase at mid- to high latitudes Cereal productivity todecrease in some regions
Coasts
Increased damage from floods and storms
About 30% of global coastal wetlands lost² Millions more people could experience coastal flooding each year
Health
Increasing burden from malnutrition, diarrhoeal, cardio-respiratory and infectious diseases Increased morbidity and mortality from heat waves, floods and droughts
Changed distribution of some disease vectors
¹ Significant is defined here as more than 40%
² Based on average rate of sea level rise of 4.2mm/year from 2000 to 2080
Substantial burden on health services
high and as a result, so will the total costs. If society would choose to adapt only to climate change, and not to mitigate emissions, costs would obviously be reduced significantly. However, as there are limitations to adaptation, certainly at high temperature levels, climate damage would still increase over time, as would the total costs. Introducing mitigation now leads to a very different profile. The costs of mitigation are borne early in time – therefore, total costs are high early on, as well. However, as mitigation measures prevent climate change and, as a result, reduce long-term climate impacts, this finally leads to low long-term costs. Combining mitigation with adaptation strategies will lead to the lowest costs, in the long run. Mitigation and adaptation measures need to be combined for successful climate change policies
Describing the impacts of climate change as a function of mitigation and adaptation (as done in the previous section) may suggest that the costs and benefits of mitigation and adaptation and the residual damages can be easily weighed against each other. However, the appraisal of long-term mitigation and adaptation strategies is being complicated by several fundamental factors. One of these factors is the aforementioned difference in temporal scale of mitigation and adaptation. Another complication involves the many uncertainties (and thus risks) that are involved in the appraisal. Mitigation has the advantage that it reduces these uncertainties, since – in contrast to adaptation – it reduces climate change itself.
It seems more useful to regard mitigation and adaptation as complements rather than substitutes. As there are limits to what adaptation can achieve, mitigation can help to keep adaptation strategies realistic. Likewise, as mitigation will only Relation between adaptation and mitigation strategies shown schematically. Source: Hof et al. (2010). Figure 2.6 Time Costs Strategies No adaptation, no mitigation Only adaptation Only mitigation Mitigation and adaptation Sum of mitigation, adaptation and impacts
be able to reduce the level of climate change but not prevent it, adaptation will always be needed. In a combined strategy, adaptation reduces short-term risks, and mitigation reduces risks in the long term.
Sometimes, also geoengineering is proposed as another form of response to climate change. The impacts of these measures, however, are still largely unknown. Therefore, at this stage, it is not useful yet to consider these measures as part of a realistic response strategy (see Box 2.3).
Risk assessment constitutes one way to determine long-term climate targets In exploring a preferred mix of mitigation, adaptation and impacts, two main approaches exist: (i) the risk-based approach, which bases the preferred level of mitigation on the potential impacts of different levels of climate change, and (ii) cost–benefit analysis, which compares the same impacts to the costs of mitigation, but in monetary terms.
The first approach uses the relationships between global mean temperature increase and possible impacts such as depicted in Figure 2.5. From such an overview of possible impacts, it is possible to derive a maximum temperature increase that would correspond to avoiding impacts that are not ‘acceptable’. It should be noted that such impacts can be direct (e.g. costs of reduced agricultural production), as well as indirect (possible societal impacts, such as refugees). As indicated in Chapter 1, the objective of the EU is to prevent an increase in global mean temperature of more than 2 °C above the pre-industrial level, based on risk considerations (EU, 1996, 2005). Several scientists have provided similar considerations (Azar
Box 2.3: Geoengineering
In addition to mitigation and adaptation, it is also possible to reduce climate risks by using large-scale engineering of our environment, in order to counteract changes induced by increasing greenhouse gas concentrations. There are two basic categories of geoengineering options: removing greenhouse gases from the atmosphere, and managing the radiative forcing balance (that is, the difference between incoming and outgoing radiation energy). An example of the first category includes direct capture of CO 2 from the atmosphere by absorption and subsequent storage. Options for the second category include the deliberate introduction of aerosols – fine particles – in the stratosphere and altering the planet’s reflection by white cloud formation. In general, the impacts of most forms of geoengineering are still relatively unknown, several measures are very expensive and others involve important risks. Further research is needed before it would be useful to consider these measures as part of climate response strategies (if it all). Moreover, most authors consider geoengineering only as an ultimate response to immediate climate risks – and not as alternative for other forms of climate policy responses. In terms of governance, it is important to note that international legislation that would provide a context for geoengineering is currently lacking. There is an urgent need (also if geoengineering is not pursued) to formulate international agreements on the use of geoengineering techniques (TRS, 2009).
and Rodhe, 1997; O'Neill and Oppenheimer, 2002; WBGU, 1995). Some scientists explicitly argue in favour of more stringent targets (Hansen et al., 2007; Rockström et al., 2009) while others argue for less stringent ones. As shown further in this publication, short-term measures required to reach the 2 °C target can already be regarded as the maximum feasible response. In that light, it is unlikely that strategies for even more stringent targets will diverge much from a 2 °C target in the short-term, so that there is room for re-evaluation in 1-2 decades.
The outcome of cost-benefit analyses strongly depends on critical uncertainties and policy choices, in particular regarding the discount rate
Another way to compare different climate strategies is by exploring their monetary impacts using cost-benefit analysis. This approach is often presented as determining optimal emission reductions – but the outcomes critically depend on all kinds of uncertainties and normative assumptions. As a result, the outcomes of cost-benefit studies presented in the literature vary widely. The Stern Review (Stern, 2006), for instance, indicates on the basis of a cost-benefit approach that a 2 °C target is optimal, while other economists advocate much higher optimal targets (Nordhaus, 2008; Tol, 2002). Hof et al. (2008) showed that the differences can be
Box 2.4: Models used for this publication
The calculations in this report are based on the IMAGE integrated assessment model-ling framework, consisting of various interlinked models that calculate global energy and land-use (TIMER/IMAGE), climate change (MAGICC), and the costs of climate policy (FAIR). The combination of models can be used to explore trends in the absence of climate policy, and to develop mitigation scenarios that show which combination of emission reductions would be required in order to reach different climate targets. The framework can also be used to analyse specific climate policy regimes, including differ-ent allocation rules for international emission permits.
All calculations have been performed for 24 or 26 world regions. The models cover all major emission sources and greenhouse gases, including CO2, methane, nitrous oxide, halogenated gases, air pollutants and aerosols. The emission reduction pathways require assumptions on different reduction options as described in various publica-tions (MNP, 2006; van Vuuren et al., 2007). In developing reduction pathways, reduc-tions are bound by the available potential, capital turnover rates and requirements on the time period for which the concentration objective may be exceeded. As most scenarios discussed in this report assume international emission trading, emissions can be reduced in all sectors, for all greenhouse gases, and in all regions.
For calculating regional reductions and costs, the global reduction objectives are first divided between these regions based on allocation rules. The resulting regional reduction objectives can then be realised both via domestic measures and via emission trading. In general, the models provide insights into the chances of achieving the climate objectives, the contributions of the various measures, and the (regional) costs involved. The costs indicate the direct costs of climate policy.
fully understood on the basis of underlying assumptions, in particular with respect to:
1. differences in importance attached to the welfare of future generations (‘discount rate’);
2. differences in the monetary estimates of climate change impacts.
The relative importance attached to costs for future generations can be easily shown by looking at Figure 2.6 again. The costs of mitigation are mainly incurred by the current generation, whereas potential climate change impacts (and thus also the benefits of mitigation) take place in the distant future. Studies which attach relatively more importance to the current generation (high discount rate), therefore, recommend less stringent climate targets than studies that award relatively more importance to future generations (low discount rate). This factor is ultimately a subjective choice, but it strongly determines the preferred outcome of cost-benefit analyses, as illustrated in Figure 2.7. This figure shows at which greenhouse gas concentration level the lowest costs occur for two discount rates: one used in the Stern report and one used by Nordhaus (all other factors such as mitigation costs and climate damages are kept equal). Depending on the choice of the discount rate, each having their supporters, greenhouse gas concentration peak levels in the whole range of 500 to 800 ppm CO2 eq can be easily justified as The x-axis plots the concentration peak level and not the final stabilisation level (see Chapter 3). A 510 ppm CO2 eq peak level corresponds to a final stabilisation level of 450 ppm
CO2 eq. Source: based on Hof et al. (2008).
Figure 2.7
500 600 700 800
Concentration peak level (ppm CO2 eq)
0 1 2 3 4 % cumulative GDP Indirect costs Mitigation Impacts Nordhaus discounting
Total cumulative discounted consumption loss, 2001-2250
500 600 700 800
Concentration peak level (ppm CO2 eq)
0 1 2 3 4 % cumulative GDP Stern discounting
leading to the lowest costs (more on concentration peak levels and CO2 eq see Chapter 3).
Apart from the discount rate, the monetary estimates of climate change impacts strongly influence the results of cost-benefit analysis. These estimates differ widely, both because the effects of climate change are surrounded by large uncertainties and because scientists use different methods to value these effects. Many of the benefits of climate change mitigation, such as a reduction in the number of people exposed to health risks or loss of biodiversity, are not easily expressed in monetary terms.
Explicitly taking a precautionary approach would lead to lower preferred targets, such as the 2 °C target
Standard cost-benefit analysis focuses on best-guess values for the sensitivity of the climate system, the costs of mitigation and climate change impacts and has been criticised for this (e.g. Weitzman, 2009). An alternative monetary approach would start from the precautionary principle – and therefore focus on minimising the risks of very high climate change costs. In this approach, instead of using best-guess values, assumptions that represent the worst case are deliberately used – and the strategy that is most robust in such a situation is identified. Under this approach, lower temperature targets become more attractive, as can be seen in Figure 2.8. However, the discount rate can still play an important role (Hof et al., 2009d). Total climate cost assuming worst-case assumptions for all major uncertainties, reflect-ing a precautionary approach. Discount rate accordreflect-ing to UK green book (UK Treasury, 2003). The x-axis plots the concentration peak level and not the final stabilisation level (see Chapter 3). A 510 ppm CO2 eq peak level corresponds to a final stabilisation level of 450 ppm
CO2 eq. Source: Hof et al. (2009d).
Figure 2.8
520 560 600 640 680 720 760 800
Concentration peak level (ppm CO2 eq)
0 4 8 12
16 % cumulative GDP Indirect costs
Mitigation Impacts Worst case approach
The 2 oC target as goal for climate policy
Both science and economic considerations can advise on best targets for climate policy, but the final choice depends fully on what risks society is willing to accept. Given limitations in valuating impacts and risks, it is important to always consider a more physical description of impacts as well. In selecting a target for climate policy, the importance attached to future generations and valuation of climate impacts and risks involve important value judgments. Differences in opinion on how to deal with these value judgments lead to widely different recommendations for climate change policy. The 2 °C target is not contrasted by available information on risks, nor by cost-benefit analysis, especially if a precautionary approach is chosen.
From climate
objective to emission
reduction targets
The 2 °C target needs a statement on the certainty with which it should be achieved to make it an operational target.
In the long run, a greenhouse gas concentration level of 400 to 450 ppm CO2 eq is needed to keep a reasonable chance of meeting the 2 °C target. A 450 ppm level corresponds to about 20 to 70% probability of remaining below 2 °C; a 400 ppm level corresponds to 40 to 90%.
Most emission scenarios leading to 2 °C have a peak in global emissions around 2020, at the latest.
Global emission reductions compared to 1990 would need to be around 35 to 55% by 2050 and continue to decline thereafter.
The translation of the 2 °C target into proposed emission reductions, over time, requires three fundamental steps. First, it has to be determined which greenhouse gas concentration levels correspond to a maximum increase in global mean temperature of 2 °C. This depends on the relationship between greenhouse gas concentrations in the atmosphere and temperature increase. Second, an emission trajectory has to be defined that leads to these concentration levels. Finally, the difference between this emission reduction trajectory on the one hand, and the expected emission trajectory in the absence of climate policy on the other hand, determines the necessary reduction in emissions.
3.1 From temperature target to concentration level
Given the large uncertainties in the relationship between greenhouse gas concentration and temperature, the 2 °C target needs to be accompanied with a statement on the certainty with which it should be achieved
The relationship between greenhouse gas concentrations in the atmosphere and temperature change is beset with uncertainty. This uncertainty is usually expressed in terms of the so-called climate sensitivity, which is defined as the increase in global mean temperature resulting from a doubling of the greenhouse
gas concentration in the atmosphere. A large number of scientific studies have been published on the value of climate sensitivity, often expressing this in probabilistic terms (e.g. the value is very likely to be above 1.5 °C and below 4.5 °C). Recent research has often shown the climate to be more sensitive to increases in concentrations than was assumed earlier, although the uncertainty range remains large (IPCC, 2007a). The uncertainty in climate sensitivity implies that it is not useful to only talk about the 2 ° C itself, but that also some statement needs to be made on the certainty of meeting the target.
In the long run, a greenhouse gas concentration level of 400 to 450 ppm CO2 eq or lower is needed to have a reasonable chance of meeting the 2 °C target. A 450 ppm level corresponds to about 20 to 70% probability of remaining below 2 °C; for a 400 level, this is 40 to 90%
On the basis of studies on climate sensitivity, the likelihood of achieving a 2 °C target for specific concentration levels can be expressed. Figure 3.1 shows the probability of achieving a certain temperature target for different concentration stabilisation levels. The concentration in the figure is expressed in so-called CO2 eq. This means that it does not only take into account CO2, but also other greenhouse gases and aerosols (see text box 3.1). In general, higher concentration levels provide less chance of reaching 2 °C. Interestingly, the chances of remaining below 2 °C increase rather rapidly at declining levels from 550 to 400 ppm CO2 eq. The chance of reaching the 2 °C target is less than 40% if concentrations are stabilised at 550 ppm CO2 eq, 20 to 70% for stabilisation at 450 ppm, and 40 to 90% for stabilisation at 400 ppm. A 400 ppm CO2 eq level corresponds to a concentration of 350 ppm CO2 only (see Appendix).
Relationship between greenhouse gas concentration and the chance of staying below 2 °C. Source: Meinshausen et al. (2006).
Figure 3.1
350 400 450 550 650 750
Stabilisation concentration (ppm CO2 eq)
0 20 40 60 80 100 % Margin of uncertainty
Concentration peaking profiles may be preferred to stabilisation profiles, as the former can achieve a better environmental performance at lower costs than the latter
There are different strategies for achieving long-term temperature targets. Traditionally, researchers have looked at the equilibrium temperature associated with a greenhouse gas concentration. However, as part of the temperature increase occurs only slowly, it takes centuries before the equilibrium temperature is reached. Therefore, part of the increase can be prevented by not allowing the temperature to reach this equilibrium level (den Elzen and van Vuuren, 2007). This can be done by reducing concentrations after an initial peak (so-called peaking profiles), instead of stabilising concentrations at a certain level. This is illustrated in Figure 3.2, by comparing a 510 ppm CO2 eq stabilisation profile with a profile that peaks concentration at this level. The 510 ppm stabilisation scenario will most likely lead to an increase in temperature of about 2.2 °C by the end of the century, with steadily increasing temperatures afterwards (to almost 2.7 °C in 2400). If the concentration level would be reduced after stabilisation, temperature increase would peak at about 2.2 °C and be reduced afterwards. Obviously, in the peak scenario more effort is needed after 2080, leading to more costs. However, because costs are usually discounted, the costs difference so-far out in time are not so important (even for low discount rates). This makes the peaking profile the more attractive strategy of the two. It provides a much higher likelihood of staying below the 2 °C target, at only little additional costs (den Elzen and van Vuuren, 2007).
Source: Based on den Elzen and van Vuuren (2007).
Figure 3.2 2000 2100 2200 2300 2400 0 200 400 600 ppm CO2 eq 510 ppm CO2 eq stabilisation profile 510 ppm CO2 eq peaking profile 550 ppm CO2 eq peaking profile Concentration
Peaking versus stabilisation profiles
2000 2100 2200 2300 2400 0 1 2 3 Compared to pre-industrial (°C) Temperature increase