Life Cycle Assessment of two drinking
water production schemes
RIVM Letter report 2015-0209 M.C. Zijp│ H. van der Laan
RIVM Letter report 2015-0209
Page 2 of 34
Colophon
© RIVM 2015
Parts of this publication may be reproduced, provided acknowledgement is given to: National Institute for Public Health and the Environment, along with the title and year of publication.
M.C. Zijp (author), RIVM
H. van der Laan (author), Oasen
Contact: Michiel Zijp DDB
michiel.zijp@rivm.nl
This investigation has been performed by order and for the account of the Ministry of Infrastructure and Environment/ Inspectorate
Environment and Transport, within the framework of project M/300007/15/BA
This is a publication of:
National Institute for Public Health and the Environment
P.O. Box 1 | 3720 BA Bilthoven The Netherlands
Page 3 of 34
Publiekssamenvatting
Levenscyclusanalyse van twee drinkwaterproductieprocessen
Met een zogeheten levenscyclusanalyse (LCA) is het mogelijk om te bepalen welke impact het productieproces van een product heeft op het milieu. De analyse omvat alle stadia die nodig zijn om een product te produceren en te consumeren, dus vanaf het onttrekken van de benodigde grondstoffen tot en met de verwerking van afval. Het doel van een LCA is om alternatieven te vergelijken en ‘hotspots’ in het productieproces in kaart te brengen, zodat het productieproces kan worden geoptimaliseerd. Het RIVM en drinkwaterbedrijf Oasen hebben een LCA uitgevoerd van twee drinkwaterproductieprocessen: een conventionele en een alternatieve.
Bij drinkwaterproductiebedrijven kunnen verschillende technieken worden ingezet om van oppervlaktewater en grondwater drinkwater te maken. De keuze van de technieken is afhankelijk van de kwaliteit van het bronwater. Membraanfiltratie is een techniek waarmee kan worden geanticipeerd op schommelingen in de kwaliteit van het bronwater. Dit is van belang omdat de kwaliteit van de drinkwaterbronnen uit
oppervlaktewater naar verwachting in de toekomst onder druk staat. Membraanfiltratie is daardoor aantrekkelijk om voor drinkwaterproductie te worden gebruikt, alleen gaat deze techniek gepaard met een hoog energieverbruik.
In deze LCA is onderzocht wat de invloed van dit energiegebruik is ten opzichte van de andere onderdelen van het drinkwaterproductieproces. Daarnaast is gekeken hoe dit verandert als alleen windenergie wordt gebruikt bij de productie in plaats van de standaardenergiemix van Nederland. Wanneer uitsluitend windenergie wordt gebruikt, lijkt membraanfiltratie niet slechter voor het milieu dan een conventioneel drinkwaterproductieproces. Deze uitkomst is sterk afhankelijk van de mate waarin de werkwijze van de leveranciers van de benodigde hulpstoffen duurzaam is.
RIVM Letter report 2015-0209
Page 5 of 34
Synopsis
Life Cycle Assessment of two drinking water production schemes
The RIVM and drinking water utility Oasen performed a life cycle
assessment (LCA) of two alternative drinking water production schemes. The LCA provides insight in where in the production process the highest environmental impacts take place. An LCA covers the impact in the whole life cycle of a product or process. Thus from cradle (extraction of resources) to gate (produced product) or grave (disposal of product). In order to anticipate a changing quality of drinking water sources, using membrane filtration as a basis for the drinking water production could be attractive. However, this technique has a high energy demand. This LCA provides insight in the impact of that energy demand, compared to the impact of the other parts of the process. Furthermore, it is analysed how this impact changes when wind energy is used instead of the country mix. In that case, membrane filtration seems to have a
comparable impact on the environment as the conventional alternative to produce drinking water. This result strongly depends on the
production processes of the suppliers of substances required for the drinking water production.
Keywords: drinking water, life cycle assessment, LCA, membrane filtration
RIVM Letter report 2015-0209
Page 7 of 34
Contents
Summary — 9
1 Introduction — 11
2 Goal and Scope — 13
2.1 Goal and target group — 13
2.2 Function, functional unit and reference flows — 13 2.3 Description of production schemes — 13
2.4 System boundaries — 15
2.5 System expansion and allocation — 16 2.6 Data quality — 17
2.7 Life cycle impact assessment — 18
3 Life cycle inventory — 19
3.1 Membrane filtration variant — 19 3.2 Conventional variant — 20 3.3 Background processes — 22 3.3.1 Electricity — 22
3.3.2 Transport — 22
3.3.3 Chemicals and material — 23
4 Results — 25
4.1 Membrane filtration compared to conventional — 25 4.2 Results of sensitivity analyses — 28
5 Discussion — 31
RIVM Letter report 2015-0209
Page 9 of 34
Summary
The goal of this study was to perform a life cycle assessment (LCA) of a new drinking water production process that is in its development phase and an alternative production process. The functional unit was the perceived year production of drinking water with a quality that meets the company standards. The scope was cradle to gate, thus from resources needed to the point the water enters the distribution
networks. Primary data was gathered on the processes at the production plant and the waste water treatment plant, most other processes
(production chemicals used in the process etc.) where based on
European average secondary data (ecoinvent and literature). The results showed that the two alternatives have a comparable impact score. The new process, that is based on membrane filtration, scores better in two of the impact categories (acidification and human toxicity) and
comparable in the other impact categories. The results are subject of change, because the production process is still under development and new technical insights or data will change the model built and thus the results. Performing a LCA in this phase of development provides insight in the hotspots and supports choices on the focus of improvements.
RIVM Letter report 2015-0209
Page 11 of 34
1
Introduction
Drinking water utility Oasen is designing a new drinking water treatment process for their drinking water production plant at Kamerik. They are testing a treatment process with a central role for membrane filtration, seeking for a process that produces drinking water of an impeccable quality, which moreover is independent of changes in quality of the drinking water source. Although Oasens ideal is that sources of drinking water are protected and will increase in quality, like the EU Water Framework (1) prescribes, she also wants to pro-actively anticipate on possible changes in that quality, e.g. due to climate change and/or social demographic changes (2, 3).
Oasen has the following mission: “Drinking water is available for the Oasen-customer at any time, now and in the future, with a quality that is best for human health and a production and distribution process that is best for the environment”. Environment is defined broad and life cycle thinking mentioned as an important element in deciding what is best for the environment.
Membrane filtration is known for its high energy demand. In order to compare the impact of this energy demand with impacts of other parts of the drinking water production process and with an alternative drinking water production scheme, a life cycle assessment (LCA) was performed. The LCA can also provide insight in the hotspots of the perceived
production scheme, and thus on the optimal design from the perspective of environmental impact. A challenge for LCAs of processes or products in the developing stage is the lack of data on how a full-scale operation will perform.
RIVM Letter report 2015-0209
Page 13 of 34
2
Goal and Scope
2.1 Goal and target group
The goal of this study was to compare the environmental impact of two drinking water treatment processes from a life cycle perspective. The results can support the drinking water utility Oasen in their decision and design process towards a new drinking water production plant at
Kamerik. The drinking water process that is now tested by Oasen was compared with a more conventional treatment process. The design of both alternatives was based on state of the art knowledge of water treatment technologies. The results can be used to compare the impacts of the two alternatives, but also to analyze the contribution of the different steps of the alternatives (hotspot analyses). The results are for intern use by the drinking water utility. Because production processes are analyzed that are under development, the LCA will be under development as well. Results presented in this report may alter soon because of new technical insights. The goal is not to give a final judgement on the impact of the two production processes but to
contribute to the development of new production processes by showing where the environmental hotspots are and how they differ between alternatives.
2.2 Function, functional unit and reference flows
The function of the object under study is to produce drinking water that meets the company standards of Oasen: as low as possible degree of hardness and color-intensity, chemical and biological stable, and twice as low as the Dutch standards for prioritaire substances.
The functional unit is a year production of 2.400.000 m3 drinking water
that meets the company standards. Thus the reference flows that are compared in this study are
• 2.400.000 m3/year drinking water produced from groundwater
(river bank infiltrate) produced by a high standard conventional drinking water production scheme; and
• 2.400.000 m3/year drinking water produced from groundwater
(river bank infiltrate) produced by a high standard membrane filtration based drinking water production scheme.
2.3 Description of production schemes
General
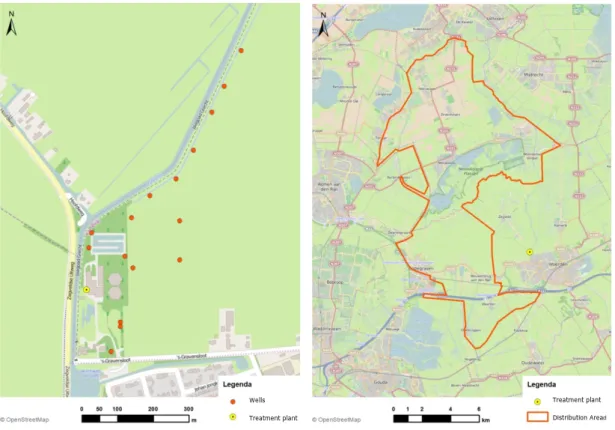
The production plant is located at Kamerik (Figure 1a). The abstraction wells are close to the plant alongside the river. Drinking water produced at Kamerik is delivered in the region marked in Figure 1b.
RIVM Letter report 2015-0209
Page 14 of 34
Figure 1 A) Plant and abstraction wells at Kamerik; B) Region that depends on drinking water production at Kamerik.
Conventional scheme
The scheme of the conventional production process modeled consists of the following steps:
1. Abstract water (river bank infiltrate) and transport to the production plant
2. Biological iron removal with dry filtration (oxygenation and rapid sand filters)
3. Softening 4. Carry over filter 5. Ion exchange 6. Activated carbon 7. Disinfection with UV
Figure 2. High standard conventional production process. AER and RSF: Aeration and Rapid Sand Filtration (biological iron removal); PS: Pellet Softening; COF: Carry-Over filter; IEX: Ion exchange; GAC: Granular Activated carbon; UV: disinfection with UV; CWR: Clean Water Reservoir.
CWR AER COF RSF PS IEX GAC UV Wells Treatment plant Treatment plant Distribution Area
Page 15 of 34
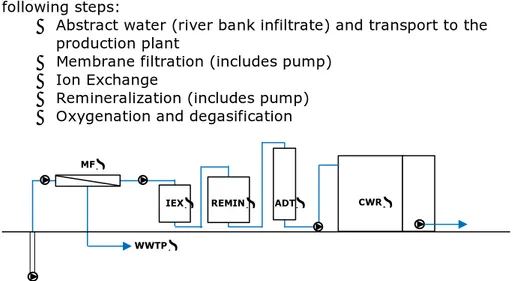
Membrane filtration (MF) scheme
The scheme of the MF production process modeled consists of the following steps:
• Abstract water (river bank infiltrate) and transport to the production plant
• Membrane filtration (includes pump) • Ion Exchange
• Remineralization (includes pump) • Oxygenation and degasification
Figure 3. Membrane filtration based production scheme. MF = membrane filtration; WWTP: waste water treatment plant; IEX: ion exchange; REMIN: remineralisation; ADT: Aeration and Degasification Tower; CWF: Clean Water Reservoir
2.4 System boundaries
A cradle to gate analysis was performed, since it is assumed that the two alternatives have comparable impacts from gate to grave. This however, is under investigation of Oasen, because the MF alternative produces drinking water with another quality than the present quality, and thus the transport to the consumer and the results of using the water might change compared to common practice (less scaling etc.). The research is however not yet in a stage that it can be anticipated on in this study.
The construction and dismantling of the infrastructure of the production plant and abstraction wells (pipes, pumps, buildings, reservoirs,
etcetera) were left out of the scope of this project. It is assumed that their impact per functional unit will be small, because their relative long time of functionality. This assumption is more often used for drinking water production LCAs (4-7) and shown to hold in other studies (4, 8-11).
Thus, the study focusses on the use of energy, chemicals and materials during the treatment process, including cleaning of the systems,
processing waste streams and transport of the chemicals and materials. CWR
IEX WWTP MF
RIVM Letter report 2015-0209
Page 16 of 34
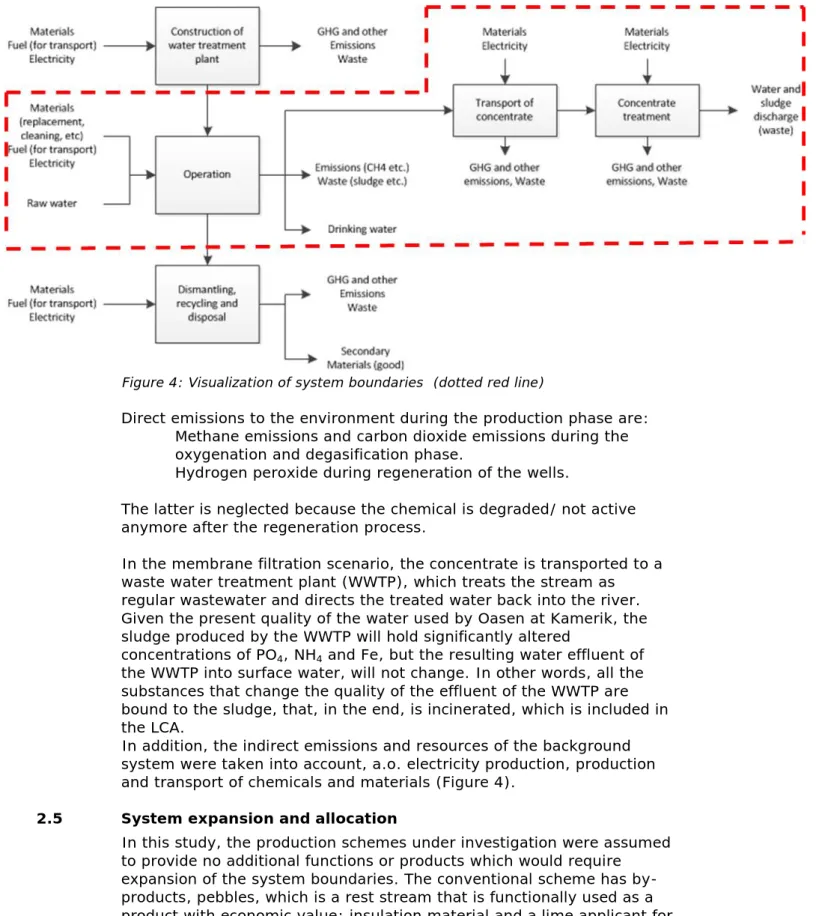
Figure 4: Visualization of system boundaries (dotted red line)
Direct emissions to the environment during the production phase are: • Methane emissions and carbon dioxide emissions during the
oxygenation and degasification phase.
• Hydrogen peroxide during regeneration of the wells.
The latter is neglected because the chemical is degraded/ not active anymore after the regeneration process.
In the membrane filtration scenario, the concentrate is transported to a waste water treatment plant (WWTP), which treats the stream as regular wastewater and directs the treated water back into the river. Given the present quality of the water used by Oasen at Kamerik, the sludge produced by the WWTP will hold significantly altered
concentrations of PO4, NH4 and Fe, but the resulting water effluent of
the WWTP into surface water, will not change. In other words, all the substances that change the quality of the effluent of the WWTP are bound to the sludge, that, in the end, is incinerated, which is included in the LCA.
In addition, the indirect emissions and resources of the background system were taken into account, a.o. electricity production, production and transport of chemicals and materials (Figure 4).
2.5 System expansion and allocation
In this study, the production schemes under investigation were assumed to provide no additional functions or products which would require expansion of the system boundaries. The conventional scheme has by-products, pebbles, which is a rest stream that is functionally used as a product with economic value: insulation material and a lime applicant for gardens. The transport and processing of this stream was allocated to the new function, but the ‘production’ of the rest stream was allocated to the drinking water treatment process. Energy recovery was foreseen
Page 17 of 34
from plastic incineration and biogas generation from the sludge. The total energy use is compensated for this energy recovery.
2.6 Data quality
As far as possible, data on the core system is based on present process data (e.g. chemical dosing, electricity demand, cleaning strategies etc.); experience/expertise within Oasen and, when totally new, consultation of the companies that supply relevant parts of the treatment process (e.g. the remineralisation process). Background data for electricity, chemicals and materials were related to average country specific conditions of the countries where the used chemicals/ materials were produced (e.g. electricity, disposal etc.) or else average European conditions.
For the chemicals and materials for which we could not find satisfying data in existing databases, new treatment processes were modeled based on data provided by the manufactures.
Table 1 shows per datatype the source of the data, which indirectly gives an indication of the quality. Because of the prospective nature of the study (the treatment processes are not yet operating at full scale), the ranges for the uncertainty assessment were hard to quantify for some aspects. When we only apply uncertainty assessment on the elements we do know, the ranges may result in asymmetric results which are questionable.
A sensitivity analysis was performed on the primary data. Minima and maxima of these variables were estimated by experts from Oasen and formed the basis of the sensitivity analysis. All variables were assessed using a triangular distribution and 1000 iterations with Latin Hypercube sampling.
Table 1: Sources of data
Process Alternative Data source Extrapolation
from Abstraction and transport to Kamerik (pumping and regeneration)
Both Oasen Present process
data
Biological iron removal
(including back wash)
Conventional Oasen Test installation
Softening Conventional Oasen Present process data
Carry Over Filter (including back wash)
Conventional Oasen Present process data
IEX Conventional
and MF Manufacturer Average process data provided by manufacturer Active carbon
RIVM Letter report 2015-0209
Page 18 of 34
Process Alternative Data source Extrapolation
from
UV Conventional
and MF Oasen Present process data Membrane
filtration MF Oasen Test-installation Remineralisation MF Oasen/ manufacturers (compare three systems) Test-installation and average process data provided by manufacturer Oxygenation and
degassification MF Oasen Present process data
2.7 Life cycle impact assessment
The LCIA method ReCiPe (12) was used to translate emissions and use of resources into impacts at midpoint level. Midpoints are the impacts that indicate a problem that eventually contribute to the impacts at endpoint, e.g. ozone depletion and climate change. Endpoint is defined as: at the end of the cause-effect chain and represents the impact on what we aim to sustain (biodiversity, human health, resources). In this study, we used midpoint to be able to investigate in more detail to which environmental effects the activities contribute. Table 2 lists the selected impact categories.
Table 2 LCimpact categories used in this study
Category Unit Explanation
Global warming kgCO2eq Impact on global climate change due to
emissions of greenhouse gasses like CO2,
CH4 and N2O
Acidification kgSO2eq of terrestrial ecosystems due to
atmospheric acid forming pollutants Eutrophication Peq of fresh waters due to P emissions Human toxicity 1,4DBeq 1,4 dichloorbenzene, incidences of
diseases due to emissions of toxic substances
Freshwater aquatic ecotoxicity
1,4DBeq 1,4 dichloorbenzene, potential
disappeared fraction of freshwater species due to emissions of toxic substances Cumulative
Page 19 of 34
3
Life cycle inventory
The inventory is given in this report as explicit as possible in order to be able to discuss, improve and recalculate the results.
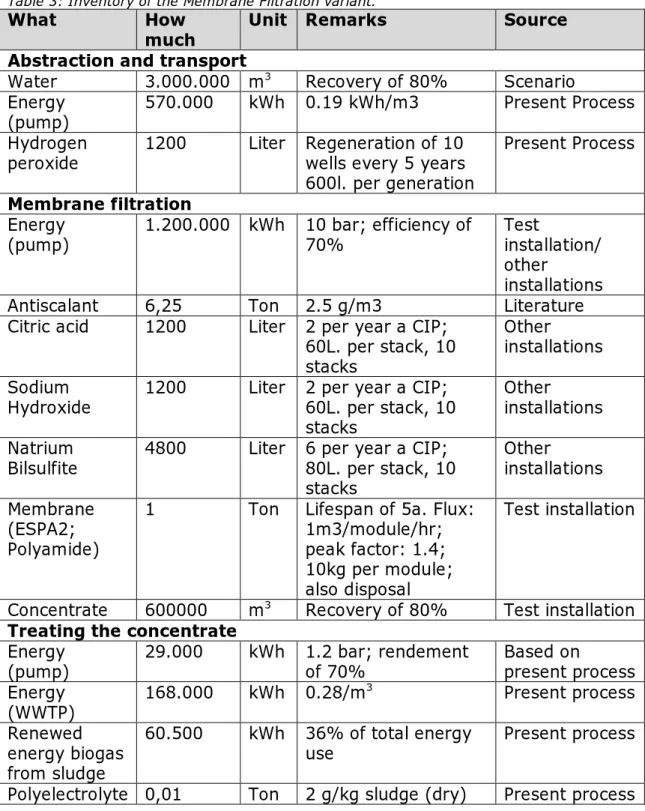
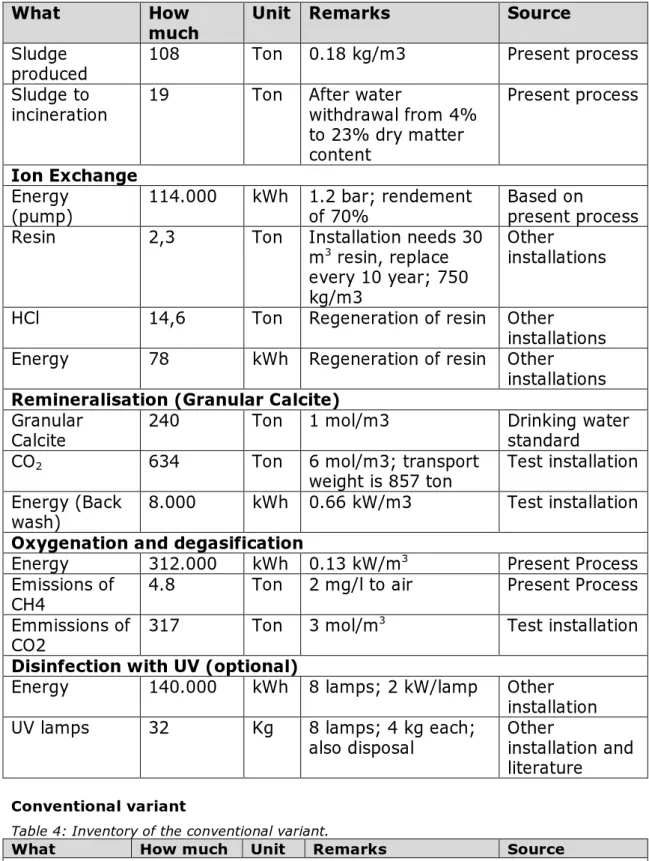
3.1 Membrane filtration variant
Table 3: Inventory of the Membrane Filtration variant.
What
How
much
Unit Remarks
Source
Abstraction and transport
Water
3.000.000 m
3Recovery of 80%
Scenario
Energy
(pump)
570.000
kWh 0.19 kWh/m3
Present Process
Hydrogen
peroxide
1200
Liter Regeneration of 10
wells every 5 years
600l. per generation
Present Process
Membrane filtration
Energy
(pump)
1.200.000 kWh 10 bar; efficiency of
70%
Test
installation/
other
installations
Antiscalant
6,25
Ton 2.5 g/m3
Literature
Citric acid
1200
Liter 2 per year a CIP;
60L. per stack, 10
stacks
Other
installations
Sodium
Hydroxide
1200
Liter 2 per year a CIP;
60L. per stack, 10
stacks
Other
installations
Natrium
Bilsulfite
4800
Liter 6 per year a CIP;
80L. per stack, 10
stacks
Other
installations
Membrane
(ESPA2;
Polyamide)
1
Ton Lifespan of 5a. Flux:
1m3/module/hr;
peak factor: 1.4;
10kg per module;
also disposal
Test installation
Concentrate
600000
m
3Recovery of 80%
Test installation
Treating the concentrate
Energy
(pump)
29.000
kWh 1.2 bar; rendement
of 70%
Based on
present process
Energy
(WWTP)
168.000
kWh 0.28/m
3Present process
Renewed
energy biogas
from sludge
60.500
kWh 36% of total energy
use
Present process
RIVM Letter report 2015-0209
Page 20 of 34
What
How
much
Unit Remarks
Source
Sludge
produced
108
Ton 0.18 kg/m3
Present process
Sludge to
incineration
19
Ton After water
withdrawal from 4%
to 23% dry matter
content
Present process
Ion Exchange
Energy
(pump)
114.000
kWh 1.2 bar; rendement
of 70%
Based on
present process
Resin
2,3
Ton Installation needs 30
m
3resin, replace
every 10 year; 750
kg/m3
Other
installations
HCl
14,6
Ton Regeneration of resin Other
installations
Energy
78
kWh Regeneration of resin Other
installations
Remineralisation (Granular Calcite)
Granular
Calcite
240
Ton 1 mol/m3
Drinking water
standard
CO
2634
Ton 6 mol/m3; transport
weight is 857 ton
Test installation
Energy (Back
wash)
8.000
kWh 0.66 kW/m3
Test installation
Oxygenation and degasification
Energy
312.000
kWh 0.13 kW/m
3Present Process
Emissions of
CH4
4.8
Ton 2 mg/l to air
Present Process
Emmissions of
CO2
317
Ton 3 mol/m
3
Test installation
Disinfection with UV (optional)
Energy
140.000
kWh 8 lamps; 2 kW/lamp
Other
installation
UV lamps
32
Kg
8 lamps; 4 kg each;
also disposal
Other
installation and
literature
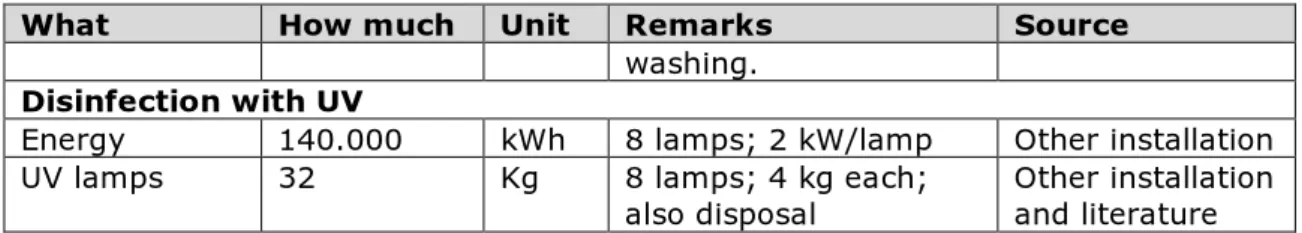
3.2 Conventional variant
Table 4: Inventory of the conventional variant.
What How much Unit Remarks Source
Abstraction and transport
Water 2.500.000 m3 Scenario
Energy
(pump) 480.000 kWh 0.19 kWh/m3 Present Process Hydrogen
peroxide 1200 Liter Regeneration of 10 wells every 5 years 600l. per generation
Page 21 of 34
What How much Unit Remarks Source
Biological iron removal
Energy
(oxygenation) 312.000 kWh 0.13 kWh/m3 Present process Sand 44 Ton 25m3 water per bed
per hour; 50m3 sand
per bed; sand weights 1600 kg/m3; after 20
years renewal of bed.
Test installation
Energy (Back
wash) 16.000 kWh 0.66 kW/m3 Present process Ch4 emissions 4.8 Ton 2 mg/l Present process
Softening
Sodium
Hydroxide 480 Ton 200 ton/Mm
3 Present process
Sulfuric Acid 480 Ton 200 ton/Mm3 Present process
Sand 83 Ton 40 ton/Mm3 Present process
Pellets 710 Ton 0.3 kg/m3; Disposal reuse as, a.o.
insulation material
Present process
Carry Over filter
Sand 44 Ton 25m3 water per bed
per hour; 50m3 sand
per bed; sand weights 1600 kg/m3; after 20
years renewal of bed.
Test installation Energy (Back wash) 47.000 kWh 0.66 kW/m 3 Present process Sludge 257 Ton Ion Exchange
Resin 2.3 Ton Installation needs 30 m3 resin, replace every
10 year; 750 kg/m3
Other installations HCl 14.6 Ton Regeneration of resin Other
installations Energy 78 kWh Regeneration of resin Other
installations
Waste water 1630 m3 To WWTP Other
installations Active carbon New active carbon 5 Ton 1m 3 AC filters 37.500 m3 water; 1 m3 AC weights 400 kg; 15% loss of AC during regeneration of AC and 5% due to back washing. Other installations Regeneration
active carbon 26 Ton 1m
3 AC filters 37.500 m3 water; 1 m3 AC weights 400 kg; 15% loss of AC during regeneration of AC and 5% due to back Other installations and literature
RIVM Letter report 2015-0209
Page 22 of 34
What How much Unit Remarks Source
washing.
Disinfection with UV
Energy 140.000 kWh 8 lamps; 2 kW/lamp Other installation UV lamps 32 Kg 8 lamps; 4 kg each;
also disposal Other installation and literature
3.3 Background processes
3.3.1 Electricity
Electricity was modeled with the for The Netherlands specific electricity mix of the Ecoinvent database. However, Oasen holds a Green Energy Certificate of EON, which is covered by wind energy by EON. For the LCA, we modeled wind electricity based on the wind electricity mix in Dutch electricity mix in Ecoinvent. It is assumed that all processes outside the production plant (production chemicals, waste treatment RWZI etcetera use the country specific electricity mix. The way we modeled wind energy is not entirely ISO proof. E.g. ISO 14067 on carbon footprints does not allow compensation of ‘green certificates’. In order not to create an offset (double count of the wind energy produced in the Netherlands), the electricity mix for the Netherlands could be corrected for the wind-energy claim of Oasen. Compared to the total produced amount of wind energy in the Netherlands (29.000 megawatt in 2014), the use of Oasen is so small that for this study it was not considered necessary to compensate for this offset.
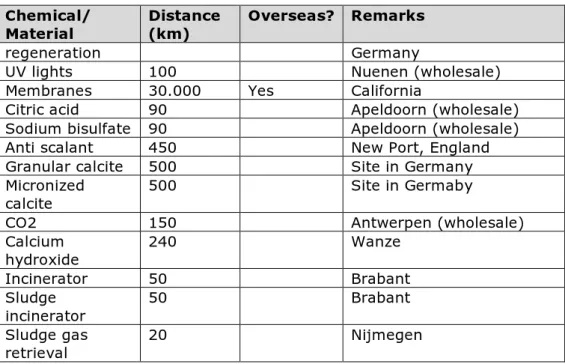
3.3.2 Transport
Transport for most materials and chemicals were modeled with the lorry 16-32t, EURO 5 from the Ecoinvent database. It describes average resource demand and emissions from operation (neglecting construction of truck and road infrastructure) depending on weight and transport distance.
Transport of materials and chemicals that come from overseas were modeled with the freight, sea, transoceanic tanker from the eco-invent database.
Transport distances were as much as possible based on primary data. Part of the transport distances could only be retrieved to the wholesale headquarters location, which is not necessarily the production location.
Table 5 Transport distance per material/chemical/disposal
Chemical/
Material Distance (km) Overseas? Remarks
Hydro peroxide 90 Apeldoorn (wholesale)
Sand 80 East Groningen
Sodium
hydroxide 180 Brussels (wholesale)
Sulfuric Acid 90 Apeldoorn (wholesale)
IEX resin 700 Production location
Germany Active Carbon
new 700 Production location Jacobi in France Active Carbon 600 Regeneration plant in
Page 23 of 34
Chemical/
Material Distance (km) Overseas? Remarks
regeneration Germany
UV lights 100 Nuenen (wholesale)
Membranes 30.000 Yes California
Citric acid 90 Apeldoorn (wholesale) Sodium bisulfate 90 Apeldoorn (wholesale) Anti scalant 450 New Port, England Granular calcite 500 Site in Germany Micronized
calcite 500 Site in Germaby
CO2 150 Antwerpen (wholesale)
Calcium hydroxide 240 Wanze Incinerator 50 Brabant Sludge incinerator 50 Brabant Sludge gas retrieval 20 Nijmegen
3.3.3 Chemicals and material
Table 6 reference to data for chemicals/materials + sources
Chemical/ Material
Hydro peroxide Conform STOWA 2012-06: Hydrogen peroxide, 50% in H2O plant (RER)
Sand Conform STOWA 2012-06: Per ton: 1 ton Silica sand, 7.5 kWh electricity, 0.19 MJ heat.
Sodium hydroxide Conform STOWA 2012-06: Sodium Hydroxide, 50% in H2O, membrane cell, at plant (RER)
Sulfuric Acid Conform STOWA 2012-06: Sulphuric acid, liquid, at plant (RER)
IEX resin Cationic resin CH Active Carbon
(AC) new Conform STOWA 2012-06: For 1 kg AC: 3 kg hard coal, 1.6 kwh electricity, 12 kg steam and 0.33 m3 natural gas
Active Carbon
regeneration Conform STOWA 2012-06: Same as AC, but without hard coal UV lights 96% glass, 2% steel, 2% copper, 30 mg mercury
per lamp; disposal includes recovery of mercury (13)
Membranes Glass fibre reinforced plastic, polyamide, injection moulded, global market; Extrusion, global market. (9)
Citric acid Citric acid, global market Sodium bisulfate Sodium sulfite, global market
Anti scalant Conform STOWA 2012-06: Polycarboxylates, 40% active substance at plant (RER)
Polyelectrolyte Modeled conform STOWA 2012-06 as poly-acrylamide homopolymeer
Granular calcite Calcium carbonate > 63 microns, production, at plant EU-27
RIVM Letter report 2015-0209
Page 24 of 34
Chemical/ Material
Micronized calcite Calcium carbonate > 63 microns, production, at plant EU-27
CO2 Carbon dioxide liquid, at plant (RER) Calcium hydroxide Modeled based on data of manufacturer Incinerator
membrane Waste incineration of plastics (PE, PP, PS, PB), EU-27 Sludge incinerator Modeled based on Afman and Korving (14)
Sludge gas
Page 25 of 34
4
Results
4.1 Membrane filtration compared to conventional
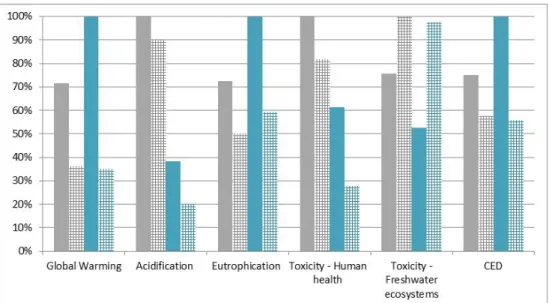
A comparison of all impact categories is summarized in Figure 5,
normalized against the scenario with the highest impact. It reveals that, when using wind energy, the membrane filtration variant scores better than the conventional high standard variant on most impact categories except for eutrophication. The production process of liquid CO2has the
largest contribution to eutrophication.
Figure 5 Comparison of the two alternatives with the two different electricity sources NL mix and wind electricity, relative to the scenario with the highest impact for that category; CED = cumulative energy demand.
Cumulative energy demand
The impacts per impact category per scenario are visualized in Figure 6. Energy demand is largely driven by the second production step (the membrane filtration) for the membrane filtration variant, which is largely reduced by using wind energy. The largest energy demand for the conventional variant is in the third step, which is softening.
Changing from the Dutch NL mix to wind energy has a higher impact on the membrane filtration variant than on the conventional variant, because the latter process depends more on chemicals that are
produced elsewhere. Particularly, production of NaOH has a large energy demand. Both alternatives end up with comparable energy demand when using electricity from wind at the drinking water production plant.
RIVM Letter report 2015-0209
Page 26 of 34
Figuur 6 Impact on climate change, acidification, toxicity for humans and fresh water ecosystems, eutrophication and the cummulative energy demand of the two production scenarios (membrane filtration and conventional high standard) and the two energy sources (Dutch country mix and windenergy) of the
production of 2.4 milliion m3 drinking water. The x-axis reflects the production
steps and corresponds with Figures 2 and 3.
Climate change
The carbon footprint per production step shows a comparable pattern and conclusion as the Cumulative Energy Demand (CED). In the fourth step (oxygenation and degasification), the carbon footprint of the membrane variant rises largely due to emissions of CH4 and CO2 at the
plant (the degasification part), which is the largest contributor to this impact category (Figure 7).
Acidification
Emissions during production and use of chemicals that are needed for the softening step, especially sulfuric acid, contribute most to
acidification. Acidification is further caused by transport (25%) and electricity use (28%, see Figure 7).
Human toxicity
Emissions during production and use of chemicals that are needed for the softening step, especially sulfuric acid, contribute most to human toxicity (conventional variant only). For the membrane filtration variant, human toxicity is largely driven by energy use.
Page 27 of 34
Fresh water ecotoxicity
The use of wind energy increases the impact on freshwater ecotoxicity. This is due to emissions of metals, which, because of their long
residence time in the environment, are estimated to have relative large impacts on species. Furthermore, the chemicals used at the softening step (3) of the conventional variant contribute relatively much to the ecotoxicological impact.
Eutrophication
Eutrophication is largely driven by the production of liquid CO2.
Contribution analysis
The contribution analysis of the membrane filtration variant (Figure 7) and the conventional variant (Figure 8) differ considerably. Most impacts of the conventional variant are largely driven by production of the
chemicals and materials used during the treatment process. Especially the production of sodium hydroxide shows to have a significant
contribution to the total impact for most impact categories and sulfuric acid to acidification and toxicity.
Figure 7. Contribution analysis of various processes in the membrane filtration scenario (wind energy).
RIVM Letter report 2015-0209
Page 28 of 34
Figure 8. Contribution analysis of various processes in the conventional scenario (wind energy).
4.2 Results of sensitivity analyses
A sensitivity analysis has been performed by varying the variables between minima and maxima based on expert judgement of Oasen experts. Figure 9 shows the results of this sensitivity analysis for the three impact categories for which the differences between the two variants are small: climate change, fresh water ecotoxicity and eutrophication. The results show that the two variants do not differ significantly based on this analyses. Uncertainties in the background processes and LCIA characterization factors are not taken into account, but would only increase the uncertainty margins and thus support the conclusion that there is no significant difference between the impacts of these two variants.
For the membrane filtration variant, the results are most sensitive for the chosen recovery for all impact categories. The impact of the
conventional variant (with wind energy) is most sensitive for the NaOH dosing.
Page 29 of 34 Figure 9. 5th, 50th and 95th percentile of the uncertainty distribution for the three
RIVM Letter report 2015-0209
Page 31 of 34
5
Discussion
Compare the two variants
The membrane filtration variant is estimated to have less (acidification, human toxicity) or a comparable (climate change, fresh water
ecotoxicity, eutrophication and CED) impact compared to the high standard conventional variant when taking into account procurement of wind energy instead of the Dutch electricity mix.
The impact of the conventional variant is largely indirect, via purchase of chemicals, while the impact of the membrane filtration variant is largely driven by direct energy use and emissions at the plant.
Oasen considers adding UV to the production process of the membrane filtration variant. The conclusions of this report will not change
significantly by adding that step.
Hotspots conventional variant
The use of chemicals produced elsewhere determine the impact. Especially the production of NaOH and sulfuric acid. Using supplier specific data instead of the secondary data that are used in this study, will improve the assessment and potentially change the results. For example, we used European average production data on NaOH production, but it could be possible that the NaOH supplier of Oasen uses a sustainable energy source. In that case, the hotspot might shift to another process in the life cycle, such as transport or to production of another additive.
Hotspots membrane filtration variant
The emission of CO2 and CH4 during the degasification phase and the
purchase of liquid CO2 contribute significant to climate change and
eutrophication. Catching these emissions and reuse the CO2 part in the
production process might reduce these impacts when observed from a life cycle perspective. It would also save on required transport.
Sensitivity
The study is prospective. The gathered data may differ from the eventual full scale drinking water production plant. Chemicals and energy use are extrapolated from other production schemes or estimates of manufacturers. The sensitivity of the analyses for these estimated data was carried out by setting minima and maxima for those variables and performing a sensitivity analysis. The membrane filtration variant is especially sensitive for the chosen recovery of the membrane filtration. Changing the source of primary energy used from the Dutch electricity mix to only wind electricity, does not change the fact that recovery is the most influential variable. However, the energy related to the variables ‘pressure for membrane filtration’, ‘energy for abstraction’ and ‘energy for oxygenation’ are replaced by the dosing of calcite and CO2 for remineralization and the transport of calcite from France and
Spain to the Netherlands. In other words, the next challenge to reduce the carbon footprint of the production process, after changing to a renewable energy source, is to purchase materials and chemicals from
RIVM Letter report 2015-0209
Page 32 of 34
suppliers that have comparable ambitions. It is also recommended to find sources as nearby as possible or reduce the impact of transport. Perhaps this is already the case. For most of these processes, generic data were used. Supplier specific data would improve the utility of this LCA as a hotspot analysis.
System boundaries
We assumed in this study that the distribution and use of the produced water would not change. However, the quality of the water that can be produced with membrane filtration is such that this system boundary could be challenged. For example, resulting reduction of scaling could increase the use phase of household equipment such as washing machines.
Other impacts
The results of this study can be used for a sustainability assessment that includes more considerations, like robustness (anticipation of fluctuating raw water quality in the future), investment costs and production costs, water use (membrane filtration uses more water), from waste to
resource (conventional treatment produces side products, e.g. pellets).
Snapshot of development process
Because the drinking water production process is under development, this LCA is also under development. The model itself can be updated during the further development of the production process. Thus, the results presented in this background paper are a snapshot and will alter rapidly.
To be continued
The results trigger new research questions. The following will be further investigated:
• Can methane emissions be eliminated, e.g. with a helophyte filter?;
• Can CO2 be withdrawn from the air on the production plant,
instead of purchasing liquid CO2?;
• Get in contact with suppliers to gain factual data on their production processes, to improve the LCA;
• Verification of the LCA results by monitoring the processes at a new comparable plant that uses membrane filtration
(Lekkerkerk);
• Adding production costs to the model;
• Investigate if local solar energy would further improve the impact of energy use at the production plant.
Furthermore, various technical choices for the production process at Kamerik could now be investigated with the model, e.g. replace anti-scalant by calcium chloride and sodium hydroxide.
For now, this study provides a good first insight in the environmental performance of the two techniques and supports the further design of a sustainable production process.
Page 33 of 34
6
References
1. Directive no 2000/60/EC of the European Parliament and of the Council of 23 October 2000 establishing a framework for Community action in the field of water policy, (2000).
2. Wuijts S., Bak-Eijsberg C.I., Van Velzen E.H., N.G.F.M. VdA.
Effecten klimaatontwikkeling op de waterkwaliteit bij innamepunten voor drinkwater. Analyse van stofberekeningen. Bilthoven, The Netherlands: National Institute for Public Health and the
Environment, 2012 RIVM 609716004.
3. Wuijts S., Buscher C.H., Zijp M.C., Verweij W., Moermond C.T.A., de Roda Husman A.M., et al. Prospective study of the drinking water supply in the Netherlands RIVM report 609716001 2011.
4. Amores MJ, Meneses M, Pasqualino J, Antón A, Castells F.
Environmental assessment of urban water cycle on Mediterranean conditions by LCA approach. Journal of Cleaner Production.
2013;43:84-92.
5. Mohapatra PK, Siebel MA, Gijzen HJ, Van der Hoek JP, Groot CA. Improving eco-efficiency of Amsterdam water supply: A LCA approach. Journal of Water Supply: Research and Technology - AQUA. 2002;51(4):217-27.
6. Tarnacki K, Meneses M, Melin T, Van Medevoort J, Jansen A. Environmental assessment of desalination processes: Reverse osmosis and Memstill®. Desalination. 2012;296:69-80. 7. Barrios R, Siebel M, van der Helm A, Bosklopper K, Gijzen H.
Environmental and financial life cycle impact assessment of drinking water production at Waternet. Journal of Cleaner Production.
2008;16(4):471-6.
8. Ribera G, Clarens F, Martínez-Lladó X, Jubany I, V.Martí, Rovira M. Life cycle and human health risk assessments as tools for decision making in the design and implementation of nanofiltration in drinking water treatment plants. Science of the Total Environment. 2014;466-467:377-86.
9. Muñoz I, Fernández-Alba AR. Reducing the environmental impacts of reverse osmosis desalination by using brackish groundwater resources. Water Research. 2008;42(3):801-11.
10. Raluy RG, Serra L, Uche J. Life Cycle Assessment of water
production technologies. Part 1: Life Cycle Assessment of different commercial desalination technologies (MSF, MED, RO). International Journal of Life Cycle Assessment. 2005;10(4):285-93.
11. Raluy RG, Serra L, Uche J, Valero A. Life cycle assessment of water production technologies. Part 2: Reverse osmosis desalination versus the Ebro River Water Transfer. International Journal of Life Cycle Assessment. 2005;10(5):346-54.
12. Goedkoop M, Heijungs R, Huijbregts MAJ, De Schryver AM, Struijs J, Van Zelm R. ReCiPe 2008. A life cycle impact assessment method which comprises harmonised category indicators at the midpoint and the endpoint level. . 2009.
13. Remy C. Life cycle assessment and life cycle costing of tertiary treatment schemes. Berlin: Kompetenz Zentrum Wasser Berlin, 2013.
RIVM Letter report 2015-0209
Page 34 of 34
14. Afman MR, Korving L. Detailanalyse SNB-monoverbranding, effect fosfaathergebruik. Delft: CE Delft, 2013 Contract No.: 13.2847.30a.