March 2004 ECN-C--04-029
SECTORAL CO
2EMISSIONS IN THE NETHERLANDS
UP TO 2010
Update of the Reference Projection for Policy-making
on Indicative Targets
P.G.M. Boonekamp B.W. Daniels A.W.N. van Dril
P. Kroon J.R. Ybema
Acknowledgement
The unit Policy Studies of the Energy research Centre of the Netherlands (ECN) conducted this study for the Netherlands Ministry of Spatial Planning, Housing and the Environment between August 2002 and October 2003, in collaboration with the Netherlands Environmental Assess-ment Agency (MNP), which is part of the National Institute for Public Health and the Environ-ment (RIVM). The report is registered under ECN project number 7.7998.04.01 and RIVM re-port number 773001025. This rere-port is the translation of a Dutch rere-port, which was published in December 2003 (ECN report number ECN-C--03-095). The translators, Mrs M.E. Kamp of ECN and Mrs R. de Wijs of RIVM, are gratefully acknowledged for their efforts.
Abstract
The Dutch government is aiming to formulate Indicative Targets for maximum sectoral CO2
e-mission levels in 2010. To this end, ee-mission levels expected in the future were determined in this study for four sectors: Households and Services, Agriculture, Transportation and Indus-try/Energy, with heavy reliance on the Reference Projection for energy and greenhouse gases in the Netherlands. Published in 2002, the Reference Projection has been used to evaluate the pro-gress in realising the national climate change policy in the Netherlands. The Reference Projec-tion, since updated to accommodate a number of newly implemented policy measures, focuses on partial changes in future CO2 emissions; a detailed overview of developments with respect to
energy use, energy saving, fuel mix or energy costs is not included in this projection. The results of the study have led to some adjustments to the energy trends up to 2010 and to extra emission changes after discussion with the relevant sector representatives. Results for the Industry/Energy sector in 2005 are of special interest, because they play a role in the development of the Dutch National Allocation Plan under the EU Emission Trading Scheme.
The report starts by defining the new sectoral emission format and fitting the base year figures to the updated national emission statistics, with a substantial downward correction of industrial emissions being implemented. Next, three rounds of recent policy updates, totalling more than 40 emission changes, are described. Collectively, these policy updates also provide for a signifi-cant decrease in future emission levels. Results are then presented for the national level and the four different sectors mentioned above. In the Industry/Energy sector, emissions increase due to adjustments to the previously expected trends in the outlook. All changes in emissions taken collectively lead to a total emission in 2010 in accordance with present GHG policy. Finally, as a contribution to the discussion on allocation of emission rights, the results for Industry/Energy are compared to future emission levels according to sector expectations, as expressed by the re-spective representatives. The sector perceptions that showed diversion from the study results are also described; diversion may be explained by such factors as differences in expected growth rates.
CONTENTS
SUMMARY 5
1 INTRODUCTION 9
2 FINE-TUNING OF DEFINITIONS AND CATEGORIES OF EMISSION DATA 11 2.1 Fine-tuning the definitions between RIVM and ECN 11 2.2 CO2 emission categories for Indicative Targets 12
2.3 Emission 2000 in the new format 14
3 ADJUSTMENTS FOR RECENT POLICY AND TRENDS 15
3.1 Pipeline policy 15
3.2 Strategic Agreement 16
3.3 Framework Agreement and sector trends 16
4 NATIONAL RESULTS OF THE TOTAL REFERENCE PROJECTION UPDATE 18
4.1 Development of total CO2 emissions 18
4.2 Achievements and starting points in Reference Projection 19
4.3 Uncertainties in emission figures 20
5 HOUSEHOLDS AND SERVICES 21
5.1 Households 21
5.1.1 Main determining factors 21
5.1.2 Existing policy and recent adjustments 21
5.1.3 Other adjustments 23
5.1.4 Development of emissions in household sector until 2010 23
5.2 Services sector 23
5.2.1 Main determining factors 24
5.2.2 Existing policy and recent adjustments 24
5.2.3 Other adjustments 25
5.2.4 Development of emission services until 2010 26
5.3 Total Households and Services 26
6 AGRICULTURE AND HORTICULTURE 28
6.1 Main determining factors 28
6.2 Existing policy and recent adjustments 28
6.3 Other adjustments 30
6.4 Development of emissions until 2010 30
7 INDUSTRY AND ENERGY 32
7.1 General 32
7.2 Industry 32
7.2.1 Main determining factors 32
7.2.2 Existing policy and recent adjustments 33
7.2.3 Other adjustments 34
7.2.4 Development of emissions Industry until 2010 35
7.3 Energy sector 36
7.3.1 Main determining factors 36
7.3.2 Existing policy and recent adjustments 37
7.3.3 Oil refineries 39
7.3.4 Decentralised cogeneration 41
7.3.5 Central electricity production 42
7.3.6 Development of emissions in the energy sector until 2010 44
7.4 Emissions Industry/Energy until 2010 45
7.4.1 Adjustments to Reference Projection 45
8 TRANSPORT 47
8.1 Main determining factors 47
8.2 Existing policy and recent adjustments 47
8.3 Other adjustments 48
8.4 Emissions of transport sector until 2010 48
9 COMPARISON WITH TRADE PARTICIPANTS EMISSIONS AND SECTOR
REPRESENTATIVES EXPECTATIONS 51
9.1 Emissions from participants within the emission trading scheme 51 9.1.1 Comparing the results of VBE with the Reference Projection update 51
9.1.2 Conclusions 52
9.2 ECN/RIVM reaction to information from sector representatives 53
9.2.1 Introduction 53 9.2.2 Paper industry 53 9.2.3 Chemical industry 53 9.2.4 Base metal 54 9.2.5 Refineries 54 9.2.6 Electricity production 55
9.2.7 Agriculture and horticulture 56
9.2.8 Generic conclusions 57
REFERENCES 58 APPENDIX A SECTOR RESPONSES TO THE REFERENCE PROJECTION UPDATE 60
A.1 Introduction 60
A.2 Paper industry 60
A.3 Chemical industry 61
A.4 Base metal industry 62
A.5 Refineries 62
A.6 Electricity production 63
A.7 Agriculture and horticulture 65
APPENDIX B OVERVIEW OF ALL EMISSION MUTATIONS 68
SUMMARY
Introduction
The climate policy evaluation document, ‘The progress of the Netherlands climate change pol-icy: an assessment at the 2002 evaluation moment’, (VROM, 2002) states the desire for more certainty on the realisation of the Dutch CO2 emission target between 2008 and 2012. More than
in the past, the responsibility for meeting this target is now allocated to the various ministries as emission levels are formulated per sector (Indicative Targets). In this way the effort required from the target groups becomes transparent. The Indicative Targets only apply to CO2; these are
formulated by the Netherlands Ministry of Spatial Planning, Housing and the Environment (VROM) in consultation with the other ministries involved (Ministry of Transport, Public Works and Water Management; Ministry of Agriculture, Nature and Food Quality and Ministry of Economic Affairs) and the VROM General-Directorate for Housing. Estimates for CO2
emis-sions from ECN and RIVM up to 2010 are used as starting point for formulating sectoral Indica-tive Targets.
Estimated emissions
ECN and RIVM determined the expected development of CO2 emissions up to 2010 in a
Refer-ence Projection, which was published in January 2002 (see Table S.1, last column). This has been updated to allow sectoral Indicative Targets to be formulated. The expected updated emis-sions in 2010 are given in the fourth column. For comparison, the CO2 emissions for 2000,
based on the most recent Emission Registration data, are also provided, as well as an estimate of emissions in 2005. The expected total emission in 2010 is equal to the Kyoto target of 186 Mton. This is partly the result of extra policy measures but also of a number of other ad-justments.
Table S.1 Estimated CO2 emissions [in Mton] in the Reference Projection update and the
Reference Projection, 2002
Reference Projection Update Reference Projection 2002
Indicative Target Sector 20001 2005 2010 2010
Agriculture/Horticulture 8.1 7.7 6.5 8.3
Transport 35.2 36.8 38.3 36.4
Households and Services 31.7 30.1 29.0 30.5
Industry/Energy 101.2 109.0 112.2 115.3
Industry and Construction 37.8 40.7 42.9 55.8
Energy 63.4 68.3 69.2 59.5
Total 176.1 183.6 186.0 190.5
Adjustments to the Reference Projection
The emission figures from the Reference Projection have been adjusted in three ways (see Fig-ure S.1). The first adjustment involved the allocation of the emissions to four Indicative Target Sectors (ITS): Households and Services, Agriculture/Horticulture, Transport and Indus-try/Energy. These sectors correspond roughly with the responsibilities of the Netherlands Minis-try of Spatial Planning, Housing and the Environment (VROM), the MinisMinis-try of Agriculture, Nature and Food Quality, the Ministry of Transport, Public Works and Water Management and the Ministry of Economic Affairs. The figures for the base year 2000 have been adjusted in agreement with the most recent figures from the Emission Registration. These corrections also affect future emissions.
The second adjustment involved a large number of changes (minor and major) in current policy, which had taken place after the formulation of the Reference Projection (mid-2001). Here we are concerned with ‘policy in the pipeline’ changes leading to emission reduction in 2010 (total -4.0 Mton), measures from the Strategic Agreement between political parties (2002, a total of +0.2 Mton) and measures in the recent Framework Agreement (a total of -0.1 Mton).
The third adjustment was based on a consultation of the target groups in the spring of 2003 and realised developments that were still uncertain in the Reference Projection of 2002.
Reference Projection-2010 • Energy and CO2 • Greenhouse Gases
Fine-tuning of the definitions by ECN, RIVM and VROM
Changes in policy
Changes based on realisation of reduction and sector comments
Sectoral CO2 emissions up to 2010
Update - Reference Projection for Indicative Targets
Reference Projection-2010 • Energy and CO2 • Greenhouse Gases
Fine-tuning of the definitions by ECN, RIVM and VROM
Changes in policy
Changes based on realisation of reduction and sector comments
Sectoral CO2 emissions up to 2010
Update - Reference Projection for Indicative Targets
Figure S.1 Flow chart for determining ‘Sectoral CO2 emissions up to 2010’
Overview of emission changes up to 2010
Table S.2 shows the results of the adjustments with respect to the figures in the ECN/RIVM re-port, Referentieraming energie en CO2 (‘Reference Projection on Energy and CO2’)
2001-2010’, dating from 2002. Further details can be found in the individual chapters arranged per
sector.
The difference in ‘Fine-tuning of the definitions’ is, first of all, a consequence of new sector de-finitions2. The emissions from mobile equipment in the sectors: Agriculture/Horticulture,
Ser-vices (part of ITS Households and SerSer-vices) and Construction (part of ITS Industry) have been transferred to ITS Transport. This has no consequences for the total emission, however. The large mutations within Industry/Energy are the result of a different allocation of cogeneration production. Moreover, emission in the Industry sector has been adjusted downwards because of a double counting in previous Emission Registrations (-3.8 Mton). The total adjustment after the fine-tuning of the definitions amounts to -2.5 Mton. Of this amount, +1.2 Mton is the result of definition adjustment and -3.7 Mton stems from revised figures from the Emission Registration.
2 The difference with the RIVM/ECN report ‘Reference Projection Greenhouse Gases 2001-2010’ (2002) is that
Table S.2 Adjustment of CO2 emissions in 2010 compared to the 2002 Reference Projection
[Mton]
Indicative Target Sector Fine-tuning of definitions
Policy changes Mutation trends in sectors
Agriculture/Horticulture -1.0 -0.8 0
Transport +3.0 +0.3 -1.4
Households and Services -1.8 +0.3 0
Industry/Energy -2.7 -3.7 +3.2
- Industry and Construction -13.5 -0.0 +0.6
- Energy +10.8 -3.7 +2.6
Total -2.5 -3.9 +1.8
In order to be able to adhere to international reporting obligations, the national Emission Regis-tration method needs to be improved. The possibility that future improvements may lead to more CO2 emissions than estimated in the Reference Projection cannot be excluded. The
wind-fall reduction that climate policy experienced this year may be counteracted by future setbacks. The total effect of policy adjustments on CO2 emission is determined by the balance of positive
and negative contributions of approximately 40 policy changes. The most important policy ad-justments, in terms of reduction volume, are found in the Coal Agreement (-1.5 Mton above the reductions already included in the Reference Projection 2002); the Borssele nuclear power plant, if kept in production (-1.4 Mton); the horticulture regulation (-0.8 Mton) and the introduc-tion of the ‘environmental quality of electricity producintroduc-tion’ (MEP) subsidy scheme for renew-able energy (-0.4 to 0.5 Mton). The termination of the Energy Premium Scheme (EPR subsi-dies) is the measure that resulted in the largest increase in emissions (+0.6 Mton).
The adjustments in sectoral trends involve mainly developments in transport and indus-try/energy. Developments in fuel mix for the car fleet and in passenger car use are beneficial for reducing CO2 in transport. Industry is dealing with a larger growth in physical production, on
the one hand, and a smaller growth in cogeneration (balancing out to +0.6 Mton) on the other. Power plants are facing a higher electricity demand from companies and a lower electricity de-mand from households, a smaller growth in cogeneration production in industry and some inter-nal changes that will lead to an increase in emissions (balancing out to +2.6 Mton).
Translation into Indicative Targets
In the Reference Projection2002 future developments are assessed on the basis of a number of driving factors. Here, several uncertain factors play a role e.g.:
• economic development, especially in the energy-intensive industry, • the transition towards more liberalised markets for gas and electricity, • the solidity of historical figures,
• the effect of policy measures.
The effect of these uncertain factors has been analysed in the Reference Projection 2002, where the margin for total emissions in 2010 is established at 191 +/- 12 Mton.
The same margin, i.e. a CO2 emission of 186 +/- 12 Mton, is used for 2010 in the update of the
Reference Projection. The sector representative consultation has confirmed the presence of vari-ous socio-economic uncertainties. The liberalisation trend has also become somewhat clearer with respect to the energy and emission effects. Yet, the intended introduction of the CO2
emis-sion trade is creating new uncertainties about emisemis-sion reductions in the industrial and energy sectors. The uncertainty of historical data manifested itself strongly in the earlier mentioned substantial adjustment of the emission figure for 2000. As for policy uncertainties, ECN and RIVM maintain their doubts about the estimated reductions as a result of the glasshouse cultiva-tion regulacultiva-tion and the Coal Agreement for power plants.
The manner in which the uncertainty margin is taken into account is a matter of policy. The total of expected emissions per sector constitutes the Dutch target for 2010 (± 186 Mton). Statisti-cally speaking, there is a 50% chance that this target will not be reached. In order to increase the chances of achieving the CO2 target, the Indicative Targets should be lower than the sectoral
emissions that were estimated in this report. Another option to improve the chance of meeting the CO2 target is to have a set of reduction measures in reserve that can be activated at short
no-tice if existing policy measures are insufficient.
Comparison with information on social groups
Dutch companies that are obliged to participate in the EU emission trade system are responsible for approximately 57% of total Dutch CO2 emissions. According to the Benchmarking
Verifica-tion Agency for energy efficiency (VBE in Dutch) the emission trend of these companies is higher than according to the update of the Reference Projection. The difference is due to an al-ternative method for estimating future emissions and a larger VBE-assumed growth in volume of the industrial and energy sectors. VBE’s micro-growth figures, which are based on question-naires among individual companies and branch organisations, are less suitable for the macro-sectoral approach that is used by ECN and RIVM. In addition, representatives from industry, energy and glasshouse cultivation have commented on ECN and RIVM projections. In some cases, new insights of the representatives have been adopted, while in the others, there was no need for ECN and RIVM to adjust the figures.
1 INTRODUCTION
The Climate Policy evaluation document of February 2002 (VROM, 2002) calls for more cer-tainty with respect to the realisation of the Kyoto target. As the implementation of the Kyoto Protocol draws near, the Dutch obligation becomes binding. In order to increase certainty on the reduction of greenhouse gases, the intended result will have to be formulated in terms of an emission level target per sector (Indicative Target). In this way, the government wants to pro-vide more clarity on the focus of the policy intended for the target groups. The Indicative Tar-gets for emissions in 2010 serve as focal points for the sectors and ministries involved. A solu-tion to threats of exceeding the Indicative Target will be sought following the established proce-dure. The Indicative Targets for CO2 are formulated per sector, while the Indicative Targets of
other greenhouse gases are formulated on a national level. The non-CO2 greenhouse gases are
not discussed in this report. Starting point for the Indicative Targets are the emissions per sector from the following ECN/RIVM reports: Referentieraming energie en CO2, 2001-2010 by Ybema et al. (2002a) and the ‘Reference Projection for Greenhouse Gases in the Netherlands
-emission projections for the period 2001-2010’ (Van den Wijngaart, 2002).
However, the CO2 emission figures from the Reference Projection 2002 cannot be used without
some adjustment for the following reasons:
1. In the publication of the Reference Projection 2002 differences were shown between the RIVM and ECN definitions with respect to the emission figures for the base year, 2000. This resulted in some uncertainty in the sectoral emissions for 2010 and therefore a policy request for a further fine-tuning of the ECN and RIVM figures.
2. During the formulation of the Indicative Targets, a sector division was agreed on, in which sectors would be linked to a responsible ministry. This division deviates to some extent from the division normally used by ECN and RIVM. As a result, the available emission figures for 2010, as well as the historical figures, had to be translated into a new format, the so-called ‘Indicative Target sectors’.
3. Since the publication of the Reference Projection, various parts of policy have been adjusted and completed. First of all, some policy measures, which were still in the pipeline during the Kok II Cabinet, were to be implemented in the short term. This has partly taken place e.g. the Coal Agreement (see Chapter 3). The possible effects on CO2 emissions were
as-sessed per adjusted policy measure (Menkveld, 2002). At the start of the Balkenende I Cabinet, some adjustments were also proposed in the so-called Strategic Agreement, some-times resulting in extra reduction and somesome-times in extra emissions (see Ybema et al, 2002b). Finally, new policy proposals affecting CO2 emissions were formulated in the
Framework Agreement. All these mutations must be translated to the selected sectors and the effect for 2010 established.
4. In 2003, the estimated future emissions were presented to representatives of the various consumption sectors. The resulting discussions with the sectors led to the estimated emis-sion figures being adjusted in a few cases.
5. The expected emission figures were also determined for 2005, which is the year that the emissions trade will be launched. For the Industry/Energy sector, this emission value can be used as the upper limit for the emission of companies participating in the European system of emissions trade, although not all companies in this sector will participate.
The various definitions, the new policy measures and the sector discussions will collectively de-termine the new emission figures on the basis of which ministries will formulate their Indicative Targets. The figures for 2005 provide information that can assist in the allocation of emission rights.
This study also includes an analysis of the costs of CO2 emission reduction, both for the future
(2001-2010) and the past (1990-2000). These results will be published in a separate report (Boonekamp, 2003). The study was conducted by the Policy Studies Unit of the Energy Re-search Centre of the Netherlands ECN, in close consultation with the Netherlands mental Assessment Agency (MNP) of the National Institute for Public Health and the Environ-ment (RIVM), which was also responsible for the emission data for the transport sector. Finally, it must be noted that a new Reference Projection will be formulated in the second half of 2004, in which estimated future emissions will be updated again.
This report is intended as background to aid in the establishment of sectoral Indicative Targets. It aims to offer insight into the realisation of the emission figures for 2010 to policy makers and those directly involved in this work. It is not our intention to re-explain the Reference Projec-tion. Neither is it up to us to go into the same level of detail as in the report on policy adjust-ments (Menkveld, 2002; Ybema, 2002). Here, the relevant sectors are discussed in separate chapters, allowing readers to select the chapters in which they are interested. Each chapter pro-vides an overview of the most important emission-determining factors and a brief, but complete, overview of policy and the effect of adjustments on previously obtained emission figures. Each chapter ends with the relevant figures for the Indicative Targets and an analysis of the uncertain-ties. Sector-based chapters are:
• Households and Services (Chapter 5) • Agriculture/Horticulture (Chapter 6) • Industry/Energy (Chapter 7)
• Transport (Chapter 8).
The sector-based chapters are preceded by a short description of sector definitions by ECN and RIVM. Chapter 2 represents a new division for sectoral Indicative Targets, followed by a sum-mary of the effects of all adjustments (Chapter 3) and an overview of the developments in total CO2 emission (Chapter 4). The report concludes with information on the developments up to 2010 from a sectoral viewpoint. ECN/RIVM results are first compared with the results of the sector questionnaire (VBE, 2003); this is followed by the deviating views from the various sec-tors
2 FINE-TUNING
OF
DEFINITIONS AND CATEGORIES OF
EMISSION DATA
2.1 Fine-tuning the definitions between RIVM and ECN
During the formulation of the Reference Projection 2002 it became evident that ECN and RIVM emission data differed. RIVM uses the annual Emission Registration (ER) as a basis for its his-torical CO2 emission figures. Emission Registration utilises an internationally prescribed format
and method. Their CO2 emission monitoring is partly based on the environmental reports of
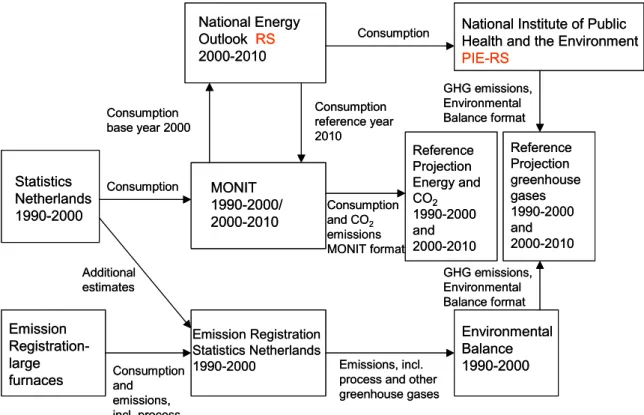
in-dividual companies and partly on sectoral energy figures from Statistics Netherlands (CBS) (see Figure 2.1 below). The results, including process emissions and other greenhouse gases, have been presented in the Environmental Balance (RIVM). The definitions in the ‘Reference Projec-tion Greenhouse Gases 2001-2010’ have been based on the definiProjec-tions of the Emission Registra-tion and the Environmental Balance. ECN determined the historical CO2 emissions using the
MONIT system (Boonekamp, 1998), on the basis of energy consumption figures from CBS-NEH and emission factors per fuel type. Future consumption developments were determined with the National Energy Outlook calculation system (NEV-RS). MONIT translates these con-sumption developments into future emissions (see Figure 2.1). The trends for energy and CO2
are described in the ‘Reference Projection on Energy and CO2, 2001-2010’.
MONIT 1990-2000/ 2000-2010 National Energy Outlook RS 2000-2010 Consumption base year 2000 Consumption reference year 2010 Reference Projection Energy and CO2 1990-2000 and 2000-2010 Consumption and CO2 emissions MONIT format Emission Registration Statistics Netherlands 1990-2000 Emission Registration-large furnaces Statistics Netherlands 1990-2000 Additional estimates Consumption and emissions, incl. process Consumption Environmental Balance 1990-2000 Emissions, incl.
process and other greenhouse gases
National Institute of Public Health and the Environment
PIE-RS Consumption GHG emissions, Environmental Balance format Reference Projection greenhouse gases 1990-2000 and 2000-2010 GHG emissions, Environmental Balance format MONIT 1990-2000/ 2000-2010 National Energy Outlook 2000-2010 RS Consumption base year 2000 Consumption reference year 2010 Reference Projection Energy and CO2 1990-2000 and 2000-2010 Consumption and CO2 emissions MONIT format Emission Registration Statistics Netherlands 1990-2000 Emission Registration-large furnaces Statistics Netherlands 1990-2000 Additional estimates Consumption and emissions, incl. process Consumption Environmental Balance 1990-2000 Emissions, incl.
process and other greenhouse gases
National Institute of Public Health and the Environment
PIE-RS Consumption GHG emissions, Environmental Balance format Reference Projection greenhouse gases 1990-2000 and 2000-2010 GHG emissions, Environmental Balance format
Figure 2.1 ECN and RIVM information systems with respect to greenhouse gases
An extensive analysis took place with respect to the differences in definitions of historical emis-sion figures between MONIT and the Emisemis-sion Registration (ER, 2002), covering the years 1990, 1995 and 1999-2001. The differences in total emissions ranged from 0-2%. For some sec-tors, however, the differences were larger, depending on the year analysed. The differences were also due to the so-called process emissions (totalling 1-2 Mton), which have been included in the Emission Registration, but do not form part of the energy-related MONIT emissions.
The differences are not fixed once determined. The latest Emission Registration (ER, 2003) contains some improvements that were processed retrospectively in previous years. The largest change involves a substantial adjustment of the emissions from the chemical industry in 2000. Ever since the change from a central database to company delivery of data in their environ-mental reports, Emission Registration (ER) has suffered loss of quality. The ER is obliged to use the CO2 emission figures from the environmental reports of individual businesses, as a
re-sult of which the ER is unable to distinguish between energy and non-energy-related emissions. This is why some emissions were included twice in the Emission Registration, leading to an ex-tra 3.8 Mton. To be able to fulfil international reporting obligations properly, the ER’s approach and/or the environmental reports need improvement. It is not inconceivable that these improve-ments may lead to larger emissions. This year’s windfall emission reduction may be undone by future setbacks.
The differences have been partly reduced by improving several specific emission coefficients in the MONIT system, for example, with waste incinerators and refineries. The remaining differ-ences were processed in MONIT as corrections to the emissions that ECN had calculated ear-lier. This way, MONIT delivers emission figures that correspond entirely with the figures from the Emission Registration. The emissions in historical years are also corrected for annual fluc-tuations in average temperature during the heating season. Moreover, some minor corrections have been applied to bring ECN and RIVM’s methods for correcting these fluctuations com-pletely in line with each other. The corrections found for base year 2000 have also been applied to the calculated emissions for 2005 and 2010. Thus, the future emission figures presented in this report are the result of the Emission Registration’s emission figures for 2000 plus the in-crease of emissions in accordance with the Reference Projection 2002 and all further updates (see Chapter 3).
2.2 CO
2emission categories for Indicative Targets
In the process of formulating the sectoral Indicative Targets for CO2 emission, the
interdepart-mental advisory committee decided to define the sectors in such a way that they could be linked to a responsible ministry. To avoid confusion with other divisions, these sectors will be indi-cated with the prefix ‘ITS’ (Indicative Target Sector). The following sectors and ministries are involved:
• ITS Industry/Energy (Ministry of Economic Affairs),
• ITS Households and Services (Ministry of Spatial Planning, Housing and the Environment), • ITS Agriculture/Horticulture (Ministry of Agriculture, Nature and Food Quality),
• ITS Transport (Ministry of Transport, Public Works and Water Management).
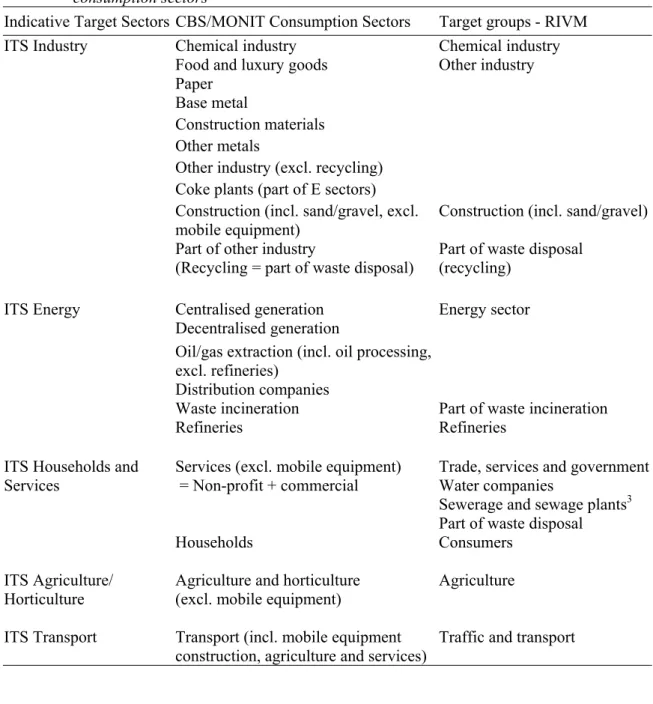
The ITS Industry/Energy sector will be subdivided into the subsectors, ITS Industry and ITS Energy, in all overviews. Thus emission figures will be provided for five sectors. Table 2.1 pro-vides an overview of the structure of the Indicative Target Sectors and the relation to the divi-sion in target groups, which RIVM uses in its Environmental Balance, and the dividivi-sion in con-sumption sectors according to energy statistics (Statistics Netherlands - CBS-NEH).
Noteworthy differences:
• Mobile equipment: according to CBS these are allocated to agriculture/horticulture, con-struction and other businesses. Here, they are allocated to the transportation sector.
• Building industry and coke plants: here these are allocated to ITS Industry; CBS separates construction building sector from the rest and considers coke plants as belonging to the en-ergy sector.
• Joint venture cogeneration plants at industrial sites: until 1993 CBS categorised these plants under industrial energy use and after 1993 placed them in the ‘decentralised or local’ sector as part of the energy sector. Here, they are also allocated to the ITS Energy sector.
The sectoral emissions refer only to the direct emissions of fuel consumption; supplied electric-ity or heat does not contribute to sectoral emissions. The indirect emissions of electricelectric-ity and heat consumption that occur during production are completely allocated to the ITS Energy sub-sector. As a result of this approach, the emissions of a sector may decrease, despite strongly in-creasing electricity consumption.
The MONIT system has been extended with a new reporting format for CO2 emissions to
pro-vide emission figures per Indicative Target Sector. The emissions per Indicative Target Sector can only be provided for a limited number of historical years, however. Format adjustment of ECN and RIVM emission figures only took place for the years 1990, 1995, 2000 and 2001. A similar translation into Indicative Target Sectors took place for future reference years. With these adjustments, emissions per Indicative Target Sector can be produced for every reference year and scenario.
Table 2.1 Division of emittants according to Indicative Target Sectors, target groups and CBS
consumption sectors
Indicative Target Sectors CBS/MONIT Consumption Sectors Target groups - RIVM Chemical industry Chemical industry Food and luxury goods
Paper Base metal
Construction materials Other metals
Other industry (excl. recycling) Coke plants (part of E sectors)
Other industry
Construction (incl. sand/gravel, excl. mobile equipment)
Construction (incl. sand/gravel) ITS Industry
Part of other industry
(Recycling = part of waste disposal)
Part of waste disposal (recycling)
Centralised generation Decentralised generation
Oil/gas extraction (incl. oil processing, excl. refineries)
Distribution companies
Energy sector
Waste incineration Part of waste incineration ITS Energy
Refineries Refineries Trade, services and government
Water companies
Sewerage and sewage plants3
Services (excl. mobile equipment) = Non-profit + commercial
Part of waste disposal ITS Households and
Services
Households Consumers ITS Agriculture/
Horticulture
Agriculture and horticulture (excl. mobile equipment)
Agriculture
ITS Transport Transport (incl. mobile equipment construction, agriculture and services)
Traffic and transport
2.3 Emission 2000 in the new format
Table 2.2 provides an overview of emissions per Indicative Target Sector for 2000; the figures were jointly established by RIVM and ECN. Previously published emissions from the Reference Projection 2002 are also provided. Important process emissions are put in parentheses.
The total CO2 emission for 2000 turned out to be 3.7 Mton4 lower than the emission previously
published in the Reference Projection of 2002. This can be almost completely attributed to the revision of a number of emission figures in the most recent update of the Emission Registration (see also Section 2.1).
Looking at the differences per sector, Industry and Energy attract the most attention. However, these large differences are also the result of joint venture cogeneration being transferred from industry (Reference Projection 2002) to central electricity production (Update Reference Projec-tion).
Table 2.2 CO2 emissions in 2000 after fine-tuning and in Reference Projection 2002 [Mton] Fine-tuning of definitions
ECN/RIVM
Reference Projection 2002 Total MONIT Indicative Target
Sectors
179.8
ITS Agriculture/Horticulture. 8.1
incl. mobile equipment 9.6 9.2
ITS Transport . 35.2
excl. mobile equipment 32.9 32.9
ITS Households and Services 31.7
Households 21.3 21.5
Services 10.4
incl. mobile equipment 10.8 12.0
ITS Industry* 37.8 >50.3
Industry 37.2 49.1 (1.3)
Construction 0.6
incl. mobile equipment 0.9 1.2 (0.5)
ITS Energy 63.4 <54.0
Refineries 12.0 11.9
Power plants, etc. 47.9 34.8
Other E companies 7.2
- Waste incineration 1.6
- Oil/gas extraction 1.8
- Distribution companies Some power plants
ITS Industry/Energy 101.2 104.2
Total Indicative Target Sectors 176.1
* Fine-tuning of ECN/RIVM definitions incl. coke plants; Reference Projection 2002 excl. coke plants.
4 In Table S.2 the total decrease in 2010 amounts to only -2.5 Mton. The difference is caused by fine-tuning of future
3 ADJUSTMENTS FOR RECENT POLICY AND TRENDS
The development of CO2 emissions, as provided in the Reference Projection 2002, constitutes
the basis for the establishment of sectoral Indicative Targets for the coming years. The policy determined as of June 2001 was processed in the calculations in the Reference Projection 2002.5
After this, the effects of the so-called ‘pipeline policy’ of the Kok II Cabinet (1998-2002) were charted, followed by some adjustments by the government to (previously planned) energy and climate policy since the publication of the Reference Projection 2002. These had, first of all, to do with the Strategic Agreement of the Balkenende I Cabinet (2002). More recently, several new policy measures have been announced in the Framework Agreement, set up during the pre-sent Balkenende II Cabinet). Finally, the projection results have been tested against the percep-tions of the sector representatives, which has also led to some adjustments in future emissions. The emission effects of various adjustments are overviewed below. Appendix 2 contains a summarised overview of all individual mutations.
3.1 Pipeline
policy
Reference Projection 2002 includes government policy determined as of 1 July 2001, with a few exceptions. The continuation of established policy up to 2010 was used as starting point. More-over, there was still policy under preparation then (‘pipeline policy’) that could contribute to bridging the gap between expected realisations and the target for CO2 emission in 2010. Table
3.1 shows the estimates of the additional effect of separate measures that were made at that time. In the meantime, some policy components have been amended, e.g. the kilometre tax. Fur-ther details can be found in the sector chapters.
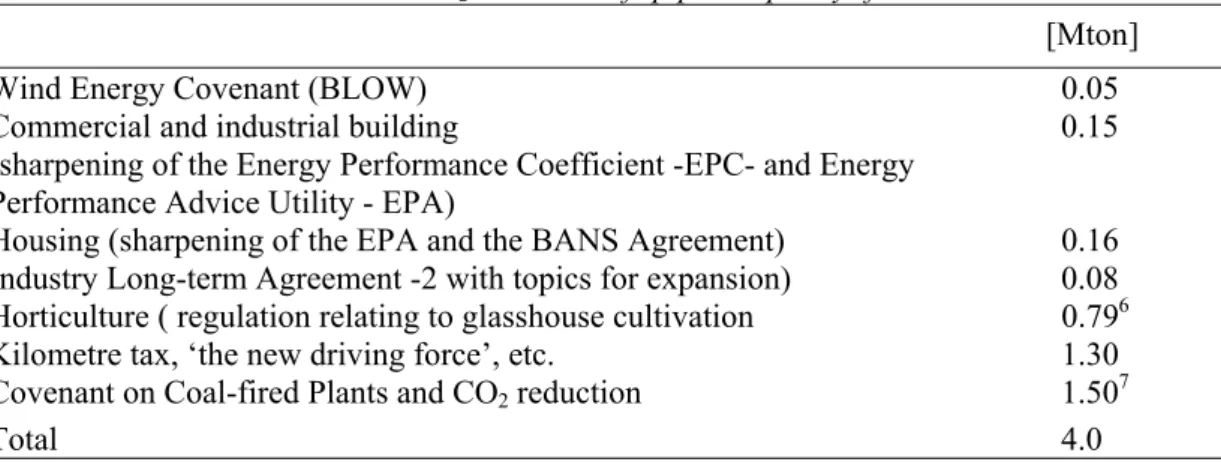
Given the uncertainties, specified policy could lead to an additional emission reduction of ap-proximately 2.5 Mton up to a maximum of 5.0 Mton in 2010 (see Menkveld, 2002). Where the full potential of some of the policy agreements with the sectors is realised, the total effect esti-mated is 4 Mton. The extra reduction is mainly realised in the regulations for glasshouse cultiva-tion, the Coal Agreement and the kilometre tax (see Section 3.2), but also by sharpening and intensifying the Households and Services policy. For the year 2005, this can result in a total ex-tra emission reduction of 1.2 Mton.
Table 3.1 Estimated additional CO2 reduction of ‘pipeline policy’ for 2010
[Mton]
Wind Energy Covenant (BLOW) 0.05
Commercial and industrial building
(sharpening of the Energy Performance Coefficient -EPC- and Energy Performance Advice Utility - EPA)
0.15
Housing (sharpening of the EPA and the BANS Agreement) 0.16 Industry Long-term Agreement -2 with topics for expansion) 0.08 Horticulture ( regulation relating to glasshouse cultivation 0.796 Kilometre tax, ‘the new driving force’, etc. 1.30 Covenant on Coal-fired Plants and CO2 reduction 1.507
Total 4.0
5 Exceptions are policy on cogeneration, import of renewable energy and energy labels. 6 In Menkveld (2002) margin of 0.1 – 0.8 Mton, see Chapter 6.
3.2 Strategic
Agreement
The Strategic Agreement of the Balkenende I Cabinet (2002) proposed a few policy adjustments in energy and climate policy, including:
• limitation and adjustment of subsidy regulations for renewable energy and energy-saving, • cancellation of the kilometre tax, decrease in taxes on petrol, increase in investments in
in-frastructure and termination of the premium regulation for energy-efficient cars, • keeping the nuclear power plant at Borssele in operation after 2004.
Ybema (2002) has estimated the effect that can be expected for 2010 if these policy adjustments are implemented. The emission effects would be the result of a different development of renew-able energy, energy saving and fuel deployment than at present. It was also assumed that the remaining existing policy and policy plans of the Kok II Cabinet would be implemented as planned (see also the specific chapters per sector).
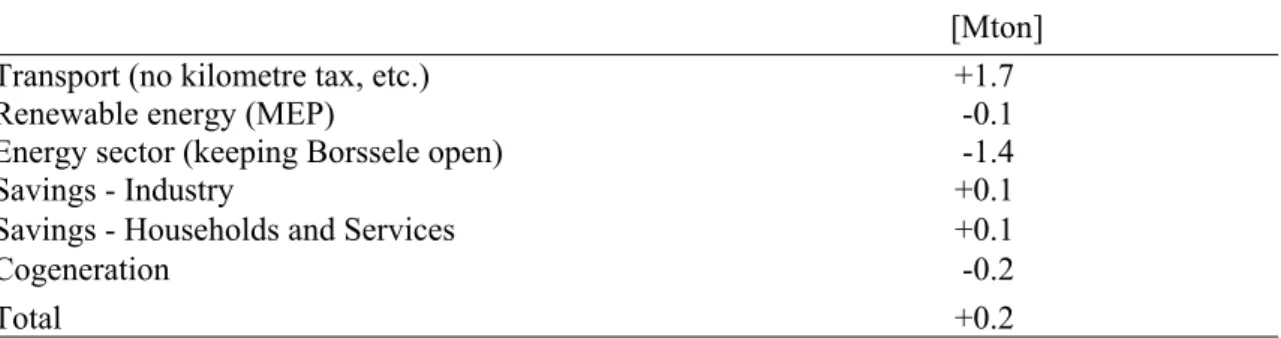
Table 3.2 Changes in CO2 emissions in 2010 with the implementation of the Strategic
Agreement
[Mton]
Transport (no kilometre tax, etc.) +1.7
Renewable energy (MEP) -0.1
Energy sector (keeping Borssele open) -1.4
Savings - Industry +0.1
Savings - Households and Services +0.1
Cogeneration -0.2 Total +0.2
Transport has experienced an increase in emissions as a result of cancelling the kilometre tax. On the other hand, a large reduction in the energy sector will be achieved because the nuclear plant in Borssele will be kept in operation for a longer period. The total effect of the Strategic Agreement would amount to an increase in emissions of 0.2 Mton. However, the margin in this figure is large due to uncertainty on the magnitude of the various effects (see Chapter 4). The effects of the Strategic Agreement have also been determined for 2005. For most policy measures the effect applies to a proportional share of the effect for the period of 2001-2010. The extra emission reduction resulting from keeping Borssele open will already be realised in 2005. This results in a decrease in emission of 0.7 Mton, which adds up to the extra reduction of over 1.2 Mton as a result of the pipeline policy.
3.3 Framework Agreement and sector trends
Recent policy plans
In the summer of 2003, the government announced several policy plans having an effect on fu-ture emissions in the Framework Agreement (Dutch Government, 2003). The effects have been determined here on the basis of further development in the budget of 2004, (see Table 3.3).For traffic, this involves refraining from lowering the taxes on petrol as stated in the Strategic Agreement (Kok’s 25 cent tax measure will not be revoked). Instead, investments will be made in expanding road capacity and simplifying the fiscal commuter traffic regulation. For renew-able energy, there is a shift in incentive method, i.e. from indirect incentives (Art. 36-i of the regulation) to direct incentives with MEP compensation. For Households and Services various policy changes are experienced, such as an increase in the regulatory energy tax (REB: small consumers’ tax) and termination of EPR (Energy Premium Scheme). Another policy measure, which is not national but worth mentioning, is the recently formulated EU Directive for energy labelling of buildings and houses (EU, 2002). The increase in the REB will also influence the
expected emissions of the energy sector through a decrease in electricity demand. More details can be found in the sector chapters.
Table 3.3 Changes in CO2 emissions in 2010 with implementation of the Framework Agreement
[Mton] Transport -0.1
Renewable energy -0.4
Households and Services +0.5
Electricity supply -0.1
Total -0.1
Adjustment of sector trends
The presentation of the projection results to representatives of various sectors has led to a dis-cussion on the selected starting points and expected developments. This has resulted in both positive and negative mutations per sector. Especially the trend breach in cogeneration has been a cause for readjustment of expected emissions (see Table 3.4). It must be noted that this is partly a shift in emissions in the industrial, refining and electricity sectors. For transport, a dif-ferent composition of the fuel mix of the fleet and less growth in private car use has been as-sumed. The somewhat decreased growth in domestic electricity consumption has been proc-essed as a mutation in the emissions from the electricity supply. The new figures are the result of current perceptions of ECN and RIVM; they need not necessarily correspond to the percep-tions of representatives of the sectors.
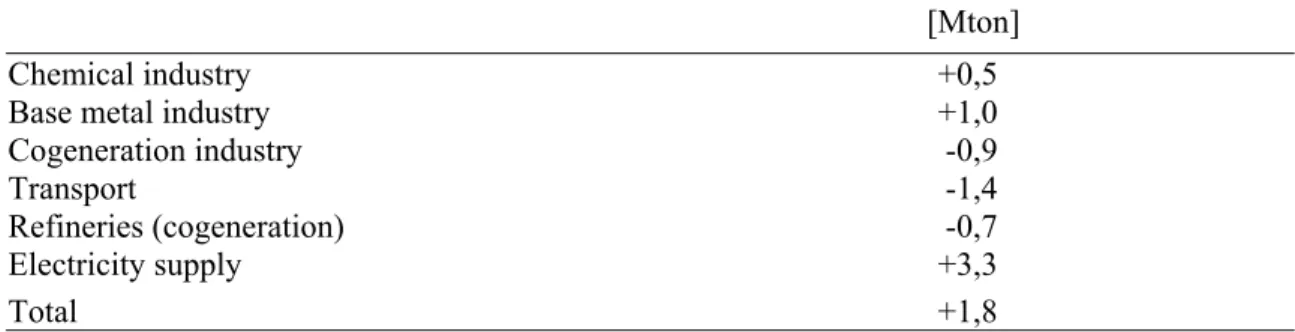
Table 3.4 Changes in CO2 emissions in 2010 as a result of adjusting sector trends
[Mton]
Chemical industry +0,5
Base metal industry +1,0
Cogeneration industry -0,9
Transport -1,4
Refineries (cogeneration) -0,7
Electricity supply +3,3
4 NATIONAL RESULTS OF THE TOTAL REFERENCE PROJECTION
UPDATE
4.1 Development of total CO
2emissions
Table 4.1 provides an overview of the total emissions and the emissions per Indicative Target Sector (ITS) up to 2010. The emissions in 2000 correspond to the most recent Emission Regis-tration figures (ER, 2003). The expected emissions in 2005 and 2010 are the result of:
• Trend developments for 2001-2010 according to the Reference Projection for 2002, includ-ing emission reductions resultinclud-ing from the policy as of mid-2001.
• Extra emission reductions or increases as a result of various policy additions. • Emission effects after adjustment of sector developments.
The emission figures, corrected for temperature8, also include process emissions9.
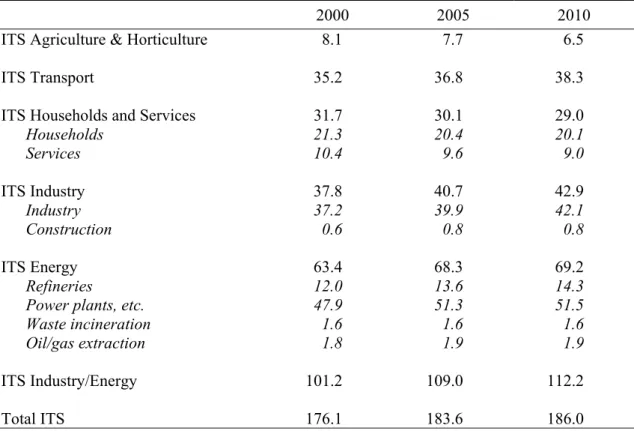
Table 4.1 Expected CO2 emissions in the Reference Projection update [Mton]
2000 2005 2010
ITS Agriculture & Horticulture 8.1 7.7 6.5
ITS Transport 35.2 36.8 38.3
ITS Households and Services 31.7 30.1 29.0
Households 21.3 20.4 20.1 Services 10.4 9.6 9.0 ITS Industry 37.8 40.7 42.9 Industry 37.2 39.9 42.1 Construction 0.6 0.8 0.8 ITS Energy 63.4 68.3 69.2 Refineries 12.0 13.6 14.3
Power plants, etc. 47.9 51.3 51.5
Waste incineration 1.6 1.6 1.6
Oil/gas extraction 1.8 1.9 1.9
ITS Industry/Energy 101.2 109.0 112.2
Total ITS 176.1 183.6 186.0
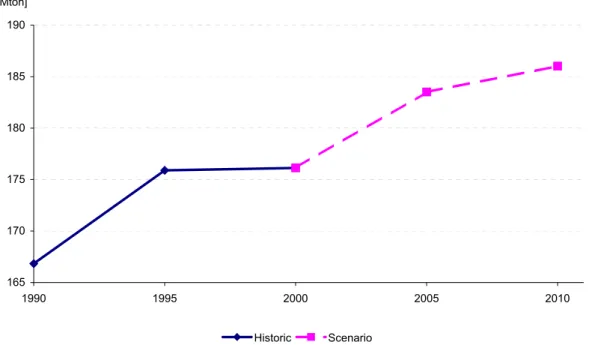
Figure 4.1 illustrates the future development of expected emissions and also the emissions for the reference years, 1990 and 1995 (corrected for temperature). According to the Reference Pro-jection update, CO2 emissions will increase from 176 to 186 Mton. The average growth in the
2000-2010 period thus amounts to 0.6% per year. Between 1990 and 2000 the average CO2
emission growth amounted to 0.5-0.6% per year. The trend of increasing CO2 emissions seems
to continue after 2000.
8 The emissions in 2000 have been corrected for the relatively high temperature during the heating season. For 2000
and future reference years the average temperature for 1970 to 2000 during the heating season has been used as a basis.
9 This represents a total emission of 1.8 Mton in 2000 and 2.3 Mton in 2010, mainly from the Industrial sector
165 170 175 180 185 190 1990 1995 2000 2005 2010 [Mton] Historic Scenario
Figure 4.1 Development of total CO2 emissions in the 1990-2010 period
The expected emission in 2010 is shown to correspond exactly with the Kyoto target of 186 Mton; however, this is partly a coincidence. The Reference Projection 2002 reported an emission of 191 Mton. Some additional policy (especially the so-called pipeline policy) was implemented to reduce these emissions to target level. Next, various mutations not related to policy were added, including the adjustment of base year figures as a result of fine-tuning between ECN and RIVM, the adjustment of the Emission Registration because of double counting in industry and the adjustment of some sectoral trends (see Chapter 7). These mutations result in the emission of 186 Mton in 2010. Without recent adjustment of the Emission Registration (ER, 2003), the emission level would have reached 190 Mton.
4.2 Achievements and starting points in Reference Projection
The 2002 Reference Projection assumed an average economic growth of 2.5% per year. Table 4.2 illustrates that a higher GDP growth is needed in the remaining period in order to achieve the earlier estimated average GDP growth of 2.5% per year.
Energy consumption figures are also available up to and including 2002. After correction for yearly temperature variations, total energy consumption in 2001 and 2002 showed an average increase of 1.1% per year. The 2002 Reference Projection originally assumed a growth rate of 0.6% per year in 2001 - 2010. In the update of the Reference Projection this figure is adjusted to 0.7% per year. This is the result of trend adjustments that are somewhat compensated by extra energy-saving policy, which will be implemented mostly after 2002. As a result, the growth for 2003-2010 amounts to 0.6% per year.
As for CO2 emissions, the realised growth is also higher than originally assumed. The emission
for base year 2000 has, however, been adjusted downward. Given the target of 186 Mton in 2010, the emission is allowed to increase by 0.4% per year in the remaining period. This is the case in the update of the Reference Projection; the emission growth is lower than the energy consumption. This lower CO2 emission growth is a result of the extra emission policy
Table 4.2 Achievements, starting points and expectations in the Reference Projection 2002 and
the update [% per year]
1990-2000 2001 and
2002
2003-2010 2001-2010
GDP growth
- Reference Projection 2002 +1.5 +2.75 +2.5
- Realisation / Update Reference Projection +2.95 +0.8 +2.9 +2.5 Energy consumption
- Reference Projection 2002 +0.6
- Realisation / Update Reference Projection +1.0 +1.1 +0.6 +0.7 Emission CO2
- Reference Projection 2002 +0.6
- Realisation / Update Reference Projection +0.5 +1.4 +0.4 +0.6
4.3 Uncertainties in emission figures
In the Reference Projection of 2002 the 95% reliability interval for CO2 emissions was set at
± 12 Mton. Thus, given the value of 191 Mton established earlier, the margin in 2010 is found between 179 and 203 Mton CO2. The most uncertain factor with the largest effect on CO2
emis-sions in 2010 is the future import of electricity. Other important uncertain factors consist of the growth in energy intensive industries and refineries, and the gas price.
Recent policy adjustments with respect to the Reference Projection 2002 will result in extra CO2
emission reduction. A number of adjustments, e.g. the BANS Agreement (Administrative Agreement New Style; see Chapter 5), do not lead to substantial extra reductions but do enhance the chance of other policy measures achieving the intended effect. Moreover, the extra reduction achieved by keeping the nuclear plant at Borssele in production (see Section 7.3) seems rela-tively robust in view of the positive political decisions determined here. The uncertainty with respect to the policy effect in 2010 might be more limited than estimated in the Reference Pro-jection 2002. However, the EU decision regarding the implementation of emission trade has been found to lead to new uncertainties in sectoral emission trends. All in all, it cannot be ex-pected that the total uncertainty of the policy effects will diminish. Moreover, the other uncer-tainties surrounding social developments and emission factors are not fewer than in the Refer-ence Projection 2002. Therefore, a margin for a total CO2 emission of 174 to 198 Mton (186 +/-
5 HOUSEHOLDS
AND
SERVICES
This chapter will examine developments in the Households and Services sectors, followed by the total Households and Services Sector. Emphasis is put on policy that may influence CO2
de-velopments, especially recent additional policy that could not be included in the Reference Pro-jection.
5.1 Households
5.1.1 Main determining factors
The following factors are important for the developments in households: • demography (15.9 to 16.6 million inhabitants in the period 2000-2010),
• number of houses and households (6.85 million in 2000 compared to 7.42 million in 2010), • increase in consumption (3.1% per year),
• energy prices (rising gas prices),
• energy and climate policy (see overview).
Demographic factors mostly determine the number and types of houses and, thus, gas tion. The number of households and consumption growth mostly determine electricity consump-tion. Increasing energy prices and policy measures can curb the increase of consumpconsump-tion.
5.1.2 Existing policy and recent adjustments
The existing policy is described in Reference Projection 2002 (Ybema, 2002). Below, this pol-icy will be summarised in combination with a description of recent adjustments.
Regulating Energy Tax (REB)
Since 2000, this tax is raised on all gas and electricity consumption and amounts to 5.45 €ct/kWh for electricity and 12.0 €ct/kWh for natural gas. In the Reference Projection 2002, the level of the tax was assumed to increase with inflation and thus remains constant. Recently, the Balkenende II Cabinet decided to increase the REB for small users by 10% as of 2005. As a result, the gas price will increase by 3.3% and the electricity price by 4.2%. The somewhat smaller energy demand results in an extra reduction of 0.15 Mton in 2010, of which only the share of gas (0.09 Mton) counts for the emission reduction of households.
Energy Performance Standard (EPN)
The EPC standard of 1.0 that applies to new housing since 2000 generally corresponds with a consumption of 850 m3 gas. The Reference Projection 2002 assumes that this standard will not
be further adjusted.
Energy labels
Consumers are informed about annual consumption of various electric appliances via energy labels. The effect of labels is enhanced because subsidies from the Energy Premium Scheme are linked to the most energy-efficient appliances. Although this measure had not yet been estab-lished in 2001, the Reference Projection 2002 already assumed that the label specifications for washing machines and refrigerators would be adjusted by the EU. As for tumble dryers and dishwashers, it is assumed that no further adjustment/sharpening will take place until 2010. As a result of recent termination of the EPR, the label system will lead to fewer saving, especially with respect to appliances whose energy label will be adjusted. This has been included in the effect of the mutations in the EPR.
Energy Premium Regulation (EPR)
The EPR involves subsidies for housing isolation, very efficient central heating boilers (better than high efficiency boiler), solar boilers, PV systems, efficient white goods/appliances and (un-til this year) LCD screens for computers. The EPR is financed from the revenues of the REB tax. In the Strategic Agreement it was decided to halt public funding of the EPR and replace it with an energy subsidy regulation. This would lead to a slight increase of emission with 0.08 Mton. In the Framework Agreement, however, it is suggested that the regulation be abolished altogether. Including the effects on EPA/certificates and labels for appliances, this results in an extra increase of emissions of 0.6 Mton (margin 0.3 - 0.9 Mton).
Energy Performance Advice (EPA)
Since 2000, energy saving measures in existing houses are mapped through EPAs. It is the in-tention that the advice given by EPA then leads to the implementation of measures. The EPA advice and the implementation of advised measures are voluntary, but both are supported by EPR subsidies. The Reference Projection 2002 does not assume any obligations until 2010. The additional pipeline policy involves intensification of the EPA measures. (Menkveld, 2002) as-sumes an extra reduction of 0.08 Mton (margin of 0.05 - 0.20 Mton). The decision of the Bal-kenende II Cabinet to abolish EPR does not apply to EPA, for which a limited budget remains available. Moreover, EPA’s information function could be partly taken over by the energy cer-tificate (see EU Directive). However, as the EPR for energy saving measures will be terminated, the profitability of investments will decrease and a smaller share of the improvement advice will be implemented. The actual effectiveness of EPA will thus decrease. The negative effect on previously determined EPA emission reductions has been included in the mutations concerning EPR.
BANS
The Climate Covenant in the framework of the Administrative Agreement New Style (BANS) between the government, IPO and VNG involves the efforts of local authorities with respect to their contribution to government climate policy. Within the theme of house-construction, three ambition levels can be distinguished, i.e. ‘active’, ‘trend setting’ and ‘innovative’. The levels involve different demands as to the reduction of energy consumption of new houses. In current construction, there are certain preconditions for sustainability and the number of EPA consults. During the establishment of the effect of pipeline policy it was assumed that the BANS regula-tion will be continued after 2004. For current house-construcregula-tion (Menkveld, 2002) does not as-sume an additional effect, given the developments of the EPA approach (see EPA), the obliga-tory EU certificates and the EPR. If new housing constructed between 2002 and 2010 would have a 10% lower EPC value, this could result in an additional reduction of 0.2 Mton. Menkveld (2002), however, assumed that BANS will lead to a reduction of no more than 0.08 Mton.
EU Directive Energy Performance Buildings
This Directive (EU, 2002) establishes the energetic requirements for new houses and houses that are to be renovated and the availability of energy certificates with respect to existing buildings that change owners. The first requirement is already covered by the prescribed EPC values for new housing in the Netherlands. The system of energy certificates should be activated by 2006 in the Netherlands. This certificate should indicate achievable measures for improvement, yet the implementation of these measures is not obligatory. The system of certificates will co-exist next to the existing systems of voluntary EPAs (see EPA). The advice may also be the Dutch implementation of the EU certificate. Certificates must be drawn up when a house actually changes owners. Given the number of times that people move there will soon be more certifi-cates than (voluntary) EPAs. The improvement advice may be of lesser quality than the current EPAs if only the EU demands are fulfilled. The certificates do seem to be linked to the ‘natural moment’ for improvements, i.e. a change of owner of a house. Therefore, the combination of the certificate and the EPR could lead to an extra reduction compared to the current system with EPA. As a result of the abolishment of EPR, however, a smaller share of the advice will lead to
actual improvement measures. The remaining effect of the EU Directive will be included in the EPR.
5.1.3 Other
adjustments
Beside policy adjustments, a limited reduction of electricity demand compared to the Reference Projection 2002 has also been assumed. Given the recent small consumption growth, the larger average growth that was assumed in the Reference Projection 2002 does not seem very realistic anymore. An average growth in annual consumption of 2.1% (instead of 3.1%) will now be as-sumed. The lower growth will result in 2-3 PJe less electricity consumption in 2010.
5.1.4 Development of emissions in household sector until 2010
The development of CO2 emissions between 2000 and 2010 is provided in Table 5.1, including
the effect of various policy measures (see also Chapter 3). On balance, these measures hardly seem to affect the CO2 developments that were established in the Reference Projection 2002.
The adjustment of trends in electricity consumption do not affect the direct emissions of the household sector.
Figure 5.1 illustrates the development of the total CO2 emission of households, i.e. the direct
emissions of fuel consumption; the indirect emission of electricity consumption is allocated to the energy sector (see Section 7.3).
0 5 10 15 20 25 1990 1995 2000 2005 2010 [Mton] Historic Scenario
Figure 5.1 Development of CO2 emission household sector 1990-2010
5.2 Services
sector
The services sector comprises of all companies outside of Industry, Energy and Agricul-ture/Horticulture as well as the non-profit sectors Government, Health care and Education. Mo-bile equipment are not included.
5.2.1 Main determining factors
Important factors for the development of Services are:
• economic growth of the services sector and government (3.0 and 1.7% per year respec-tively),
• increase in number of employees, • floor area per employee,
• energy prices (rising gas prices),
• energy and climate policy (see overview).
The number of employees and the floor area per employee determine the required volume of buildings and thus gas consumption and part of electricity consumption. It is also influenced by economic growth, i.e. through the speed with which new buildings arise. The growth also influ-ences electricity consumption of activities other than housing construction. Rising energy prices and policy measures may curb the increase of energy consumption.
5.2.2 Existing policy and recent adjustments
Regulating Energy Tax (REB)
For electricity this tax amounts to 1.75 €ct/kWh until 50,000 kWh and 0.34 €ct/kWh for more than 50,000 kWh; for natural gas the tax amounts to 5.6 €ct/kWh until 70,000 m3 and beyond
1.0 €ct/kWh. Until 5000 m3, i.e. 10,000 kWh, small user levies apply (see households). A large
share of consumption in the services sector is covered by the lowest REB tax as a result of which the effect of REB on end user prices remains limited. In the Reference Projection 2002 the tax remains at the same level. Recently, the Balkenende II Cabinet decided to increase the small user REB by 10% as of 2005. As a result, the average energy price will increase by only 0.6%. This will result in an extra reduction in 2010 of 0.02 Mton, half of which (in the case of gas) leads to a reduction within the sector itself.
Fuel tax (BSB)
This tax applies to a large range of fuel types. For cogeneration, the fuel tax was transformed from input tax to output tax. This has been included in the Reference Projection 2002.
EIA and VAMIL
EIA and VAMIL are fiscal instruments for companies that pay corporation tax (35%). In the case of the raised Energy Investment Deduction (EIA), 55% (previously 40%) of the investment costs are deductible. On the basis of VAMIL (Early Depreciation Environment Investment), an investor can deduct the investment after one year. On balance, these instruments lead to 15-20% lower investment costs. The Reference Projection 2002 assumed that both instruments will re-main active.
Because of the large free rider effects, it was decided in the Strategic Agreement to adjust the EIA-list and to abolish the VAMIL arrangement. There appears to be plenty of potential to ad-just the EIA list in such a way that the effect on energy saving is limited (Jeeninga, 2002). Be-cause the VAMIL regulation is of little consequence for the services sector, abolishment will hardly result in fewer saving. In total, CO2 emissions will increase by 0.02 Mton in 2010.
Energy Investment Regulation Non-Profit (EINP)
The regulation focuses on non-profit and special sectors that cannot use the EIA arrangement. The techniques that are eligible for subsidy are largely the same as on the EIA energy list. The subsidy regulation has been abolished in the Strategic Agreement. The effect on emissions is quite limited for the same reasons as with EIA/VAMIL.
LTA-2
In addition to the Long Term Agreements (LTA’s) for efficiency improvement of the 1990s, some new agreements have been made (LTA-2) with branch organisations, among which com-panies from the services sector. Beside improvements in energy consumption, more saving can be achieved by adjusting products or logistics. Until 2005, a 1.4% annual saving is expected from the participating sector. In the Reference Projection of 2002, the LTA-2 was not included as an instrument. Given the limited participation of the services sector at the moment, no emis-sion reduction is expected in 2010 that is worth mentioning.
Energy Performance Coefficient Utility Construction (EPC-U)
The Households and Services has a standard for energy consumption in new housing, which is known as the EPC value. The standard differs, depending on the function of the building. In the Reference Projection 2002, the EPC standard for 2000 was maintained as starting point until 2010. The pipeline policy involved more stringent energy performance demands for utility con-struction in 2002, amounting to approximately 6.5%, as an average of the building categories. This resulted in an additional reduction of CO2 emissions of 0.15 Mton compared to the
Refer-ence Projection 2002, which is mainly caused by a decrease in gas consumption.
Energy Performance Advice Utility (EPA-U)
The Reference Projection 2002 still assumed that EPA for existing buildings and on a voluntary basis would not play a substantial role until 2010. The effect of EPAs is limited because they are only expected to affect those measures that penetrate to a lesser extent than could have been ex-pected on the basis of their profitability, which is because they are not widely known. The ad-justment of policy involves linking EPA-U to the Environmental Protection Act. No additional effects are expected here because a large number of EPAs have already been incorporated in the Reference Projection 2002 (see also the EU Directive).
EU Directive Energy Performance Buildings
This Directive involves energetic demands for new houses and houses that are renovated as well as the availability of an energy certificate for existing buildings that change owner. The former is already covered in the Netherlands by the prescribed EPC values for new buildings. The cer-tificate system must be implemented in the Netherlands in 2006. The cercer-tificate must indicate attainable measures of improvement, however, the implementation of these measures is not obligatory. The certificates are added to the existing EPA-U arrangements. No large differences can be detected per implemented advice, because the EPA-U has been attuned to the Directive. As for the amount of advice, the certificate will eventually cover a wider area, but until 2010 it will remain limited. The timing of the moment when the advice is formulated, i.e. when a house changes owner, may possibly lead to wider implementation of the advice. All in all, no emission reduction effect is expected until 2010.
BANS
Compared to the Reference Projection 2002, the adjusted policy will also include the effects of the Administrative Agreement New Style (BANS). The theme involved is municipal buildings and facilities, as part of the services sector, i.e. all municipal buildings (new and existing) and public lighting. Due to the limited number of municipal buildings (Menkveld and Coenen, 2001), the previous efforts in this area as well as in new housing, which is already part of EPC, the BANS theme results in an extra emission reduction of 0.01 Mton.
5.2.3 Other
adjustments
Beside policy adjustments, there have been no adjustments of energy consumption trends in the services sector, compared to the Reference Projection 2002. The emission in the base year has been increased by 0.2 Mton, however, due to new figures from the most recent Emission Regis-tration. This mutation also affects the reference years, 2005 and 2010.
5.2.4 Development of emission services until 2010
Recent policy adjustments appear to have hardly any effect on the CO2 emission development
that was previously established in the Reference Projection 2002 (see Table 5.1). Figure 5.2 il-lustrates CO2 development since 1990. The breach in trend starting in 1995 appears to continue
in the future. It is worth noting that the strongly increasing electricity consumption does not af-fect the direct emissions presented here. This efaf-fect becomes visible as extra fuel and emission in power plants (see Energy sector).
0 2 4 6 8 10 12 14 1990 1995 2000 2005 2010 [Mton] Historic Scenario
Figure 5.2 Development of CO2 emission sector ITS services 1990-2010
5.3 Total Households and Services
The households and services sectors are combined in the formulation of Indicative Targets for CO2 emission (see division of sectors, Chapter 2). Below, the results will be presented of the
ITS Households and Services (see Table 5.1).
Adjustment of trends and policy
No adjustment of trends in the Households and Services have taken place that will affect emis-sion. The emission of the base year has been slightly increased (see Section 5.2). The adjust-ments of emission in the Reference Projection 2002, given in Table 5.1, involve the policy ef-fects of the Pipeline policy, the Strategic Agreement and the Framework Agreement. All in all, the total emission increases slightly as a result of the adjustments.
Development of emissions
The emissions in the ITS Households and Services appear to decrease by 6% (households) and 13% (services) after 2010. It is worth noting that the CO2 emission is not related to the
Table 5.1 Emissions ITS Households and Services 2000-2010 in Reference Projection 2002 and
Update Reference Projection [Mton]
Reference Projection 2002 Adjustments policy Reference Projection update 2000* 2010* 2010 2005 Households 21.3 19.6 -0.2 + 0.1 + 0.5 20.1 20.4 Services 10.4 9.1 -0.2 + 0.0 + 0.0 9.0 9.6 Households and Services 31.7 28.7 29.0 30.1
* Incl. update for improved figures for 2000 for the Emission.
Figure 5.3 shows the development of CO2 emissions in the period 1990-2010. The decreasing
trend that started in 1995 seems to continue until 2010.
0 5 10 15 20 25 30 35 40 1990 1995 2000 2005 2010 [Mton] Historic Scenario
Figure 5.3 Development of CO2 emissions sector ITS Households and Services 1990-2010
Uncertainties emission 2010
Various factors influence uncertainty with respect to emissions:
• Economic growth and the translation into floor area and number of employees.
• The effectiveness of the EPN, which is uncertain because a larger economic growth will lead to the construction of more buildings, in conformity with EPN.
• The effectiveness of other policy measures, especially new policy (EPA); the uncertainty is connected to the very heterogeneous character of the sector.
• The effect on investment behaviour of energy prices, combined with EPA and EPN.
• Inaccuracy in the figures of the energy consumption in the base year, which affects expecta-tions for 2010.
The uncertainty in the increase of ICT-related applications is not important here, because elec-tricity consumption does not lead to CO2 emission in the services sector. Given the limited
ef-fect of recent policy adjustments, the margins in emission, as previously illustrated in the Refer-ence Projection, does not change.
![Table S.1 Estimated CO 2 emissions [in Mton] in the Reference Projection update and the Reference Projection, 2002](https://thumb-eu.123doks.com/thumbv2/5doknet/3082480.9480/5.892.150.787.695.891/table-estimated-emissions-reference-projection-update-reference-projection.webp)
![Table S.2 Adjustment of CO 2 emissions in 2010 compared to the 2002 Reference Projection [Mton]](https://thumb-eu.123doks.com/thumbv2/5doknet/3082480.9480/7.892.153.791.145.328/table-s-adjustment-emissions-compared-reference-projection-mton.webp)
![Table 4.2 Achievements, starting points and expectations in the Reference Projection 2002 and the update [% per year]](https://thumb-eu.123doks.com/thumbv2/5doknet/3082480.9480/20.892.89.753.147.393/table-achievements-starting-points-expectations-reference-projection-update.webp)
