CO Monitoring Strategy
RIVM Letter report 680704015/2012 E. van der Swaluw | R. Hoogerbrugge
Colofon
© RIVM 2012
Parts of this publication may be reproduced, provided acknowledgement is given to the 'National Institute for Public Health and the Environment', along with the title and year of publication.
Eric van der Swaluw, CMM
Ronald Hoogerbrugge, CMM
Contact:
Eric van der Swaluw
CMM
Eric.van.der.Swaluw@rivm.nl
This investigation has been performed by order and for the account of Directorate-General for Environmental Protection, within the framework of 680704 Reporting Air Quality
Abstract
CO Monitoring Strategy
In the current Dutch monitoring network (LML) there are 21 locations where concentrations of carbon monoxide (CO) are being measured. However,
according to European legislation, at the current measured concentrations of CO, measurements are no longer required. In order to keep track of trends in the levels of CO-concentration in the Netherlands, RIVM proposes to continue measurement of CO-monitoring at a limited number of stations. This work has been performed for the account of the Ministry of Infrastructure and the Environment in order to update the monitoring strategy of CO.
It is recommended to continue measuring CO at the three different types of monitoring stations, i.e. rural background station, urban background station and traffic station. The urban background and traffic monitoring station should ideally be located in the same city such that the contribution of traffic to CO in a city can be accurately determined.
Rapport in het kort
Koolstofmonoxide meetstrategie
In het huidige Landelijk Meetnet Luchtkwaliteit (LML) worden er op 21 plaatsen in Nederland concentraties van koolstofmonoxide (CO) gemeten. Aangezien de huidige concentraties van koolstofmonoxide onder de voorgeschreven Europese norm liggen, is er geen meetverplichting meer vanuit de EU-richtlijnen. Om toch zicht te houden op de ontwikkelingen in deze concentraties in Nederland, stelt het RIVM voor om metingen van CO-concentraties op beperkte schaal voort te zetten. Dit is gedaan naar aanleiding van een verzoek van het ministerie van Infrastructuur en Milieu (I&M) om de meetstrategie van koolmonoxide te updaten.
Aanbevolen wordt om van elk van de drie typen meetstation van het LML er een te handhaven. Het gaat dan om een regionaal achtergrondstation, een stedelijk achtergrond station en een straatstation. Idealiter zouden de twee laatste in dezelfde stad moeten liggen. Op die manier kan de bijdrage van verkeer aan koolstofmonoxide in een stad nauwkeurig in kaart worden gebracht.
Contents
1 Introduction—7
2 Concentration, distribution and emission of CO in the Netherlands—9 2.1 Concentration and distribution of carbon monoxide—9
2.2 Emissions of carbon monoxide—11
3 Considerations on the number of monitoring stations—13
3.1 Number of monitoring stations required according to EU Directive 2008/50/EC— 13
3.2 Considerations for the number of monitoring sites—14
3.2.1 Monitoring sites at rural background, urban background and traffic stations—14 3.2.2 Grootschalige Concentratiekaart Nederland (GCN-map)—14
3.2.3 CAR—14
3.2.4 Smog and climate change—14
3.3 Measurements CO from DCMR and GGD Amsterdam—14
3.4 Summary—15
4 Proposal for monitoring strategy—17
5 Conclusion—19
References—20
Appendix A Current stations where CO is measured—21 Appendix B Traffic stations in the Netherlands—22 Appendix C Preliminary proposal for GCN scenario—23
1
Introduction
In the current Dutch National Air Quality Monitoring Network there are twenty-one locations where concentrations of CO are being measured. At the current levels of CO concentrations in the Netherlands, according to European legislation no structural CO measurements are required. However, continuation of the measurements could be justified to fulfil various goals. In this report it is explored to what extent CO-measurements should be maintained to satisfy these goals. This report is meant to document the reasoning behind the new measurement strategy for the CO-monitoring in the Dutch National Air Quality Monitoring Network.
2
Concentration, distribution and emission of CO in the
Netherlands
2.1 Concentration and distribution of carbon monoxide
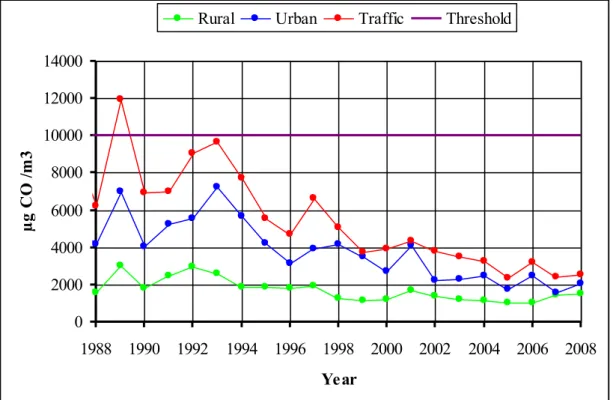
The concentration of carbon monoxide in the Netherlands has shown a strong decrease over the last few decennia in rural, urban and traffic areas (see Figure 1). The strongest declines are found in traffic areas. The reason for the decline in concentration is caused by the emission reductions in industry and the introduction of the catalytic converter in traffic. All levels of the maximum 8-hourly averaged CO concentration are currently far below the limit value of 10,000 μg/m3 (=8-hourly averaged value) as demanded by European
legislation. Concentrations are also below the lower assessment threshold for CO-monitoring of 5,000 μg/m3 (=8-hourly averaged value). This will be further
discussed in paragraph 3.1.
0
2000
4000
6000
8000
10000
12000
14000
1988 1990 1992 1994 1996 1998 2000 2002 2004 2006 2008
Year
µ
g
C
O
/m
3
Rural
Urban
Traffic
Threshold
Figure 1 Trend of the maximum 8-hourly averaged CO concentration over the period 1988-2008 from the Dutch National Air Quality Monitoring Network (data from Beijk et al., 2009).
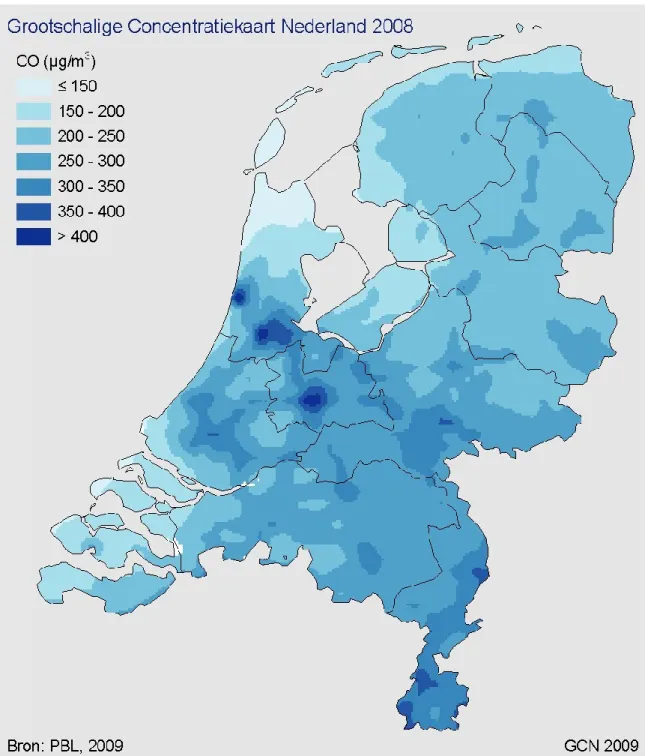
Figure 2 shows the ‘Grootschalig Concentratiekaart Nederland’ (GCN) of CO for the year 2008. Note that this map presents annual mean concentrations. The highest values are occurring in most urban agglomerations, the lowest values are occurring in the coastal regions and the Northern part of the Netherlands.
High values of CO can clearly be attributed to parts of the motorway network in the Netherlands.
Figure 2 GCN map of (annual mean) CO concentrations for the year 2008. (source: PBL)
2.2 Emissions of carbon monoxide
Table 1 Emission of CO in the Netherlands in 2008 (taken from compendium
voor de leefomgeving).
Sector Emissions (in kilotons)
Agriculture 1.4
Industry 161
Traffic and transport 427
Construction,trade,service and government
3.3
Housekeeping 54
Total (for EU-NEC Directive 2001/81/EC):
647
Ship traffic 18
Total: 665
The emissions in the Netherlands in 2008 are given in Table 1 per sector. The emissions of carbon monoxide have decreased with approximately 42% in 2008 with respect to 1990. In 2008 the total emission in the Netherlands equal 647 kilotons. This value is determined according to the definitions from the EU with regard to the National Emission Ceilings (NEC Directive, 2001/81/EC) and therefore does not include the contribution from ship traffic, which is small for carbon monoxide. From the 647 kilotons of emission 66% of the emission comes from traffic, 25% comes from industry and transport and 9% comes from other sources.
3
Considerations on the number of monitoring stations
3.1 Number of monitoring stations required according to EU Directive 2008/50/EC
In the Netherlands the EU air quality directive provides the requirements on which the configuration of the air quality network should be based. The threshold value of CO is 10000μg/m3 for eight-hour averaged values, whereas
the lower and upper assessment thresholds are respectively 5000 μg/m3 and
7000 μg/m3. An assessment threshold is considered to be exceeded if it has
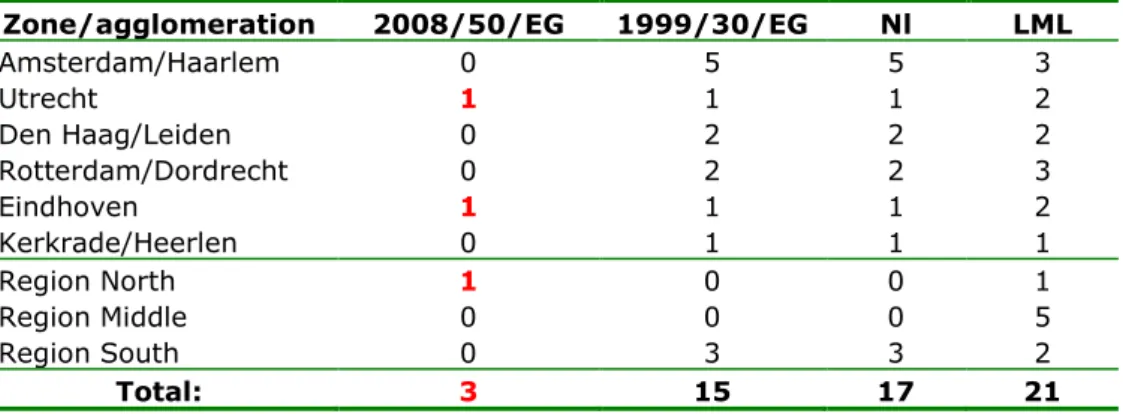
been exceeded during at least three separate years out of the previous five years. The minimum number of monitoring stations required for CO as required by European legislation 2008/50/EG was investigated in 2007. The outcome of the result is presented in column 2 of Table 2 (from the report LVM-LU-D4003).
Table 2 EU and Dutch guidelines plus current configuration of the LML from report LVM-LU-D4003
Zone/agglomeration 2008/50/EG 1999/30/EG Nl LML
Amsterdam/Haarlem 0 5 5 3 Utrecht 1 1 1 2 Den Haag/Leiden 0 2 2 2 Rotterdam/Dordrecht 0 2 2 3 Eindhoven 1 1 1 2 Kerkrade/Heerlen 0 1 1 1 Region North 1 0 0 1 Region Middle 0 0 0 5 Region South 0 3 3 2 Total: 3 15 17 21
The requirements for the number of stations to measure CO from the earlier guideline on CO from 1999/30/EG, the Dutch guidelines and the current LML configuration are also summarized in this table, in respectively column 3, 4 and 5. The data used for the report LVM-LU-D4003 was based on the observational data from 1999-2004. Since this does not cover the last five years, the period 2003-2008 was checked for CO concentration values at all monitoring stations (using the Tables in Beijk et al., 2007, 2008, 2009). It was found that all measured values except for the year 2004 at Utrecht-Erzeijstraat (639)1, are
below the lower assessment threshold of 5000 μg/m3. From this update there is
no longer an official requirement from the EU directive left to monitor CO in the Netherlands.
3.2 Considerations for the number of monitoring sites
3.2.1 Monitoring sites at rural background, urban background and traffic stations
There is no official requirement from EU legislation to monitor CO in the Netherlands. A stop of all measurements would imply that no monitoring data would be available anymore to keep track of possible trends in the CO
concentrations at rural background, urban background and traffic locations. If this is considered worthwhile, one would need at least 1 operational station at each of these types of stations. The urban background and traffic station should ideally be located in the same city.
3.2.2 Grootschalige Concentratiekaart Nederland (GCN-map)
In order to maintain the current annual production of a GCN-map of the Netherlands for CO one needs at least 6 background stations homogeneously spread over the Netherlands (Guus Velders, personal communication). The rural and urban background concentrations in these GCN-maps are the basis for the assessment of local concentrations by model calculations. In consultation with the Dutch ministry for environment it is concluded that in the current situation the need for local air quality assessment for CO is not present anymore. Therefore, additional monitoring sites to make GCN-maps are not warranted. The preliminary strategy which was developed during the production and discussion of the CO monitoring strategy for GCN-purposes can be found in Appendix C.
3.2.3 CAR
In the case a local assessment has to be made of the ambient CO concentration, usually the CAR-model is used to calculate the local traffic contribution. Although CO is a component which is primarily associated with traffic, the calibration needed for the CAR-model does not need an input from observing values of CO since it is calibrated with concentrations of NO2 and PM. In addition, it is not
expected that in practice the need is still felt to make CO calculations.
3.2.4 Smog and climate change
The contribution of CO to summer smog is very small compared to NOx and VOC
components. The same is true for the contribution of CO to greenhouse gases (see Mennen et al., 2008). Therefore topics like smog and climate do not demand the need for more monitoring stations.
3.3 Measurements CO from DCMR and GGD Amsterdam
CO was measured by GGD Amsterdam at three locations in 2008 (Visser et al., 2009). There are currently no plans to stop monitoring CO at these three locations (de Jonge, personal communication). A list of these stations is given in
the framework of “Verkeersonderzoek Rotterdam” (P.Kummu, personal communication).
Table 3 Locations of CO monitoring stations from GGD Amsterdam and DCMR
Station number Location Type
GGD007 Amsterdam-Einsteinweg Traffic GGD012 Amsterdam-van Diemenstraat Traffic
GGD014 Amsterdam-Overtoom Urban Background
DCMR 2069 Rotterdam-Bentinckplein Traffic/Urban Background DCMR 1043 Rotterdam-Overschie Traffic DCMR 1083* Rotterdam-Pleinweg Traffic DCMR 1081* Rotterdam-Zwartewaalstraat Urban Background DCMR* Rotterdam-Maasboulevard Traffic
*will be set up in the framework of “Verkeersonderzoek Rotterdam”
3.4 Summary
From the above considerations it is proposed to substantially decrease the number of CO monitoring stations to such a level that in particular the function is maintained to keep track of trends in CO concentrations. This can be
sufficiently covered in a configuration of three stations including a rural
background, urban background and a traffic station. The urban background and traffic station should ideally be located in the same city.
4
Proposal for monitoring strategy
For the scenario discussed in this subsection it is proposed to reduce the number of monitoring sites of CO from 21 to 3 sites within the Dutch National Air Quality Monitoring Network. The North region in the Netherlands would be a good choice for a rural background station since the monitoring stations in this region are most remote from areas with large CO sources. From the stations 934 and 938, station 934 would be recommended since CO has been monitored for a longer period than at station 938. However, it is proposed to take Cabauw (620) instead of Kollumerwaard, since Cabauw (620) is considered to become a super-site in the near future. A representative study performed by Nguyen et al. (2009) shows that the representativeness of the regional stations for CO is very comparable (Figure 9A in that report). So although Cabauw would be a new monitoring site, it is expected that due to the similar representativeness of the regional stations, a connection can be made with the values from former stations. The latter is necessary for trends. Therefore it would still be advised to have a comparability study between the stations Cabauw (620), Zegveld (633) and Kollumerwaard (934) in order to see the findings in Nguyen et al. (2009) confirmed for this specific situation.
For choosing a traffic station, monitoring station 639 would be recommended since at this station the mean maximum 8-hourly averaged value over the period 2003-2008 had the highest value of all traffic stations in the Netherlands, plus it was the only station over this period for which the lower assessment threshold of 5000 μg/m3 was exceeded for one year. However, because of the
strong reduction from 21 to 3 monitoring stations, it would be recommended to have the traffic and urban background station in the same city. The Table in Appendix A with the current monitoring stations shows that three cities have this combination of an urban background and a traffic station. The city of Nijmegen is selected since in this city the length of the time series for which both the urban background and traffic station are both operational has its largest value (see Figure 4 in Appendix B). Nijmegen is more representative city for the Netherlands as compared to for example Rotterdam and Amsterdam, which are both located in the densely populated area of de Randstad. Furthermore, CO is already being monitored in Amsterdam and Rotterdam by respectively GGD Amsterdam and DCMR (see Table 3). Finally, the mean maximum 8-hourly averaged value over the period 2003-2009 are highest at the urban background station in Nijmegen (as compared to the urban background station in
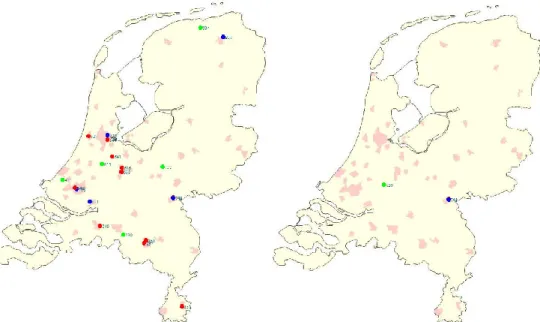
Appendix B). Figure 3 shows the reduction of monitoring stations as proposed in this document.
Figure 3 The proposal for the new monitoring strategy: the left panel depicts the current CO monitoring stations (in 2010); the right panel shows the new CO configuration as proposed in this document.
5
Conclusion
Mutual consideration between RIVM and VROM has led to the recommendation of the scenario sketched in section 4 of this report. Table 4 shows the chosen monitoring stations for this CO monitoring network with 1 rural background station, 1 urban background station and 1 traffic station.
Table 4 Stations for the new CO monitoring network
Station Type Operator
620 Cabauw Rural RIVM
742 Nijmegen Urban RIVM
References
LVM-LU-D4003, Beoordeling Nederlandse luchtkwaliteit volgens de concept nieuwe kaderrichtlijn, 2007
Nguyen, P.L., Hoogerbrugge, R., van Arkel, F. Evaluation of the
representativeness of the Dutch national Air Quality Monitoring Network, 680704010/2009, 2009
Snijder, A.M., Lucht in cijfers 2008 de luchtkwaliteit in de Rijnmond, 20923824, 2009
Visser, J.H., Luchtverontreiniging Amsterdam Datarapport meetresultaten 2008, 2008
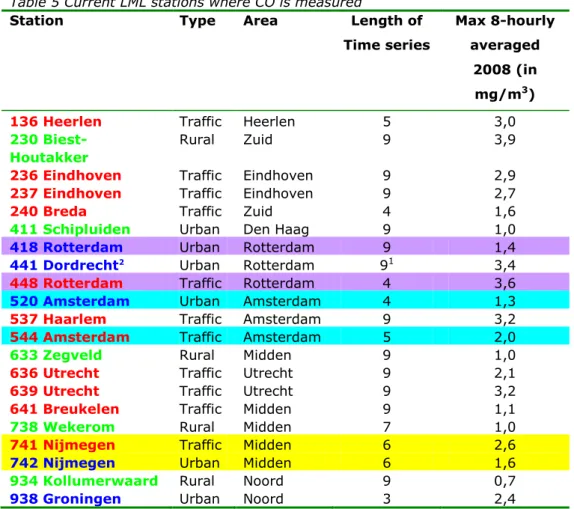
Appendix A Current stations where CO is measured
Table 5 Current LML stations where CO is measured
Station Type Area Length of
Time series
Max 8-hourly averaged
2008 (in mg/m3)
136 Heerlen Traffic Heerlen 5 3,0
230 Biest-Houtakker
Rural Zuid 9 3,9
236 Eindhoven Traffic Eindhoven 9 2,9
237 Eindhoven Traffic Eindhoven 9 2,7
240 Breda Traffic Zuid 4 1,6
411 Schipluiden Urban Den Haag 9 1,0
418 Rotterdam Urban Rotterdam 9 1,4
441 Dordrecht2 Urban Rotterdam 91 3,4
448 Rotterdam Traffic Rotterdam 4 3,6
520 Amsterdam Urban Amsterdam 4 1,3
537 Haarlem Traffic Amsterdam 9 3,2
544 Amsterdam Traffic Amsterdam 5 2,0
633 Zegveld Rural Midden 9 1,0
636 Utrecht Traffic Utrecht 9 2,1
639 Utrecht Traffic Utrecht 9 3,2
641 Breukelen Traffic Midden 9 1,1
738 Wekerom Rural Midden 7 1,0
741 Nijmegen Traffic Midden 6 2,6
742 Nijmegen Urban Midden 6 1,6
934 Kollumerwaard Rural Noord 9 0,7
938 Groningen Urban Noord 3 2,4
2 In 2010 measurements at 441 were stopped: a new urban background monitoring station in Dordrecht was opened in 2011 numbered 442. The length of the time series in 2011 hence equals zero.
Appendix B Traffic stations in the Netherlands
0
0.5
1
1.5
2
2.5
3
3.5
4
4.5
5
2002
2003
2004
2005
2006
2007
2008
2009
2010
C
O
c
on
ce
n
tr
at
ion
(
in
m
g/
m
3)
418
448
520
544
741
742
Figure 4 The maximum 8-hourly averaged values of CO in the Netherlands over the period 2003-2009 for which currently an urban background and traffic station exists (see appendix A).
Appendix C Preliminary proposal for GCN scenario
During the production and discussion of the CO monitoring strategy, a scenario was explored which would reduce the number of monitoring sites of CO from 21 to 7 sites within the Dutch National Air Quality Monitoring Network. This scenario would enable the production of a GCN map and monitor CO levels at an
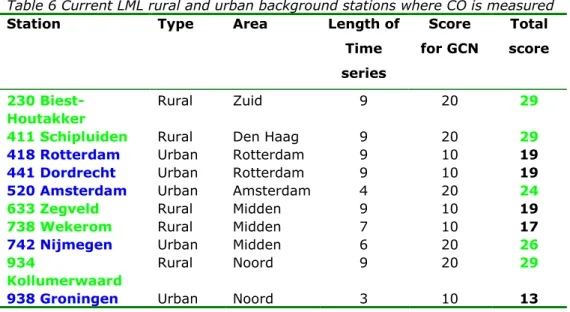
additional traffic station. Six background stations are selected for the purpose of the production of a GCN-map of CO for the Netherlands. In Table 6 we show the length of the time series for each background station which currently is part of the LML network. Regarding the number of years as a score, the stations can be ranked to this score. Next if we add a score for GCN to the number of
monitoring years of each station a total score is obtained. The score of individual stations for the GCN application has been chosen as either 10 or 20. For the ranking of the monitoring station we relied on expert judgement: the maximum score for GCN is chosen twice as large as the maximum score for trend since the former is considered to be more important for the current considered scenario than the number of monitoring years. As a result in this scenario stations important for GCN have priority over the stations with a long monitoring history. Table 6 shows the result of the scores for each station. There are clearly 5 sites with the highest score: the stations 230, 411, 520, 742 and 934. For the sixth site station 633 could be selected, although it has the same score as the stations 418 and 441, since it would yield the best homogeneous spreading over the Netherlands. An even better configuration is obtained when more emphasis is put on a homogenous spreading of sites over the Netherlands: in that case station 738 would be a better choice for the 6th location than station 6333.
Additionally a traffic location is included: monitoring station 639 is
recommended since at this station the mean maximum 8-hourly averaged value over the period 2003-2008 had the highest value of all traffic stations in the Netherlands plus it was the only station over this period for which the lower assessment threshold of 5000 μg/m3 was exceeded for one year (see Figure in
Appendix B). Figure 5 shows the result of the configuration of this scenario. It should be noted that station 520 could be covered by GGD014 and station 639 could be covered by GGD012 in which case 5 operational stations of LML would be enough.
3 A third option could be to consider Cabauw (620) as the 6th location which would provide data for both the
Figure 5 The proposal for the EU-GCN scenario: the left panel depicts the current CO monitoring stations (in 2010); the right panel shows the new CO
configuration in the EU-GCN scenario.
Table 6 Current LML rural and urban background stations where CO is measured
Station Type Area Length of
Time series Score for GCN Total score 230 Biest-Houtakker Rural Zuid 9 20 29
411 Schipluiden Rural Den Haag 9 20 29
418 Rotterdam Urban Rotterdam 9 10 19
441 Dordrecht Urban Rotterdam 9 10 19
520 Amsterdam Urban Amsterdam 4 20 24
633 Zegveld Rural Midden 9 10 19
738 Wekerom Rural Midden 7 10 17
742 Nijmegen Urban Midden 6 20 26
934
Kollumerwaard
Rural Noord 9 20 29
Dit is een uitgave van:
Rijksinstituut voor Volksgezondheid en Milieu