Cardiovascular disease as risk factor
for air pollution health effects
Validation of transgenic rodent model for hypertension
Letter report 630196001/2009
Cardiovascular disease as risk factor for air pollution health effects
Validation of a transgenic rodent model for hypertension
RIVM Briefrapport 630196001/2009, bijlage bij briefnummer 208/2009 BMV/RW/IG/mv.
People with an underlying cardiovascular disease or symptoms like hypertension could be more susceptible to negative health effects of air pollution. In this study, an animal model to study these effects is validated. Ilse Gosens1 A. John F. Boere1 Albert Wong2 Paul H.B. Fokkens1 Flemming R. Cassee1 1
Centre for Environmental Health Research (MGO), RIVM, Bilthoven 2
Expertise Centre for Methodology and Information Services (EMI), RIVM, Bilthoven
Contact: Ilse Gosens
Centre for Environmental Health Research (MGO) Ilse.Gosens@rivm.nl
Dit onderzoek werd verricht in opdracht van VROM, in het kader van het project luchtverontreiniging en gezondheid M/630196/09/KT
Rapport in het kort
Nieuw diermodel voor luchtverontreinigingsonderzoek
In transgene ratten blijkt de bloeddruk beter te controleren te zijn dan in ratten die van nature een hoge bloeddruk ontwikkelen. Hierdoor zijn bij experimenten minder proefdieren nodig.
Het RIVM gebruikt de transgene ratten (Cyp1a1Ren2) om te onderzoeken of ratten met een hoge bloeddruk gevoeliger zijn voor de schadelijke effecten van luchtverontreiniging. Hiervoor zijn in epidemiologische studies bij mensen aanwijzingen gevonden. Door de bloeddruk te meten met een draadloze zender, kunnen in één dier meerdere metingen gedaan worden en ook dit draagt bij tot de vermindering van het aantal proefdieren dat nodig is in een experiment.
Trefwoorden / Key words:
Abstract
Hypertension as risk factor for air pollution health effects
Epidemiological studies indicate an association between mortality of cardiovascular disease and elevated levels of air pollution. People with hypertension could be more susceptible to negative health effects of air pollution. To support this association, a representative animal model is needed for toxicological research. Previous studies in a rat model for hypertension demonstrated a large variation in disease status in adult animals, resulting in large groups of animals needed to establish an effect of air pollution.
The RIVM has explored the application of a transgenic rat model in which blood pressure can be elevated in a controlled manner. This model could be used to study the effect of exposure to diesel engine emissions and their effect on cardiovascular disease. Blood pressure signals are recorded using a wireless data transmitter to allow multiple measurements in one animal without disturbing its behavior. Using this measurement method, fewer animals are needed to establish an effect on blood pressure.
The stability of blood pressure rise can be well controlled in the transgenic rats without side-effects. This renders the model suitable for further air pollution research.
Trefwoorden / Key words:
Contents
1 Scientific summary 7
2 Introduction 9
3 Materials and methods 11
3.1 Animals 11
3.2 Surgery 11
3.3 Blood pressure measurements 11
3.4 Exposure 11 3.5 Plasma samples 12 3.6 Diet 12 3.7 Statistics 12 4 Results 13 4.1 Surgery 13
4.2 Effects of indole-3-carbinol on blood pressure 13
4.2.1 Blood pressure after diet containing 0,15% I3C 13
4.2.2 Prorenin levels after diet 0,15% I3C 14
4.3 DEE exposure 14
4.3.1 Animal weight after 2-week DEE exposure 15
4.3.2 Blood pressure after DEE exposure 15
4.3.3 Prorenin levels after DEE exposure 17
5 Discussion 19
5.1 Effect of inducing high blood pressure levels via diet 19 5.2 Direct effect of air pollution on transgene expression 19
6 Conclusion 23
7 Considerations for future research 25
8 References 27
9 Appendices 31
9.1 Exposure characteristics 31
1
Scientific summary
Cardiovascular disease as risk factor for air pollution health effects
Validation of a transgenic rodent model for hypertension
Epidemiological studies indicate that there is an association between mortality of cardiovascular disease and elevated levels of air pollution. People with an underlying cardiovascular disease or symptoms like hypertension could be more susceptible to negative health effects of air pollution compared to a healthy individual. To study elevated blood pressure as a risk factor resulting in more negative health effects after exposure to air pollution, a representative animal model is needed. Previous studies using a rat model with naturally and gradually developing high blood pressure have resulted in some clues on increased sensitivity. A disadvantage of this model is that the severity of the blood pressure dysregulation cannot be controlled resulting in a large variation in disease status in adult animals and the need for large groups of animals to establish a significant effect.
In this study, a transgenic rat model called Cyp1a1Ren2 is explored in which the blood pressure can be controlled and set to a certain level by adding a substance, indole-3-carbinol (I3C), to the diet. This model has not yet been used to study cardiovascular effects after exposure to air pollutants and needs to be validated. Validation involves determining if a constant elevated blood pressure level can be reached after administration of the diet. In addition, certain substances in diesel engine emissions could have the same effect on transgene expression and subsequent changes in blood pressure levels as the diet. This unwanted effect could confound the aimed level of elevated blood pressure and needs to be excluded. Blood pressure signals are recorded using a wireless data transmitter to allow multiple measurements in one animal without disturbing its behavior. Using this measurement method, fewer animals are needed to establish an effect on blood pressure.
After adding I3C to the diet of the transgenic rats, blood pressure levels stayed constantly elevated for 10 days. After exposure to diluted diesel engine emission for 2 weeks, no confounding activation of transgene expression or blood pressure changes are seen, thereby rendering this model suitable for further air pollution research.
2
Introduction
Epidemiological studies show that there is an association between mortality of cardiovascular disease and elevated levels of air pollution. People with an underlying cardiovascular disease or symptoms like high blood pressure could be more sensitive to negative health effects of air pollution, especially to the smaller fraction of particulate air pollution (PM2.5) in comparison to healthy people (Ibald-Mulli et al., 2001;Peel et al., 2007;Pope, III et al., 2004). With increasing concern over adverse effects of air pollution, it is important to understand which people are specifically vulnerable, to which fraction of air pollution the susceptibility exists and what plausible biologic mechanism is likely responsible for the increased susceptibility.
However, in epidemiological studies, the relationship between the presence of high blood pressure and increased sensitivity to effects of air pollution is difficult to prove. This is due to amongst others the difficulty to accurately assess blood pressure (dependent on many other factors, such as activity, time of day, their diet and use of medication), to accurately diagnose patients with the type of cardiovascular disease (elevated blood pressure can be a symptom with several underlying causes, like pulmonary defects, cardiovascular disease or even unknown causes) and to characterize the exposure. Therefore, to support the association found in epidemiological studies, toxicological research using an animal model with elevated blood pressure allows investigating this question under controllable conditions.
In the past, a rat model that has a naturally occurring elevated blood pressure has been studied, namely the spontaneous hypertensive rat (SH rat). In this model, the rat develops symptoms from birth, ultimately leading to large variation in disease status in adult animals. This heterogeneous population of rats leads to large standard deviations in obtained results and requires large groups of animals to determine harmful effects of air pollutants. However, indications of increased sensitivity have been found. For example, SH rats of 11-12 weeks old exposed to residual oil fly ash (ROFA) have more lung damage, a reduced anti-oxidant response in the lung and changes in hart conductivity measured by ECG compared to healthy Wistar Kyoto rats (Kodavanti et al., 2000). In this model, blood pressure rises at 5 weeks of age and continues to rise to 180 mm Hg by 10 weeks of age. Most rats develop severe disease symptoms, ranging from infarctions and bleeding in the brain or heart and kidney damage (Ganten and de Jong, 1994;Bing et al., 1995;Zhou and Frohlich, 2007).
In this study, the transgenic rat called Cyp1a1Ren2 with tightly controlled blood pressure without severe disease symptoms is explored for suitability for further studies on susceptibility to air pollutants.
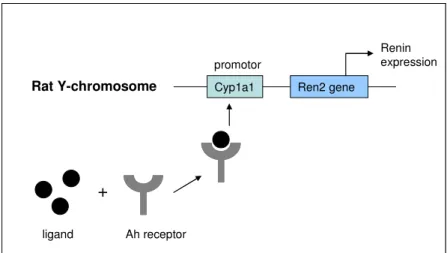
The Cyp1a1Ren2 rat (on a Fischer F344 background) has an additional mouse Renine2 gene coupled to a CYP450 (subtype 1a1) promoter inserted on the Y-chromosome. Accordingly, only in male rats expression of the transgene can be induced in the liver by addition of ligands that influence transcriptional control of the CYP450 promotor. One of those ligands can be indole-3-carbinol (I3C) that can be added to rat chow. The transgene encodes for a precursor of renin, prorenin, that can be activated locally in the body (figure 1).
Cyp1a1 Ren2 gene promotor Renin expression Rat Y-chromosome ligand Ah receptor
+
Cyp1a1 Ren2 gene promotor Renin expression Rat Y-chromosome ligand Ah receptor
+
After induction of high blood pressure using indole-3-carbinol (I3C) in the diet, subsequent exposure to air pollutants could determine if there is an increased sensitivity to develop negative health effects. By determining the effects of e.g. diesel engine emission (DEE) exposure, an important component of antropogenic emissions, in this transgenic rat model in the presence of elevated blood pressure, more knowledge of the relationship between air pollution, cardiovascular disease and mortality could be obtained. This might lead to clues that support the existence of sensitive groups in the population for air pollution health effects, as has been hypothesized for people with high blood pressure. However, to our knowledge, this animal model has not yet been applied in air pollution studies. Therefore, validation is needed and involves determining if adding I3C to the diet results in constant elevated blood pressure levels.
In addition, DEE could influence transgene expression and subsequent induction of blood pressure. DEE contains a certain percentage of aryl hydrocarbons in the form of polycyclic hydrocarbons (PAHs). These PAHs have affinity for the same CYP450 promotor to which the transgene is coupled (Takano et al., 2002) and could hypothetically induce transgene expression via aryl hydrocarbon receptor activation. There is a slight change that the transgene expression and thereby the levels of induction of blood pressure can be influenced by DEE independently of a diet. This could confound the blood pressure rise and also the results in later air pollution studies where the blood pressure rise needs to be precisely controlled. In order to use this transgenic rat model, the expression of the transgene should not be influenced by the PAHs in DEE.
Here we determine whether transgene expression is activated after exposing transgenic rats to DEE for two weeks that could induce a subsequent induction of blood pressure as monitored via telemetric transmitters. These small transmitters are impanted in the abdominal cavity of the animals without influencing their normal behavior and allow taking multiple measurements in the same animal, thereby reducing the total number of animals needed.
Figure 1. Schematic representation of induced renin expression by activation of the aryl hydrocarbon receptor (Ah) by a ligand. This ligand can be either a substance called indole-3-carbinol that is deliberately added to the diet or aryl hydrocarbons present in diesel engine emission (based on (Denison and Nagy, 2003).
3
Materials and methods
3.1
Animals
Male transgenic Cyp1a1Ren2 rats (12 weeks of age) were bred under SPF conditions in the animal facility of the RIVM, Bilthoven, the Netherlands, were received from Prof. Mullins group in Edinburgh (Mitchell et al., 2006). Male control wild-type Fischer F344 rats (12 weeks of age) were obtained from Harlan, the Netherlands. Food and water was provided ad libitum, except for access to food during DEE exposure. The experiment was approved by an independent scientific committee and an independent Animal Experimentation Ethical Committee prior to the study.
3.2
Surgery
Telemetric devices capable of detecting ECG (used to detect heart rate) and blood pressure (PhysioTelC50-PXT, DSI-TRANSOMA, St. Paul, MN) or blood pressure alone (DSI PhysioTelPA-C40) were used. ECG leads were placed according to the method of (Sgoifo et al., 1996). Larger lead coils were made than suggested by DSI (only a few millimeters large). The ECG signal was recorded during the study, but this data is not used here, since it is not required to study the hypothesis of this study.
Before surgery, the blood pressure cannula drift was checked by placing the transmitter on the table and measure the air pressure. During surgery, the transmitter is placed in the abdomen of the animal. The blood pressure cannula is placed in the lower aorta, just 0.5 cm above the bifurcation to the hind legs.Cannula placement was performed following DSI protocol.
3.3
Blood pressure measurements
To obtain baseline values, measurements were done using the DataQuest software program for several days and nights before the start of the exposure. Blood pressure signals are measured every three minutes for 10 seconds for all animals. Hourly averages were made for data analysis. On an exposure day, animals are placed inside the inhalation unit and be left alone for half an hour before the start of exposure. Before and after the exposure blood pressure is monitored in their home cage via plate transmitters that are placed underneath the Macrolon type III cages.
3.4
Exposure
Rats were exposed to +/- 150 µg/m3 diesel engine emission (DEE) generated by a diesel generator or filtered air in whole body inhalation units for 2 weeks, 6 hrs per day, except during weekends (Marra and Rombout, 1990). The configuration of the animals in the three inhalation units is such that minimal interference of the blood pressure signals is allowed (Appendix 8.1, figure 1).
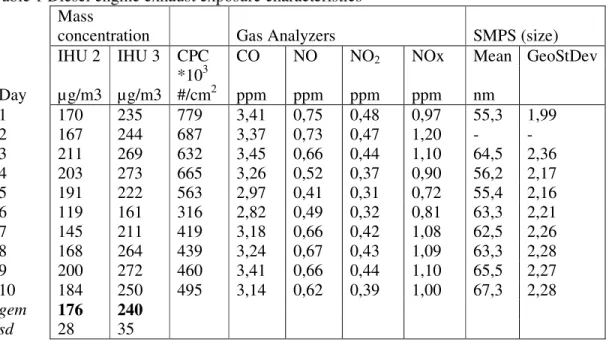
On the 6th day of the exposure protocol, the diesel generator was refilled with fuel. Instead of winter diesel, summer diesel had to be used which contains somewhat different components. This has resulted in a decrease in mass concentrations, which is corrected towards the end of the second week of exposure. The particles number, gases and particle size are determined in inhalation unit 2. Mass concentrations of DEE are determined in inhalation unit 2 and 3.
3.5
Plasma samples
Three days after the two weeks of DEE exposure, animals were anesthetized using isoflurane to obtain 0.5 ml of EDTA plasma via an orbita puncture. The plasma was used to determine circulating prorenin and active renin levels according to the method of Peters et al. (Peters et al., 2008). Plasma total renin and plasma active renin concentration were determined enzymatically using a solid phase radio immunoassay from the capacity to generate angiotensin I from excess substrate. Prorenin concentrations were calculated as the difference between total and active renin levels. After the DEE exposure part of the experiment was finished, the experiment continued by giving animals with a working telemetric device a blood pressure-inducing diet.
3.6
Diet
Three days after anesthesia (6 days after the DEE exposure) the experiment continued by giving 3 transgenic rats a diet with 0,15% indole-3-carbinol (I3C, Sigma-Aldrich) (SDS, Witham, UK) and 2 transgenic rats normal rat chow (SDS, Witham, UK) ad libitum for 20 days. After these 20 days, the animals were sacrificed by heart puncture under isoflurane anesthesia to remove the telemetric device. EDTA plasma samples were prepared to analyze prorenin and active renin levels.
3.7
Statistics
The prorenin protein expression data were analyzed by analysis of variance (ANOVA) and where appropriate by a T-test (two-sample assuming equal variances). Statistical significance is stated when P values are < 0.05, < 0.01 or < 0.005. In all graphs, error bars represent the standard deviation of the mean.
4
Results
4.1
Surgery
The surgical procedure to implant the telemetric devices needs good micromanipulation skills. Especially in the Fischer rats used as controls, surgery was proven difficult due to their smaller stature and subsequent smaller and stiffer aortas. After surgery, the animals were allowed to recover for at least two weeks, before acclimatization in the inhalation unit.A number of animals were lost due to complications during or after surgery. In some animals, the signal of the telemetric device was lost over time. This is due to slippage of the blood pressure cannula from the aorta. Eventually, blood pressure could be monitored in 2 instead of 4 transgenic rats exposed to filtered air (FA), in 3 instead of 5 transgenic rats exposed to diesel engine emissions (DEE) and in 2 instead of 5 Fischer rats exposed to DEE. It was intended to monitor the blood pressure during, before and after exposure. Unfortunately, the receivers that were needed to obtain signals in the inhalation unit during exposure did not work properly and no signals could be recorded.
4.2
Effects of indole-3-carbinol on blood pressure
4.2.1 Blood pressure after diet containing 0,15% I3C
Iindole-3-carbinol (I3C) should lead to a blood pressure rise due to increase prorenin expression. A percentage of 0,15% I3C was chosen, based on data showing a blood pressure rise without resulting in severe disease symptoms (Mitchell et al., 2006;Peters et al., 2008). Three transgenic rats received 0,15% I3C in their diet, while two transgenic rats received normal rat chow. The induction of blood pressure by I3C was followed over a time course of 20 days.
0 20 40 60 80 100 120 140 160 0 1 2 3 4 5 6 7 8 9 10 11 12 13 14 15 16 17 18 19
Time (days)
M
A
P
(
m
m
H
g
)
Unfortunately, the blood pressure signals of the two rats that received normal rat chow were unreliable and the signal for one rat was completely lost during the experiment. Therefore, only the blood pressure signals from the rats that received the diet are plotted.
After receiving 0,15% I3C in the diet, the blood pressure starts to rise at day 2. A total blood pressure rise of 18% (113,9 mm Hg to 139,1 mm Hg, figure 2) after 10 days was found. This rise remained constant during the last 10 days while receiving the diet.
4.2.2 Prorenin levels after diet 0,15% I3C
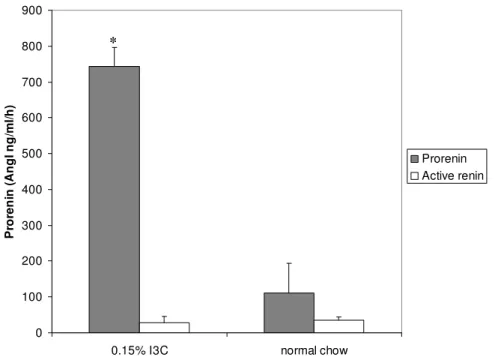
Blood samples were drawn in all rats to analyze prorenin and active renin levels after receiving 0,15% I3C in the diet or normal rat chow for 20 days (figure 3).
0 100 200 300 400 500 600 700 800 900
0.15% I3C normal chow
P ro re n in ( A n g I n g /m l/ h ) Prorenin Active renin
Plasma prorenin levels were significantly higher after the diet than after eating normal rat chow (742 +/- 53 versus 112 +/- 81 AngI ng/ml/hr). Active renin levels did not alter after the diet (34,6 ng AngI ng/ml/hr compared to control 28,8 ng AngI ng/ml/hr) as expected.
4.3
DEE exposure
Figure 3: Prorenin and active renin levels after 0,15% I3C diet (n=3) and normal rat chow (n=2). * P <0.05.
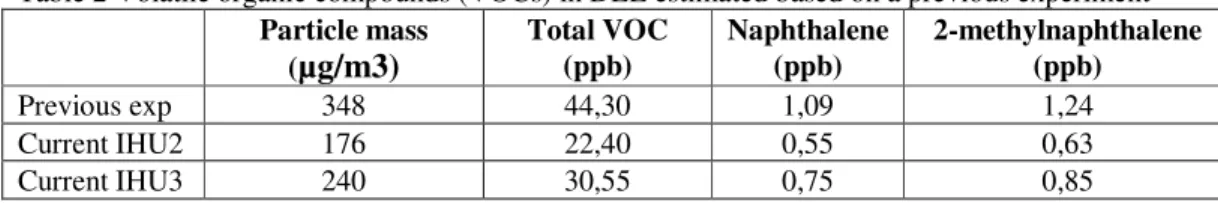
very low concentrations (0,65 and 0,74 ppb respectively). There could be more volatile PAHs in DEE as well as in the non-volatile fraction (adhered to particles), but there is no information available on this. With this limited information it is not possible to estimate the amount of PAHs in diesel engine emission and to say something about the likelihood of a response in the transgenic rat by these chemicals.
4.3.1 Animal weight after 2-week DEE exposure
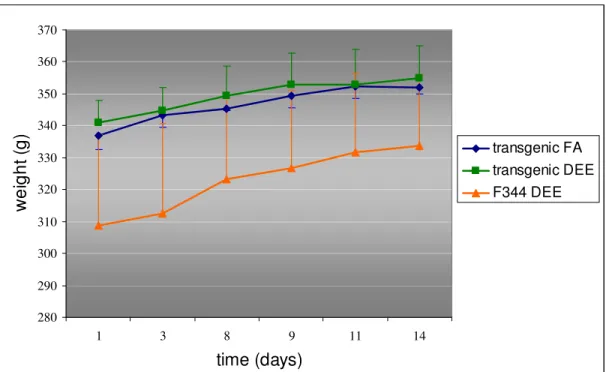
Transgenic rats that received filtered air or DEE gained 15 grams of body weight during exposure. F344 rats gained 25 grams of body weight, but this strain was of smaller statue than the transgenic rat at the start of the experiment. If animals are not feeling well, the weight would stay the same or even decrease. All animals gained weight, so DEE exposure did not affect the overall well-being of the animals (Figure 4). 280 290 300 310 320 330 340 350 360 370 1 3 8 9 11 14
time (days)
w
e
ig
h
t
(g
)
transgenic FA transgenic DEE F344 DEE4.3.2 Blood pressure after DEE exposure
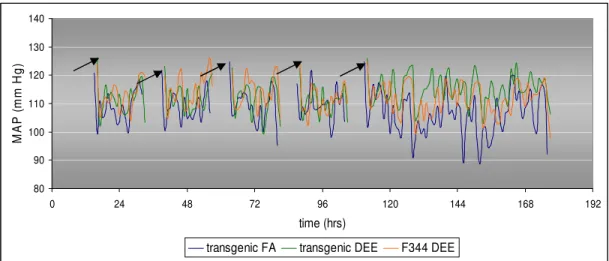
Baseline blood pressure of 7 animals in total has been recorded during 5 days and the average blood pressure values per exposed group were calculated per hour. Blood pressure recordings after the first week of exposure are plotted in figure 5. The gaps in the recordings are due to presence of the rats in the exposure units for 6 hours during which time no recordings were possible.
Figure 4: Body weights of transgenic rats exposed to filtered air (FA), transgenic rats exposed to DEE and wild-type F344 rats exposed to DEE for two weeks.
80 90 100 110 120 130 140 0 24 48 72 96 120 144 168 192 time (hrs) M A P ( m m H g )
transgenic FA transgenic DEE F344 DEE
In all rats, blood pressure is elevated right after exposure due to stress from removal from the inhalation unit (black arrows). A T-test did not reveal significant differences in hourly average at any time point. There is a trend towards a lower blood pressure in transgenic rats exposed to filtered air compared to at the start of the experiment.
In figure 6, the remaining signals are plotted for the weekend after the second week of exposure (rest period). 0,0 20,0 40,0 60,0 80,0 100,0 120,0 140,0 160,0 17 20 23 2 5 8 11 14 17 20 23 2 5 8 11 14 17 20 23 2 5 time (hrs) M A P ( m m H g )
Figure 5: Mean arterial blood pressure (MAP) values during the first week of exposure to DEE. Transgenic rats exposed to filtered air (FA) n= 2, transgenic rats exposed to DEE n= 3, wild-type F344 rats exposed to DEE n= 2.
After 2 weeks of exposure, in the weekend, a small blood pressure rise of 5 mm Hg was found both in the DEE exposed transgenic rats (116,2 +/- 5 mm Hg) as well as in the F344 rat (115,3 +/- 9 mm Hg) compared to the rat that received filtered air (109,0 +/- 6 mm Hg), indicating there could be an effect on blood pressure by DEE independent of the rat strain and therefore, independent of the transgene. However, the number of animals is too small to draw unequivocal conclusions.
A different statistical analysis was performed by using a mixed model linear regression statistical model (Appendix 8.2). In this analysis, the correlation between all repeated measurements of every animal is taken into account, thus using all blood pressure recordings to its maximal potential. There are no differences in blood pressure levels found in transgenic animals compared to non-transgenic Fischer rats.
In addition, the small blood pressure rise that was found using a T-test in DEE exposed animals compared to filtered air exposed animals independent of the transgene, was no longer seen.
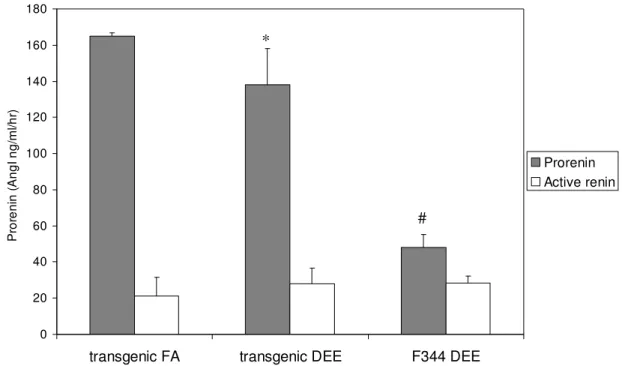
4.3.3 Prorenin levels after DEE exposure
Prorenin and active renin protein levels are determined in EDTA plasma after DEE or filtered air exposure of all exposed animals (Figure 7). Organic components in DEE could activate transgene expression resulting in equal active renin levels and higher prorenin plasma levels in a similar fashion as indole-3-carbinol that is added to a diet.
0 20 40 60 80 100 120 140 160 180
transgenic FA transgenic DEE F344 DEE
P ro re n in ( A n g I n g /m l/h r) Prorenin Active renin
In transgenic rats that received filtered air, prorenin levels were 165 +/- 2 ng AngI/ml/h. In the DEE exposed transgenic rats, a small but statistical significant decrease in prorenin levels is detected (138 +/- 20 ng AngI/ml/h). F344 rats after DEE exposure have significant lower prorenin levels (48 +/-7 ng AngI/ml/h) compared to transgenic rats. There was no reference group of F344 rats receiving filtered air used, but reported baseline levels are 100 +/- 100 ng AngI/ml/h)
(Peters et al., 2008)
. The largeFigure 7: Prorenin/ Active renin levels after filtered air (FA) and diesel engine emission (DEE) exposure. * P< 0.05, # P< 0.001 compared to transgenic FA.
*
variation in this baseline level as well as the fact that determination of prorenin levels are preferred to be analyzed simultaneously in the same experiment due to two enzymatic reaction steps, make it difficult to predict if lower prorenin levels would also be found in DEE exposed non-transgenic F344 rats. If so, lower prorenin levels after DEE exposure could represent a general effect of substances in DEE on the renin-angiotensin system, independent of the presence of a transgene.
Here, lower prorenin baseline levels in F344 rats compared to transgenic rats could indicate a strain difference although both rats are on a similar genetic background and similar prorenin levels are expected.
5
Discussion
5.1
Effect of inducing high blood pressure levels via diet
Previous studies using the Cyp1a1Ren2 transgenic rat model have shown that depending on the amount of indole-3-carbinol in the diet, the blood pressure level can be set on a desired level. In addition to elevated blood pressure levels, cardiac hypertrophy (thickening of the heart muscle which results in a decrease in size of the chamber of the heart) develops, without kidney damage. In our study, by using 0,15% I3C it is possible to elevate the blood pressure with 25 mm Hg in 20 days with a constant elevation during the last 10 days, not resulting in severe disease symptoms. This could however increase sensitivity to negative effects of air pollution, which can be determined in a follow-up study. Higher amounts in the diet (0.3%) will induce a malignant form of high blood pressure with kidney damage and even premature death (Mitchell et al., 2006).
The increase in mean arterial blood pressure levels of 18% after intake of a diet containing 0,15% I3C is slightly lower than expected and should have been between 18 and 40%, compared to other studies (Mitchell et al., 2006;Peters et al., 2008). Mitchell et al. described a systolic blood pressure increase of 40% after 0,15% I3C in the diet for 15 days using a different method to measure blood pressure, namely by tail-cuff plethysmography. Using telemetric transmitters, Peters et al. found an 18% increase in mean arterial blood pressure after a two week diet containing 0,125% I3C, while a diet of 0,167% I3C led to 39% increase.
Prorenin levels in EDTA plasma are elevated by 0,15% I3C (742 +/- 53 AngI ng/ml/hr), but also not as much as was anticipated based on previous findings. Peters et al. found prorenin levels of 10000 ng AngI/ml/hr after slightly higher concentrations of 0,165% I3C (Peters et al., 2008). However, this does correspond to the lower than expected mean arterial blood pressure levels after inducting that are also found in this study.
A lower response to the diet could be due to the fact that food intake was lower than desired, since no efforts were done to mask the bitter taste of I3C. All previous studies used something to mask the taste, like adding a chocolate/vanilla flavor which is not mentioned in the materials and method section of the previously published papers. However, based on body weights of the animals, a lower food intake does not seem to be the case. After the study was performed, it turned out that Peters et al. added extra salt in the rat diet (1% versus 0,3% NaCl in our diet) (Peters et al., 2008). It is known that these rats are salt sensitive (personal communication, Dr. Ben Janssen, CARIM Maastricht) and extra salt in the I3C diet may have a synergistic effect on the development of high blood pressure. It is likely that a lower response to the diet is due to the lower salt content.
It could also be that the rat strain studied here suffered from genetic drift after several rounds of breeding, making its genetic make-up slightly different that the original rat strain from Peters et al. and could account for a lower response to the I3C component (Peters et al., 2008).
5.2
Direct effect of air pollution on transgene expression
A transgenic rat model in which blood pressure rise can be precisely controlled without severe disease symptoms could be an interesting model to study the existence of susceptible groups to adverse effects
of air pollutants. Validation of this model involves determining if diesel engine emission (DEE) can have a possible confounding effect by influencing prorenin transgene expression and a subsequent blood pressure rise. If so, it would implicate that DEE not only influences the controlled level of blood pressure rise, but also makes it difficult to discriminate between effects that occur through physiological relevant mechanisms and effects that are mediated through transgene expression.
Before the experiment was performed, a crude calculation on the likelihood of DEE influencing transgene expression has been attempted. A calculation based on a number of assumptions resulted in DEE expected to contain almost 500 times less inducible substances compared to a diet that is designed and proven to induce a blood pressure rise. Given a DEE exposure of 175 µg/m3, 6 hr/day and the minute ventilation volume in rats (250 ml/min), the rats inhaled 90 liter containing 15.750 µg DEE. In a worst case scenario approach, everything that is inhaled is assumed to deposit in the lung. Assuming a percentage of 0,5% particle phase PAHs in DEE (Rogge et al., 1993), this results in 79 µg PAHs inhalation exposure. A diet containing 0,15% I3C (assuming 25 grams of food intake per day) results in 37,5 mg oral exposure.
However, this is a very crude calculation. It is not known how much indole-3-carbinol actually reaches the circulation by eating the diet and how this compares to the deposited dose of PAHs via the inhalation route of exposure and which percentage reaches the circulation or how the affinity of these different substances is towards the aryl hydrocarbon receptor. Also actual information on volatile organic compounds, including PAHs in DEE and more importantly PAHs in the particulate phase is very limited or not available at all for this experiment. Therefore, the only way to ascertain if DEE has a confounding effect on transgene expression is empirical. In the present study, we noted that DEE does not influence transgene expression.
Under physiologic circumstances, the renin enzyme is secreted by the kidney in response to a decrease in arterial blood pressure, a decrease in sodium chloride levels in the ultra-filtrate of the nephron, the basic structural and functional unit of the kidney or altered sympathetic nervous system activity acting through the β1 adrenergic receptors. Renin activates the Renin-Angiotensin-System (RAS), thereby increasing the blood pressure and restoring the perfusion pressure in the kidneys (Figure 8).
In the Cyp1a1Ren2 rat, after induction of trangene expression, prorenin is converted to renin locally and stimulates production of Angiotensin I (Bachmann et al., 1992). Angiotensin I is cleaved mainly in
Prorenin Renin
angiotensinogen
Angiotensin I
Angiotensin II
ACE
Figure 8: The Renin-Angiotensin-System (RAS) system leading to vasoconstriction by Angiotensin II and induction of blood pressure. ACE is angiotensin converting enzyme.
production of its subsequent protein and activation of the whole cascade of the RAS system, ultimately leading to elevated blood pressure levels.
Analysis of prorenin plasma levels revealed a small decrease in transgenic rats after two weeks of DEE exposure. If PAHs in DEE would bind to aryl hydrocarbon receptors, an increase in prorenin levels would have been expected. Therefore, there is no activation of the transgene.
After inhalation of DEE, there might be a lowering effect on endogenous prorenin levels, explaining the lower prorenin levels in both transgenic and non-transgenic rats. Unfortunately, the method to establish prorenin protein levels cannot discriminate between the rat endogenous protein and the mouse transgenic protein, leaving this to a single observation.
The changes in prorenin protein levels were not enough to influence blood pressure levels. Monitoring blood pressure after DEE exposure via telemetric transmitters did not show any modulation. There was a trend towards an increase of blood pressure in all DEE exposed animals after the exposure had stopped during the weekend, indicating that DEE in general could have a small effect on elevated blood pressure independent of the transgene. Upadhyay et al. found that inhalation exposure of SH rats to ultrafine particles of carbon black resulted in an increase in blood pressure and returned to normal after a few days after exposure (Upadhyay et al., 2008).
Performing more elaborate statistical analysis using a random effects model, we found that DEE had no significant overall effect on blood pressure, for any given exposure time. Additionally, we found no significant differences in blood pressure between exposed transgenic and wild type rats.
Therefore, we conclude that although there is a small decrease in prorenin levels in transgenic rats after DEE exposure, the exposure did not result in altered blood pressure levels, rendering the model suitable for follow-up studies.This rat model could represent a human population in which the renin-angiotensin system (RAS), which plays a central role in blood pressure control, is disturbed leading to elevated blood pressure levels (Campbell, 1987). Depending on the amount of inducing component in the diet, low levels of renin can be produced leading to constant elevated blood pressure without severe disease symptoms.
6
Conclusion
The use of a validated animal model can underline associations found in epidemiology studies on the existence of susceptible groups in the population with underlying cardiovascular disease and health effects of air pollution. The Cyp1a1Ren2 transgenic ratmodel is found suitable for air pollution research to establish a further link between the presence of hypertension and negative health effects by air pollutants. By providing the transgenic rats with a diet containing a blood pressure inducing substance during 20 days, blood pressure levels were elevated and remained at a constant level over the last 10 days. In addition, exposure to diluted diesel engine emissions during two weeks did not confound activation of transgene expression or influence the blood pressure.
A telemetric device that is used to monitor blood pressure changes allowed to take repeated measurements in the same animal, resulting in a lower total amount of animals required.
This rat model could represent a human population in which the renin-angiotensin system (RAS), which plays a central role in blood pressure control, is disturbed leading to elevated blood pressure levels.
7
Considerations for future research
This model could be used to study the interaction between dysrhythmia as seen on an electrocardiogram (ECG) caused by air pollution in the presence of elevated blood pressure levels. There are already some indications that the presence of high blood pressure negatively influences the appearance of cardiac arrythmia. An epidemiological study showed evidence of stronger associations of hospital visits for dysrhythmia and congestive heart failure in the presence of hypertension in relation to increased air pollution levels compared with visits of people without hypertension (Peel et al., 2007). A toxicological study shows that ECG abnormalities are found after instillation of residual oil fly ash (ROFA) in healthy as well as in the monocrotaline rat model for pulmonary hypertension (Watkinson et al., 1998). A particular type of arrhythmia, called second-degree atrioventricular conduction blocks in the ROFA-treated rats appeared to be most similar to the Mobitz Type II arrhythmia subclassification in humans. A similar effect of ROFA has been described in spontaneous hypertensive rats after inhalation, but is not seen in healthy rats after the same exposure
(Farraj et al.,
2009)
.Another phenomenon could be the influence of air pollutants on the renin-angiotensin system itself. Disturbance of the RAS system is the cause of some forms of hypertension in humans. Constant hypertension is one of the risk factors for the occurance of heart attacks, strokes, heart failure and arterial aneurysm, and could cause chronic kidney failure. At subclinical elevations of blood pressure, as can be set in the transgenic model there are no symptoms of heart disease yet. However, air pollutants could exacerbate dysregulation of the endogenous renin-angiotensin system and lead to further blood pressure rise or for example endothelial wall damage. In addition, Angiotensin II is known for its thrombogenic potential by affecting platelet aggregation and production of PAI-1 and PAI-2 (Skurk et al., 2001;Gesualdo et al., 1999;Ridker et al., 1993). PAI-1 could be monitored in a follow-up experiment and an increase in PAI-1 (inhibition of fibrinolysis) could result in a prothrombotic status.
Especially ultrafine particles, of which translocation from the lung into the circulation has been proposed (Nemmar et al., 2001;Nemmar et al., 2004;Oberdorster et al., 2002), could influence the renin-angiotensin system in the presence of elevated blood pressure levels. Inhalation of ultrafine carbon particles by spontaneous hypertensive rats, at levels below induction of pulmonary
inflammation do influence blood pressure and activate the renin-angiotensin system (Upadhyay et al., 2008).
A few considerations should be taken into account before starting follow-up research:
- Telemetric devices should be used to allow multiple measurements in the same animal, thereby reducing the total number of animals needed.
- Surgery to implant telemetric devices should be performed by a highly experienced technician to avoid loss of animals or loss of signals due to slippage of the blood pressure cannula from the veins. Spare animals for surgery need to be taken into account to ensure enough valuable measurements during the experiment.
- Restoration of a normal day/night rhythm after isoflurane anesthesia takes longer than expected and a longer time period of at least 5 days to allow recovery should be included before starting or resuming an experiment.
- The wild-type Fischer rat might not be the best control for the Cyp1a1Ren2 transgenic rat, although both have a similar background. Their physical appearance and weight gain is different as well as some physiologic parameters like heart rate and lower baseline prorenin levels. Female transgenic rats could be used as a control, although sexe differences in blood pressure regulation do exist.
- The I3C diet should contain at least 1% salt and should be flavored with chocolate/vanilla aroma (personal communication Prof. Jorg Peters) or with peanut oil (personal communication Dr. Ben Janssen) to mask the bitter taste.
- Collaboration with university groups that have extensive experience with the diet-induced blood pressure model should be elaborated to understand the changes in the cardiovascular system with and without DEE exposure.
- DEE exposure might affect endogenous levels of the RAS system independently of transgene expression. Effects of emissions on this physiological regulatory system of blood pressure are understudied and should deserve more attention in the future.
8
References
1. Bachmann, S., J.Peters, E.Engler, D.Ganten, and J.Mullins. 1992. Transgenic rats carrying the mouse renin gene--morphological characterization of a low-renin hypertension model. Kidney Int. 41:24-36.
2. Bing, O.H., W.W.Brooks, K.G.Robinson, M.T.Slawsky, J.A.Hayes, S.E.Litwin, S.Sen, and C.H.Conrad. 1995. The spontaneously hypertensive rat as a model of the transition from compensated left ventricular hypertrophy to failure. J. Mol. Cell Cardiol. 27:383-396.
3. Campbell, D.J. 1987. Circulating and tissue angiotensin systems. J. Clin. Invest 79:1-6.
4. Denison, M.S. and S.R.Nagy. 2003. Activation of the aryl hydrocarbon receptor by structurally diverse exogenous and endogenous chemicals. Annu. Rev. Pharmacol. Toxicol. 43:309-334.
5. Farraj, A.K., N.Haykal-Coates, D.W.Winsett, M.S.Hazari, A.P.Carll, W.H.Rowan, A.D.Ledbetter, W.E.Cascio, and D.L.Costa. 2009. Increased non-conducted P-wave arrhythmias after a single oil fly ash inhalation exposure in hypertensive rats. Environ Health Perspect. 117:709-715.
6. Ganten, D. and W.de Jong. 1994. Experimental and genetic models of hypertension. In Handbook of hypertension vol. 16. New York, Elsevier.
7. Gesualdo, L., E.Ranieri, R.Monno, M.R.Rossiello, M.Colucci, N.Semeraro, G.Grandaliano, F.P.Schena, M.Ursi, and G.Cerullo. 1999. Angiotensin IV stimulates plasminogen activator inhibitor-1 expression in proximal tubular epithelial cells. Kidney Int. 56:461-470.
8. Ibald-Mulli, A., J.Stieber, H.E.Wichmann, W.Koenig, and A.Peters. 2001. Effects of air pollution on blood pressure: a population-based approach. Am. J. Public Health 91:571-577.
9. Kodavanti, U.P., M.C.Schladweiler, A.D.Ledbetter, W.P.Watkinson, M.J.Campen, D.W.Winsett, J.R.Richards, K.M.Crissman, G.E.Hatch, and D.L.Costa. 2000. The spontaneously hypertensive rat as a model of human cardiovascular disease: evidence of exacerbated cardiopulmonary injury and oxidative stress from inhaled emission particulate matter. Toxicol. Appl. Pharmacol. 164:250-263.
10. Marra, M. and P.J.A.Rombout. 1990. Design and performance of an inhalation chamber for exposing laboratory animals to oxidant air pollutants. Inhalation Toxicology 2:187-204.
11. Mitchell, K.D., S.J.Bagatell, C.S.Miller, C.R.Mouton, D.M.Seth, and J.J.Mullins. 2006. Genetic clamping of renin gene expression induces hypertension and elevation of intrarenal Ang II levels of graded severity in Cyp1a1-Ren2 transgenic rats. J. Renin. Angiotensin. Aldosterone. Syst. 7:74-86.
12. Nemmar, A., M.F.Hoylaerts, P.H.Hoet, and B.Nemery. 2004. Possible mechanisms of the cardiovascular effects of inhaled particles: systemic translocation and prothrombotic effects. Toxicol. Lett. 149:243-253.
13. Nemmar, A., H.Vanbilloen, M.F.Hoylaerts, P.H.Hoet, A.Verbruggen, and B.Nemery. 2001. Passage of intratracheally instilled ultrafine particles from the lung into the systemic circulation in hamster. Am. J. Respir. Crit Care Med. 164:1665-1668.
15. Peel, J.L., K.B.Metzger, M.Klein, W.D.Flanders, J.A.Mulholland, and P.E.Tolbert. 2007. Ambient air pollution and cardiovascular emergency department visits in potentially sensitive groups. Am. J. Epidemiol. 165:625-633.
16. Peters, B., O.Grisk, B.Becher, H.Wanka, B.Kuttler, J.Ludemann, G.Lorenz, R.Rettig, J.J.Mullins, and J.Peters. 2008. Dose-dependent titration of prorenin and blood pressure in Cyp1a1ren-2 transgenic rats: absence of prorenin-induced glomerulosclerosis. J. Hypertens. 26:102-109.
17. Pope, C.A., III, R.T.Burnett, G.D.Thurston, M.J.Thun, E.E.Calle, D.Krewski, and J.J.Godleski. 2004. Cardiovascular mortality and long-term exposure to particulate air pollution: epidemiological evidence of general pathophysiological pathways of disease. Circulation 109:71-77.
18. Ridker, P.M., C.L.Gaboury, P.R.Conlin, E.W.Seely, G.H.Williams, and D.E.Vaughan. 1993. Stimulation of plasminogen activator inhibitor in vivo by infusion of angiotensin II. Evidence of a potential interaction between the renin-angiotensin system and fibrinolytic function. Circulation 87:1969-1973.
19. Rogge, W.F., L.M.Hildemann, and M.A.Mazurek. 1993. Sources of fine organic aerosol 2. Noncatalyst and catalyst-equipped automobiles and HD diesel trucks. Environ Sci Technol 27:636-651.
20. Sgoifo, A., D.Stilli, D.Medici, P.Gallo, B.Aimi, and E.Musso. 1996. Electrode positioning for reliable telemetry ECG recordings during social stress in unrestrained rats. Physiol Behav. 60:1397-1401.
21. Skurk, T., Y.M.Lee, and H.Hauner. 2001. Angiotensin II and its metabolites stimulate PAI-1 protein release from human adipocytes in primary culture. Hypertension 37:1336-1340.
22. Takano, H., R.Yanagisawa, T.Ichinose, K.Sadakane, K.Inoue, S.Yoshida, K.Takeda, S.Yoshino, T.Yoshikawa, and M.Morita. 2002. Lung expression of cytochrome P450 1A1 as a possible biomarker of exposure to diesel exhaust particles. Arch. Toxicol. 76:146-151.
23. Upadhyay, S., T.Stoeger, V.Harder, R.F.Thomas, M.C.Schladweiler, M.Semmler-Behnke, S.Takenaka, E.Karg, P.Reitmeir, M.Bader, A.Stampfl, U.P.Kodavanti, and H.Schulz. 2008. Exposure to ultrafine carbon particles at levels below detectable pulmonary inflammation affects cardiovascular performance in spontaneously hypertensive rats. Part Fibre. Toxicol. 5:19.
24. Watkinson, W.P., M.J.Campen, and D.L.Costa. 1998. Cardiac arrhythmia induction after exposure to residual oil fly ash particles in a rodent model of pulmonary hypertension. Toxicol. Sci 41:209-216.
25. Zhou, X. and E.D.Frohlich. 2007. Analogy of cardiac and renal complications in essential hypertension and aged SHR or L-NAME/SHR. Med. Chem. 3:61-65.
9
Appendices
9.1
Exposure characteristics
IHU 1: filtered air
#1 TGR
#3 TGR
#2 TGR
IHU 2: diesel
#4 TGR
#5 TGR
#6 TGR
#9 F344
#10 F344
IHU3: diesel
#11 F344
#12 F344
#13 F344
#7 TGR
#8 TGR
Figure 1: Inhalation units (IHU) and configuration of 8 transgenic rats (TGR) and 5
Fischer F344 control rats.
Table 1 Diesel engine exhaust exposure characteristics
Mass
concentration
Gas Analyzers
SMPS (size)
IHU 2 IHU 3 CPC
CO
NO
NO
2NOx
Mean GeoStDev
Day
µg/m3
µg/m3
*10
3#/cm
2ppm
ppm
ppm
ppm
nm
1
170
235
779
3,41
0,75
0,48
0,97
55,3
1,99
2
167
244
687
3,37
0,73
0,47
1,20
-
-
3
211
269
632
3,45
0,66
0,44
1,10
64,5
2,36
4
203
273
665
3,26
0,52
0,37
0,90
56,2
2,17
5
191
222
563
2,97
0,41
0,31
0,72
55,4
2,16
6
119
161
316
2,82
0,49
0,32
0,81
63,3
2,21
7
145
211
419
3,18
0,66
0,42
1,08
62,5
2,26
8
168
264
439
3,24
0,67
0,43
1,09
63,3
2,28
9
200
272
460
3,41
0,66
0,44
1,10
65,5
2,27
10
184
250
495
3,14
0,62
0,39
1,00
67,3
2,28
gem
176
240
sd
28
35
Table 2 Volatile organic compounds (VOCs) in DEE estimated based on a previous experiment Particle mass (
µg/m3)
Total VOC (ppb) Naphthalene (ppb) 2-methylnaphthalene (ppb) Previous exp 348 44,30 1,09 1,24 Current IHU2 176 22,40 0,55 0,63 Current IHU3 240 30,55 0,75 0,859.2
Statistical analysis using mixed model linear regression
Model specification
Model 1
Blood pressure is the outcome variable y. For the explanatory variables x we use: day/nighttime, stress or no stress by presence of human contact, exposure to diesel, interaction between strain and diesel. Our model can then be formulated as follows:
diesel
strain
diesel
strain
stress
night
ure
bloodpress
=
β
0+
β
1+
β
2+
β
3+
β
4+
β
5*
where:night is a dummy variable for daytime (=0) en nighttime (=1) stress is a dummy variable for no stress (=0) en stress (=1)
strain is a dummy variable for transgenic (=0) en wild type rat (=1) diesel is a dummy variable for no diesel (=0) en diesel exposure (=1)
strain*diesel is a interaction-term for strain en diesel. If strain=1 en diesel=1, then the interaction term strain*diesel=1. In other cases strain*diesel=0.
Model 2
We also use an alternative model, to investigate the effect of time after exposure:
time
strain
time
strain
stress
night
ure
bloodpress
=
β
0+
β
1+
β
2+
β
3+
β
4+
β
5*
wheretime is a categorical variable for time t, with t=0,1,2,3,...,25 (exposure time that was more than 25 hours was set to 25 hours). t=1 signifies 1 hour after exposure. The reference
Model 1 Results
AIC BIC logLik 15013.32 15064.72 -7497.66
Random effects: Formula: ~1 | dier (Intercept) StdDev: 2.277478
Formula: ~1 | dagnr %in% dier (Intercept) Residual StdDev: 3.089948 6.595292
Fixed effects: y ~ nacht + stress + stam * diesel.alt
Value Std.Error DF t-value p-value (Intercept) 109.05021 1.0501303 2122 103.84445 0.0000 nacht1 3.58554 0.2981615 2122 12.02549 0.0000 stress1 13.29860 0.8597498 2122 15.46799 0.0000 stam1 3.33577 2.4180493 106 1.37953 0.1706 diesel.alt1 1.41564 0.9481188 2122 1.49311 0.1356 stam1:diesel.alt1 -3.98623 2.2994661 2122 -1.73355 0.0831
Note: nacht – night, stam – strain. ‘diesel.alt’ refers to the diesel dummy. ‘stam1:dieselalt1’ is an interaction term between strain=1 and diesel=1.
The intercept gives the ‘baseline’ blood pressure value (109). Nighttime leads to a significant increase of +3.58 in blood pressure (p<0.001). Stress is a particular important variable, as it leads an increase of 13.30 (p<0.001). On the other hand, the overall effect of strain and diesel is not significant. At the same time, the interaction term between strain and diesel is not significant as well. This is explained in figure 2.
Interaction
Diesel=0 Diesel=1
Overall effect of exposure of diesel
Effect of exposure of diesel for strain=1 Effect of exposure of diesel for strain=0
1 1b
1a
2
The overall effect of diesel is signified by arrow 1. It corresponds with the effect size given by the regression coefficient for ‘diesel.alt1’, beta=3.335. Arrow 2 illustrates the effect of strain on blood pressure, which corresponds to beta=1.416. In a model without interaction effects, both of these would be interpreted as overall effects, meaning that these arrows represent the effect over the total population. However, this model does include interaction effects between exposure of diesel and the strain type. If interaction effects are included, the aforementioned overall diesel exposure effects can be seen as a reference effect instead, which are valid for strain=0 and can be compared to diesel exposure effects for strain = 1. In other words, what was arrow 1 in a model without interaction effects is now composed of arrow 1a and 1b in a model with interaction effects (and the same argument can be made for arrow 2, but for purposes of clarity, it is not depicted here). We can conclude that within the transgenic group, diesel exposure does not lead to a significant change in blood pressure. Similarly, within the non-exposed wild type F344 rats no significantly different blood pressure levels are found when compared to non-exposed transgenic rats (non-exposed includes data from measurements taken
Figure 2: Overview of effects in statistical model 1 without interaction (arrow 1 and 2) and with interaction terms (arrow 1a and 1b). Strain 0 = transgenic rat, strain 1 = wild type rat F344, diesel 0 = no diesel engine emissions (DEE) exposure, diesel 1= around 200 µg/m3 DEE exposure.
found at arrow 1a. In other words, it means that arrow 1b is significantly different from arrow 1a. However, this is not the case, which means that the effect of exposure is the same for both transgenic and wild type rats.
Model 2 results
AIC BIC logLik 14733.17 15057.49 -7309.583
Random effects: Formula: ~1 | dier (Intercept) StdDev: 2.766732
Formula: ~1 | dagnr %in% dier (Intercept) Residual StdDev: 3.189157 6.302628
Fixed effects: y ~ nacht + stress + stam * t.blootstelling
Value Std.Error DF t-value p-value (Intercept) 110.78803 1.590373 2074 69.66166 0.0000 nacht1 3.66168 0.367602 2074 9.96098 0.0000 stress1 14.42240 1.590218 2074 9.06945 0.0000 stam1 1.73135 2.585266 106 0.66970 0.5045 t.blootstelling1 -2.91458 2.265734 2074 -1.28637 0.1985 t.blootstelling2 -6.57217 1.657225 2074 -3.96577 0.0001 t.blootstelling3 -0.03884 1.657225 2074 -0.02344 0.9813 t.blootstelling4 1.98449 1.657225 2074 1.19748 0.2313 t.blootstelling5 1.95116 1.657225 2074 1.17737 0.2392 t.blootstelling6 3.32615 1.634603 2074 2.03483 0.0420 t.blootstelling7 -1.16385 1.634603 2074 -0.71201 0.4765 t.blootstelling8 -6.11719 1.634603 2074 -3.74231 0.0002 t.blootstelling9 -2.25719 1.634603 2074 -1.38088 0.1675 t.blootstelling10 -4.39580 1.668057 2074 -2.63528 0.0085 t.blootstelling11 -4.65913 1.668057 2074 -2.79315 0.0053 t.blootstelling12 -4.86247 1.668057 2074 -2.91505 0.0036 t.blootstelling13 -2.60247 1.668057 2074 -1.56018 0.1189 t.blootstelling14 -4.78580 1.668057 2074 -2.86909 0.0042 t.blootstelling15 -2.98580 1.668057 2074 -1.78999 0.0736 t.blootstelling16 3.44753 1.668057 2074 2.06680 0.0389 t.blootstelling17 2.63753 1.668057 2074 1.58120 0.1140 t.blootstelling18 -2.65412 1.687045 2074 -1.57324 0.1158 t.blootstelling19 -8.24973 2.899918 2074 -2.84481 0.0045 t.blootstelling20 -2.46639 2.899918 2074 -0.85050 0.3951 t.blootstelling21 -0.83306 2.899918 2074 -0.28727 0.7739 t.blootstelling22 -1.18306 2.899918 2074 -0.40796 0.6833 t.blootstelling23 1.01694 2.899918 2074 0.35068 0.7259 t.blootstelling24 2.15027 2.899918 2074 0.74149 0.4585 t.blootstelling25 -1.26839 1.285240 2074 -0.98689 0.3238
stam1:t.blootstelling1 -0.85680 2.935142 2074 -0.29191 0.7704 stam1:t.blootstelling2 0.41267 2.935142 2074 0.14060 0.8882 stam1:t.blootstelling3 -3.45750 2.935142 2074 -1.17797 0.2389 stam1:t.blootstelling4 -3.56505 2.935142 2074 -1.21461 0.2247 stam1:t.blootstelling5 -2.22645 2.935142 2074 -0.75855 0.4482 stam1:t.blootstelling6 -2.66312 2.935142 2074 -0.90732 0.3643 stam1:t.blootstelling7 0.83215 2.935142 2074 0.28351 0.7768 stam1:t.blootstelling8 1.35390 2.935142 2074 0.46127 0.6447 stam1:t.blootstelling9 -3.64294 2.935142 2074 -1.24115 0.2147 stam1:t.blootstelling10 -2.50511 3.033019 2074 -0.82595 0.4089 stam1:t.blootstelling11 -0.10844 3.033019 2074 -0.03575 0.9715 stam1:t.blootstelling12 1.32822 3.033019 2074 0.43792 0.6615 stam1:t.blootstelling13 -5.14289 3.033019 2074 -1.69563 0.0901 stam1:t.blootstelling14 3.36267 3.033019 2074 1.10869 0.2677 stam1:t.blootstelling15 1.42378 3.033019 2074 0.46943 0.6388 stam1:t.blootstelling16 -0.27066 3.033019 2074 -0.08924 0.9289 stam1:t.blootstelling17 1.08378 3.033019 2074 0.35733 0.7209 stam1:t.blootstelling18 -1.20178 3.033019 2074 -0.39623 0.6920 stam1:t.blootstelling19 -0.52655 5.155544 2074 -0.10213 0.9187 stam1:t.blootstelling20 3.12345 5.155544 2074 0.60584 0.5447 stam1:t.blootstelling21 -7.74321 5.155544 2074 -1.50192 0.1333 stam1:t.blootstelling22 -0.82655 5.155544 2074 -0.16032 0.8726 stam1:t.blootstelling23 -5.32655 5.155544 2074 -1.03317 0.3016 stam1:t.blootstelling24 -8.69321 5.155544 2074 -1.68619 0.0919 stam1:t.blootstelling25 0.77112 2.609579 2074 0.29550 0.7676
Note: Dutch terms are used here: nacht – night, stam – strain, t.blootstelling – time after exposure. ‘stam1:t.blootstelling1’ is an interaction term between strain=1 and 1hour_after_exposure=1.
In model 2, the ‘diesel’ term is replaced with a ‘time after exposure’ term, to determine if the diesel effect might change in time. Adjustments are made for nighttime, stress, and strain. Nighttime and stress are both highly significant (p<0.001); strain is not significant (p = 0.5045). A lot of the main terms involving time after exposure are not significant (between braces). The alternating signs of the coefficients (+ and -) support the notion that there is no clear pattern between time after exposure and blood pressure for the transgenic rat group. The effect of diesel, for any given moment after exposure, is not statistically significant.
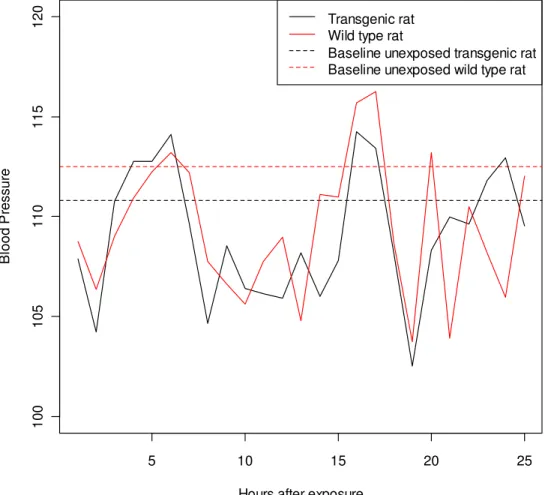
The interaction between strain and time after exposure is not statistically significant as well (between dashed braces), which means that diesel effects do not differ between strains for a given time of exposure. This is illustrated in figure 3. The expected blood pressure for each strain is plotted over time, and blood pressure levels are compared to a mean baseline blood pressure value that is estimated from values recorded before exposure (time is zero) and from data of the filtered air exposed transgenic rats as well. This expected value is calculated by filling the estimated beta and x values in the model. The figure is corrected for blood pressure changes due to stress after placing the animal in the
5 10 15 20 25 1 0 0 1 0 5 1 1 0 1 1 5 1 2 0
Hours after exposure
B lo o d P re s s u re Transgenic rat Wild type rat
Baseline unexposed transgenic rat Baseline unexposed wild type rat
The figure supports the idea that there is no difference between exposed transgenic rats and exposed wild rats, for any given hour after exposure. Note that while the estimated differences between blood pressure at various time points and the baseline blood pressure are substantial, they are not statistically significant due to the large variation found in the measurements.
Figure 3: Statistical model 2 to determine if diesel has an effect on blood pressure over time. Mean blood pressure values are plotted against time after exposure (in hours).