National Institute for Public Health and the Environment
Replacement of meat and dairy by more
sustainable protein sources in the
Netherlands
Quality of the dietRIVM Letter report 350123001/2011 M.J. Tijhuis et al.
Colophon
© RIVM 2011
Parts of this publication may be reproduced, provided acknowledgement is given to the 'National Institute for Public Health and the Environment', along with the title and year of publication.
Mariken J. Tijhuis
Janine Ezendam
Susanne Westenbrink
Caroline van Rossum
Liesbeth Temme
Contact:
Liesbeth Temme
CVG
Liesbeth.Temme@rivm.nl
This investigation has been performed by order and for the account of Dutch Food and Consumer Product Safety Authority and Dutch Ministry of Economic Affairs, Agriculture and Innovation, within the framework of 9.4.23
Rapport in het kort
Een voeding die minder vlees en zuivel bevat en meer duurzame plantaardige voedingsmiddelen kan voldoende eiwitten, mineralen en vitaminen leveren. Daarvoor is het wel nodig gevarieerd te kiezen uit plantaardige producten. De belangrijkste bronnen van plantaardige eiwitbronnen zijn noten, peulvruchten en volkoren graanproducten. Peulvruchten en noten worden nu echter nauwelijks gegeten als vervanger van dierlijke producten. Voor bepaalde vitaminen en mineralen (ijzer, calcium, vitaminen B2 en B12) kunnen ook verrijkte vlees- en zuivelvervangers een goede bron zijn. Dit geldt vooral voor B12, aangezien deze vitamine niet in plantaardige voedingsmiddelen zit.
Dit blijkt uit verkennend onderzoek van het RIVM. Hierin is onderzocht wat een verschuiving in een menu van de traditionele, dierlijke eiwitbronnen naar meer duurzamere plantaardige betekent voor de inname van eiwitten, en een selectie van vitaminen en mineralen.
Vlees en zuivel leveren in Nederland ongeveer de helft van de eiwitconsumptie. Mensen die geen vlees consumeren, eten meestal wel zuivelproducten. Voor hen zijn zuivel- en graanproducten momenteel de belangrijkste bronnen van eiwit. Daarnaast dragen vlees en zuivel in belangrijke mate bij aan de inname van de vitamines A, B1, B2, en B12 en de mineralen calcium, ijzer, fosfor, selenium en zink. Aanvullend onderzoek is nodig om de inname van voedingsstoffen bij verschillende consumptiepatronen met minder vlees en zuivel, verder te kwantificeren.
Abstract
Diets with less meat and dairy and more sustainable plant based foods can provide enough protein, minerals and vitamins, provided that a varied choice of plant foods is consumed. Main sources of plant proteins are nuts, pulses, and whole grain cereals. Current consumption of pulses and nuts as a replacer of meat is low. Fortified meat and dairy substitutes can also be a source of certain vitamins and minerals (iron, calcium, vitamins B2 en B12). This is especially true for vitamin B12, since it cannot be supplied by plant sources.
RIVM carried out an exploratory study on the nutritional consequences of a shift from conventional animal to (more) sustainable protein rich plant foods. The focus was on protein, amino acids and selected micronutrients. In the Netherlands, meat and dairy deliver half of the daily protein intake. People consuming no meat typically do consume dairy products. In addition to dairy, grains are the main source of protein for them. Meat and dairy are major sources of vitamins A, B1, B2, en B12 and minerals calcium, iron, phosphorus, selenium en zinc. Further studies are needed to quantify the effects of different dietary patterns in which meat and dairy intake is reduced.
Summary
Replacement of meat and dairy by more sustainable
protein sources in the Netherlands – Quality of the
diet
A reduction in the consumption of animal protein rich foods is an efficient and possibly unavoidable way to reduce the negative impact of human behaviour on the environment. In this letter report, the nutritional consequences of a shift from conventional animal to (more) sustainable protein rich plant and insect foods are explored. Focus is on protein, amino acids, selected micronutrients and allergens.
Animal foods contain high quality protein. Protein rich plant-based foods are legumes, grains, nuts and ready-made meat and dairy replacers. The current ready-made meat and dairy replacers are based on wheat, soy, rice, pea, lupin, or a combination thereof. They also contain differing degrees of animal products such as egg protein and milk protein. Soy and lupin, more than the other plant based protein sources, have an amino acid composition of quite high quality.
As can be seen from the Dutch National Food Consumption Survey (DNFCS), protein consumption in the Netherlands is mainly provided by meat, dairy and grain products. Almost the whole population meets the recommendations for protein intake and nutritionally there is room to replace animal protein by plant protein. Those persons in the DNFCS that do not consume meat, consume a large part of their protein from grains and dairy products. Currently, legumes and nuts are not consumed frequently in the Netherlands. It will be beneficial to increase their consumption, in light of a varied intake of plant protein sources. This will secure sufficient protein quality, especially when intake of both meat and dairy products is reduced.
Micronutrients that are currently provided mainly by meat or dairy, and that could possibly be of potential concern when intake of meat and/or dairy is lowered, are heme iron, selenium, vitamin B1, vitamin B12, and zinc (meat), and calcium, vitamin B2, vitamin B12, phosphorus, vitamin A and zinc (dairy). For vitamin A, vitamin B1, iron and zinc, intake may already be too low in certain population subgroups. Legumes, nuts and whole grains can contribute importantly to micronutrient intake, and this becomes more important when intake of dairy products is also reduced. Fortified ready-made meat and dairy replacers can, in an easy way, ensure sufficient intake of iron, calcium, vitamin
B2 and especially vitamin B12; the latter of which cannot be provided by plant sources.
In terms of allergy, no significant adverse effects are expected to occur when animal protein sources are replaced by plant protein sources. One issue to monitor is cross-reactivity.
It is recommended to update the Dutch Food Composition Table in terms of both sustainable food types and nutrients; and to systematically review the consequences of a protein shift in terms of health and disease.
Key words:
Samenvatting
Vervanging van vlees en zuivel door duurzamere
eiwitbronnen in Nederland – Kwaliteit van de voeding
Een vermindering in de consumptie van voedingsmiddelen van dierlijke oorsprong is een efficiënte en mogelijk onvermijdelijke manier om de schadelijke gevolgen van menselijk gedrag op het mileu te verkleinen. Dit briefrapport bevat een verkenning van de voedingskundige gevolgen van een verschuiving in eiwitbronnen, van conventioneel dierlijke voedingsmiddelen naar meer plantaardige voedingsmiddelen en insecten. We gaan hierbij vooral in op eiwit, aminozuren, een selectie van micronutriënten en allergenen.Dierlijke voedingsmiddelen bevatten eiwit van hoge kwaliteit. Eiwitrijke voedingsmiddelen op plantaardige basis zijn peulvruchten, granen, noten en kant-en-klare vlees- en zuivelvervangers. De huidige vlees- en zuivelvervangers zijn gemaakt op basis van tarwe, soja, rijst, erwt, lupine, of een combinatie hiervan. Ze bevatten ook, in verschillende mate, dierlijke producten zoals ei-eiwit en melkei-eiwit. Soja en lupine hebben, meer dan de andere plantaardige bronnen die nu gebruikt worden, een aminozuursamenstelling van hoge kwaliteit.
De voedselconsumptiepeiling (VCP) laat zien dat eiwit in Nederland vooral gegeten wordt in de vorm van vlees, zuivel en granen. Vrijwel de gehele bevolking voldoet aan de eiwitaanbevelingen en voedingskundig is er ruimte om dierlijk eiwit te vervangen door plantaardig eiwit. Diegenen in de VCP die geen vlees eten, krijgen hun eiwit in belangrijke mate binnen via zuivel en granen. De huidige consumptie van peulvruchten en noten is laag. Een toename in hun consumptie zal gunstig zijn in het kader van een gevarieerde consumptie van plantaardige bronnen; dit zal een voldoende hoge eiwitkwaliteit garanderen, vooral als zowel de consumptie van vlees als van zuivel verminderd wordt.
Micronutriënten die op dit moment voornamelijk via vlees en zuivel geleverd worden, en mogelijk in het gedrang zouden kunnen komen als de consumptie van vlees en zuivel wordt verminderd, zijn: heem-ijzer, selenium, vitamine B1, vitamine B12 en zink (vlees), en calcium, vitamine B2, vitamine B12, fosfor, vitamine A en zink (zuivel). Voor vitamine A, vitamine B1, ijzer en zink, is de inneming mogelijk al wat laag in bepaalde groepen in de bevolking. Peulvruchten, noten en volkoren granen kunnen in belangrijke mate bijdragen
een de inneming van micronutriënten. Dit wordt belangrijker naarmate ook de consumptie van zuivel wordt beperkt. Verrijkte kant-en-klare vlees- en zuivelvervangers kunnen, gemakshalve, zorgen voor een voldoende inneming van ijzer, calcium, vitamine B2 en vooral vitamine B12; plantaardige bronnen kunnen niet voorzien in deze laatste.
Wat betreft allergie, worden geen belangrijke nadelige effecten verwacht wanneer dierlijke voedingsmiddelen vervangen worden door plantaardige. Er moet wel op kruisreactiviteit gelet worden.
Geadviseerd wordt om het Nederlandse Voedingsstoffenbestand te updaten met meer soorten duurzame voedingsmiddelen alsook met voedingsstoffen die zij bevatten; en om systematisch de gevolgen van een eiwitverschuiving in kaart te brengen in termen van ziekte en gezondheid.
Trefwoorden:
Contents
Rapport in het kort...3
Summary ...5
Samenvatting...7
1
Introduction ...11
2
Composition of sustainable protein-rich foods and commodities...15
2.1
Available options for sustainable protein-rich foods and commodities in the
Netherlands...15
2.1.1
Ready-made meat replacers and hybrid meats...15
2.1.2
Dairy replacers...16
2.1.3
Basic plant commodities...17
2.1.4
Insects ...17
2.2
Nutritional composition of sustainable protein-rich foods and commodities ...18
2.2.1
Protein content and amino acid composition ...18
2.2.2
Micronutrient content ...20
2.2.3
Other nutritional characteristics...22
2.3
Summary ...22
3
Intake of protein-rich foods and related nutrients ...23
3.1
Current intake of protein-rich foods, protein and selected nutrients...23
3.2
Current dietary intake on meat-free and fish-free days ...26
3.3
Expected change in dietary intake when the share of sustainable protein sources
increases...32
3.3.1
Protein and amino acids...32
3.3.2
Micronutrients ...33
3.3.3
Other nutrients or nutritional characteristics...34
3.4
Summary ...34
4
Food allergy...35
4.1
Food allergy, important food allergens and celiac disease ...35
4.2
Expected consequences for the prevalence of food allergy when the share of
sustainable protein sources increases ...36
4.2.1
Risk of food allergies due to increased exposure to known allergens...37
4.2.2
Introduction of “novel” food proteins in the Dutch diet: insects ...38
4.2.3
Risks of food allergic reactions due to cross reactivity in subjects with food
allergy: Quorn and lupin. ...38
4.3
Summary ...39
5
Discussion...40
5.1
Foods replacing meat and dairy ...40
5.3
Consumer preferences and communication ...43
5.4
Closing remarks...44
References ...47
Appendix 1: Background in protein quality and quantity...51
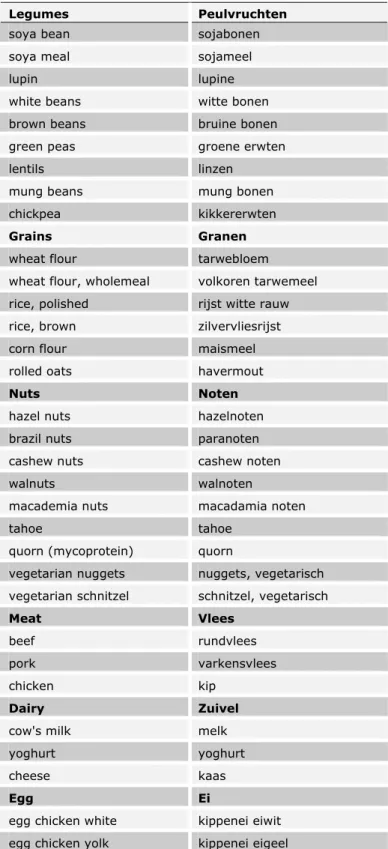
Appendix 2: List of foods, in English and Dutch ...56
Appendix 3: Food Composition Codes...57
Appendix 4: Macronutrients in selected sources ...58
Appendix 5: Prevalence of food allergies...59
Appendix 6: Novel foods regulation ...61
Terms and definitions in this report
Ready-made meat replacer Product that is developed to replace meat (with or without added nutrients)
Ready-made dairy replacer Product that is developed to replace milk, cheese or yoghurt (with or without added nutrients)
1
Introduction
Protein is an essential nutrient for the human body. It provides building blocks, and has a large number of regulatory functions, and can also serve as a fuel source (Millward et al., 2008, WHO, 2007). Protein consists of chains of amino acids.
Currently, about half of the protein consumed by the Dutch is derived from animal sources, i.e. meat and dairy products. However, the production of meat and dairy is rather inefficient and negatively affects the ecosystem when used on a large scale (Blonk et al., 2008, FAO, 2006). The World population is increasing, with an expected number of 9 billion people in 2050. Following current production and consumption patterns, the ecosystem is and will increasingly be overly pressured and future food security is endangered.
An effective option to reduce the environmental burden is to eat less meat and dairy and to shift towards more sustainable protein food sources (see Box 1), such as grains, legumes, nuts and insects. However, such a change may also affect nutritional intakes and human health. Animal protein is of high quality, i.e. its amino acid composition suits the human body well. It also provides valuable micronutrients. Both plant and animal protein can elicit allergic reactions, among certain individuals. In this report, we consider these nutritional issues.
Several different ways exist to fill the place of meat and dairy in the diet, which face different challenges, e.g. from technological or consumer (Schosler et al., 2011) perspectives:
1) Replacement of meat or dairy products by more sustainable imitations of the product and its role in the current diet: ready-made meat or dairy replacers or hybrid meat. Ready-made meat or dairy replacers are mostly based on plant constituents (see section 2.1.1). In hybrid meat products, a percentage of the fat or meat content is replaced by protein-rich plant components.
2) Increased daily consumption of sustainable protein-rich basic commodities that need to be considered in the diet as a whole, both in terms of nutrition and of eating habits: grains, legumes, nuts.
3) Meat replacement via “new” or “novel” protein-rich sources, such as algae and insects.
There are developments in improving the animal product chain (Coenraadts & Cornelissen, 2011) or culturing meat cells (Tuomisto & de Mattos, 2011), but this is beyond our scope. In this report we focus on plant foods and insects.
An exploration of the relation between health and sustainability in human diets is in full progress (see Box 2). Many foods are both healthy and environmentally sustainable. Those that are not, need to be addressed.
Within the above context and developments, in this report we explore the effects of replacing meat and dairy by more sustainable protein sources on dietary quality in the Netherlands. More specifically, we consider the adequacy of protein quantity and quality, the adequacy of micronutrient intake and the occurrence of food allergy of plant foods and insects. Our aim is to support policy makers in their knowledge of the nutritional effects of consuming more sustainable protein sources. In addition, this report contributes to a weighing of benefit and harm, both nutritionally and ecologically, of the shift from conventional animal to more sustainable protein sources.
In Chapter 2, we start with an inventory of protein-rich foods and their nutritional characteristics. Then, in Chapter 3, we describe current dietary intake, focusing on protein-rich food sources and their most characteristic micronutrients. Also, we describe the expected nutritional consequences of a shift to more sustainable protein-rich food sources. In Chapter 4, we describe allergy-related issues. In Chapter 5 we elaborate further on some selected issues.
Box 1: sustainability
This letter report builds on the evidence-based premise that replacing animal protein sources by plant- and/or insect-based protein sources within our current dietary pattern benefits sustainability. It contains no quantitative consideration of sustainability parameters.
The most common parameters to measure sustainability are ecological parameters, i.e.: biodiversity, land use, greenhouse gas emissions, use of non-renewable resources, disturbances in the nitrogen and phosphate cycles, water use and soil quality (explained in Box 2.1). However, it may also include parameters related to animal welfare and social welfare. Two definitions of sustainability are specifically mentioned here:
1) “sustainability means production and consumption with respect for people, animals and environment” (LNV, 2009).
In the renowned so-called ‘Bruntland report’ this specifically also includes future generations:
2) “In essence, sustainable development is a process of change in which the exploitation of resources, the direction of investments, the orientation of technological development, and institutional change are all in harmony and enhance both current and future potential to meet human needs and aspirations” (WCED, 1987).
Box 2: health and sustainability combined
Recently, the Health Council of the Netherlands considered the Dutch dietary guidelines (Health Council of the Netherlands, 2006) from an ecological perspective (Health Council of the Netherlands, 2011). It distinguished:
-win-win guidelines, which deliver both health benefits and ecological benefits in terms of land use and green house gas emissions:
-less animal-based, more plant based diet -lower energy intake
-guideline conferring health benefit, but detrimental ecological impact: -fish twice a week, including oily fish once
-ecological benefit, neutral health effects: -reduce food waste
The Health Council advises to take these ecological perspectives into account when establishing the new guidelines for good nutrition, and mentions specifically less animal-based and more plant-based dietary patterns, as well as a reconsideration of the recommendation for fish, especially since there are indications that fatty fish once a week will suffice for prevention of cardiovascular disease. Ideally, all perspectives (health and ecological and potentially other) should be weighed against each other.
New food-based dietary guidelines based on incorporation of ecological perspectives are under development in other countries, for example:
*In the UK, the Rowett Institute of Nutrition and Health, as commissioned by WWF-UK, defined a sustainable diet that is nutritionally viable (MacDiarmid et al., 2011). They adapted the current governmental eating advice – the Eatwell plate – to include the environmental aspects and meet the 2020 Green House Gas Emissions target of 25% reduction. The result was called the Livewell plate. To achieve the 2050 target of 70% reduction would be much more difficult based on current diet and would require a radical shift in food consumption. A 2050 diet could include food such as meat and dairy, but in very much smaller amounts than the current diet (MacDiarmid et al., 2011).
The general Livewell 2020 principles are:
1) Eat more plants; 2) Waste less food; 3) Eat less meat; 4) Eat less processed food; and 5) Where available, buy food that meets a credible certified standard. In addition, a 7 day sample menu, including a shopping list that corresponds to this menu, has been created, see wwf.org.uk/livewell2020.
*Also, (traditional) regional diets are being promoted as being both healthful and sustainable. Some examples are mentioned here. In Norway, a diet based on locally available products has been proposed, containing: 1) native berries; 2) cabbage; 3) native fish and other seafood; 4) wild (and pasture-fed) land-based animals; 5) rapeseed oil; 6) oat/barley/rye (Bere & Brug, 2009, EFSA, 2012). Similarly, the Mediterranean diet is based on a variety of diversified local traditional foods strictly linked to the Mediterranean environment (Burlingame & Dernini, 2011), i.e. Greece, Italy, Spain and Morocco
2
Composition of sustainable protein-rich foods and
commodities
In this section, we describe the nutritional composition of available options of foods that can be consumed as alternatives for meat and dairy. Focus is on amino acids and micronutrients that are characteristic for animal-based protein sources.
For background information on protein quantity and quality, see Appendix 1. Dutch translations and food composition codes for the foods mentioned in this chapter are presented in Appendix 2 and 3, respectively.
2.1 Available options for sustainable protein-rich foods and commodities in
the Netherlands
Protein-rich options are ready-made meat and dairy replacers based on soy, wheat and pea protein; tahoe and tempé; seitan; quorn; tahin, hummus and falafel, nuts and seeds; and legumes. These are all good protein sources (see section 2.2.1), but often lack in one or more of the other nutrients, compared to meat (see section 2.2.2). However, nutrients that meat and dairy provide can be provided by different kinds of foods. And thus, it needs to be kept in mind that it is the whole diet that determines (in)adequate intake.
2.1.1 Ready-made meat replacers and hybrid meats
Several companies produce ready-made (vegetarian) ready-made meat replacers in the Netherlands (some commonly available brands are Tivall, Vivera, GoodBite, Quorn, and Valess). Most products contain a combination of wheat, soy, and egg proteins, some also contain cow’s milk proteins. Quorn is a fungal protein (mycoprotein) extracted from the Fusarium venenatum.
Innovations in the field of meat-replacement products are
-increased use of lupin and different types of legumes as more locally produced protein sources and
-increased attention for a more meat-like ‘bite’ of the product (www.devegetarischeslager.nl; http://www.likemeat.eu/) and
-development of hybrid products. Products based on beef and containing ~30% plant components have been available in Dutch supermarkets since 2010.
The above developments are being combined. Beeter® (www.eetbeeter.nl) is a 100% plant-derived basic product for replacement of meat and fish that focuses on an attractive ‘bite’. It is currently sold on a soy-basis, but a lupin version is being developed for better sustainability. Meatless (www.meatless.nl) is a 100% plant-based product that comes in three varieties: wheat-based, which scores best on sustainability and is mostly used in hybrid products; rice-based, which an allergen-free alternative, also mostly used in hybrid products; and lupin-based, which has the best nutritional value and is (therefore) mostly used in vegetarian products. A new development is hybrid meat with pea protein.
In general, the less animal-based the product is, the lower its impact on sustainability parameters (Marinussen et al., 2010, Blonk et al., 2008), see Box 3. For example, Valess is made of dairy and is therefore not considered as a sustainable replacer of meat (Blonk et al., 2008). In quorn and other ready-made meat replacers, egg-white protein extracts are used, which unfavourably influences their environmental impact. With respect to the plant components, soy scores relatively unfavourably in Europe compared to for example wheat or lupin (Blonk et al., 2008, Broekema & Blonk, 2009), which can be grown in Northwestern Europe. It has to be noted, that differences exist in the production of soy; producers of meat and dairy replacers often adhere to sustainability standards, which influence the sustainability score (Blonk et al., 2008).
2.1.2 Dairy replacers
Soy-based drinks and soy-based yoghurt are the most available dairy replacers. However, there is a movement away from total reliance on soy towards the broader promotion of plant-based diets. For example, major European producer of soy-based drinks Alpro has recently changed its soy-based logo to a sun and green leaf accompanied by the words ‘Enjoy Plant Power’ . Two new (fortified) drink products are introduced based on almond and hazelnut. Compared to cow’s milk, soy drink scores relatively favourably with respect to green house gasses, but land use in South America and fossil energy use is relatively unfavourable (Marinussen et al., 2010, Blonk et al., 2008).
Cheese scores relatively unfavourably on all sustainability parameters, but replacement options are few in the Netherlands.
Box 3: major sustainability parameters explained
2.1.3 Basic plant commodities
Basic protein-rich plant commodities are legumes, nuts and grains. The sustainability potential of nuts and legumes varies. For example, cashew nuts score unfavorably on land use in South East Asia and South America and in production and use of fertilizers; And brown beans in glass score unfavorably in processing, i.e. drying or cooking, and packaging (Blonk et al., 2008).
2.1.4 Insects
People in many parts of the world eat insects and more than 1300 different edible types have been found (Verkerk et al., 2007). Here, we focus on those insects currently produced and marketed for human consumption in the Netherlands. These are: mealworms, buffalo worms and locusts. These insects have been freeze-dried and are marketed via wholesale (www.ruig.nl). Insects are a sustainable source of protein as their yield is higher and they producte less greenhouse gasses and ammonia than conventional livestock (Oonincx et al., 2010). Another line of development is the extraction of insect protein that can be used in ‘regular’ products.
The major sustainability parameters are:
-Emission of greenhouse gasses. This includes carbondioxide (CO2), nitric
oxide (N2O), methane (CH4). These are integrated into one measure: CO2
-equivalents per 100 years, based on internationally agrees values (IPCC GWP-100).
-Use of fossil fuels. This entails use for transport, storage, processing, etc. It can be expressed as the caloric value of the primary fossil fuels (KJp). - Land use. This describes the how much land is being used for the production of a product and is expressed in m2 per year. Key in this measure
is the quality of the land that remains, in terms of biodiversity and contribution to the Life Support System. The degree to which natural land is converted to agricultural land for a product can be expressed as the ‘land use and land use change’ (LULUC). Loss of biodiversity can also be quantified. Different types of land can be differentiated, for example ‘land use in South East Asia and South America’. Furthermore, water use can be incorporated in the form of irrigated land use.
- Other effects are: water use in the entire production chain; and production and translocation of minerals, resulting in local excess or deficiency.
When presenting sustainability calculations, it is important to demarcate which method is followed and what is and is not included. An often used method is Life Cycle Analysis (LCA). This method quantifies selected parameters over the entire production chain.
2.2 Nutritional composition of sustainable protein-rich foods and commodities
2.2.1 Protein content and amino acid composition
The protein content of a selection of meat and dairy and its replacers is shown in Table 1. Total protein content of (ready-made) meat replacers varies from ~ 7-22 g per 100 g (the range in around 150 different products by different producers as reported via the internet). The total protein content of basic commodities such as legumes is around 8 g/100 g cooked weight. Soy (21 g/100 g cooked weight) and lupin (16 g/100 g cooked weight) have a higher protein content. The most consumed types of meat in the Netherlands are beef, pork and chicken. These three types contain similar amounts of high quality protein of around 20 g per 100 g. Chicken egg, both the white and the yolk, contains high quality protein, approximately 12 g/100 g for the whole egg.
Dairy products differ in protein content, cheese being more concentrated (20-25 g protein/100 g) than cow’s milk and yoghurt (~4 g protein/100 g), the quality of all being high. Soy drink contains ~3-4 g protein/100 g.
Nutritional data for many insects are available, but are scarce for the specific genus that are marketed in the Netherlands. The protein content of insects varies highly between and within type (Bukkens, 1997, Verkerk et al., 2007). In general, protein content is comparable to conventional meats (Bukkens, 1997). For mealworms, it is almost 20 g/100 g edible insect. Amino acid composition and thus protein quality also varies, but is generally good (Bukkens, 1997, FAO, 2010, Finke, 2002, Ramos-Elorduy et al., 1997). For some (e.g. silkworm pupae, not in Table 1) protein quality is very high, see also Appendix 1 (FAO, 2010).
Table 1: protein content and amino acid composition of plant-based protein sources, insects, meat, dairy and egg
Protein content Amino acid composition1 in mg/g protein
g/100g edible
food (c/d/r)2 specific NCF3 Lysine + Cysteine Methionine Threonine Tryptophan
Scoring Children (3-10 yrs) 48.0 24.0 25.0 6.6 Pattern4 Adults 45.0 22.0 23.0 6.0 Plant sources
Legumes Brown beans 8.0 (c); 20 (d) 6.25 72.0 15.7 41.6 12.5 White beans 8.0 (c); 20 (d) 6.25 68.8 25.9 41.6 11.8 Green peas 8.4 (c); 21 (d) 6.25 60.8 18.6 41.6 11.0 Lentils 8.8 (c); 21 (d) 6.25 72.0 17.6 40.0 9.6 Mung beans 7.0 (c); 23.9 (d) 6.25 70.4 20.8 32.0 10.9 Chickpeas 7.6 (c); 19.3 (d) 6.25 68.8 27.2 38.4 8.0 Lupin 15.6 (c); 36.2 (d) 6.25 53.4 19.4 36.8 8.0 Soya beans 21.5 (c); 35.9 (d) 5.71 69.9 28.4 42.2 14.0 Soya flour 38 5.71 70.1 31.5 42.0 14.0 Grains Wheat flour, white 12.6 5.83 24.0 32.8 27.4 11.1 Wheat flour, brown 10 5.83 34.3 32.4 32.6 13.7 Rice, polished 3.2 (c); 7 (r) 5.95 36.9 35.2 33.6 14.1 Rice, brown 3.1 (c); 8.3 (r) 5.95 37.0 35.3 33.6 14.1 Corn flour 9 6.25 27.6 34.9 36.4 6.4 Rolled oats 13 5.83 44.0 46.2 35.8 13.4 Nuts Hazel nuts 14 5.3 28.1 33.2 33.2 12.8 Brazil nuts 15 5.46 34.8 98.9 27.5 10.8 Cashew nuts 21.2 5.3 52.8 36.4 37.7 15.5 Walnuts 15.9 5.3 34.0 33.6 37.7 11.5 Macademia nuts 7.8 5.3 2.3 3.6 46.8 8.5
Plant sources, meat replacers
Tahoe 11.6 5.71 65.8 26.6 40.8 15.6 Quorn (mycoprotein) 14.5 6.25 57.3 14.45 37.9 11.0
Vegetarian nuggets6 15 6.25 56.4 36.8 38.9 13.6
Vegetarian schnitzel 16 6.25 60.9 39.2 40.3 13.5
Plant sources, milk replacers
Soy-based drink (fresh) 3.0 5.71 69.9 28.4 42.2 14.0
Animal sources
Meat Beef (<5% fat) 21.8 (r) 6.25 83.2 31.2 41.6 11.4 Pork (5-14% fat) 21.1 (r) 6.25 89.6 32.3 41.6 10.7 Chicken 20.5 (r) 6.25 89.6 32.0 40.0 10.4 Dairy Cow's milk (full fat) 3.3 6.38 89.3 32.8 42.3 13.5 Yoghurt (reduced fat) 4.5 6.38 89.3 31.7 42.3 13.6 Cheese 48+ 22.8 6.38 106.4 39.0 37.3 14.1 Egg Egg chicken whole 12.3 (r); 46 (d) 6.25 72.0 54.4 48.0 12.2 Egg chicken white raw 10.5 6.32 77.5 68.0 47.5 15.2 Egg chicken yolk raw 16.7 6.12 81.7 41.2 50.7 13.1 Egg chicken white7 81.1 (d) 6.32 68.0 60.1 44.3 12.2 Insects
Mealworms Tenebrio molitor larvae8 18.7 (r) 55 21 41 8
67.9 (d) 57 35 34 16 Buffalo worms Alphitobius laevigatu NA NA NA NA NA Locusts Locusta migratoria9 55.5-64.9 (d) NA NA NA NA
1Based on amino acid databases from Denmark (Saxholt et al., 2008), USA (USDA, 2011), UK (McCance & Widdowson,
2006), Germany (Souci et al., 2008) and FAO (FAO, 1970); 2food composition codes are presented in appendix 3;where
applicable: c=cooked, d=dried, r=raw (amino acid composition remains the same); 3standard nitrogen conversion factor
(NCF, 6.25) to translate nitrogen content into protein content is used in NEVO for all products, except for dairy products (6.38); NCF lower than 6.25 means that in reality protein content is proportionally lower than indicated in first column. Specific NCF is used for calculation of amino acid pattern; source for specific NCFs is the Danisch Food Composition Table (Saxholt et al., 2008) 4according to latest EFSA report (EFSA, 2012); plant protein sources and insects with an
exoskeleton (such as locusts) have lower protein digestibility;5methionine only, data on cysteine lacking; source: www.mycoprotein.org;6basic recipe for meat replacers in NEVO; amount of protein available, but information lacks on
(exact proportion of) protein sources, see also chapter 5;7used in vegetarian products, but not available in NEVO; 8marketed as triobolo worms; source for raw values Finke 2002, source for dry values: Despins 1995; 9source for dry
Plant protein sources in general have lower digestibility than animal-based sources, approximately 80% compared to 95% for animal sourced food and some plant protein isolates (Millward & Garnett, 2010). Also, their amino acid composition differs compared to animal-based sources. When comparing against the amino acid score (see Table 1, and Appendix 1 for explanation) the lower digestibility needs to be taken into account. As is visible from Table 1, grains tend to be relatively low in lysine, and legumes relatively low in the sulfur amino acids methionine and cysteine. Nuts and seeds tend to be low in lysine, but are high in methionine and cysteine. The values in Table 1 are consistent with those reported by Young and Pellett (Young & Pellett, 1994), albeit that for nuts and seeds they report a higher tryptophan content. However, within these groups, there are also differences in the content of the individual amino acids (Woolf et al., 2011). Lupin is relatively complete with respect to amino acid content. Soy protein, especially with increased digestibility as with concentrates, is a high quality protein.
2.2.2 Micronutrient content
The micronutrient content of a selection of meat and dairy products and its replacers is shown in Table 2. The choice of micronutrients is based on the most recent Dutch food composition tables (NEVO, 2011) and the products are meant as an illustration.
Ready-made meat replacers available via supermarkets are often fortified with vitamin B12 en iron to be a full meat substitute (see also Chapter 5). Tahoe and some replacers are not fortified with vitamins and minerals.
The most consumed types of meat in the Netherlands (beef, pork and chicken) vary in some of the micronutrients. Beef contains relatively high amounts of iron and vitamin B12, and pork is relatively high in vitamin B1. Compared to meat in general, ready-made meat replacers in general may contain lower concentrations of selenium and zinc and similar concentrations of vitamin B1 and B2 (based on current estimates, see Chapter 5). In quorn, the concentration of selenium and zinc is higher than the content in meat, but it contains very little iron. The micronutrient composition of new products such as Beeter® and Meatless® is not known from the most recent Dutch food composition table (NEVO, 2011) and producers’ information.
Many of the dairy replacers are fortified with calcium, vitamin B2 and vitamin B12. The content of zinc and vitamin A of soy drink is lower than of cow’s milk.
p ro d uc t (c /d /r ) 2 calciu m (mg ) ph o sphor u s (mg) iro n (mg) se le ni u m (µg ) zinc (mg) RA E 3 (µg) vi t B 1 (mg) vi t B 2 (m g ) vi t B 12 (µg) Pl a n t s o u rc e s Le gu m es Bro w n /wh it e b ean s ( c/ d ) 38/ 80 17 0 /4 0 0 2 .0/ 5. 0 2. 0 /9. 0 1. 0 /2 .0 0 /0 0. 1 1 /0 .6 0 0. 0 5 /0 .1 0 0 /0 Gr ee n p eas ( c/ d ) 36/ 80 16 0 /4 0 0 2 .0/ 5. 0 1. 0 /3. 0 1. 4 /3 .5 0 /0 0. 4 4 /1 .1 0 0. 0 4 /0 .1 0 0 /0 Le ntils (c /d) 2 3 /8 0 1 6 0 /40 0 2 .9 /5 .0 4 2 /1 05 .0 1 .4 /3 .9 0 /0 0 .19 /0 .41 0 .05 /0 .1 0 0 /0 M u n g bean s ( c/ d ) 27/ 88 99 /3 9 5 1 .4/ 6. 7 N A /8 .8 0 .8 4 /2 .7 1 /5. 7 0. 1 6 4 /0. 6 2 0 .0 61/ 0. 2 3 0 /0 C h ic kp eas (c /d ) 4 6 /1 0 5 83 /3 6 6 1 .8/ 6. 24 1. 0/ NA 1 .7/ 3. 43 2 .0/ 3 0. 0 5 /0 .4 7 7 0 .0 3 /0 .2 1 2 0 /0 Lu p in ( c/ d ) 5 1 /1 7 6 12 8 /4 4 0 1 .2/ 4. 36 N A /8 .2 1 .3 8 /4 .8 0 /1. 0 0. 1 3 4 /0. 6 4 0 .0 53/ 0. 2 2 0 /0 So ya b ean s ( c/ d ) 1 3 8 /2 25 33 3 /5 5 5 5 .0/ 8. 4 8. 0 /4. 0 1. 8 /3 .0 19 /3 2 0. 6 6 /1 .1 0 0. 1 9 /0 .3 1 0 /0 So ya fl ou r 22 0 5 9 0 6. 9 1 1 .0 5. 0 0 0 .6 4 0. 3 5 0 Grai n s Wh eat fl o u r, w h it e 23 10 3 0. 8 5. 0 0. 6 4 0 0. 0 7 0. 0 4 0 W h ea t fl ou r, b ro w n 30 37 0 4. 0 4. 0 2. 9 0 0. 4 0 0. 1 5 0 R ic e, p o lis hed (c/r ) 12/ 10 42 /1 0 0 0 .2/ 0. 4 1. 0 /1 3 0. 7 5 /1 .8 0/ 0 0. 0 2 /0 .0 4 0. 0 1 /0 .0 3 0/ 0 R ic e, b ro w n (c/r ) 16/ 12 10 5 /3 0 0 0 .3/ 1. 3 9. 0 /1 0 0. 8 1 /0 .8 0/ 0 0. 0 9 /0 .3 4 0. 0 1 /0 .0 3 0/ 0 Co rn f lou r 20 18 0 3. 3 NA 2. 5 0 0. 2 6 0. 0 8 0 R o lle d o ats 70 40 0 4. 0 7. 0 3. 0 0 0. 6 0 0. 0 5 0 Nu ts H az el n u ts 20 0 3 0 0 3. 0 2. 0 2. 1 0 0 .4 0 0. 0 7 0 Braz il n u ts 17 5 6 0 0 4. 0 2 5 4 4. 2 0 1 .0 0 0. 0 4 0 Cas h ew n u ts 44 6 0 7 6. 7 37 5. 8 1. 0 0 .2 3 0. 1 3 0 W al n u ts 11 7 5 2 0 3. 4 12 3. 4 2. 0 0 .2 9 0. 1 1 0 M academ ia n u ts 70 1 9 8 2. 6 12 1. 3 0 0 .7 1 0. 0 9 0 P lan t so urc e s, m e a t re p lac e rs T ah o e 18 8 1 3 0 2. 2 NA 1. 1 19 0 .0 7 0. 0 2 0 Q u orn ( m yc op ro te in ) 30 2 0 4 0. 3 30 5. 6 0 0 .1 0 0. 3 0 0. 1 Ve get ari an n u gg et s 5 6 7 15 7 2. 1 * 3 0 .1 0 0. 1 1 0 .1 4 0. 1 5 * V eg et ar ia n s ch n it ze l 0 14 0 2. 1 * 3 0 .1 0 0. 1 0 0 .1 5 0. 2 6 * P lan t so urc e s, m ilk re p lac e rs S oy-base d dri n k (f res h ) 12 0 * 82 0. 4 NA 0 .2 5 1 0 .0 2 0. 2 1 * 0 .3 8* Anim al s o urc e s M eat Be ef (< 5 % , r) 5 2 1 9 2. 2 10 4. 4 6. 0 0 .0 5 0. 1 6 1. 9 Po rk ( 5 -1 4 % , r) 7 2 1 8 0. 7 12 2. 4 5. 0 0 .6 6 0. 1 5 0. 5 C h ic ken ( r) 10 1 5 6 0. 8 18 1. 8 0 0 .0 7 0. 1 1 0. 2 Da ir y C o w 's milk (full fa t) 12 3 10 2 0. 0 1. 0 0. 4 6 35 0. 0 3 0. 1 8 0. 4 C o w ’s m ilk (se m i-s kimm ed ) 12 2 10 2 0. 0 1. 0 0. 4 1 16 0. 0 3 0. 1 8 0. 4 4 Yo g hur t 14 3 11 5 0. 1 1. 0 0. 4 5 16 0. 0 3 0. 1 7 0. 5 Ch ee se 4 8 + 81 5 53 8 0. 2 12 3. 4 7 33 2 0. 0 1 0. 2 9 1. 9 7 E g g E gg ch ic ken w h ol e, r aw 57 2 2 9 2. 2 17 1. 6 1 9 4 0 .0 5 0. 3 8 1. 5 E gg ch ic ken wh o le , d ri ed 22 5 9 0 0 1 1 .0 42 5. 0 7 6 8 0 .4 0 1. 0 0 10 E gg ch ic ken w h it e raw 12 12 0. 1 6 0 .0 9 0 0 .0 3 0. 3 5 0. 7 E g g ch ic ke n y o lk raw 15 0 6 1 9 5. 9 20 4. 3 5 3 7 0 .2 0 0. 5 0 3. 8 E gg ch ic ken w h it e dr ie d 6 62 1 1 1 0. 2 NA 0 .1 0 0 0 .0 1 2. 5 3 0. 2 In se ct s Me alwo rm s T ene b ri o m o lito r lar va e 7 (r /d ) 1 6 .9 /3 0 28 5 /9 0 0 2. 0 6 /2 1 .8 25/ n d 5 .2/ 2 6 .8 <1 00 I U / N A 0. 2 4 / NA 0. 8 1 / NA 0. 4 7 / NA B u ff alo w or m s A lphito bius la ev ig at u NA NA NA NA NA NA NA NA NA Lo cu st s L o cu st a m ig ra to ri a 8 ( d ) 52-77 55 5 -6 5 2 15 .1 -2 1 .7 NA NA 11 -1 6 NA NA NA Table 2 : se le cted mi cronu trient co mpo siti o n of plan t-based prot e in so urc e s, in sects, meat, dairy and eg g 1sel ection bas ed on contributi on of meat and d airy to intake of these nut rient s of Dutch popul ation (see c h apt er 3); 2food co mpositi on cod es are pres ente d in appendix 3; wher e applicabl e: c=co ok ed, d = dri ed , r= raw; 3retin ol activity equivalents;
4data for cooked rice is recent
, for dried rice it i
s dated; 5basic re ci pe fo r m eat r epl acers i n NEVO; p rotein cont ent av ailable, but info l acks on ( exact p roportion of) pro tein so urc es, se e also cha p ter 5; 6used in v egetar ian products , bu
t not available in NEVO;
7markete d as triobol o w orms; source f or raw value s: F inke 2002, source
for dry values:
De spins 1995; 8source : O onincx , 2011; *fortifie d; N A : not availabl e
Table 2 shows that the micronutrient values of the basic plant protein sources is quite variable. Protein-rich plant sources of calcium are soy and some types of nuts. Legumes and nuts in general are sources of phosporus and of iron. Different types of legumes, grains and nuts are sources of selenium, vitamin A-precursors (carotenoids), vitamin B1 and vitamin B2. All plant commodities naturally do not contain B12. Table 2 also shows that brown rice and whole wheat provide higher levels of micronutrients than their refined counterparts.
In egg, the yolk contains the large majority of the micronutrients. This is relevant as often only part of the egg is used as an ingredient.
In general, edible insects can be good sources of calcium, phosphorus, iron, selenium, zinc, vitamin A, B1, and B2 (Yhoung-aree, 2010, Banjo et al., 2006, Bukkens, 1997, Finke, 2002, Ramos-Elorduy et al., 1997). This can also be seen from the (scarce) data that are available for the insects available in the Netherlands, summarized in Table 2.
2.2.3 Other nutritional characteristics
Energy content of ready-made meat replacers varies from ~150-300 kcal per 100 g, which is higher than for meat. Plant foods in general are high in fibre, whereas meat and dairy do not contain fibre. The fat content of meat and dairy depends on the part of the animal that is used or the method of processing. Saturated fat is high for especially cheese (see Appendix 4). Nuts in general are also high in fat, but the proportion of saturated fat is relatively small.
The fat content of insects can be relatively high and they contain fibre (Yhoung-aree, 2010, Banjo et al., 2006, Bukkens, 1997, Finke, 2002, Ramos-Elorduy et al., 1997).
2.3 Summary
In short, protein-rich plant-based foods, i.e.. legumes, whole grains, nuts and ready-made meat and dairy replacers, can provide valuable nutrients. Fortified ready-made meat replacers can contribute specifically to iron, calcium, vitamin B2 and B12; the latter of which cannot be supplied by plant sources. In addition, new protein sources, such as insects, can also provide valuable nutrients. A transition to protein sources will influence people’s daily diets. Innovations to facilitate this, such as hybrid meat or a better texture of meat replacers are ongoing.
3
Intake of protein-rich foods and related nutrients
In this section, we describe how animal protein sources currently contribute to protein and micronutrient intake in the Netherlands and explore the current role of plant protein sources. Also, we explore the expected nutritional changes when meat and dairy are replaced by more sustainable sources.
3.1 Current intake of protein-rich foods, protein and selected nutrients
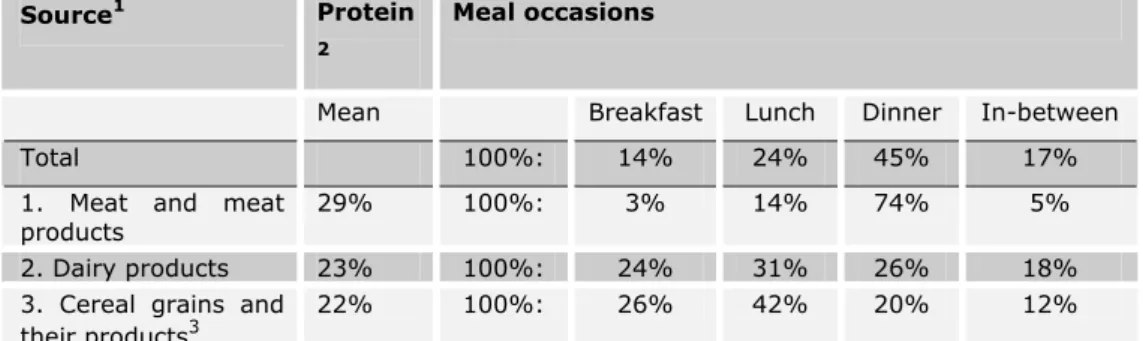
Meat and dairy products contribute on average 52% to total protein intake as reported in the most recent Dutch National Food Consumption Survey (DNFCS) (Van Rossum et al., 2011). Of the total protein consumption, the largest part (45%) is consumed during dinner (Table 3). Of the total animal protein, 55% is consumed during dinner (data not shown). Dinner is the main occasion where meat and meat products contribute to protein intake, on average 74% (see Table 3). For dairy products, the contribution to protein intake by meal occasion is more evenly divided. For cereals and cereal products (including bread), lunch is the most important food occasion (42% of protein intake).
Table 3: Top 3 contribution (mean %*) to the intake of protein among the Dutch
population (7-69 yrs), weighted for socio-demographic factors, season and day of the week (n=3819) and shown by meal occasion
Source1 Protein
2
Meal occasions
Mean Breakfast Lunch Dinner In-between
Total 100%: 14% 24% 45% 17%
1. Meat and meat
products 29% 100%: 3% 14% 74% 5%
2. Dairy products 23% 100%: 24% 31% 26% 18%
3. Cereal grains and their products3
22% 100%: 26% 42% 20% 12%
*there is large variation within the population; 1EPIC-soft food groups; 2 Total protein; 3Cereal
products contain virtually no animal protein, therefore the first two categories equal animal protein and the latter equals plant protein
Grain consumption consists mainly of wheat, in the form of bread (Van Rossum et al., 2011). Other protein-rich products, such as nuts, legumes and soy products, currently are an insignificant source of protein in the Dutch diet (Van Rossum et al., 2011).
In the most recent DNFCS, the median habitual protein intake was 61-98 g/d for men and 60-75 g/d for women and above the EAR for almost the whole
population (Van Rossum et al., 2011). In all age groups the median habitual amount of animal protein was higher than of vegetable protein. For animal protein, the median habitual intake ranged from 36-62 g/day for men and 36-47 g/day for women. For vegetable protein this was 25-37 g/d for men and 23-28 g/d for women (Van Rossum et al., 2011). The median habitual intake of protein as a proportion of energy intake ranged from 12-16 en% and did not exceed the upper bound of 25 en% (Van Rossum et al., 2011).
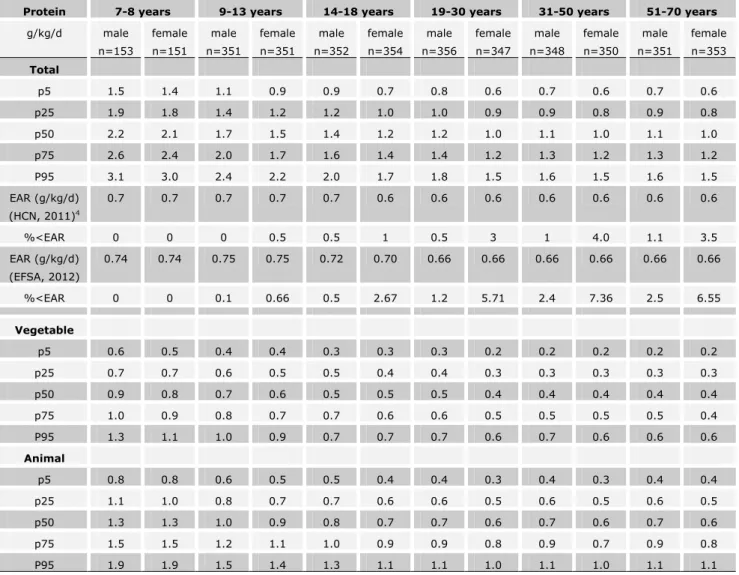
Expressed by kg of body weight, the habitual protein intake ranged from 2.2 to 1.1 for men and 2.1 to 1.0 for women with increasing age (see Table 4). The percentage of the age/sex groups with intakes below the EAR was close to zero. Adult females could be an exception, 3-4 % of the females 19 years and older were below the EAR. This increased to around 7% when compared to more recent estimations of average requirement by EFSA (EFSA, 2012). However, measurement uncertainties interfere with the lower (and higher) percentages. Therefore, percentages below 10% are generally not considered to indicate a public health problem (Table 8.1 in the most recent DNFCS food consumption survey report (Van Rossum et al., 2011)).
As noted before, intake of protein is mainly through animal sources, i.e. meat and dairy products (see Table 3). These sources have a high content of indispensable amino acids (see Appendix 1 for background information on amino acids) and most Dutch people will have intakes of indispensable amino acids above requirements (EFSA, 2012). Excess of indispensable amino acids will be converted to dispensable amino acids or are directly oxidized (EFSA, 2012). The human body needs both indispensable and dispensable amino acids, their main distinction is in the ability of the human body to generate them.
Besides high quality protein, animal sources provide valuable micronutrients, see Table 5. Meat most significantly contributes to intake of heme iron, selenium, vitamin B12, zinc, and vitamin B1. Dairy products most significantly contribute to intake of calcium, vitamin B2, vitamin B12, phosphorus, vitamin A and zinc. When replacing meat and dairy products, these micronutrients need to be considered. In the remainder of this section we will focus on these micronutrients.
Protein 7-8 years 9-13 years 14-18 years 19-30 years 31-50 years 51-70 years
g/kg/d male n=153 female n=151 male n=351 female n=351 male n=352 female n=354 male n=356 female n=347 male n=348 female n=350 male n=351 female n=353 Total p5 1.5 1.4 1.1 0.9 0.9 0.7 0.8 0.6 0.7 0.6 0.7 0.6 p25 1.9 1.8 1.4 1.2 1.2 1.0 1.0 0.9 0.9 0.8 0.9 0.8 p50 2.2 2.1 1.7 1.5 1.4 1.2 1.2 1.0 1.1 1.0 1.1 1.0 p75 2.6 2.4 2.0 1.7 1.6 1.4 1.4 1.2 1.3 1.2 1.3 1.2 P95 3.1 3.0 2.4 2.2 2.0 1.7 1.8 1.5 1.6 1.5 1.6 1.5 EAR (g/kg/d) (HCN, 2011)4 0.7 0.7 0.7 0.7 0.7 0.6 0.6 0.6 0.6 0.6 0.6 0.6 %<EAR 0 0 0 0.5 0.5 1 0.5 3 1 4.0 1.1 3.5 EAR (g/kg/d) (EFSA, 2012) 0.74 0.74 0.75 0.75 0.72 0.70 0.66 0.66 0.66 0.66 0.66 0.66 %<EAR 0 0 0.1 0.66 0.5 2.67 1.2 5.71 2.4 7.36 2.5 6.55 Vegetable p5 0.6 0.5 0.4 0.4 0.3 0.3 0.3 0.2 0.2 0.2 0.2 0.2 p25 0.7 0.7 0.6 0.5 0.5 0.4 0.4 0.3 0.3 0.3 0.3 0.3 p50 0.9 0.8 0.7 0.6 0.5 0.5 0.5 0.4 0.4 0.4 0.4 0.4 p75 1.0 0.9 0.8 0.7 0.7 0.6 0.6 0.5 0.5 0.5 0.5 0.4 P95 1.3 1.1 1.0 0.9 0.7 0.7 0.7 0.6 0.7 0.6 0.6 0.6 Animal p5 0.8 0.8 0.6 0.5 0.5 0.4 0.4 0.3 0.4 0.3 0.4 0.4 p25 1.1 1.0 0.8 0.7 0.7 0.6 0.6 0.5 0.6 0.5 0.6 0.5 p50 1.3 1.3 1.0 0.9 0.8 0.7 0.7 0.6 0.7 0.6 0.7 0.6 p75 1.5 1.5 1.2 1.1 1.0 0.9 0.9 0.8 0.9 0.7 0.9 0.8 P95 1.9 1.9 1.5 1.4 1.3 1.1 1.1 1.0 1.1 1.0 1.1 1.1
Table 4. Current habitual1 protein-by-weight2 intake distribution in the Dutch population (weighted; n=38173)
1calculated using SPADE (statistical program to assess dietary exposure) (Souverein et al., 2011);2self-reported; 3for 2 subjects, weight is missing; 4Health Council of the Netherlands, 2001
Table 5: Top mean contribution (%) of dairy and meat to micronutrient intake among the Dutch population (7-69 yrs), weighted for socio-demographic factors, season and day of the week (n=3819) (Van Rossum et al., 2011)
Dairy1 Meat
Calcium 58 1 Heme Iron2 85
Vitamin B2 39 2 Selenium 31
Vitamin B12 38 3 Vitamin B12 30
Phosphorus 32 4 Zinc 28
RAE3,4 ; Zinc4 23 5 Vitamin B1 24
1Dairy also contributes importantly to iodine intake, but this nutrient requires special
attention and is outside the scope of this report. It is added to salt.; 2Most iron is consumed as non-heme iron, but heme iron has better absorbability; largest source of non-heme iron in the Netherlands are cereals and cereal products; 3Retinol activity equivalents; 4equal contribution
Some population subgroups may have difficulty to meet the recommendations for some of the micronutrients for which meat and dairy products are important sources. For vitamin B1 this concerns adult women below 50 years, where 15-19% may have inadequate intakes (Van Rossum et al., 2011); For iron, there is indication that some groups, especially women of childbearing age, have relatively low intakes (estimated proportions are expected to be an underestimation). Inadequacy also exists for zinc, for 1-24% of children and 5-14% of adults (Van Rossum et al., 2011). For vitamin A, intake appears to be inadequate for 15-30% of almost all subgroups. For vitamin A, vitamin B1, iron and zinc, it is unknown what the health consequences of lower intakes are (Van Rossum et al., 2011).
Knowing that a) intakes of the above nutrients may already be suboptimal and b) meat and dairy products are major sources of these nutrients, these nutrients require extra attention when reducing meat and dairy consumption.
3.2 Current dietary intake on meat-free and fish-free days
To get an idea of the influence of a reduction in meat and fish consumption on current nutrient and food intake, we grouped the most recent DNFCS population, covering males and females in the age of 7 to 69 years, according to consumption of meat and fish and calculated their intake. The DNFCS measures food consumption on two independent days. We differentiated three groups: those consuming no meat or fish on the two measurement days (n=77, or 2% of the DNFCS population), those consuming meat or fish on one of the two measurement days (n=434, or 11%) and those consuming meat or fish on both measurement days. Table 6 and 7 show their selected nutrient and food intakes and some characteristics. As fish does not contribute significantly to protein
description for better readability (though it is taken into account). It is noted that these data represent observed consumption (which is suitable for this expolorative purpose), and not long term mean (habitual) intake.
In the DNFCS, adults not consuming meat (on both days or one day) are more often female (see Table 7). For both children and adults, BMI appears to be lower for those not consuming meat (Table 6 and 7). Both children and adults not consuming meat (on both days or one day) had lower energy intakes; for example, for adults this was approximately 1900 kcal/d versus approximately 2300 kcal/d on meat consumption days. Fat intake was also lower, although the percentage of energy provided by saturated fat did not appear to differ; for both adults and children this was 12-13 en%. This is probably due to the generally higher intake of dairy among those not consuming meat (see below).
Protein intake is higher among those consuming meat (Table 6 and 7). As the percentage of males and females differs between the groups, the best comparison can be made on a ‘protein by kg body weight’ basis or within the group that consumes meat on one day. For those that do not and those that do consume meat on two days, respective protein intakes are approximately 0.8 versus 1.1 g/kg bw for adults and 1.3 versus 1.5 g/kg bw for children. For those that do not and those that do consume meat on one day, protein intake is approximately 60 versus 85 g for adults or 50 versus 65 g for children. On meat-free days, adults and children consumed approximately half the amount of animal protein (with dairy as the main source, Figure 1) of those who do consume meat (Table 6 and 7). However, the absolute amount of vegetable protein is only slightly higher on meat-free days. The main plant source is cereal grains (Figure 1.). Thus, on meat-free days, there are two main sources of protein (see Figure 1.): dairy products and cereal grains; these contribute to total protein intake by somewhat higher percentages than on days of meat consumption, where meat contributes most. Notable is the low contribution, both in a relative and absolute sense, of legumes. This is visible both on meat and meat-free days.
Group Ch a ra ct e ris ti c No me a t or f is h 1 o n bo th da y s 2 No m e at o r f is h on o n e day Me a t or fis h o n bo th da y s 2 n=3 1 n= 2 0 3 n= 1 479 Day w/ ou t Day wi th Age (yea rs ) 13. 1 ± 3 .6 11 .7 ± 3. 6 12 .5 ± 3 .4 7 -8 (n) 9 -13 (n) 14-18 ( n ) 4 11 16 49 84 70 25 1 60 8 62 0 S ex (n / % f em al e) 15 / 48 % 10 8 / 5 3 % 73 4 / 5 0 % BM I 18. 1 ± 3 .1 18 .3 ± 3. 3 19 .2 ± 3 .6 Me an ± s d p5 0 Me an ± s d p5 0 Me an ± sd p5 0 Me an ± sd p5 0 Ene rg y i n take kc al /d ; kJ /d 20 54 ± 80 4 ; 8 6 28 ± 3 3 65 1 9 66; 8 2 66 19 67 ± 67 1 ; 82 6 9 ± 2 8 20 19 1 5 ; 80 4 6 2 1 32 ± 59 3; 89 52 ± 24 8 4 20 4 2 ; 85 8 2 2 2 29 ± 62 8; 93 58 ± 26 2 8 21 4 5 ; 90 20 N u tr ie nt inta ke Me an ± s d p5 0 Me an ± s d p5 0 Me an ± sd p5 0 Me an ± sd p5 0 % ina d eq ua cy in D N FC S 3 Pr o te in (g /d ) 58 ± 1 9 57 52 ± 2 2 50 68 ± 2 3 65 74 ± 2 3 69 < 1 % an im al ; veg eta bl e 25 ± 1 3 ; 32 ± 1 3 23; 30 25 ± 1 5 ; 28 ± 1 2 23 ; 25 41 ± 1 9 ; 26 ± 9. 3 38 ; 25 45 ± 1 8 ; 28 ± 9. 6 41 ; 27 by k g bo dy we ig h t 1 .34 ± 0 .51 1. 2 4 1 .31 ± 0 .63 1.2 0 1. 7 3 ± 0. 8 6 1.5 5 1. 6 1 ± 0. 6 2 1.5 3 no t d et erm in ed (s ee T ab le 4) Fa t (g /d ) 75 ± 4 0 73 67 ± 3 0 66 81 ± 3 2 75 84 ± 3 1 80 sa tu ra te d g/ d; sa tur ated e n % 29 ± 1 6 ; 1 2 .1 ± 3. 4 26 ; 12. 4 27 ± 1 3 ; 12 .2 ± 4 .4 25 ; 11 .8 30 ± 1 2 ; 12 .7 ± 3. 1 28 ; 12 .4 31 ± 1 2 ; 12 .5 ± 2. 7 30 ; 12 .4 [% t oo h ig h : 86-8 7 ] C ar b o h yd ra tes (g /d ) 27 5 ± 9 9 26 2 2 7 9 ± 1 0 1 26 7 27 2 ± 8 1 25 7 28 0 ± 7 7 27 1 gi rls 9-18 yr : 15 -2 9 Fi b re (g /d ) 1 9 ± 8. 5 17 16 ± 8 15 17 ± 6 16 18 ± 6 17 u n cl ea r, ev en p 9 5 b elo w g u id el in es Vi ta m in A (R AE 4 ; µ g /d ) 6 4 4 ± 4 1 4 50 4 5 0 3 ± 4 0 4 43 8 5 9 8 ± 6 3 6 41 4 68 3 ± 6 8 8 51 4 6-34 % Vi ta m in B1 ( m g/ d) 0 .84 ± 0 .41 0. 6 8 0 .76 ± 0 .91 0.5 7 1. 0 ± 0. 58 0.8 8 1. 1 ± 0 .51 0.9 5 ≤ 13 y r lo w, >1 3 y r u n cl ear Vi ta m in B2 ( m g/ d) 1.4 ± 0 .61 1. 4 1 .5 ± 1. 2 1. 3 1. 4 ± 0. 74 1. 3 1. 5 ± 0 .69 1. 3 lo w Vi ta m in B1 2 ( μ g/ d) 2 .5 ± 1. 3 2. 2 2 .7 ± 1. 7 2. 4 3. 4 ± 1 .9 3. 1 3. 8 ± 2 .1 3. 3 lo w C alc iu m ( m g/ d) 10 75 ± 44 1 89 7 10 00 ± 54 7 91 1 9 4 8 ± 4 6 1 91 7 93 5 ± 4 1 6 87 0 ≤ 13 y r lo w, >1 3 y r u n cl ear Ir on ( m g/ d) 9 .1 ± 3. 3 8. 0 7 .6 ± 3. 7 7. 1 8. 6 ± 3 .2 8. 0 9. 1 ± 2 .9 8. 6 ≤ 10 y rs lo w , >1 0 y r u n cl ea r heme ; no n-heme 0 .05 8 ± 0.1 5 ; 9 .0 ± 3. 3 0. 0 1 ; 7. 8 0 .09 0 ± 0 .2 4 ; 7 .5 ± 3. 6 0.0 2 ; 6. 9 0. 8 7 ± 0. 8 9 ; 7. 8 ± 2 .9 0.6 1 ; 7. 2 1. 0 ± 0. 75; 8. 1 ± 2 .7 0.8 3 ; 7. 7 Ph ospo ru s ( m g/ d) 12 78 ± 44 9 1 0 98 11 62 ± 54 8 11 1 0 1 3 04 ± 44 4 12 9 2 1 3 54 ± 44 6 12 79 lo w ( H C N ); ≤ 8 y r l ow, >8 y r 5-2 8 % ( IOM ) S el enium (mg /d ) 33 ± 1 9 30 24 ± 1 1 22 35 ± 1 6 33 38 ± 1 5 35 lo w/ un cl ea r (H C N ); 1 1 -7 5 % (I O M ) Zi n c ( m g/ d) 7 .9 ± 3. 5 7. 4 6 .4 ± 2. 9 6. 1 8. 7 ± 3 .5 8. 4 9. 2 ± 3 .2 8. 6 1-24 % A m o unt of p rot ei n fr om p ro d u ct ca tego ry ( g /d ) Me an ± s d p5 0 Me an ± s d p5 0 Me an ± sd p5 0 Me an ± sd p5 0 Mea t and m eat p ro d uc ts 0 0 0 0 19 ± 1 6 18 23 ± 1 4 20 Dai ry p ro d u ct s 19 ± 1 3 19 19 ± 1 5 17 18 ± 1 3 17 17 ± 1 1 15 Leg u me s (o n con su m p ti on da ys ) 2. 8 ± 0 .00 5 (n= 2 ) - 13 .3 ± 2 .3 (n= 2 ) - 5. 2 ± 3 .2 (n= 4 ) - 6. 7 ± 3 .7 (n= 6 6 ) 5. 9 Nut s (o n con su m p ti on da ys ) 5 .9 ± 4. 1 (n = 16) 3. 7 7 .4 ± 6. 7 (n = 41) 4. 4 8. 2 ± 5 .9 (n= 3 6 ) 6. 4 6. 9 ± 6 .1 (n= 5 47 ) 4. 4 M ea t an d dai ry r epl ace rs 5 (o n con su m p ti on da ys ) 13. 8 ± 8. 1 (n = 13) 14. 1 9 .5 ± 4. 9 (n = 12) 9. 2 5. 6 ± 3 .0 (n= 4 ) - 10 ± 7. 0 (n= 5 1 ) 8. 3 Table 6: Nutr ient and f o od intak e s and basic cha ract e rist ics o f y o uth (7 -18 years) i n the Dutc h National Food Consu m pti o n Surv ey 2007-2010 diff er ent iat e d by t h eir c o nsumpt ion o f meat or f ish on zer o , on e or tw o day s, unwe ight e d 1defined as no consumption fr om epic soft food group 07 ( m eat and m eat products) , 08 (
fish and shellf
is h) or a sele cti o n of food grou p 17 0 3 (snack s: manual selec tion of pre d om inantly m ea t-based snacks, whe re anim al protein >5 0% o f total prote in); 2me an of 2 days; 3As com p ar ed to gu idelin es by th e Hea lth Council o f the N ether lands ( H CN ) and in s o m e cases also the I n stitu te of Medi cine ( IOM, U SA) ; W ith res p ect to m icronu trien ts, DN FCS 200 7-2 01 0 r ep o rted ‘ n o publ ic heal th problem ’ for vit am in B 2 and vitam in B 12. For other m icronu trien ts , m o re inf o rm ation is wa nted; DN FCS 2 007-20 10 r eco m m ends the p er form ance of n u trition al status r esea rch and rese arch o n health effec ts for vitamin A, B1 , calcium; re search on h ealt h effects fo r iro n
and zinc; and re
-evalu ation o f the ref er enc e values for p hos p horus and selen ium; 4ret inol activit y e q ui valents; 5def ine d as consum p
tion from food
g rou p 17 0 0 and 17 0 1
Gr oup C h ar ac te ri st ic No me at o r f is h 1 o n bo th da y s 2 No m e at or f is h o n o n e da y Mea t o r fi sh on b o th d a y s 2 n = 46 n= 22 0 n= 1 8 40 Da y w/ ou t Da y wi th A g e (y ea rs ) 43 .6 ± 1 5 .1 4 0 .3 ± 14 .7 42 .3 ± 1 5 .0 1 9 -3 0 (n) 3 1 -5 0 (n) 5 1 -7 0 (n) 15 14 17 90 67 63 59 8 61 8 62 4 S ex (n / % f em ale ) 33 / 72 % 13 4 / 6 1 % 88 4 / 4 8 % BM I 2 4 .6 ± 5.7 25. 2 ± 5.4 2 6 .1 ± 4. 9 Me an ± s d p50 Me an ± s d p50 Me an ± s d p50 Me an ± s d p5 0 En er g y intake kc al/d ; kJ /d 18 92 ± 6 4 7 ; 79 41 ± 2 7 1 3 18 53 ; 77 84 18 57 ± 8 2 2 ; 77 94 ± 3 4 5 0 18 65; 78 35 22 94 ± 9 2 7 ; 96 19 ± 3 8 8 2 21 22; 89 40 23 30 ± 7 3 9 97 70 ± 3 0 9 2 22 33 ; 93 57 N u tr ie nt int ake Me an ± s d p50 Me an ± s d p50 Me an ± s d p50 Me an ± s d p5 0 % inad eq ua cy in DN FC S 3 Pr o te in (g/d ) 60 ± 1 8 61 59 ± 2 8 59 86 ± 3 4 80 88 ± 2 8 84 <1 % anima l; veg et ab le 25 ± 1 2 ; 34 ± 1 4 25; 33 28 ± 1 9 ; 31 ± 1 5 25 ; 30 54 ± 2 7 ; 32 ± 1 5 48 ; 30 56 ± 2 3 ; 32 ± 1 1 52 ; 30 by k g bo dy w ei g h t 0. 8 6 ± 0 .3 1 0. 8 4 0. 8 1 ± 0.4 2 0. 7 8 1.2 ± 0. 51 1. 0 1. 1 ± 0 .40 1. 1 not deter m in e d ( see T ab le 4 ) Fa t (g /d) 68 ± 3 2 67 65 ± 3 6 61 86 ± 4 3 79 91 ± 3 6 86 sa tur ate d g/d ; sa tur ate d e n % 26 ± 1 3 ; 12. 0 ± 4 .0 25; 11.7 27 ± 1 6 ; 1 2 .8 ± 4. 8 24 ; 12 .0 33 ± 1 6 ; 1 2 .9 ± 4. 1 29 ; 12 .7 34 ± 1 4 ; 12. 8 ± 3.1 32 ; 12 .6 [ % t o o h ig h : 88-91] Carb oh yd rat es ( g /d ) 23 8 ± 8 8 24 8 23 2 ± 1 11 22 7 25 6 ± 1 17 24 2 25 3 ± 8 7 24 0 w o m e n : 21 -49 Fi bre (g /d ) 2 3 ± 9. 3 21 19 ± 1 0 18 21 ± 9. 9 20 2 1 ± 7. 1 20 u n cl e ar , e ve n p 9 5 be lo w gu id e lin e s Vi ta m in A ( R AE 4; µg /d ) 68 5 ± 4 6 5 57 3 55 0 ± 3 85 46 9 94 8 ± 2 3 4 6 57 5 87 3 ± 9 2 8 63 4 16-30 Vi ta m in B 1 ( m g /d) 0. 8 4 ± 0 .3 7 0. 7 6 0. 7 7 ± 0.5 2 0. 6 5 1.2 ± 1. 3 0. 9 7 1. 3 ± 0 .66 1. 1 me n : ≤ 5 0 y r 4% , > 5 0 y r lo w ; wo m e n ≤ 50 yr 15-19 % , >50 y r lo w Vi ta m in B 2 ( m g /d) 1.3 ± 0. 52 1.4 1.5 ± 0. 97 1. 3 1.7 ± 1. 6 1. 4 1. 7 ± 0 .77 1. 5 <1 0 % Vi ta m in B 1 2 ( μ g/ d ) 2.3 ± 1. 3 2.1 2.8 ± 2. 0 2. 6 5.0 ± 5. 0 3. 6 5. 1 ± 3 .86 4. 3 <1 0 % C alcium (mg /d ) 11 38 ± 4 3 1 10 94 11 03 ± 6 5 0 99 8 10 80 ± 5 5 0 97 2 10 60 ± 4 5 5 10 03 lo w ; u n cle ar Ir on ( m g/ d ) 1 0 ± 3. 3 9.8 9.0 ± 4. 6 8. 8 11 ± 4. 8 10 1 1 ± 3. 6 10 me n : l o w; wo men : ≤ 5 0 yr u n cl e ar , > 5 0 yr l o w hem e; no n -heme 0. 0 5 ± 0 .1 6 ; 1 0 ± 3. 4 0. 0 0 ; 9.8 0. 1 2 ± 0.3 6 ; 8.9 ± 4. 6 0. 0 1 ; 8. 4 1.1 ± 1. 1; 9.9 ± 4. 5 0. 7 4 ; 9. 0 1.3 ± 1. 0; 9.7 ± 3. 2 1. 1; 9. 2 Ph os po ru s ( m g /d) 13 26 ± 4 6 7 12 79 12 98 ± 6 5 8 12 38 15 95 ± 6 5 5 14 83 16 03 ± 5 1 5 15 50 lo w (H C N ); 0 % (IO M ) S elenium (m g/d ) 31 ± 1 6 29 30 ± 1 8 26 50 ± 2 7 44 50 ± 2 2 46 m e n: lo w ( H C N )/ 21-28% ( IOM ); w o m en: uncl e ar ( H C N )/ 46-5 8 % ( IOM) Zi n c ( m g /d) 8.3 ± 2. 6 8.2 7.7 ± 4. 1 7. 2 11 ± 4. 5 10 1 1 ± 3. 9 11 5-14 % Am ou n t of p rot ei n fr om p ro d u ct ca te g or y (g/d ) Me an ± s d p50 Me an ± s d p50 Me an ± s d p50 Me an ± s d p5 0 Meat and m eat p ro d ucts 0 0 0 0 25 ± 2 2 21 29 ± 2 0 25 Da ir y p ro d u ct s 20 ± 1 1 21 21 ± 1 7 18 20 ± 1 5 18 20 ± 1 2 18 Leg u m es (on con su m pt io n da ys ) 16 ± 0 .9 (n= 2 ) - 6.8 ± 4. 9 (n = 8 ) - 7. 5 ± 5.5 (n = 9 ) 5. 8 8.6 ± 6. 3 (n= 8 3 ) 7. 5 Nu ts (on con su m pt io n da ys ) 7.3 ± 4. 9 (n= 2 2 ) 5.9 6.8 ± 5. 8 (n = 4 8 ) 5. 3 8.8 ± 9. 6 (n = 5 2 ) 4. 5 8 .5 ± 8. 3 (n= 7 31 ) 6. 8 M eat and dair y re p lac er s 5 (on con su m pt io n da ys ) 1 0 ± 6. 1 (n= 3 0 ) 9.4 11 ± 6. 4 (n = 2 2 ) 10 .2 9.2 ± 6. 4 (n = 6 ) - 8.4 ± 6. 4 (n= 7 9 ) 6. 5 Table 7: Nutr ient and f o od intak e s and basic cha ract e rist ics o f a d ul ts (19-69 y e ars) in the Dutch Nat ion al F ood Cons umpti o n Sur ve y 2007-201 0 diff er ent iat e d by t h eir c o nsumpt ion o f meat or f ish on zer o , on e or tw o day s, unwe ight e d 1defined as no consumption fr om epic soft food group 07 ( m eat and m eat products) , 08 (
fish and shellf
is h) or a sele cti o n of food grou p 17 0 3 (snack s: manual selec tion of pre d om inantly m ea t-based snacks, whe re anim al protein >5 0% o f total prote in); 2me an of 2 days; 3As com p ar ed to gu idelin es by th e Hea lth Council o f the N ether lands (HCN ) and in s o m e cases also the I n stitu te of Medi cine (I OM, U SA); W ith res p ect to m icronu trien ts, DN FCS 200 7-2 01 0 r ep o rted ‘ n o publ ic heal th problem ’ for vit am in B 2 and vitam in B 12. For other m icronu trien ts , m o re inf o rm ation is wa nted; DN FCS 2 007-20 10 r eco m m ends the p er form ance of n u trition al status r esea rch and rese arch o n health effec ts for vitamin A, B1 , calcium; re search on h ealt h effects fo r iro n
and zinc; and re
-evalu ation o f the ref er enc e values for p hos p horus and selen ium; 4ret inol activit y e q ui valents; 5def ine d as consum p
tion from food
g rou p 17 0 0 and 17 0 1
a) Adults consuming no meat (mean of two days), n=46 0 10 20 30 40 50 60 70 pota toes , tub ers vege tabl es legu mes fruits , nut s, o lives dairy pro duct s cere als mea t, m eat p rodu cts fish, she llfis h egg fa t suga r, co nfec tione ry cake s no n-alc beve rage s alc beve rage s cond imen ts, s auce s soup s, b ouill on mis cella neou s % c ont ri bu tio n to pr ot ei n in ta ke
b) Adults consuming no meat (one day), n=220
0 10 20 30 40 50 60 70 pota toes , tub ers vege tabl es legu mes fruits , nut s, o lives dairy pro duct s cere als mea t, m eat p rodu cts fish, she llfis h egg fa t suga r, co nfec tione ry cake s no n-alc beve rage s alc beve rage s cond imen ts, s auce s soup s, b ouill on mis cella neou s % c ont ri bu ti on t o p ro te in i n ta ke
c) Adults consuming meat (mean of two days), n=1840
0 10 20 30 40 50 60 70 pota toes , tub ers vege tabl es legu mes fruits , nut s, o lives dairy pro duct s cere als mea t, m eat p rodu cts fish, she llfis h egg fa t suga r, co nfec tione ry cake s no n-alc beve rage s alc beve rage s cond imen ts, s auce s soup s, b ouill on mis cella neou s % c ont ribut ion t o pr ot ei n in ta ke
Legume soups are not in group ‘legumes’ but in group ’soups, bouillon’; unfortunately, the type of legume cannot be differentiated.