EVALUATION
OF
THE
HM4DI-HA
RECEPTOR
FOR
CHEMOGENETIC
SEIZURE SUPPRESSION IN A MOUSE
MODEL
FOR
DRUG-RESISTANT
TEMPORAL LOBE EPILEPSY
Fleur Boone
Student number: 01500376
Supervisor(s): Prof. Dr. Paul Boon, Prof. Dr. Robrecht Raedt
Department: 4Brain
A dissertation submitted to Ghent University in partial fulfilment to the requirements for the degree of Master of Science in the Biomedical Sciences
PREFACE
Gratefully, I would like to thank a few people who invested great effort and time in helping me the last two years.
First, I would like to thank my promotor, Prof. dr. Paul Boon for the opportunity to work in the 4Brain lab. Although the field of chemogenetics can be confusing, you helped me to keep the overview and your contagious enthusiasm motivated me to successfully complete this master’s dissertation.
My copromotor, Prof. dr. Robrecht Raedt, thank you for tutoring me the last two years and patiently teaching me to think critically and work hard during many meetings.
Jana, a tremendous and warm thank you goes out to you. I could always count on your help, you answered my many questions and clarified any issue I didn’t understand. You trusted me to process a part of your own research and taught me to work independently, accurately and precisely. I sincerely thank you for all your time you invested in me and wish you the best! I also want to thank the other doctoral students Marie, Anirudh, Latoya, Charlotte B., Charlotte G., Erin, Silke, and Erine and dr. Lars for helping me where needed.
Although the master’s internship was not always easy, my fellow neuroscience students effortlessly improved every situation. Delphine, Wayra, Sofie, Ella and Aki, thanks for all support and fun conversations in the, sometimes, crowded lab. Unfortunately, the corona crisis spoiled our talking and gathering sessions in the last semester.
Emma, Maité and Marisha, thanks for the lunch breaks in which we could ventilate our feelings shamelessly, laugh freely and talk for hours.
Next, I’d like to thank my parents, for the chances and support during my entire education and the many reminders that some relaxation time every now and then is equally as important as working. Lastly, Pepijn, thanks for cheerfully responding to my enthusiastic attempts to explain my thesis’ features. Despite the level of difficulty, you always did your best to understand and reassured me in stressful moments.
THE EFFECT OF THE CORONA-CRISIS ON THIS MASTER’S DISSERTATION
Fortunately, all results were already obtained before or during the Corona virus outbreak. A last process of cresyl violet staining was realized by my mentor during the outbreak.
TABLE OF CONTENTS
Preface ...i
Table of contents ... iii
1. Summary ... 1
2. Introduction ... 2
2.1. Epilepsy ... 2
2.1.1. Definition of epilepsy ... 2
2.1.2. Neuroimaging techniques for diagnosis and presurgical evaluation ... 2
2.1.3. Therapies ... 3
2.1.3.1. Antiepileptic drugs ... 3
2.1.3.2. Brain surgery ... 3
2.1.3.3. Neurostimulation ... 4
2.1.4. Temporal lobe epilepsy ... 4
2.1.4.1. Definition ... 4
2.1.4.2. The normal hippocampal formation ... 5
2.1.4.3. Epileptogenesis ... 5
2.1.4.4. Ictogenesis ... 7
2.1.4.5. Intrahippocampal kainic acid mouse model ... 8
2.2. Designer Receptors Exclusively Activated by Designer Drugs (DREADDs) ... 8
2.2.1. Mechanism of hM4Di ... 9
2.2.1. Ligands: clozapine and JHU37160 ... 9
2.2.2. Viral construct ... 10
2.2.3. Challenges in current state of research: neurotoxicity ... 11
2.3. Automatic seizure detection software ... 11
2.4. Research questions ... 13
3. Materials and methods ... 13
3.1. Experimental protocol ... 13
3.2. Animals and groups ... 14
3.3. Intrahippocampal kainate injection: generation of the IHKA model ... 14
3.4. MRI imaging ... 14
3.5. DREADD vector injection ... 15
3.6. Electrode recording ... 15
3.6.1. EEG electrode fabrication ... 15
3.6.2. Electrode implantation ... 15
3.6.3. EEG setup ... 16
3.7. Treatments: cross-over study ... 17
3.7.1. Analysis of the treatment effects ... 18
3.8. Automatic seizure annotation ... 19
3.9. Histology ... 19
3.9.2. Cresyl violet staining: assessing neurotoxicity ... 20
3.9.3. Hippocampal volume determination ... 20
3.10. Statistical analysis ... 21
4. Results... 22
4.1. Treatment study ... 22
4.1.1. 800mg/kg Levetiracetam treatment in non-DREADD and DREADD expressing mice ... 22
4.1.2. 0.1 mg/kg Clozapine treatment in non-DREADD and DREADD expressing mice ... 23
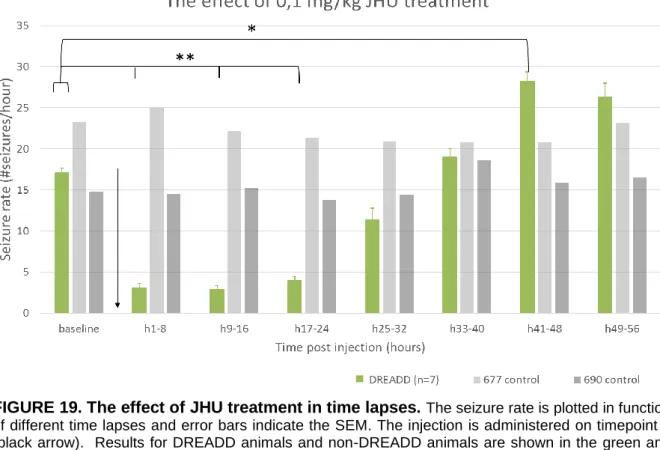
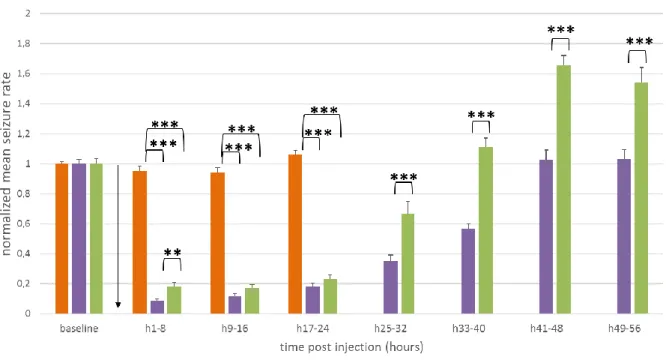
4.1.3. 0.1 mg/kg JHU37160 treatment in non-DREADD and DREADD expressing mice ... 24
4.1.4. Comparison between the different treatments ... 25
4.2. Automatic seizure detection software evaluation ... 26
4.2.1. Visual evaluation of automatic annotation ... 26
4.2.2. Test and training phase outcome parameters ... 28
4.2.3. Evaluation of automatic annotation errors ... 28
4.2.4. The use of corrected annotations ... 30
4.3. Calculation of hippocampal volume ... 31
4.3.1. MRI scan images ... 31
4.3.2. Histology ... 31
4.3.3. Comparison of the volume ratio before and after viral vector ... 32
4.4. Electrode localization and absence of hippocampal seizures ... 34
5. Discussion ... 35
5.1. Treatment in non-DREADD and DREADD expressing mice ... 35
5.1.1. Seizure suppression with levetiracetam ... 35
5.1.2. Activation of the hM4Di receptor with clozapine and JHU 37160 ... 35
5.2. Evaluation of the automatic annotation software ... 37
5.2.1. Currently used method of evaluation ... 37
5.2.2. Prospective method of evaluation ... 38
5.3. Influence of choice of tag on neurotoxicity ... 39
5.4. Influence of choice of tag on seizure detection ... 40
5.4.1. Success rate intrahippocampal kainic acid injection ... 40
5.4.2. Mislocalization of the depth electrodes over time ... 40
5.4.3. Difference in titer and tag: influence on receptor function ... 41
5.5. Further research recommendations and translation to human TLE therapy ... 41
5.5.1. Use of a reporter gene/tag ... 41
5.5.2. Application of DREADDs in epilepsy therapy ... 42
5.5.3. Automatic seizure detection ... 43
6. General conclusion ... 44
7. Reference list ... 45
8. Poster ... 48 9. Addendum ... I
1. SUMMARY
Background
Temporal lobe epilepsy is the most common form of epilepsy, with 30% pharmacoresistance. Designer Receptors Exclusively Activated by Designer Drugs (DREADDs) allow specific inhibition of neurons in the seizure focus. Previously, the mCherry tag was used for identification of DREADD expression. However, it assumingly causes neurotoxicity and is therefore replaced by the hemagglutinin (HA) tag. Additionally, automatic seizure detection software, based on machine learning is evaluated.
Methods
In this study, the intrahippocampal kainic acid (IHKA) mouse model is used. First, the neurotoxicity was compared between DREADD-mCherry and DREADD-HA expressing mice through decrease in hippocampal volume, before and after viral vector injection. This is realized through MRI imaging and cresyl violet staining, respectively. Secondly, the effect on seizure suppression after administering 800mg/kg levetiracetam and the DREADD ligands, 0.1mg/kg clozapine and 0.1mg/kg JHU37160, is investigated via electroencephalography. Lastly, automatic annotations are evaluated through comparison with manual annotations.
Results
While injection of clozapine and JHU37160 in DREADD expressing epileptic mice significantly inhibited seizures for 40 and 24 hours, respectively, levetiracetam only had a small effect during the first half hour. Contrasting the DREADD-HA mice, the decrease in hippocampal volume is significant in DREADD-mCherry mice and no seizures were detected. Lastly, 93.54% of automatic annotation mismatches were false positives.
Conclusions
The activation of DREADD technology inhibited hippocampal neurons, resulting in seizure silencing. Additionally, the DREADD-HA was proven to be superior to the DREADD-mCherry receptor, regarding the neurotoxicity. Although the automatic detection software is promising, some improvements are advised.
2. INTRODUCTION
2.1. Epilepsy
2.1.1. Definition of epilepsy
Epilepsy is a chronic neurologic condition which is characterized by recurrent unprovoked seizures1. According to the World Health Organization (WHO) report on epilepsy in 2019, approximately 50 million people of all ages of the world population are affected by this disease, making it one of the most common neurological conditions2. An epileptic seizure is defined as the result of excessive, hypersynchronous paroxysmal activity in the brain cortex. However, manifestation of seizures is not necessarily equal to suffering from epilepsy1,3. For example, seizures provoked by fever or hypoglycemia cannot be mistaken for epilepsy, because these are transcendent. To make a clear distinction, the International League Against Epilepsy (ILAE) designed a definition for epilepsy. If any of the subsequent conditions is fulfilled, a person is considered to be an epilepsy patient3:
1. When the person presents at least two unprovoked seizures occurring greater than 24 hours apart.
2. When the person presents one unprovoked seizure and a probability of further seizures greater than the general recurrence risk (at least 60%) after two unprovoked seizures, occurring over the next 10 years.
3. When the person is diagnosed with an epilepsy syndrome. These syndromes are based on specific clinical features, including the seizure types, electroencephalography (EEG) findings, the age at which seizures begin, chromosomal abnormalities…
In accordance with the operational classification of seizure types by the ILAE3, seizures can be divided in categories by onset: focal, generalized and unknown onset. Focal seizures originate in neuronal networks of one cerebral hemisphere, while generalized seizures engage bilaterally distributed neuronal networks1,3. Though, this concept is flexible; a seizure can start focally and evolve in a generalized seizure when the abnormal electrical activity spreads over the entire cerebrum. This is referred to as a secondary generalized seizure.
In theory, a seizure can be appreciated as an imbalance of excitation and inhibition in the brain1. Logically, excitation takes the upper hand and/or the amount of inhibition declines in epilepsy. The alteration in this balance can be caused by genetic pathologies, acquired cerebral insults or unknown origins. These causes are various and act on different levels in the brain1: e.g. on the circuit level in cortical dysplasia, on the receptor level in Angelman syndrome (abnormal γ-aminobutyric acid (GABA) receptor units), structural alteration of the hippocampus following cerebral insults in Temporal Lobe Epilepsy (TLE)…
The occurring symptoms during an epileptic seizure depend on the localization, the distribution and the intensity of the electric hyperactivity1. Additionally, epilepsy is frequently associated with multiple comorbidities, including major alterations in cognition and behavior, such as depression, anxiety and psychosis. Though, nonpsychiatric comorbidities, such as diabetes, obesity and cardiovascular disorders are also present. Consequently, these comorbidities as well as epileptic seizures impair the patient’s quality of life.
2.1.2. Neuroimaging techniques for diagnosis and presurgical evaluation
A diagnosis of seizure type is made through using a detailed history and examination of the patient, EEG findings and neuroimaging1. EEG is a method to monitor electrical activity of the brain and is used to detect abnormal electrical activity in epilepsy. Computed tomography (CT) and Magnetic resonance imaging (MRI) techniques are adjuncts to check for possible structural lesions. These neuroimaging techniques are important adjuncts in clinical examination for diagnosis of persons with seizures. Additionally, functional magnetic resonance imaging (fMRI), positron-emission tomography (PET), single-photon emission computed tomography (SPECT) and magnetoencephalography (MEG) techniques can be
consulted in the presurgical evaluation. Hereafter, an appropriate diagnostic evaluation and treatment plan is defined.
2.1.3. Therapies
2.1.3.1. Antiepileptic drugs
First, a monotherapy with an antiepileptic drug (AED) is set up in epilepsy treatment4. Seizure type, age of the patient, other medications, medical conditions and comorbidities should be considered in the choice of the appropriate medication. Initiation of combination therapy is attempted after failed monotherapy with the most indicated AEDs.
To date, epilepsy patients can count on a therapeutic arsenal of more than 25 drugs1. These drugs act on the electrical activity of the entire brain, mainly by decreasing the neuronal hyperexcitability5. The mostly used mechanisms of action of these AEDs can be categorized into four groups5. (i) The first group inhibits depolarization of excitatory neurons by blockade of voltage-dependent sodium or calcium channels. AEDs in this group comprise carbamazepine, phenobarbital and topiramate. (ii) The second group, which includes retigabine, enhances potassium channel function. Note that the developer company has withdrawn retigabine from clinical use in 2017, due to stated commercial reasons. (iii) The third group inhibits excitation mediated by neurotransmitters via blockage of N-methyl-D-aspartate (NMDAR) or α-amino-3-hydroxy-5-methyl-4-isoxazolepropionic acid (AMPAR) receptors: e.g. felbamate and topiramate. (iv) The last group promotes inhibition mediated by GABA. This is the enhancing result of direct action on GABA receptor activity or indirectly, by inhibition of GABA transaminase or GABA reuptake. Here, gabapentin, topiramate, vigabatrin comply. Importantly, the majority of AEDs act on several mechanisms of action.
By acting unspecifically on the excitability of the entire brain, all AEDs have prominent side effects on the central nervous system1. Indeed, sedation is most commonly observed. Other possible side effects on the central nervous system are ataxia, nausea and dizziness. However, as the entire body receives the AED, side-effects such as rash, agranulocytosis and liver problems might be observed. Adverse effects from an AED are detected in 7 to 31% of patients1.
In this master thesis, levetiracetam is used as one of the epilepsy treatments. This molecule inhibits rapidly firing neurons via binding on Synaptic vesicle glycoprotein 2A (SV2A)6. However, levetiracetam’s exact mechanism of action is unknown. SV2A is one of the three isoforms of SV2, an integral membrane protein of synaptic vesicles. They play a role in the control of regulated calcium-stimulated exocytosis and priming of synaptic vesicles. This AED is commonly used as first AED choice for focal seizures6.
When no seizures have been detected for one to five years, AED therapy may be terminated. Nevertheless, patients who have multiple seizures before AED therapy are prone to develop
drug-resistant epilepsy, which is the condition of experiencing inadequate seizure reduction
during AED therapy7. Importantly, this occurs in 30% of all epilepsy patients7. Furthermore, when treatment with one AED fails, the chance of becoming seizure free with the help of two or more AEDs diminishes. If these medications fail to fully control seizures, alternative treatments such as brain surgery, ketogenic diets or neurostimulation should be considered.
2.1.3.2. Brain surgery
If the patient does not benefit from taking AEDs, brain surgery could be performed. Only a subset of drug-resistant patients undergoes presurgical assessment, in which the seizure onset zones and functional areas are located8. Different kinds of epilepsy surgery can be distinguished, including resective surgery, corpus callosotomy, hemispherectomy, laser
interstitial thermal therapy and stereotactic radiosurgery. Here, resective surgery is
discussed illness in this thesis. Patients with a clear and reachable seizure onset zone can undergo surgical resective treatment. The aim of resective surgery is to remove the complete epileptogenic zone without harming eloquent cortex. This might include resection of a whole lobe, e.g. temporal lobe resection. Areas of eloquent cortex must be spared in order to avoid paralysis and new loss of sensory processing or linguistic ability. After undergoing resective brain surgery, only 47% of patients were cleared from epileptic seizures five years after surgery and this number even decreases to 38% after ten years9.
2.1.3.3. Neurostimulation
Neurostimulation is a modulatory technique of the neural activity10. It might be applied in refractory epilepsy patients when the above therapies cannot be performed or did not improve the patient’s situation, previously. This category comprises deep brain stimulation (DBS), vagus nerve stimulation (VNS), transcutaneous vagus nerve stimulation (tVNS) and transcranial magnetic stimulation (TMS)4. Here, DBS and VNS are invasive procedures.
VNS is an adjunctive treatment that consists of delivering intermittent electrical stimulation to
the vagus nerve by using a programmable pulse generator10. Through stimulation of the vagus nerve, the solitary nuclei in the brain stem are activated. Secondary activation of the locus coeruleus and further noradrenergic projections is obtained via propagated pathways. Generally, this appears to be a well-tolerated technique, which results in seizure reduction in 50% of cases10. Though, complete seizure freedom is detected in only 5% of patients. Administering higher frequency stimulation shows significantly more effective reduction in seizure frequency. However, higher frequency stimulation is also more likely to cause adverse effects, such as voice alteration and hoarseness, dyspnea, headache and nausea.
Deep brain stimulation is the intracranial stimulation of deep brain structures through
implanted depth electrodes which are connected to a pulse generator11,12. These deep brain structures might be located in the seizure onset regions and/or connected network. Additionally, this technique also claims to reduce seizure frequency in patients with severe and refractory epilepsy. Nevertheless, opinions are divided on the efficacy of stimulating certain targets, e.g. hippocampal stimulation. Again, specific adverse effects are examined and depend on the stimulated brain structure, such as depression and subjective memory impairment after stimulation of the anterior thalamus. Lastly, the positive effect of deep brain stimulation may not appear until after two years of therapy.
2.1.4. Temporal lobe epilepsy
2.1.4.1. Definition
Classifications of epilepsy syndromes have been based on anatomy of the zone of seizure onset3. In accordance with this classification, temporal lobe epilepsy is a group of epilepsy disorders that is characterized by unprovoked, recurrent seizures which arise in the temporal
lobe13. The ILAE distinguishes two main types of TLE: mesial temporal lobe epilepsy, which originates from the hippocampus, the parahippocampal gyrus and the amygdala and secondly,
lateral temporal lobe epilepsy, which originates from the neocortex of the temporal lobe14. The latter type is rather rare. TLE is the most common form of epilepsy with focal seizures13. Furthermore, focal seizure epilepsy is correlated with a higher susceptibility to
drug-resistance7. Presently, 30% of epilepsy patients is diagnosed with drug-resistance. Typically, TLE is acquired after febrile seizures or brain trauma, such as central nervous system infections, brain tumors, stroke or traumatic brain injury14. Though, genetics might also play a role. Unsurprisingly, these causes can result in defective hippocampal function. This is translated into problems in short-term to long-term memory transfer in the association cortices, episodic and declarative memory, and spatial navigation. During seizure activity, limited motor movement and a fixed motionless stare in combination with oral and manual automatisms with impaired consciousness might be examined. Autonomic symptoms such as pupillary dilatation, hyperventilation and tachycardia are commonly seen.
2.1.4.2. The normal hippocampal formation
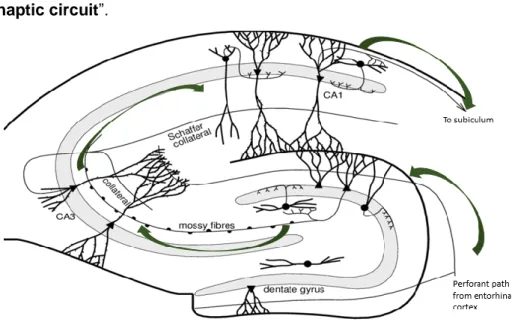
The hippocampal formation is a three-layered cortex in the medial temporal lobe that consists of the hippocampus proper, dentate gyrus and subiculum13 (FIGURE 1). The hippocampus proper is anatomically divided into different subfields of the Cornu Ammonis (CA1-CA4, CA4 is referred to as ‘hilus’), which includes a cell layer (stratum pyramidale) with excitatory
pyramidal cells. Excitatory granule cells can be found in a separate cell layer (stratum
granulosum) in the dentate gyrus (DG), which surrounds the Cornu Ammonis.
Signals coming from the adjoining entorhinal cortex are conducted into the hippocampus proper along the perforant path15. The perforant path axons terminate in the dentate gyrus and CA3. Subsequently, the granule cells send their axons, called mossy fibers, to CA3. Next, Schaffer collateral fibers project signals from CA3 to CA1. Lastly, the signals are carried out through the fornix. Thus, three synapses are made in this hippocampal pathway, hence the name “trisynaptic circuit”.
FIGURE 1. Schematic overview of the hippocampus and the trisynaptic circuit in mice.
The perforant path guides signals from the entorhinal cortex to the excitatory granule cells (triangle shaped cell bodies) of the dentate gyrus. These neurons send their axons, the mossy fibers, to excitatory pyramidal cells in the CA3 region. Though, GABAergic basket cells (roundly shaped cell bodies) in the dentate gyrus can inhibit these signals. Next, the CA3 pyramidal neurons will lead the signals further along the Schaffer collaterals to the pyramidal cells in CA1. Lastly, these neurons project towards the subiculum. The entity of the three synapses is referred to as the trisynaptic circuit. This figure is adapted from Dokter,M et al.15
2.1.4.3. Epileptogenesis
As previously stated, the onset of TLE is often associated with prior brain injuries. Conventionally, a latency period of five to ten years without symptoms or complications is seen after the initial insult16. Though, structural and biochemical alterations in the hippocampus occur concurrently. This gradual process of alterations in the brain, which results in onset of spontaneous seizures, is called epileptogenesis. This process possibly leads to
hippocampal sclerosis (HS), which is a recognizable pathology of TLE17. It is characterized by induration and shrinkage of the hippocampus, which is probably caused by neuronal degeneration of pyramidal cells and inhibitory interneurons. HS was revealed by postmortem studies in 50% of TLE patients. Common features of structural changes of TLE are
astrogliosis, neuronal death in CA1 regions, changed granule cell morphology and dispersion, as well as sprouting of mossy fiber axons of the DG granule cells16,17. Aspects of epileptogenesis are illustrated in FIGURE 2.
It is thought that the gate property of the dentate gyrus inhibits the invasion of excessive electrical activity into the hippocampus18. When this fails, the dentate gyrus may further leak
harmful seizure activity into other brain structures via projections. Thus, special attention to the dentate gyrus is required, as failure in its function as gate keeper could possibly cause generation of seizures. The dentate gyrus is involved in three hypotheses on epileptogenesis. All might explain the formation of hyperexcitable, excessive circuits:
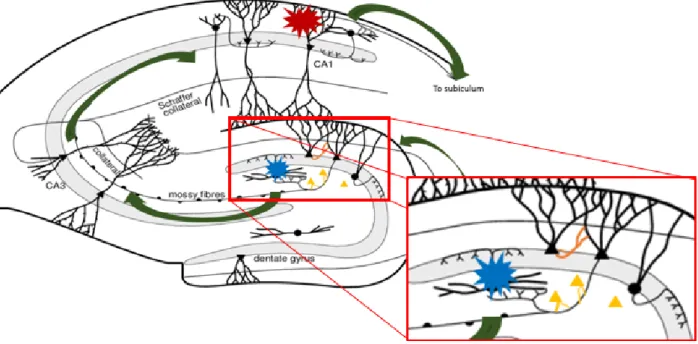
(i) Mossy fiber sprouting is characterized by granule cell axons forming synapses with
other granule cells rather than with pyramidal cells in the CA3 region16–18. This results in formation of new repetitive excitatory circuits. This is illustrated in orange in FIGURE 2. (ii) The dormant basket cell hypothesis claims that inhibitory GABA basket cells in the hilus become latent due to loss of synaptic input16,18. This is on account of damage of the excitatory interneurons in the hilus, which would stimulate these GABA basket cells (illustrated in blue in FIGURE 2). This results in less inhibition in the trisynaptic circuit.
(iii) Lastly, the dentate granule cell dispersion implies formation of new granule cells by neurogenesis. Thus, creating more excitation16. This is illustrated in yellow in FIGURE 2.
Molecular alterations, which are associated with epilepsy cause deregulation of certain receptors, such as glutamate receptors and GABA receptors or ion channels (several chloride channels and Ca2+-sensitive potassium channels). This leads to hyperexcitation of the remaining neurons. Still, there is a lot of debate on whether the granule cells become intrinsically hyperexcitable, as the majority of studies report16. Multiple studies now claim the opposite is true, since transcriptional upregulation of potassium channels and elevated chloride conductance in these neurons have been described17.
The overall result of these features is an imbalance between excitation and inhibition. Caution is advised as most of the knowledge about epileptogenesis is extracted from animal models for TLE. Whether all the mentioned molecular and structural alterations are actual causes of seizure onset is highly debated and counter examples are reported. Thus, no consensus is reached.
FIGURE 2. Schematic representations of the different aspects and hypotheses on epileptogenesis in a mouse model for TLE. The red explosion symbol indicates pyramidal cell loss in the CA1 region. Additionally, excitatory neurons which stimulate the GABAergic interneurons in the dentate gyrus perish. Here, the blue explosion symbol demonstrates the interneurons that become dormant. Next, mossy fiber sprouting is indicated in orange. This theory claims that granule cells form new synapses with other granule cells, forming a hyperexcitable circuit. Lastly, granule dispersion is indicated in yellow: new granule cells are formed, which results in more excitation.
2.1.4.4. Ictogenesis
Ictogenesis describes the processes of seizure generation in the epileptogenic brain19. Once seizures begin, epileptogenic processes may worsen. The progressive nature, including an increase in seizure frequency and in structural damage of TLE has been studied. This means that ictogenesis is a crucial mechanism on which can be acted in epilepsy patients. Two kinds of pathological neuronal events in the epileptic brain are described: the interictal (between seizures) and ictal spikes (during the actual seizure, FIGURE 3). Pyramidal cells, granule cells and interneurons, as well as astrocytes and the extracellular space play a role in ictogenesis19.
Firstly, the interictal spikes can be described as sporadic brief paroxysmal bursts, generated in a hyperexcitable neuronal network20. As a result of the prolonged depolarization state over the cell membrane, referred to as the paroxysmal depolarizing shift (PDS), only a brief stimulation might cause generation of a rapid sequence of action potentials. PDSs may be triggered by activation of the AMPARs on the postsynaptic membrane after binding of the neurotransmitter glutamate (GLU)19,20. The opening of the AMPA voltage-gated ion channel, which enables sodium influx, results in slight depolarization. Next, this causes expulsion of magnesium ions out the NMDAR, providing an opening in the channel. Consequently, the NMDAR can now properly react on GLU binding, resulting in sodium and calcium inflow. This causes the postsynaptic cell to depolarize, resulting in previously mentioned burst firing. In excitatory neurons, excitatory postsynaptic potentials (EPSPs) are generated and by consequence more neurons might be involved.
The increased sodium and calcium conductance might be followed by increase in potassium and chloride conductance and GABAB mediated signaling in excitatory neurons. This results in an after-hyperpolarization of the cell and might terminate the burst firing.
If the interictal spiking is not terminated, but accelerated or reinforced, this might evolve into
ictal discharges19,20. Here, it is assumed that maintained depolarization leads to absence of after-hyperpolarization. Repetitive action potentials are transferred, involving more neurons. This causes an entire neuronal network to synchronously generate burst firing.
Assumingly, the termination could be caused by several factors20. This includes decrease in neurotransmitter release due to depletion of directly available synaptic vesicles, decrease in sodium and calcium influx and increase in potassium efflux. Hence, rendering the membrane potential to hyperpolarization. This is the post-ictal depression.
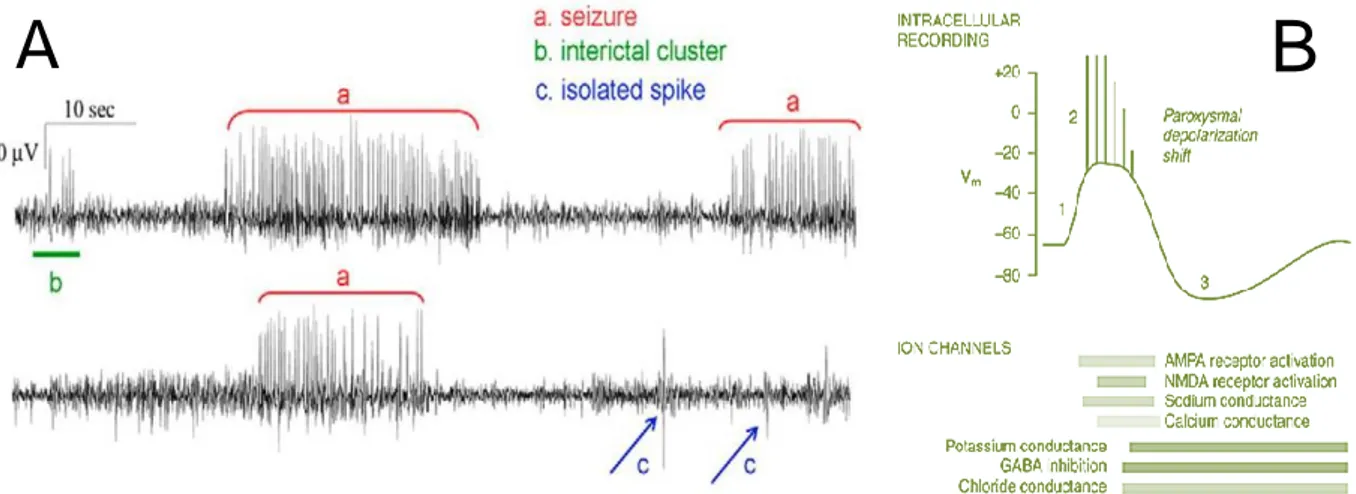
FIGURE 3. (A) Difference between interictal clusters, isolated interictal spikes and ictal seizures in two separate EEG recordings in the IHKA model. As can be appreciated from this figure, ‘a’ demonstrates the appearance of a seizure, ‘b’ are interictal spikes, ‘c’ presents isolated interictal spikes. This figure is adapted from Kubista,H. et al.20. (B) The representation of a
paroxysmal depolarization shift. The paroxysmal depolarization shift is an intracellular recording which is typically seen in epileptic neurons. The bars beneath the paroxysmal depolarization shift represent the durations of active ion channels which aid the shift. It is initiated (‘1’ on scheme) by calcium
mediated depolarization, mediated by AMPA receptor activation. Next, NMDA receptors are activated and sodium channels open. This results in action potentials (‘2’ on scheme). After-hyperpolarization (‘3’ on scheme) after this depolarization is mediated by potassium efflux and GABA-activated chloride influx and indicates the termination of the PDS. The post-ictal depression is clearly seen. This figure is adapted from Riban, V. et al.21.
2.1.4.5. Intrahippocampal kainic acid mouse model
For the purpose of this master thesis, the intrahippocampal kainic acid (IHKA) mouse model is used. As in humans, 30% resistance to traditional epilepsy drugs is seen22. This model mimics
TLE in humans by inducing hippocampal sclerosis. This sclerosis is initiated by injection of a
single low dose of kainic acid (KA), a neurotoxin, into the dorsal hippocampus of adult mice. KA is a potent cyclic analog of L-glutamate and performs as agonist on ionotropic KA receptors (KARs)23. In nature, it originates from red algae, Digenea simplex, which are found in tropical and subtropical waters.
It is assumed that the injected KA binds with high affinity on certain KARs, present in the hippocampus, such as GluK1, GluK2, GluK4 and GluK523. These receptors are extensively expressed in the hippocampus proper, where they are found both presynaptically as well as postsynaptically. GluK1 is expressed in CA1 and CA3 GABAergic interneurons, while GluK2,4 and 5 are expressed in pyramidal cells. The expression pattern, along with the high affinity for KA and high rates of expression could explain the great hippocampal susceptibility to the
excitotoxic damage induced by KA23. Multiple phases after KA injection can be distinguished.
Immediately after kainic acid injection, the animals reach Status Epilepticus (SE)22. Typical presentations during this phase are clonic deviations of the head, rotations, asymmetric moderate chronic movements of the forelimbs and/or immobilization. This is already accompanied by seizure activity on EEG recording.
SE is followed by a two to three week latent period of altered activity of the ipsilateral hippocampus21,22. These changes are reflected in rapidly evolving EEG patterns; sporadic hippocampal discharges have expanded into spikes. Furthermore, hippocampal paroxysmal discharges with increasing duration are formed. This latent phase involves epileptogenesis and ictogenesis. Histological analysis of the injected dorsal hippocampus of the MTLE mouse model shows great resemblance to the human TLE condition. Typically, loss of pyramidal cells as well as GABAergic interneurons cell in the CA1, CA3 and hilus is displayed 21,22. Meanwhile,
the remaining parts of the ipsilateral hippocampus, more specifically the CA2 and granule cells of the dentate gyrus, and contralateral hippocampus appear intact. Moreover, the damage stays limited to the dorsal hippocampus. Additionally, a strong astrogliosis, mossy fiber sprouting and dispersion of granule cells are observed.
The next phase is referred to as the recurrent phase22. At this moment, animals show spontaneous recurrent seizures and have entered the last and chronic phase of epilepsy. Now, hippocampal paroxysmal discharges remain uniform throughout of the animal’s life. However, rather mild behavioral changes, such as immobilization with moderate head nodding, are induced.
2.2. Designer Receptors Exclusively Activated by Designer Drugs
(DREADDs)
Due to the susceptibility of temporal lobe epilepsy patients to drug-resistance and the fact that resective surgery often is undesirably ineffective, a new treatment is needed. Regarding the demand for a potent, very specific targeting treatment for drug-resistant TLE, a new research technique is found in the field of chemogenetics. Here, the use of DREADDs might mean a possible solution to the hypersynchronous neuronal activity in temporal lobe epilepsy.
Chemogenetics are the processes by which new receptors or channels are engineered in
order to selectively interact with a small molecule ligand14. Such engineered molecules comprise kinases, nucleic acid hybrids, various metabolic enzymes and G-protein coupled
receptors (GPCRs). In the latter, the Designer Receptors Exclusively Activated by Designer Drugs (DREADDs) can be categorized. Originally, DREADDs were created from muscarinic acetylcholine receptors (mAchRs). By random mutagenesis, the binding site for
the native ligand, acetylcholine, was converted into a binding site for a distinct assortment of drugs (FIGURE 4). Although many variations are created, mainly two DREADDs are applied in research: the inhibitory human muscarinic 4 Gi-coupled receptor (hM4Di) and the excitatory human muscarinic 3 Gq-coupled receptor (hM3Dq).
2.2.1. Mechanism of hM4Di
In this thesis, the hM4Di DREADD construct is used. As a variant on the human muscarinic receptor, it activates the same pathway after ligand binding. The Gi-mediated signaling is initiated after binding of the ligand14 (FIGURE 4). Additionally, β/γ subunits are detached from Gα/i and activate G protein-coupled inwardly rectifying potassium channels (GIRKs), which in turn leads to hyperpolarization, thus blocking neurotransmitter release and the epileptic seizures. Besides activating GIRKs, adenylyl cyclase (AC) is inhibited and thereby cyclic adenosine monophosphate (cAMP) production and protein kinase A (PKA) activity is decreased24. This would cause a reduction in neurotransmitter release. This new technique might be applied as effective local therapy by specific inhibition of neurons in the seizure focus. Indeed, this method seems effective to silence spontaneous seizures in epileptic mice after administration of the ligand, in our lab25–27. This contradicts with consumption of AEDs which has effects on the entire body. Additionally, use of DREADDs might have a superior effect in cases where AEDs have no effect anymore.
FIGURE 4. Mutagenesis of the hM4R and hM4Di activation. In the left panel, the mutagenesis of the hM4R is shown. This results in specific binding of designer drugs instead of the endogenous ligand (acetylcholine, Ach) on the new hM4Di DREADD. Next, the activation of this DREADD is shown. Firstly, the activated Gβ/γ subunits will detach from Gi and stimulate GIRKs. Then, potassium ions flow in the cell. Secondly, AC is inhibited. This will inhibit cAMP production, which results in decreased PKA activity. Both sections of the pathway result in hyperpolarization of the cell.
2.2.1. Ligands: clozapine and JHU37160
Both clozapine and JHU37160 perform as agonists of the DREADD. After binding, the hM4Di DREADD is activated and induces hyperpolarization in the transduced neurons. This results in seizure prevention. Clozapine has good brain penetrance, high affinity and in vivo DREADD occupancy28. The other ligand, JHU37160, might exhibit even higher in vivo DREADD potency and occupancy29.
2.2.2. Viral construct
A viral vector is applied to carry the genetic material into target cells by infection, then seizes control of the cellular machinery in order to transport its cargo into the cell30. Lastly, the transfected cell will express the inserted genetic material. Several kinds of vectors can be used for expression of proteins, including lentiviruses, retroviruses, adenoviruses and adeno-associated viral vectors (AAVs).
The viral vector used, is a hybrid recombinant AAV (rAAV) with serotypes 2 and 7 and this bears multiple advantages. Firstly, unlike retroviruses, AAVs can transduce non-dividing
cells, such as neurons30. Secondly, rAAV vectors produce episomes, which are extrachromosomal segments of DNA. This results in decrease in risk of insertional mutagenesis. Hence, it is assumed that transgene expression will persist during the entire lifetime of the cell. Importantly, it is known that approximately 0.1% of the rAAV vectors can integrate into a specific location on chromosome 19 in human cell culture30. Thirdly, the rAAV vector is known for absence of significant immune response, which is not the case with adenoviruses. Hereby, this vector is preferred in central nervous system therapies in clinic. Lastly, the rAAV vector is characterized by its specific alterable capsid, resulting in enormous
tropism and hence binding features31.
Other characteristics of the rAAV vectors include an insert size of maximal 4.5 kb. In addition, the rAAV vector particle consists of an icosahedral capsid and contains a single stranded genomic DNA between two non-coding inverted terminal repeats (ITRs) of the original virus31,32. However, the genes for replication, the capsid and assembly of the original virus are eliminated, making the viral vector a safe tool without the ability to infect other cells or replicate itself.
At present, more than 50 clinical candidates exploit rAAV vectors, including Glybera by uniQure (EMA approved) in Lipoprotein lipase deficiency and CERE-120 by Ceregene (Phase IIb) in Idiopathic Parkinson’s disease32.
Cell specific promoters can be used to obtain expression in certain cell types, such as the calcium/calmodulin-dependent kinase II α (CAMKIIα) promoter30. This promoter acts as reliable promoter, designed to target excitatory glutamatergic neurons. Because the viral vector is injected in the hippocampus, the pyramidal cells in CA regions and granule cells in the dentate gyrus are transduced30. The CAMKIIα protein itself is highly expressed in these regions and mediates specific forms of synaptic plasticity and memory consolidation33. This means that cell type specificity is determined by both the CAMKIIα promoter and the rAAV serotype.
A tag or reporter protein is used to visualize the expression pattern of the introduced protein on histology34. Two tags are used in this thesis: the mCherry and the hemagglutinin (HA)
tag. mCherry is a red fluorescent protein and was derived from Discosma sea anemones31. The human influenza hemagglutinin (HA) tag is an epitope of the hemagglutinin of the influenza virus. To conclude, the hM4Di-DREADD is transduced through a rAAV vector, containing the DREADD gene, a CAMKIIα promoter and a mCherry- or HA tag (FIGURE 5).
FIGURE 5. rAAV-hM4Di injection in the hippocampus of an epileptic mouse and activation after intraperitoneal injection of the ligand. On the left, the viral vector construct is presented. It contains a CAMKIIα promoter, the hM4Di DREADD gene and a HA- or mCherry tag. This construct is imported in an rAAV vector, which is injected in the hippocampus of an epileptic mouse. Here, the DREADD will be expressed. The intraperitoneally injected ligand will activate these DREADDs and silence the seizures.
2.2.3. Challenges in current state of research: neurotoxicity
To date, the mCherry tag served as reporter protein in our lab. Although the DREADD-mCherry receptors already proved to potently suppress seizures, the important issue of neurotoxicity was raised. Recently, cell death is detected in the hippocampus of healthy rats after rAAV-hm4Di-mCherry vector injection ([internal communication]). While this has not yet been confirmed in healthy mice, vector injection in chronic epileptic mice resulted in loss of the entire sclerotic hippocampus27. Additionally, literature suggests that this mCherry tag presumably interferes with the transporting mechanism towards the cellular membrane due to its considerable size35. This could cause accumulation of the cytosolic vesicles which carry the DREADDs in the cytosol. The presence of these intracellular vesicles has been confirmed in our DREADD-mCherry expressing mice. This could possibly result in cell death of these neurons; which might explain the found neurotoxicity. Therefore, a new and smaller tag is preferred; the HA tag. While this tag consists of only nine amino acids36, the mCherry tag is composed of 236 amino acid37. In this master’s thesis, the use of both tags in viral vectors is evaluated in terms of neurotoxicity.
2.3. Automatic seizure detection software
In this thesis, a custom-made software program that automatically detects and annotates seizures on EEG signal, is used.
The machine learning technique of deep convolutional neural network (CNN) is implemented in this new tool. This artificial neural network is specialized in screening and
detection of patterns by convolutional layers and non-convolutional layers38. Though, these
convolutional layers form the genuine basis of the network. They receive input and then
transform and transfer this data as output to the next layer. The essence of pattern recognition is the number of filters per convolutional layer. The deeper the network, the more advanced the filters become. These filters are created out of number matrices38. Basically, the software learns the representation of raw data and determines features automatically by exploitation of multiple layers and filters.
A baseline annotation model is made once, and is based on manually annotated EEG data from 11 historical mice which demonstrate clear examples of seizure activity. Due to the variability in seizure presentation between animals, this baseline model is retained per subject. This is done by training and will result in an individual subject model.
Firstly, the baseline annotation model undergoes a training phase. Here, the ability of the software is directed to identify two states: seizure and no seizure in the EEG signals. This is accomplished by introduction of files containing manual annotations. Based on this training phase with example data sets, an animal-specific prediction model is built for further automatic annotation.
Secondly, the model is tested in a testing phase with a test data set. This data set is a reserve subset of the training set, which is not applied during the training phase. Thus, this data is unknown to the subject model. Then, a precision, recall and F1 score for the seizure and non-seizure state are calculated, reflecting the model’s accuracy. (i) The precision or positive predictive value indicates the number of correctly annotated seizures divided by the total number of annotated seizures. The lower this value, the higher the number of false positives. (ii) The recall or sensitivity can be defined as the number of correctly detected seizures divided by the total number of true positive seizures. This reflects the number of genuine seizures that are indeed detected by the software. (iii) The harmonic mean of precision and recall equals the F1 score. It reaches the value of 1 in case of perfect precision and recall. Several variables might improve the basic model. First, the higher the number of training files which are provided, the more accurate the subject model will be. Secondly, the number of retrain epochs has an impact. This is the number of times the machine learning algorithm runs over the entire training data set and slightly adjusts the basic model. Thirdly, the learning rate determines the gravity of model adjustment in every epoch.
Lastly, the phase of model validation/evaluation is initiated. First, the evaluation is performed on the dependent data (training data set) by comparing manually and automatically annotated data. Logically, this is generally adequate. However, this evaluation is still necessary to give a first impression of the model’s fitness. Secondly, the evaluation on independent (unknown to the model) data set(s) is executed likewise. This entire evaluation phase will determine whether the model is fit or should be retrained. The process in modeling phases and evaluation is illustrated in FIGURE 6.
FIGURE 6. Scheme of modeling phases and validation/evaluation. A predictive model is created by training and testing the model with manually annotated data. By assessing the Recall and F1 score, it is decided to evaluate the model or retrain in order to gain better resemblance to manually annotated data. Then, the model is evaluated by comparing the manually annotated data with the automatically annotated data in dependent as well as independent data sets. Hereafter, the model is applied to annotate the remainder of the data or the model is retrained.
2.4. Research questions
1. Comparison in effect between chemogenetics and standard AED treatment
The effect of levetiracetam as standard AED treatment in epileptic animals is examined through comparison with the ligands in DREADD expressing animals. It is expected that the ligands will reduce the seizure rates significantly, while levetiracetam will have a beneficial effect in 50% of the animals for 30 minutes until one hour.
2. Comparison between two DREADD ligands
Clozapine has proven itself a potent agonist to DREADDs. Nevertheless, this substance is clinically used as antipsychotic drug and can cause several adverse effects. This might raise concerns when translating the use of clozapine as a DREADD agonist into clinic. Consequently, another potent agonist, JHU37160 is tested as possible alternative for clozapine. In comparison between both ligands, it is expected that JHU will have a longer effect than clozapine, as it is stated that JHU exhibits high in vivo DREADD potency.
3. The influence of hM4Di-HA vs hM4Di-mCherry viral vector injection on hippocampal damage in IHKA mice.
The hippocampal volume before and after vector injection is compared to assess the extent of neurotoxicity, caused by viral vector injection. It is expected to detect a lower amount of neurotoxicity when applying the HA tag, because it is assumed that a lower number of vesicles in the cytosol are present. Importantly, the viral vectors differ in titers. This might also play a role in toxicity induction.
4. Evaluation of the automatic seizure annotation software
Formerly, the detection and annotation of seizures were manually completed by the researcher. However, to reduce the manual work, promising software was recently developed to automatically annotate epileptic activity. Before routinely operating this software, it should be evaluated and procedures for model evaluation in future application should be set. It is expected that the automatically annotated data will resemble the manual variant. Furthermore, errors in the automatic annotations will be examined more closely with the prospect of improvement for future application.
3. MATERIALS AND METHODS
3.1. Experimental protocol
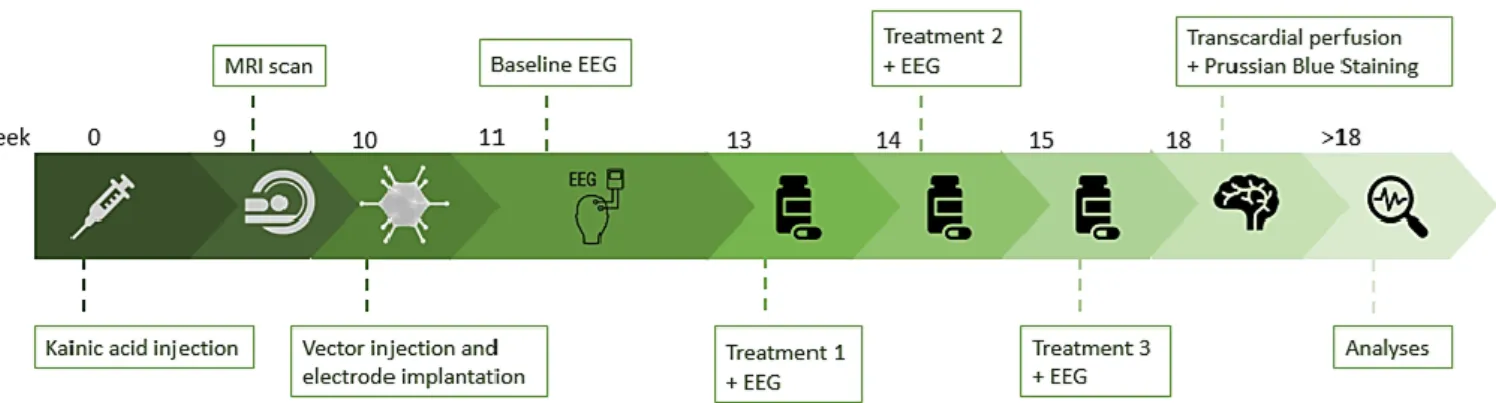
FIGURE 7. Overview of the experiment. First, the IHKA mouse models were established by intrahippocampal kainic acid injection. After at least nine weeks, an MRI scan of the brain was taken in order to have the opportunity to change electrode localization and determine hippocampal volume. Soon after, the mice were injected intrahippocampally with an rAAV vector and EEG electrodes were implanted. One week later, the mice were connected to the EEG set up and baseline electrical activity in the brain was recorded. A cross-over study, starting with treatment 1 was initiated two weeks later. Each group of mice was injected peritoneally with either clozapine or levetiracetam. A wash out period of one week was followed by treatment 2. Here, the groups were injected with the other drug than treatment 1. One week wash out was inserted before initiation of treatment 3, in which all mice were
injected with JHU37160. During each treatment, EEG signals were recorded. At the end of the experiment, the animals were sacrificed by transcardial perfusion and a Prussian Blue Staining was performed at the same time. Lastly, EEG signals and brain tissues were analyzed.
3.2. Animals and groups
In this experiment, 30 male C57BL/6jax mice (Envigo, UK) were used. They had ad libitum access to food and water and a 12h light/dark cycle was applied. Temperature and humidity of the animal room were maintained at 20°C-24°C and 30%-70%, respectively. A radio was playing on the background to habituate the mice to sound. The animal experimental Ethical Committee of Ghent University medical department has approved this research (ECD 16/31). Ultimately, three groups were generated: 1) epileptic mice, injected with AAV2/7-CamKIIα-hM4Di-HA vector, 2) epileptic mice, injected with AAV2/7-CamKIIα-hM4Di-mCherry vector, and lastly, 3) a control group of epileptic mice, injected with control AAV2/7-CamKIIα-empty-mCherry vector. In such manner, two DREADD groups and one (control/sham) non-DREADD group were established. Importantly, the mice were not assigned completely at random to these groups. MRI imaging after kainate injection showed the hippocampal damage. Hereafter, animals were matched based on similar damage levels. It was assured that every group included mice with different degrees of hippocampal damage. The semi-randomization would ensure an equal starting point for all groups after viral vector injection.
3.3. Intrahippocampal kainate injection: generation of the IHKA
model
Before the surgery, all instruments were disinfected in 70% ethanol (Sigma Aldrich, The Netherlands). The syringe was rinsed 10 times with Hamilton cleaning solution (Hamilton Company, USA), followed by 10 times with distilled water and once with ethanol. All mice (n=29, one animal was sacrificed to serve as healthy control in another experiment) were anaesthetized using votile isoflurane (IsoFlo®, Abbott, Belgium; initially 5%) and 8 l/min medical O2, then placed in a stereotactic frame and fixed with ear bars. To ensure a good body temperature, an infrared lamp was placed next to the mouse. Additionally, eye ointment (Duratears, Alcon, Belgium) and a gauze were applied to the eyes for protection from the binocular light. A central incision in the skin was made after shaving and disinfecting (Iso-Betadine®, Abbott, Belgium) the scalp and the underlying skull was dried with cotton swabs, soaked in acetone, to allow visualization of the sutures. After drilling a hole in the skull, kainic acid solution (50 nl, 4 mg/ml) was slowly injected at 100 nl/min into the dorsal hippocampus (coordinates relative to Bregma: AP -2.0 mm; ML +1.5 mm and DV -1.8 mm) with a Hamilton syringe (needle point style 4, sharp, Hamilton Company, USA). Afterwards, it was advised to wait five minutes to avoid reflux of the injected solution. Then the syringe could be removed slowly from the brain. The skin was sewed and disinfected with Neobacitracine gel® (Erfa, Belgium) and a local analgesic (Xylocaïne 2% gel; AstraZeneca, Belgium). The mouse was placed in a fresh cage and its recovery was visually monitored. Post-injection, the animals should become status epilepticus, meaning they would have acute and severe epileptic seizures. Starting from this period, epileptogenesis occurs. Though, this is not always clearly visible, as the animals might still be under the influence of the anesthetic. After two weeks, the seizures should be stabilized and resemble the human chronic TLE39.
3.4. MRI imaging
Nine weeks after kainic acid injection, 23 out of 30 mice had survived and were taken to the MRI to scan their brains. The additional 6 died due to the consequences of the kainic acid injection, which is most likely Status Epilepticus or Sudden Unexpected Death after Epilepsy (SUDEP). Typically, the hippocampus shrinks after kainate injection and this might result in poorly positioning of the electrodes, outside the targeted hippocampus. The images raised the possibility for electrode position adaptation for superior EEG measurements on an individual level. Additionally, the images were stored for later determination of hippocampal volume (before vector injection). Based on visual assessment of the hippocampal damage, the animals
were matched and assigned to different groups, to ensure similar damage due to kainic acid in the HA and mCherry group.
Experiments were performed on a 7 Tesla small animal MRI scanner (70/16 PharmaScan®, Bruker Biospin, GmbH, Germany). The procedure is initiated by anesthetizing the animals with isoflurane (induction: 5% and 1l/min oxygen and maintenance: 1.5–2.0%). The body temperature was kept stable with a heating pad and the respiration rate was monitored by a respiration pressure pad. A T2 scan protocol was initiated. First, a fast three-slice (axial, sagittal and coronal) scout image was obtained to check the location of the mouse brain. Secondly, the MRI scanner browsed over the three mentioned body planes and provides 5 images per plane. This aids to check whether the subject is positioned straightly in the scanner. Still, no detailed imaging was acquired; this was done in the next two set of images. The next image sequence specified 20 sagittal slices, while the last sequence rendered 20 coronal slices. These last images were used to determine hippocampal volume. Image parameters were: matrix size of 147x128 pixels (9,1875 pixels/mm) and slice thickness of 0,6 mm.
3.5. DREADD vector injection
Soon after MRI imaging, surgery was performed to inject the vector in the dorsal hippocampus (n=23). Ten weeks had passed since the kainic acid injection and the animals have reached a chronic state in epilepsy. This procedure was analogous to the kainic acid injection surgery and the same products were applied. Now, the Hamilton syringe is rinsed 5 times with RBS (Sigma-Aldrich, Belgium) before rinsing with cleaning solution, (distilled water and ethanol,) to remove biological residues such as viruses. Instead of kainate solution, a viral vector was injected. 500 nl of three vectors were used in the experiment: AAV2/7-CamKIIα-hM4Di-mCherry (n=10; 2,60*1013 genome copies per ml (gc/ml)) or AAV2/7-CamKIIα-hM4Di-HA (n=11; 2,70*1011 gc/ml) or AAV2/7- CamKIIα-empty-mCherry (n=2; 2,08*1013 gc/ml) (Laboratory for Gene Therapy (KUL)). The vector solution was slowly injected at 100 nl/min into the dorsal hippocampus (coordinates: AP -2.0 mm; ML +1.5 mm and DV -2 mm from bregma). Hereafter, the electrodes were implanted. The skin was stitched around the connector plug and was disinfected with Neobacitracine gel® (Erfa, Belgium) and a local analgesic (Xylocaine 2% gel; AstraZeneca, Belgium). At last, 0.01 ml of a non-steroidal anti-inflammatory drug (NSAID, Metacam, 2 mg/ml, Boehringer Ingelheim, Germany) as well as 0.25ml of an analgesic (Vetergesic multidose®, 0.003 mg/ml, Alstoe Limited, UK) were each dissolved in 0.5 ml saline solution (0.9%) and were administered subcutaneously.
3.6. Electrode recording
3.6.1. EEG electrode fabrication
For EEG electrode recording, two different kinds of electrodes were necessary. Firstly, the
bipolar depth electrodes (Addendum, FIGURE I.A.) were made by twisting two polyimide
coated stainless steel wires (California Fine Wire, USA) around each other. After cutting the formed loop, the twisted ends were pulled apart. In this manner, a distance of 200 µm between these recording tips was set. Then, insulation at the tips at the other end of the wire was removed and a connection pins were attached to the two end tips. These pins were isolated with heat shrinkage tubing. Additionally, the performance of the electrodes was tested with a multimeter. To allow a more practical implantation, the electrode was fixed on a bended metal holder with UV cement (Dental Products, Kemdent, UK). This holder could be fixed in the stereotactic frame and was cut loose during the surgery. Secondly, scalp electrodes (Addendum, FIGURE I.B.) were made of a coated metal wire (RS Components, UK). One end was attached to a connection pin. The other end was soldered to a screw, making implantation in the skull possible. Again, shrinkage tubing was applied around the pin.
3.6.2. Electrode implantation
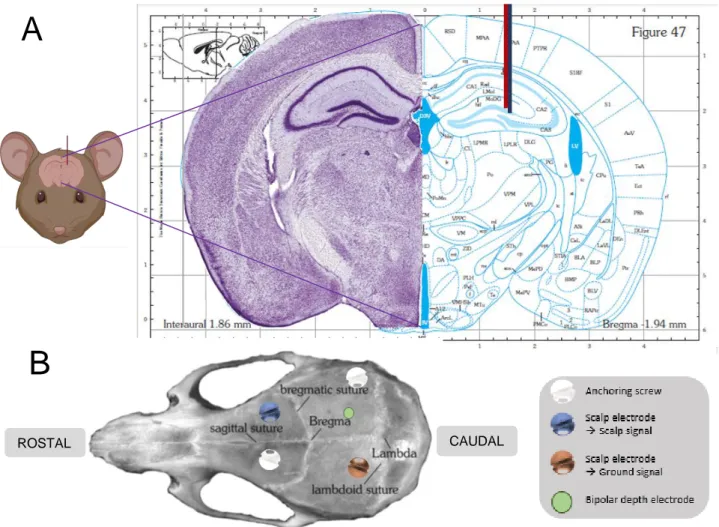
During the same surgery, EEG electrodes were implanted after viral vector injection. A depth electrode (200µm tip separation, coordinates: AP -2.0 mm; ML +1.5 mm and DV -2 mm from
Bregma) and two scalp electrodes were implanted right frontally (scalp signal) and left parietally (ground electrode) (FIGURE 8A and 8B). Then, they were fixed to the skull with UV cement to two anchoring screws. These screws were placed left frontally and right parietally. A connector plug combined the four connection pins of all EEG electrodes. Subsequently, this was glued together on the skull with dental cement (Dental Products, Kemdent, UK). When the cement had hardened, the skin was stitched around the connecter plug.
FIGURE 8. (A) Representation of the depth electrode location in the hippocampus. The bipolar depth electrode is represented by the combination of the blue and red lines. As can be appreciated from the figure, the electrode is implanted in the DG region of the right dorsal hippocampus (AP -2.0 mm; ML +1.5 mm and DV -2 mm from Bregma). Note: here, a figure is presented of a more anterior slice, as a figure of the exact slice cannot be found in the atlas. (B) Schematic overview of electrode localization in the mouse skull. The approximate localization of the bipolar depth electrode, scalp electrode for ground signal, scalp electrode for scalp signal and anchoring screws in the mouse skull are shown. Both figures are adapted from Paxinos and Watson stereotactic atlas for the mouse brain. The mouse cartoon is made with software app Biorender.
3.6.3. EEG setup
The connector plug was connected to a preamplifier, which was attached to one end of a wire. The preamplifier compensates for the difference in resistance between depth and surface electrodes. This wire was then leading to a rotatable swivel that ensured movement possibility of the mouse in the cage. Additionally, the signal underwent a second amplification before digitization data-acquisition card (NI DAQ, National Instruments, USA) and was saved on a hard disk. The EEG signals were visualized by the custom build script Neuron, which is run on MATLAB R2007b.
A
B
This EEG setup allowed measurement of hippocampal activity with a sampling rate of 2 kHz.
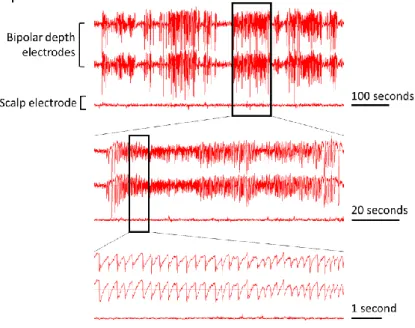
Here, a seizure was defined as regular spike clusters (high-voltage sharp waves or hippocampal paroxysmal discharges) with a frequency of more than 2 Hz and amplitude of at least twice baseline EEG, which lasts at least 7 seconds. Additionally, two seizures must be separated by at least 7 seconds21,39,40. An example of EEG recording of one animal is presented in FIGURE 9.
FIGURE 9. Presentation of hippocampal electrical activity. The first two signal lines correspond to hippocampal EEG signals, which are detected with implanted bipolar depth electrodes. The third signal line records EEG signals originating from the brain surface and is detected with a scalp electrode. Here, one textbook example of an epileptic seizure in a serie of seizures is shown in more detail.
3.7. Treatments: cross-over study
Animals with clear presentation of epileptic seizures on the EEG recording were selected for treatment study (n=10, of which 2 control animals and 8 DREADD-HA expressing animals). Four additional animals died as a consequence of the viral vector injection and electrode implantation surgery. The DREADD-mCherry (n= 8) were excluded from final analysis, since the absence of clear epileptic seizures on the EEG would not allow adequate analysis of the treatment effects. Furthermore, one DREADD-HA expressing animal was excluded, because the seizure rate on baseline EEG was already considerably low and seizures of this animal were atypical for this animal model.
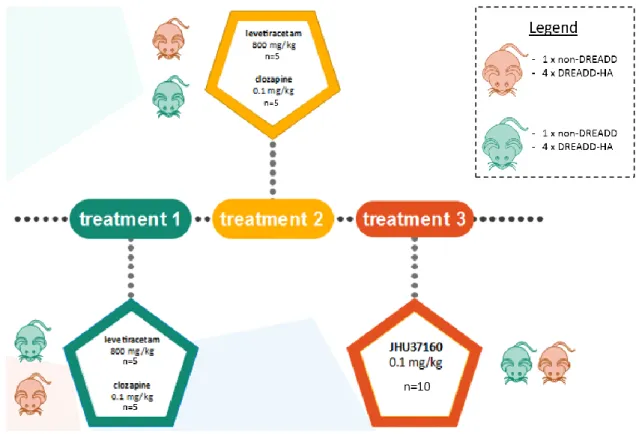
Three treatments were subsequently administered intraperitoneally (i.p.) with a 1 ml syringe (Becton Dickinson, USA): levetiracetam (Acros Organics, Belgium), clozapine (Tocris Bioscience, USA) and JHU37160 (Hello Bio, UK) (FIGURE 10). The injection always took place around 2 pm. In order to inject i.p., the mice were disconnected from the cable and reconnected immediately afterwards. A cross-over study ensured that each animal could be used as its own control. Furthermore, a cross-over study would reduce possible confounding effects between treatment groups and difference in treatment order. Clozapine and JHU37160 are designer drugs which bind the DREADD receptors in the brain. This leads to silencing of the seizures. Here, the effect on epileptic activity was evaluated in seizure rates for 8 hours before treatment (baseline signal) and 24 (levetiracetam) or 56 (clozapine and JHU) hours after treatment.
FIGURE 10. Treatment setup. One treatment was administered every 2 weeks. In the first week, an injection of levetiracetam was administered in one group, clozapine in the other. These subgroups consisted of non-DREADD and DREADD-HA expressing animals. Both subgroups had comparable composition regarding hippocampal damage due to kainic acid injection. Then a wash out week was inserted. In the third week, each group received the other treatment. In the fifth and last week, all mice were injected once with JHU37160.
Treatment 1: clozapine and levetiracetam
Half of the animals were injected i.p. with 0.1 mg/kg clozapine (0.3 ml/animal of a 0.01 mg/ml clozapine solution; n=5). The other half of the animals were injected i.p. with 800 mg/kg levetiracetam (n=5). Here, the animals were partially randomly assigned to one of the two treatment groups. Though, it was ensured every treatment group included about as many animals from each vector group.
Treatment 2: levetiracetam and clozapine
One wash-out week later, the second treatment was administered. The animals that were given clozapine in the first treatment are injected with levetiracetam and vice versa. Hence, the clozapine treatment counts 5 animals whereas the levetiracetam treatment was administered to the other 5 animals.
Treatment 3: JHU37160
Another week after the second treatment, an injection of 0.1 mg/kg JHU was administered in 10 animals (of which 2 control animals and 8 DREADD-HA expressing mice).
3.7.1. Analysis of the treatment effects
The effect of the different treatments is assessed by calculation of seizure rates from manually annotated data. However, in case of the JHU treatment, corrected automatically annotated data was also used. Half of the data was annotated by myself, while the other half was annotated by Jana, my mentor. Only animals with clear seizures were considered for analyses.
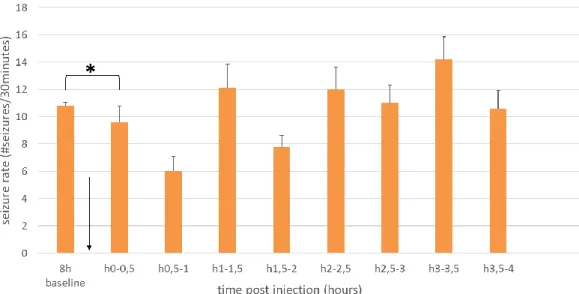
For every treated animal, the seizures were annotated and counted per hour. This was calculated for 8 hours before treatment (baseline) until 24 or 56 hours post-injection. Then, these results were graphed per hour on a timeline. The graph with subject graphs for individual evaluation can be found in the Addendum, FIGURES III-V. For statistical analyses, the means were recalculated for different time lapses per 8 hours. In addition, a subanalysis was done for levetiracetam treatment per half hour after injection: 8 hours of baseline, the first half hour after injection, 0,5 to 1 hour after injection…. and 3,5 to 4 hours after injection.
In addition, the number of responders and their hours of suppression was determined. When an individual shows at least 75% reduction in seizure rate after injection of treatment, the
mouse is identified as responder41. For each animal, the total number of hours of ≥75% reduction in comparison with baseline seizure rate was determined.
3.8. Automatic seizure annotation
For the animals that received treatment and thus displayed clear seizures on EEG (n=11), the subject model was created and evaluated.
The entire manually annotated data set was divided in dependent data and independent data. The former included a training data set and a test data set (usual ratio 43:5). Next, the outcome of the testing phase was given in recall, precision and F1 score. The aim was to obtain the highest recall and F1 score as possible, because not detecting any genuine seizure by the software was valuated worse than presenting false positives. However, the model should not be overfitted by excessive training. Increasing F1 and Recall could be achieved by increasing the number of retrain epochs and learning rate.
After creation, the predictive subject model was evaluated through the comparison of
seizure rates between manually and automatically annotated data. This was done for
dependent as well as independent data sets. If the model was assessed as inaccurate, a new training session was initiated with new data (more data or an entirely new training set). Thus, a difference could be made between data generated by the first training (training 1) and data generated by a possible second training (retraining, training 2).
Lastly, another approach was tested: instead of manually annotating an entire data set, one could correct the automatic annotations. This would reduce workload, because most of the seizures are already annotated by the software. As evaluation, these corrected annotations were then compared with automatic annotations and manual annotations.
After this evaluation, a selection of the accurate subject models was made; for other animals, the model was retrained and evaluated again.
3.9. Histology
3.9.1. Sample preparation
Transcardial perfusion and Prussian Blue staining
Transcardial perfusion was carried out three weeks after termination of the last treatment or at an earlier timepoint if the animal was not needed anymore. Simultaneously with the perfusion, a Prussian Blue staining was performed. This staining would reveal electrode implantation location. The mice (n=23) were anesthetized with 5% Isoflurane and maximal medical O2. Thereafter, the negative pole of the electrical power supply was connected to a stimulator pin to the ground electrode of the connection pin. Similarly, the positive pole was connected to one connection pin of the depth electrode. An anodal power pulse of 9 V was given for 10 seconds. By overstimulation of the electrodes, metallic ions were shattered from the electrodes. Additionally, the mice were administered a lethal intraperitoneal injection (0.1 ml Dolethal,
To summarize: three kinds of annotations were created: 1) the manually annotated data, created by the researcher, 2) automatically annotated data, created by the software, 3) corrected annotated data: corrections made on the automatically annotated data by the researcher.