accordance with the Water Framework Directive
RIVM Letter Report 601714024/2013
J.W. Vonk | C.E. Smit | F.M.W. de Jong
Enviromental risk limits for metazachlor
in water
A proposal for water quality standards in accordance with the Water Framework Directive
RIVM Letter report 601714024/2013 J.W. Vonk | C.E. Smit | F.M.W. de Jong
Colophon
ISBN: © RIVM 2013
Parts of this publication may be reproduced, provided acknowledgement is given to: National Institute for Public Health and the Environment, along with the title and year of publication.
J.W. Vonk C.E. Smit F.M.W. de Jong Contact: Els Smit
Centrum voor Veiligheid van Stoffen en Producten (VSP) els.smit@rivm.nl
This investigation has been performed by order and for the account of Ministry of Infrastructure and the Environment, Sustainability Directorate, within the framework of the project "Chemical aspects of WFD and RPS".
Rapport in het kort
Milieurisicogrenzen voor metazachloor in water
Een voorstel voor waterkwaliteitsnormen volgens de Kaderrichtlijn Water
Het RIVM heeft in opdracht van het ministerie van Infrastructuur en Milieu (I&M) de milieurisicogrenzen voor metazachloor in water aangepast. Metazachloor is een onkruidbestrijdingsmiddel. De stof is opgenomen in de Regeling Monitoring Kaderrichtlijn Water (KRW), waarin staat aan welke eisen oppervlaktewater in Nederland moet voldoen. Nieuwe waterkwaliteitsnormen zijn nodig omdat de huidige norm voor metazachloor niet is afgeleid volgens de meest recente methodiek. Het ministerie stelt deze nieuwe normen vast op basis van de wetenschappelijke advieswaarden van het RIVM.
Twee waterkwaliteitsnormen
De Kaderrichtlijn Water hanteert twee typen waterkwaliteitsnormen: de Jaargemiddelde Milieukwaliteitsnorm (JG-MKN) en de Maximaal Aanvaardbare Concentratie (MAC-MKN). De JG-MKN is de concentratie in water waarbij geen schadelijke effecten te verwachten zijn nadat waterorganismen en mensen er langdurig aan zijn blootgesteld. De MAC-MKN is de norm die het ecosysteem beschermt tegen kortdurende concentratiepieken. Het gemiddelde van de gemeten concentraties over een jaar moet lager zijn dan de JG-MKN. Individuele meetwaarden kunnen hoger zijn dan het jaargemiddelde, maar de hoogst gemeten concentratie mag niet boven de MAC-MKN uitkomen.
Voor de JG-MKN zijn twee ‘routes’ onderzocht: directe effecten op
waterorganismen en indirecte effecten op mensen via het eten van vis. Dit levert twee veilige concentraties op; de laagste bepaalt de voorgestelde JG-MKN (0,08 microgram per liter). Het voorstel voor de MAC-MKN is 0,48 microgram per liter. Op basis van meetgegevens over de afgelopen jaren wordt verwacht dat de voorgestelde normen op een aantal locaties worden overschreden. Als dit inderdaad zo blijkt te zijn, zal dit worden meegewogen bij de toekomstige beoordeling van deze stof als gewasbeschermingsmiddel.
Trefwoorden:
Abstract
Environmental risk limits for metazachlor in water
A proposal for water quality standards in accordance with the Water Framework Directive
RIVM has revised the environmental risk limits (ERLs) for metazachlor in water by order of the Ministry of Infrastructure and the Environment. Metazachlor is used as a herbicide. The compound is included in the Dutch decree on water quality objectives in the context of the Water Framework Directive (WFD). The current standard for metazachlor has to be updated according to the new WFD-methodology. The ERLs in this report are advisory values that serve as a scientific background for the ministry, which is responsible for setting those standards.
Two types of quality standards
There are two types of water quality standards under the WFD: the Annual Average Environmental Quality Standard (AA-EQS) and the Maximum
Acceptable Concentration EQS (MAC-EQS). The AA-EQS is the concentration in water at which no harmful effects are to be expected for ecosystem and human health after long-term exposure. The MAC-EQS protects the ecosystem against short-term concentration peaks. The average measured concentration over a year should not exceed the AA-EQS. Individual monitoring data may be higher than the annual average, but concentrations should not exceed the MAC-EQS. In the Dutch derivation procedure, the risk limits corresponding to AA- and MAC-EQS are denoted as Maximum Permissible Concentration (MPC) and Maximum Acceptable Concentration (MACeco), respectively.
Two routes were considered for derivation of the MPC: direct ecotoxicity and consumption of fish by humans. Direct ecotoxicity is the most critical of these two routes and determines the proposed MPC (0.08 microgram per litre). The proposed MAC is 0.48 microgram per litre. Monitoring data from recent years indicate that these levels will probably be exceeded at several locations. If this is indeed the case, this will be taken into account in the future authorisation procedure for the use of this compound as plant protection product.
Key words:
Contents
Summary 9
1
Introduction 11
1.1
Project framework 11
1.2
Current standards for metazachlor 12
1.3
Methodology 12
1.4
Status of the results 13
2
Information on the substance 15
2.1
Identity 15
2.2
Physico-chemical properties 15
2.3
Fate and behaviour 16
2.4
Bioconcentration and biomagnification 16
3
Human toxicology and ecotoxicological effect data 17
3.1
Human toxicological threshold limits and carcinogenicity 17
3.2
Ecotoxicological effect data 17
4
Derivation of ERLs for water 21
4.1
Treatment of data for freshwater and marine species 21
4.2
MPCfw and MPCsw 21
4.3
MPCdw, hh – surface water for abstraction of drinking water 25
4.4
MACfw, eco and MACsw, eco 25
4.5
NCfw and NCsw 28
4.6
SRCfw, eco and SRCsw, eco 28
5
Conclusions 29
References 31
List of abbreviations 35
Annex 1
Detailed ecotoxicity data 37
Annex 2
Field studies 49
Summary
In this report, RIVM presents environmental risk limits (ERL) for metazachlor in water. Metazachlor is used as a broad spectrum herbicide. The compound is listed as a specific pollutant in the context of the Water Framework Directive (WFD). The current water quality standard for chronic exposure is 34 µg/L. This value dates back to 1997. A maximum acceptable level for peak exposure, which is also required according to the WFD, is not available.
Based on the data from the national and European authorisation dossiers and additional information obtained from the open literature, environmental risk limits for metazachlor in water have been derived that can be used to set updated water quality standards. The methods used are in accordance with the methodology of the WFD and national frameworks for risk limit derivation. Five types of ERL are considered, each representing a different protection aim.
The Maximum Permissible Concentration in water (MPC). The MPC represents the concentration that protects man and environment from adverse effects due to chronic exposure. According to the
WFD-methodology, three routes have been taken into account for derivation of the MPC: direct exposure of aquatic organisms, secondary poisoning of predatory birds and mammals, and exposure of humans via fish consumption.
The Maximum Acceptable Concentration for aquatic ecosystems (MACeco). The MACeco is the concentration that protects aquatic
ecosystems from adverse effects of short-term concentration peaks. The MPC and MACeco are equivalent to the long-term and short-term water quality standards that are indicated as AA-EQS and MAC-EQS in the WFD-guidance. They are derived for both the freshwater and saltwater compartment.
The Negligible Concentration in water (NC). The NC is calculated by applying an additional factor of 100 to the MPC. The NC represents the concentration at which effects to ecosystems are expected to be
negligible and functional properties of ecosystems are fully safeguarded. In the Dutch policy on substances, the NC is used to define a safety margin that takes combination toxicity into account.
The Serious Risk Concentration for ecosystems (SRCeco). This is the concentration at which serious ecotoxicological risks might occur in aquatic ecosystems.
The Maximum Permissible Concentration in water for drinking water abstraction (MPCdw, hh). The MPCdw, hh represents the concentration at which surface water can be used for production of drinking water without further treatment.
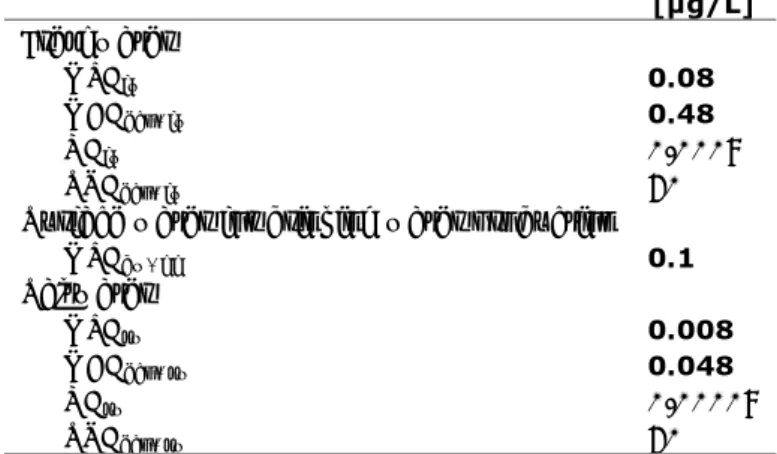
Where applicable, ERLs are derived for freshwater and saltwater. An overview of the newly derived ERLs is presented in Table 1. ERLs that are equivalent to water quality standards required under the WFD are indicated in bold. Monitoring data from 2006 to 2010 indicate that these levels will probably be exceeded at several locations. Saltwater monitoring data are not available.
Table 1 Environmental risk limits for metazachlor in water
Environmental risk limit Value [µg/L] Freshwater MPCfw 0.08 MACeco, fw 0.48 NCfw 0.0008 SRCeco, fw 60
Surface water for drinking water production
MPCdw, hh 0.1 Saltwater MPCsw 0.008 MACeco, sw 0.048 NCsw 0.00008 SRCeco, sw 60
1
Introduction
1.1 Project framework
In this report, environmental risk limits (ERLs) for surface water are derived for metazachlor. Metazachlor is a herbicide that is considered as a specific pollutant for the Netherlands in the context of the Water Framework Directive (WFD). The compound is listed in the Dutch decree on WFD-monitoring (Regeling monitoring Kaderrichtlijn water). The aim of this report is to present updated risk limits that can be used to set water quality standards in accordance with the WFD. The derivation of the ERLs is performed in the context of the project Chemical aspects of the Water Framework Directive. The following ERLs are considered: - Maximum Permissible Concentration (MPC) – defined in VROM (1999,
2004) as the standard based on scientific data which indicates the concentration in an environmental compartment for which:
1 no effect to be rated as negative is to be expected for ecosystems;
2a no effect to be rated as negative is to be expected for humans (for non-carcinogenic substances);
2b for humans no more than a probability of 10-6 per year of death can be calculated (for carcinogenic substances). Within the scope of the Water Framework Directive (WFD), a probability of 10-6 on a life-time basis is used.
The MPC for water should not result in risks due to secondary poisoning and/or risks for human health aspects. These aspects are therefore also addressed in the MPC derivation. Separate MPC-values are derived for the freshwater and saltwater environment.
- Negligible Concentration (NC) – the concentration in fresh- and saltwater at which effects to ecosystems are expected to be negligible and functional properties of ecosystems are safeguarded fully. It defines a safety margin which should exclude combination toxicity. The NC is derived by dividing the MPC by a factor of 100.
- Maximum Acceptable Concentration (MACeco) for aquatic ecosystems – the concentration protecting aquatic ecosystems from effects due to short-term exposure or concentration peaks. The MACeco is derived for freshwater and saltwater ecosystems.
- Serious Risk Concentration for ecosystems (SRCeco) – the concentration in water at which possibly serious ecotoxicological effects are to be expected. The SRCeco is valid for the freshwater and saltwater compartment.
- Maximum Permissible Concentration for surface water that is used for drinking water abstraction (MPCdw, hh). This is the concentration in surface water that meets the requirements for use of surface water for drinking water production. The MPCdw, hh specifically refers to locations that are used for drinking water abstraction.
The quality standards in the context of the WFD refer to the absence of any impact on community structure of aquatic ecosystems. Hence, not the potential to recover after transient exposure, but long-term undisturbed function is the
protection objective under the WFD. Recovery in a test situation, after a limited exposure time, is therefore not included in the derivation of the MPC and MAC.
1.2 Current standards for metazachlor
The current MPCwater for metazachlor is 34 µg/L. The scientific background of this value dates back to 1997 (Crommentuijn et al., 1997), when the
WFD-methodology was not yet adopted.
1.3 Methodology
The methodology is in accordance with the European guidance document for derivation of environmental quality standards under the WFD (EC, 2011). This document is further referred to as the WFD-guidance. Additional guidance for derivation of ERLs that are specific for the Netherlands, such as the NC and SRC, can be found in Van Vlaardingen and Verbruggen (2007). This guidance
document was prepared for derivation of ERLs in the context of the project “International and national environmental quality standards for substances in the Netherlands (INS)”, and is further referred to as the INS-guidance. Similar to the WFD-guidance, the INS-guidance is based on the Technical Guidance Document (TGD), issued by the European Commission and developed in support of the risk assessment of new notified chemical substances, existing substances and biocides (EC, 2003) and on the Manual for the derivation of Environmental Quality Standards in accordance with the Water Framework Directive (Lepper, 2005). The WFD-guidance also takes into account the most recent guidance developed under REACH (ECHA, 2008).
It should be noted that the recent WFD-guidance deviates from the
INS-guidance for some aspects. This specifically applies to the treatment of data for freshwater and marine species (see section 4.1) and the derivation of the MAC (see section 4.4). This also holds for the MPC for surface waters intended for the abstraction of drinking water (MPCdw, hh, see section 4.3). In the INS-guidance, this is one of the MPCs from which the lowest value should be selected as the general MPCwater (see section 3.1.6 and 3.1.7 of the INS-Guidance). According to the new guidance, the MPCdw, hh is not taken into account for the derivation of the general MPCwater, but specifically refers to locations that are used for drinking water abstraction. In addition, the terminology that is used in the present report is harmonised as much as possible with WFD-guidance.
1.3.1 Data sources
The derivation of the ERLs for metazachlor is based on the data available in the EU-dossier. Data from the Draft Assessment Report (DAR; EC, 2005) were re-assessed for their reliability in view of the specific use for ERL derivation. In addition, an on-line literature search was performed via SCOPUS, available via http://www.scopus.com/. For information on coverage, see
http://info.scopus.com/detail/what/. For search profile see Annex 3. This search did result in some additional references from which an endpoint could be
derived. The registrants for metazachlor-based plant protection products in the Netherlands gave permission to consult the dossiers available at the Dutch authorisation board (Ctgb) and relevant studies were included in this report.
and 2.3.2 of the INS-Guidance and in the Annex to the draft EQS-guidance under the WFD. In short, the following reliability indices were assigned, based on Klimisch et al. (1997):
Ri 1: Reliable without restriction
’Studies or data … generated according to generally valid and/or internationally accepted testing guidelines (preferably performed according to GLP) or in which the test parameters documented are based on a specific (national) testing guideline … or in which all parameters described are closely related/comparable to a guideline method.’
Ri 2: Reliable with restrictions
’Studies or data … (mostly not performed according to GLP), in which the test parameters documented do not totally comply with the specific testing guideline, but are sufficient to accept the data or in which investigations are described which cannot be subsumed under a testing guideline, but which are nevertheless well documented and scientifically acceptable.’
Ri 3: Not reliable
’Studies or data … in which there are interferences between the measuring system and the test substance or in which organisms/test systems were used which are not relevant in relation to the exposure (e.g., unphysiologic pathways of application) or which were carried out or generated according to a method which is not acceptable, the documentation of which is not sufficient for an assessment and which is not convincing for an expert judgment.’
Ri 4: Not assignable
’Studies or data … which do not give sufficient experimental details and which are only listed in short abstracts or secondary literature (books, reviews, etc.).’ Citations
In case of (self-)citations, the original (or first cited) value is considered for further assessment, and an asterisk is added to the Ri of the endpoint that is cited.
All available studies are summarised in data-tables, that are included as Annexes to this report. These tables contain information on species
characteristics, test conditions and endpoints. Explanatory notes are included with respect to the assignment of the reliability indices.
1.4 Status of the results
The results presented in this report have been discussed by the members of the scientific advisory group for standard setting in the Netherlands (WK-INS). It should be noted that the ERLs in this report are scientifically derived values, based on (eco)toxicological, fate and physico-chemical data. They serve as advisory values for the Dutch Ministry of Infrastructure and Environment, that is responsible for setting Environmental Quality Standards (EQSs). ERLs should thus be considered as advisory values that do not have an official status.
2
Information on the substance
2.1 Identity
Metazachlor is a herbicide. The compound is approved for use in the European Union under Regulation (EC) No 1107/2009 (repealing Directive 91/414/EEC). Products based on metazachlor are authorised in 25 Member States, including the Netherlands (EU Pesticides Database, accessed November 2012).
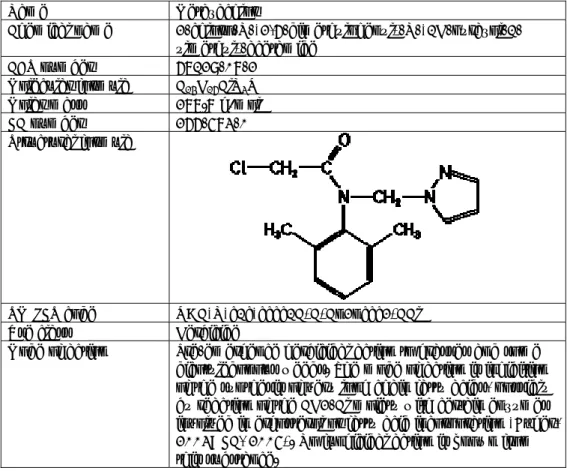
Table 2 Substance identification
Name Metazachlor
Chemical name 2-chloro-N-(2,6-dimethylphenyl)-N-(1H-pyrazol-1-ylmethyl)-acetamide
CAS number 67129-08-2 Molecular formula C14H16ClN3O Molar mass 277.8 g/mol EC number 266-583-0 Structural formula
SMILES code O=C(N(c1c(cccc1C)C)Cn2nccc2)CCl
Use class Herbicide
Mode of action Pre-emergence herbicidal action to grasses and some dicotyledonous weeds. The mode of action is inhibition of the synthesis of very long chain fatty acids, possibly by reaction of the CH2-Cl moiety with certain enzymes involved in ergosterol or fatty acid incorporation (Böger, 2003; EC, 2005). No fungicidal action is known from this substance.
2.2 Physico-chemical properties
Table 3 Physico-chemical properties
Parameter Unit Value Remark Reference Water solubility [mg/L] 630 pH 7, 25 °C EC, 2005
pKa - No dissociation in
water
EC, 2005 log Kow 2.5 pH 7, 21-22 °C EC, 2005 Vapour pressure [Pa] 9 × 10⁻⁵ 20 °C EC, 2005 Henry’s law
constant
[Pa.m3/mol] 5.9 x 10⁻⁵ 20 °C EC, 2005 Melting point [°C] 78-81 EC, 2005
2.3 Fate and behaviour
Selected environmental properties of metazachlor are given in Table 4. Table 4 Selected environmental properties of metazachlor
Parameter Name/Unit Value Remark Reference log Koc log [L/kg] 2.04 Median of 25 values EC, 2005 Hydrolysis
half-life
DT50 [d] - Stable at pH 4 – 9 , 20-25 °C EC, 2005 Photolysis half-life DT50 [d] - Stable to direct aqueous
photolysis
EC, 2005 Biodegradation in
water/sediment systems
DT50 [d] 19.3 Whole system; geometric mean of 4 systems
EC, 2005
2.4 Bioconcentration and biomagnification
There are no experimental data available for bioconcentration in fish. Since the trigger for the log Kow is not exceeded (log Kow < 3), there is no need to derive an MPC for secondary poisoning. Using the log Kow, the BCF for fish was calculated to be 26.6 L/kg according to EC (2011) and Van Vlaardingen and Verbruggen (2007).
3
Human toxicology and ecotoxicological effect data
3.1 Human toxicological threshold limits and carcinogenicity
The proposed harmonised classification of metazachlor under CLP Regulation 1272/2008/EC (Committee for Risk Assessment, 2011) is as follows: H317 (Skin sensitation category 1), H351 (carcinogenic category 2). This is equivalent to R43 and R40, respectively, under Directive 67/548/EEC. According to the triggers as given in WFD-Guidance, the MPCwater, hh food for human exposure via fish should be derived. The ADI is 0.08 mg/kg bw/d, based on the NOAEL of 8.5 mg/kg bw/d from a chronic study with rat and an assessment factor of 100 (List of Endpoints of the DAR; EC, 2005). There are no indications that metazachlor has a potential for endocrine disruption (KEMI, 2008; Spruijt et al., 2008).
3.2 Ecotoxicological effect data
3.2.1 Laboratory data
Detailed aquatic toxicity data for metazachlor are tabulated in Annex 1. Unbound values are not used in ERL derivation, unless they indicate that the derived value is not protective and consequently the assessment factor should be adapted. The selected valid acute and chronic ecotoxicity data for freshwater organisms are summarised in Tables 5 and 6. No data for marine species are available.
For cyanobacteria and algae, endpoints based on growth rate are preferred over biomass, in accordance with OECD 201 (OECD, 2006a). The selection of the endpoint for Lemna sp. is briefly explained here. For Lemna, the relevant
endpoints according to OECD 221 (OECD, 2006b) are growth rate or yield, which can be based on frond number, frond area, dry weight or wet weight. However, it is explicitly stated in the guideline that similar to algae, growth rate is
preferred over yield from a scientific point of view. Recommended test duration is 7 days, but older tests have been performed with a test duration of 14 days. Therefore, for the aggregated data table, the geometric mean of growth rate values, based on the same parameter (frond number, area or weight) was calculated from the 7-days tests, and the lowest of these was chosen. Details can be found in the aggregated data tables. However, if for a species only a single endpoint is reported, this is used if no other preferred endpoints are available for that particular species. For sediment-rooted macrophytes, the AMRAP workshop recommended to use biomass and growth as regulatory endpoints (Maltby et al., 2010). In the DAR, a study with several macrophyte species is included, and for each of these the lowest relevant endpoint was included in the toxicity tables in Annex 1.
3.2.2 Field data
In Annex 2 field studies are described and a conclusion is drawn on the usability of the studies for ERL derivation. From the results it is concluded that 2 µg/L can be used as the NOEC from the field studies. The lowest laboratory NOEC was generated for L. gibba. Following the recommendations of Brock et al. (2011), the test duration of 7 days is used to calculate the time weighted average exposure concentration in the mesocosm study. Given the DT50 of 33 d from the relevant field study, the NOEC expressed as Time Weighted Average concentration (TWA) is rounded to 1.9 µg/L.
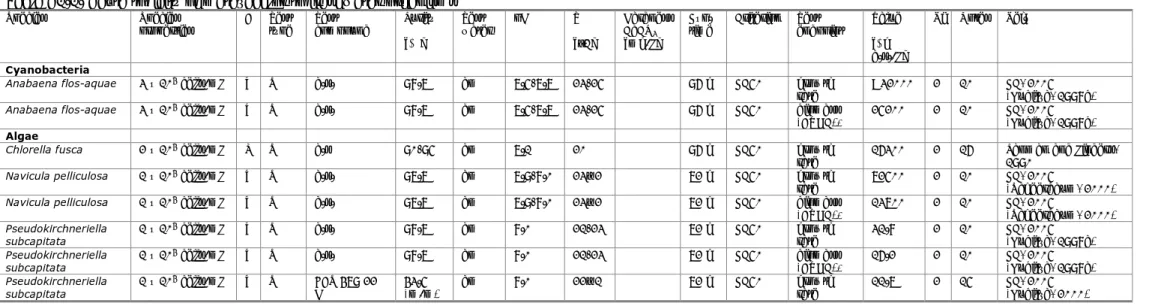
Table 5 Selected acute ecotoxicity data of metazachlor for freshwater organisms. The lowest available endpoint is indicated in bold.
Endpoints L(E)C50 [μg/L]
Remark
Cyanobacteriaa
Anabaena flos-aquae > 32000 Growth rate
Algaea
Chlorella fusca 1630 Growth rate
Navicula pelliculosad 72500 Growth rate
Pseudokirchneriella subcapitata 19.3 Geometric mean of 31.8 and 11.7 μg/L (preferred endpoint growth rate)
Scenedesmus subspicatus 39.4 Geometric mean of 50 and 31 μg/L (preferred endpoint growth rate)
Macrophyta
Callitriche palustris 24 Wet weight
Ceratophyllum demersum 24 Length
Elodea canadensis 73 Wet weight
Lemna gibba 11.3 Geometric mean of 10.7, 7.1, 14.3 and 14.9 μg/L; growth rate based on frond numbers, exposure 7 db.
Lemna minor 2.9 Lowest relevant endpoint; growth rate based on frond areac.
Lemna paucicostata 106 Frond area
Myriophyllum heterophyllum 80 Length
Potamogeton natans > 200 Wet weight
Stratiotes aloides 49 Wet weight
Crustacea
Daphnia magna 29369 Geometric mean of 33700, 33000, 30000 and 22300 μg/L (immobilisation)
Pisces
Cyprinus carpio 13447 Geometric mean of 12300 and 14700 µg/L (mortality)
Lepomis macrochirus 10900 Mortality
Lepomis gibbosus 6800 Mortality
Oncorhynchus mykiss 5988 Geometric mean of 8500, 8900, 4900, 4420 and 4700 µg/L (mortality) a: For studies with cyanobacteria and algae, endpoints based on growth rate are preferred over endpoints based on biomass. b: This value is lower than the 7-days EC50 for growth rate based on dry weight (37.6 μg/L).
c: This value is lower than the geometric mean EC50 for growth rate based on frond numbers of 7.3 μg/L (individual values 3.8 and 14 μg/L). d: See comment on taxonomic position of diatoms in section 4.2.1.2
Anabaena flos-aquae 13900 Growth rate
Algae and diatomeaea
Chlorella fusca 340 Growth rate
Navicula pelliculosad 3200 Growth rate
Pseudokirchneriella subcapitata 5.7 Geometric mean of 6.1 and 5.4 μg/L; preferred endpoint growth rate
Scenedesmus subspicatus 5.2 Geometric mean of 1.8 and 15 μg/L; preferred endpoint growth rate
Macrophyta
Callitriche palustris 5 Wet weight
Ceratophyllum demersum 10 Wet weight, length
Elodea canadensis 31.5 Wet weight, length
Lemna gibba 0.245 Lowest relevant endpoint, growth rate based on dry weight, exposure 7 db
Lemna minor 0.8 Lowest relevant endpoint, growth rate based on frond areac
Myriophyllum heterophyllum 20 Wet weight
Potamogeton natans ≥ 200 Wet weight
Stratiotes aloides 5 Wet weight
Crustacea
Daphnia magna 2396 Geometric mean of 6250, 100 and 22000 μg/L; endpoint reproduction
Insecta
Chironomus riparius 5700 Emergence
Pisces
Oncorhynchus mykiss 2318 Geometric mean of 2500 and 2150 μg/L; endpoint growth
a: For studies with cyanobacteria and algae, endpoints based on growth rate are preferred over endpoints based on biomass.
b: This value is lower than the geometric mean NOEC/EC10-value for growth rate based on frond numbers of 0.57 μg/L (individual data 0.6, 0.36, 2.48, 1.93 μg/L), the NOEC for yield based on frond numbers of 2.48 μg/L and the NOEC for yield based on dry weight of 0.772 μg/L.
c: This value is lower than the geometric mean NOEC/EC10-value for growth rate based on frond numbers of 0.92 μg/L (individual data 0.6 and 1.4 μg/L). d: See comment on taxonomic position of diatoms in section 4.2.1.2
4
Derivation of ERLs for water
4.1 Treatment of data for freshwater and marine species
The dataset for fresh water species is used for risk limit derivation of marine species, since no marine dataset is available for metazachlor.
4.2 MPCfw and MPCsw
4.2.1 MPCfw, eco– ecotoxicity data
NOECs are available for 15 species from six taxonomic groups covering at least three trophic levels1. In addition, an unbound value is available for the
macrophyte Potamogeton natans. Although the NOECs for fish are derived from a 28 days test and not from an ELS- or FLC test, the base set is considered complete, because metazachlor is a herbicide primarily acting on algae and plants. The variation in sensitivity between individual macrophyte species is quite large and hard to explain. Both monocots (Elodea canadensis, Lemna sp., Potamogeton natans, Stratoides aloides) and dicots (Callitriche palustris, Ceratophyllum demersum, Myriophyllum heterophyllum) include sensitive as well as insensitive species. A possible factor might be whether or not a species is sediment-rooting and was tested as such in the ecotoxicity tests. There seems to be a tendency towards lower toxicity (higher effect values) for species that were tested as potted plants (E. canadensis, P. natans and M. heterophyllum). This cannot be explained by dissipation of the compounds from the test system, since (no) effect values are based on concentrations in the water phase.
Metazachlor affects plant growth by inhibiting the synthesis of very long chain fatty acids (VLCFA), thereby disturbing cell metabolism and division (Böger, 2003; Couderchet et al., 1996; Mohr et al., 2007; Schmalfuss et al., 1998). VLCFA are precursors of epicuticular waxes in the epidermis cells of plants and components of cell and plasma membranes. According to Mohr et al. (2007) both monocots and dicots generally have high amounts of VLCFA, but still it could be possible that differences in sensitivity relate to species-specific differences in the presence of VLCFA. It is also possible that the normal growth rate of plants plays a role, i.e. that there is a difference in sensitivity between slowly growing plants and plants that grow relatively fast.
4.2.1.1 Assessment factor approach
The MPCeco, water is derived in the first instance by putting an assessment factor of 10 to the lowest NOEC of 0.245 μg/L for the aquatic macrophyte L. gibba, resulting in an MPCfw, eco of 0.02 µg/L.
4.2.1.2 SSD approach
The dataset does not fully meet the criteria for construction of a Species Sensitivity Distribution (SSD) as listed in the WFD-guidance. According to the guidance, the output from an SSD-based quality standard is considered reliable if the database contains preferably more than 15, but at least 10 datapoints, from different species covering at least eight taxonomic groups. Below, the
1 For a decision on the height of the assessment factor, the WFD-guidance often refers to the number of trophic
levels represented in the dataset. Especially for compounds with a specific mode of action, the use of this term may be complicating because species belonging to the same trophic level may differ greatly in sensitivity because of their different taxonomic position (e.g. crustaceans and insects in case of certain insecticides). When deciding on the AF, the question whether or not the potentially most sensitive taxonomic group is represented in the dataset is more relevant than the trophic level.
criteria are copied, together with the representative species from the present dataset:
Fish (species frequently tested include salmonids, minnows, bluegill sunfish, channel catfish, etc.): Oncorhynchus mykiss, family Salmonidae
A second family in the phylum Chordata (e.g. fish, amphibian, etc.): no data A crustacean (e.g. cladoceran, copepod, ostracod, isopod, amphipod,
crayfish etc.): Daphnia magna
An insect (e.g. mayfly, dragonfly, damselfly, stonefly, caddisfly, mosquito, midge, etc.): Chironomus riparius
A family in a phylum other than Arthropoda or Chordata (e.g. Rotifera, Annelida, Mollusca, etc.): Anabaena flos-aquae, phylum Cyanophycota, family Nostocaceae
A family in any order of insect or any phylum not already represented: no data
Algae: Scenedesmus subspicatus Higher plants: Lemna gibba
From this list it can be seen that data are missing for two of the required taxa. However, in view of the fact that metazachlor is a herbicide and non-target taxa are clearly not sensitive, derivation of ERLs by means of Species Sensitivity Distributions (SSDs) is considered justified. First, the HC5 value is estimated using ETX 2.0 (Van Vlaardingen et al., 2004) with all NOEC/EC10 data. The result is presented in Figure 1. The goodness-of-fit is accepted at all levels, except for 0.1 (Anderson-Darling test).
The HC5 is 0.16 μg/L, with upper and lower limit of 0.007 and 1.2 μg/L, respectively. Applying the default safety factor of 5, the resulting MPCfw, eco would be 0.032 μg/L.
As can be seen from Figure 1, the SSD shows a separation between the algae and macrophytes at one side and the less sensitive groups at the other side. The diatom Navicula pelliculosa is clearly insensitive. In the INS-guidance, algae and diatoms are considered as belonging to the same taxonomic group. However, recent information from taxonomic databases shows that this is not the case (ITIS, 2012; AlgaeBase, 2012), and this might be the reason that N. pelliculosa is at the upper end of the distribution.
Because metazachlor is a herbicide, and 10 NOEC/EC10 values are available for the potentially sensitive species groups of algae and macrophytes, an SSD was also performed using the data for these species (Fig. 2). N. pelliculosa is not included in view of the above.
The goodness-of-fit is accepted at all levels. The HC5 is 0.25 μg/L, with lower and upper level of 0.02 and 0.95 μg/L, respectively. The HC5 is equal to the lowest NOEC of 0.245 µg/L for L. gibba. Applying the standard maximum assessment factor of 5 would result in an MPCfw, eco of 0.05 µg/L. Brock et al. (2011) suggest that the default assessment factor of 5 may be lowered to 3 when the chronic SSD is generated using NOEC/EC10 values for the sensitive species. This would result in an MPCfw, eco of 0.08 µg/L.
The original dataset does not meet the criteria that are set in the WFD-guidance, and with 10 values, the number of data used for the specific SSD is at the minimum of what is considered reliable. It is also not clear whether the tested species cover the range of sensitive species related to the mode of action. This might be a reason for not lowering the default assessment factor. However, according to the WFD-guidance (EC, 2011), a comparison with mesocosm studies can also be used to decide on the assessment factor and in this case the results of the mesocosms (see 3.2.2, and further below) favour the use of the lower assessment factor. It is decided to use the HC5 based on algae and macrophytes with an assessment factor of 3, and the SSD-based MPCfw, eco is set to 0.08 μg/L.
Figure 2. SSD graph of the NOEC/EC10 values of algae and macrophyta in Table 6. Navicula pelliculosa excluded. HC5 = 0.25 µg/L.
4.2.1.3 Mesocosm
As indicated in section 3.2.2, the NOEC based on mesocosm experiments is 2.0 μg/L, which expressed as TWA concentration is rounded to 1.9 µg/L. For pesticide registration purposes, EFSA proposed to use 5 µg/L as NOEAEC with an assessment factor of 3 (EC, 2005). However, ERL-derivation according to the WFD-guidance does not take account of recovery and the NOEC rather than the NOEAEC should be used. For derivation of water quality standards, Brock et al. (2011) propose an assessment factor of 2-4 on the NOEC of a reliable
mesocosm study. The choice of the factor depends on the additional information that is available. One other reliable mesocosm is available (Mohr et al., 2007; 2008). However, according to the description Lemna, which is by far the most sensitive macrophyte species, was not present in that study. Therefore, it is decided to use the highest assessment factor of 4 on the NOEC of 1.9 µg/L, resulting in mesocosm-based MPCfw, eco of 0.48 µg/L.
4.2.1.4 Choice of the MPCfw, eco
The MPCfw, eco derived by the assessment factor approach is 0.02 μg/L, the SSD approach results in 0.08 μg/L and the mesocosm approach in 0.48 μg/L. The results of the assessment factor approach and SSD approach differ by a factor of 4, while the difference between the SSD and mesocosm approach is almost a factor of 10. There is no clear reason for the relatively high NOEC of 1.9 μg/L observed in the mesocosm as compared to the lowest laboratory NOEC of 0.245 µg/L. A possible explanation might be the fact that growth rate of Lemna sp. in the mesocosms was very low. As indicated above, it is not known how the mode of action of metazachlor relates to the observed differences in sensitivity among plant species. It may be possible that effects of the herbicide become more prominent under optimal growth conditions. Since the mesocosm-based MPCfw, eco might therefore be under protective for Lemna sp. and other
potentially sensitive species, it is decided to use the SSD-based value of 0.08 μg/L as the MPCfw, eco.
4.2.2 MPCsw, eco– ecotoxicity data
The MPCsw, eco is derived on the basis of the same dataset that was used for the MPCfw, eco. A NOEC from a specific marine taxonomic group is not available. In this case an additional assessment factor of 10 is applied to the MPC derived for freshwater, resulting in an MPCsw, eco of 0.008 µg/L.
4.2.3 MPCwater, hh food – human exposure
Metazachlor is assigned H351. According to the triggers in the WFD-Guidance, the MPCwater, hh food should be derived. The MPChh, food is calculated from the ADI (0.08 mg/kg bw/d), a body weight of 70 kg and a daily fish consumption of 115 g and a maximum contribution of fish consumption to the ADI of 10%. The resulting MPChh, food is 0.1 x 0.08 x 70 / 0.115 = 4.87 mg/kg fd. Subsequently the MPCwater, hh food is calculated using the (estimated) BCF of 26.6 L/kg and BMF of 1 as 4.87 / (26.6 x 1) = 0.183 mg/L = 183 µg/L. The MPCwater, hh food is valid for both the freshwater and the marine compartment.
4.3 MPCdw, hh – surface water for abstraction of drinking water
Metazachlor is an organic pesticide. The drinking water standard according to Directive 98/83/EC is 0.1 µg/L. According to the WFD-guidance, a substance specific removal rate should be considered to derive the MPCdw, hh. At present, such information is not available and water treatment is not taken into account. The MPCdw, hh is 0.1 µg/L.
4.4 MACfw, eco and MACsw, eco
L(E)C50 values are available for 17 species from six taxonomic groups including three trophic levels. In addition, unbound values for A. flos-aquae and P. natans are available (Table 5). As for the chronic dataset, the range of sensitivity within the group of macrophytes is relatively large.
4.4.1.1 Assessment factor approach
The MACfw, eco is derived in the first instance from the lowest acute toxicity value available: the EC50 of 2.9 μg/L for Lemna minor. An assessment factor of 10 can be applied, because representatives of the potentially most sensitive taxonomic groups are included in the dataset. The MACfw, eco is 0.29 µg/L. 4.4.1.2 SSD-approach
Following the same reasoning as for the MPCfw, eco, the derivation of a MACfw, eco via the SSD-approach was also investigated. As for the chronic data, the acute dataset does not fully meet the criteria for construction of an SSD. Below, the criteria are copied with the representative species from the present dataset: Fish (species frequently tested include salmonids, minnows, bluegill sunfish,
channel catfish, etc.): Oncorhynchus mykiss, family Salmonidae A second family in the phylum Chordata (e.g. fish, amphibian, etc.):
Cyprinus carpio, family Cyprinidae
A crustacean (e.g. cladoceran, copepod, ostracod, isopod, amphipod, crayfish etc.): Daphnia magna
An insect (e.g. mayfly, dragonfly, damselfly, stonefly, caddisfly, mosquito, midge, etc.): no data
A family in a phylum other than Arthropoda or Chordata (e.g. Rotifera, Annelida, Mollusca, etc.): Anabaena flos-aquae, phylum Cyanophycota, family Nostocaceae (unbound value)
A family in any order of insect or any phylum not already represented: no data
Algae: Scenedesmus subspicatus Higher plants: Lemna minor
Again, two taxa are missing and for one taxon only an unbound value is
available. The SSD with ETX 2.0 using all species is presented in Figure 3. Using all data, the goodness-of-fit is rejected at two levels (Anderson-Darling test). There is a clear distinction in the relatively sensitive algae and macrophytes on the left hand side, and the other species on the right hand side. The specific SSD with the algae and macrophytes (Navicula pelliculosa excluded) is presented in Figure 4. The goodness-of-fit is accepted at all levels (Anderson-Darling test). The resulting HC5 is 2.86 µg/L, with lower and upper limit of 0.49 and 8.1 μg/L, respectively. The default assessment factor for derivation of the MACfw, eco by the SSD approach is 10, resulting in a MACfw, eco of 0.29 µg/L. Brock et al. (2011) propose to lower this assessment to 6 in case the SSD is constructed for the sensitive taxa. This would result in a MACfw, eco of 0.48 μg/L.
Figure 3. SSD graph of the EC50 values in Table 5, unbound values not included.
Figure 4. SSD graph of the EC50 values for algae and macrophytes in Table 5, Navicula pelliculosa and unbound values not included. HC5 = 2.86 µg/L.
Another consideration to lower the assessment factor can be the ratio between the acute EC50 and the NOEC/EC10. The MACfw, eco represents an acute no-effect level. Because for algae and macrophytes the EC50 and NOEC/EC10 values originate from the same studies and mostly refer to the same endpoint, the MACfw, eco should be set at a level that is protective for chronic effects too. If the ratio between the EC50 and NOEC/EC10 is larger than 10, the default
assessment factor is needed as a minimum to account for the fact that the SSD is based on 50%-effect values, while the MACfw, eco represents a no-effect level. For the 10 species for which both EC50 and NOEC/EC10 values are available, the ratio between the two values is between 2.3 and 9.8, the exception is L. minor, for which the ratio is 46. This is probably due to the fact that the basis for the acute endpoint (frond numbers) differs from that for the chronic endpoint (frond weight). For seven out of 10 species the ratio is below 6, which would justify the use of a factor lower than 10. The MACfw, eco of 0.48 μg/L that is derived using a factor of 6 is similar to the lower limit of the EC50-based SSD (0.49 μg/L). This indicates that at this MACfw, eco, exposure of species above their EC50 is not likely. However, when using the default factor of 10, the resulting MACfw, eco is at the level of the chronic HC5 of 0.25 μg/L and effects cannot be excluded when a lower assessment is used.
On the other hand, it is noted that the standard test duration for Lemna of 7 days probably exceeds the duration of “short-term concentration peaks” for which the MACfw, eco was introduced. While the endpoints from the agreed study duration should be used as input for the SSD, the information from intermediate time-points may be considered to underpin the choice of the assessment factor. In this case, additional studies indicate that effects of metazachlor on L. gibba (the most sensitive species from the chronic dataset) are reduced when exposure time is limited to 48 hours. In the study from Wenzel (2011a) no effects were seen when L. gibba was initially exposed for 24 hours to 10 μg/L, followed by another 24 hours at 1.4 μg/L and clean medium thereafter until day 7 (see Annex 1 Table A1.1). The time-dependent effect of metazachlor is confirmed by a study in the DAR in which L. gibba showed no effects after exposure to 3 μg/L for 72 hours, but displayed 25.8% growth inhibition after 5 days (Junker & Kubitza, 2003 in EC, 2005). In another study, the NOEC was 0.572 μg/L after exposure for 72 hours (LOEC 2.8 μg/L), but was 0.193 μg/L after exposure for 7 days (Scheerbaum, 2000 in EC, 2005). In a study with L. minor, the NOEC was 4.4 μg/L after two days and dropped to 1.4 μg/L after 4 and 7 days (Scheerbaum, 2004 in EC, 2005). Taking all available information into account, an SSD-based MACfw, eco of 0.48 μg/L derived using an assessment factor of 6 seems to be protective taking the time-frame of the MAC into
consideration. 4.4.1.3 Mesocosm
Usable field studies are available, from which a NOEC of 2 μg/L was derived. Brock et al. (2011) propose to use an assessment factor of 2-3 on the 48/72 hours TWA concentration for derivation of the MACfw, eco in case a NOEC from a reliable mesocosm study is available. With the DT50 of 33 days, the rounded NOEC is 2.0 μg/L. As for derivation of the MPCfw, eco, the higher assessment factor of 3 is used because it is not known whether Lemna sp. was present in the other mesocosm studies. The resulting mesocosm-based MACfw, eco is 0.67 µg/L.
4.4.2 Selection of the MACfw, eco and MACsw, eco
The MACfw, eco derived by the assessment factor approach is 0.29 μg/L, the SSD approach results in 0.48 μg/L and the mesocosm approach in 0.67 μg/L. The difference between lowest and highest value is a factor of 2.3. As for the
MPCfw, eco, the SSD-based value is considered most appropriate. The MACfw, eco is set to 0.48 μg/L.
The MACsw, eco is derived on the basis of the freshwater dataset. Since there are no acute data from specific marine taxa, an additional assessment factor of 10 is applied to the MACfw, eco. This results in an MACsw, eco of 0.048 µg/L.
4.5 NCfw and NCsw
The NCfw is calculated by dividing the MPCfw by a factor of 100. The NCfw is 0.0008 µg/L.
The NCsw is calculated by dividing the MPCsw by a factor of 100. The NCsw is 0.00008 µg/L.
4.6 SRCfw, eco and SRCsw, eco
Since more than three long-term NOECs of all required trophic levels are available, the SRCfw, eco is derived from the geometric mean of all available NOECs with an assessment factor of 1. The geometric mean is 60 µg/L. Therefore, the SRCfw, eco is 60 µg/L. This value is also valid as SRCsw, eco.
5
Conclusions
Based on the available information, environmental risk limits (ERLs) for metazachlor in freshwater and saltwater are derived according to the
methodology of the WFD and INS. An overview of the derived ERLs is presented in the table below. ERLs that are equivalent to water quality standards required under the WFD are indicated in bold.
Table 7 Environmental risk limits for metazachlor in water
Environmental risk limit Value
[µg/L] Freshwater MPCfw, eco 0.08 MPCwater, hh food 183 MPCfw 0.08 MACfw, eco 0.48 NCfw 0.0008 SRCfw, eco 60
Surface water for drinking water production
MPCdw, hh 0.1 Saltwater MPCsw, eco 0.008 MPCwater, hh food 183 MPCsw 0.008 MACsw, eco 0.048 NCsw 0.00008 SRCsw eco 60
According to the Bestrijdingsmiddelenatlas (www.bestrijdingsmiddelenatlas.nl) concentrations in 2010 were <0.34 µg/L (1/100 of the current quality standard of 34 µg/L) for the majority of monitoring locations, eight locations had
concentrations between 0.34 and 34 µg/L.
In 2009, metazachlor was detected at 26 WFD-monitoring locations with 90th percentile yearly concentrations ranging from 0.01 to 1.34 µg/L (Van Duijnhoven, 2011). The frequency of detection ranged from 15% (1 out of 7 samples) to 100% (detected in all samples). Because the comparison with the new MPCfw will be based on annual average concentrations, these data cannot be used directly but they indicate that the MPCfw will probably be exceeded. This also holds for the MACfw ,eco.
References
Reference list includes references used in the Annexes.
AlgaeBase. 2012. http://www.algaebase.org/. Date of search 4 October, 2012. Böger P. 2003. Mode of action for chloracetamides and functionally related
compounds. J Pestic Sci 28: 324-329.
Brock, TCM, Arts GHP, Ten Hulscher TEM, De Jong FMW, Luttik R, Roex EWM, Smit CE, Van Vliet PJM. 2001 Aquatic effects assessment for plant protection products. Wageningen, the Netherlands: Alterra/WUR. Report 2235.
Committee for Risk Assessment. 2011. Annex 1, Background Document to the opinion proposing harmonised classification and labelling at Community level of Metazachlor. ECHA, ECHA/RAC/CLH-O-0000001586-69-01/A1.
Couderchet M, Schmalfuss J, Böger P. 1996. Incorporation of oleic acid into sporopollenin and its inhibition by the chloroacetamide herbicide metazachlor. Pest Biochem Physiol 55: 189-199.
Couderchet M, Schmalfuss J, Böger P. 1998. A specific and sensitive assay to quantify the herbicidal activity of chloroacetamides. J Pestic Sci 52: 381-387.
Crommentuijn T, Kalf DF, Polder MD, Posthumus R, Van de Plassche EJ. 1997. Maximum permissible concentrations and negligible concentrations for pesticides. Bilthoven, the Netherlands: RIVM. Report no 601501002. EC. 2003. Technical Guidance Document on risk assessment in support of
Commission Directive 93/67/EEC on risk assessment for new notified substances, Commission Regulation (EC), no. 1488/94 on risk assessment for existing substances and Directive 98/8/EC of the European Parliament and of the Council concerning the placing of biocidal products on the market. Ispra, Italy: European Commission Joint Research Centre.
EC. 2005. European Commission. Draft Assessment Report Metazachlor. Vol B3, Section B9, and Addendum 6 (2007).
EC. 2011. Common Implementation Strategy for the Water Framework Directive (2000/60/EC). Technical guidance for deriving environmental quality
standards. Guidance Document No. 27. Brussels, Belgium: European Communities.
ECHA. 2008. Guidance on information requirements and chemical safety assessment. Chapter R.10: Characterisation of dose [concentration]-response for environment. Helsinki, Finland: European Chemicals Agency. Guidance for the implementation of REACH. May 2008.
Grossmann K, Berghaus R, Retzlaff G. 1992. Heterotrophic plant cell suspension cultures for monitoring biological activity in agrochemical research.
Comparison with screens using algae, germinating seeds and whole plants. Pestic Sci 35: 283-289.
ITIS. 2012. Integrated Taxonomic Information System. http://www.itis.gov/. Date of search 2 October, 2012.
Juckeland D. 2011. Effects of metazachlor 50 SC on Lemna gibba in a growth inhibition test under static conditions. Gerichshain, Germany: Biochem agrar. Report no 111048004W (confidential).
Junghans M, Backhaus T, Faust M, Scholze M, Grimme LH. 2003. Predictability of combined effects of eight chloroacetanilide herbicides on algal reproduction. Pest Manag Sci 59: 1101-1110.
KEMI. 2008. Interpretation in Sweden of the impact of the “cut-off” criteria adopted in the common position of the Council concerning the Regulation of placing plant protection products on the market (document 11119/08).
Kubitza J and Dohmen GP. 2002. Effect of metazachlor on submersed and emergent aquatic plants. Poster, SETAC-Europe meeting, Vienna 2002. Klimisch HJ, Andreae M, Tillman U. 1997. A systematic approach for evaluating
the quality of experimental toxicological and ecotoxicological data. Reg Toxicol Pharmacol 25: 1-5.
Lepper F. 2005. Manual on the Methodological Framework to Derive
Environmental Quality Standards for Priority Substances in accordance with Article 16 of the Water Framework Directive (2000/60/EC). Schmallenberg, Germany: Fraunhofer-Institute for Molecular Biology and Applied Ecology. Maltby L, Arnold D, Arts G, Davies J, Heimbach F, Pickl C, Poulsen V (eds). 2010.
Aquatic macrophyte risk assessment for pesticides. SETAC Press & CRC Press, Taylor & Francis Group, Boca Raton, FL.
Mohr S, Berghahn R, Feibicke M, Meinecke S, Ottenströter T, Schmieding I, Schmiediche R, Schmidt R. 2007. Effects of the herbicide metazachlor on macrophytes and ecosystem function in freshwater pond and stream mesocosms. Aquat Toxicol 82: 73-84.
Mohr S, Feibicke M, Berghahn R, Schmiediche R, Schmidt R. 2008. Response of plankton communities in freshwater pond and stream mesocosms to the herbicide metazachlor. Environ Pollut 152: 530-542.
Müller R, Berghahn R, Hilt S. 2010. Herbicide effects of metazachlor on duckweed (Lemna minor and Spirodela polyrhiza) in test systems with different trophic status and complexity. J Environ Sci Health Part B 45: 95-101.
Noack U, Geffke T, Balasubramania R, Papenbrock J, Braune M, Scheerbaum D. 2003. Effects of the herbicide metazachlor on phytoplankton and periphyton communities in outdoor mesocosms. Acta Hydrochim Hydrobiol 6: 482-790. OECD. 2006a. OECD Guidelines for the testing of chemicals. Test no. 201.
Freshwater Alga and Cyanobacteria, Growth Inhibition Test.
OECD. 2006b. OECD Guidelines for the testing of chemicals. Test no. 221. Lemna sp. Growth Inhibition Test.
Panman E, Linders J. 1990. RIVM adviesrapport 88/678801/019.
Schmalfuss J, Matthes B, Mayer P, Böger P. 1998. Chloroacetamide mode of action I: inhibition of very long chain fatty acid synthesis in Scenedesmus acutus. Z Naturforschung 53c: 995-1003.
Spruijt J, Spoorenberg P, Vermeulen T, Beerling E, Roelofs P, Heijerman G, Smit B, Van der Veen H, Van der Meer R, Helming J, Bunte F, Van Galen M, Tijink F. 2008. Impact EU-Gewasbeschermingsverordening Economische impact van de voorgestelde cut-off criteria voor een aantal Nederlandse gewassen. Wageningen, the Netherlands: Praktijkonderzoek Plant & Omgeving B.V. Project nr 3250126000.
Van Duijnhoven N. 2011. Inzicht in landelijke kwaliteitsdata 2006-2009. Achtergronddocument t.b.v. update stoffenlijst MR monitoring. Utrecht, Nederland: Deltares.
Van Vlaardingen PLA, Traas TP, Wintersen AM, Aldenberg T. 2004. ETX 2.0. A program to calculate Hazardous Concentrations and Fraction Affected, based on normally distributed toxicity data. Bilthoven, The Netherlands: National Institute for Public Health and the Environment (RIVM). Report 601501028. http://www.rivm.nl/bibliotheek/rapporten/601501028.pdf. Software
Netherlands. The Hague, the Netherlands: Ministry of Housing, Spatial Planning and the Environment.
VROM. 2004. (Inter)nationale Normen Stoffen. Den Haag, the Netherlands: Ministerie van Volkshuisvesting, Ruimtelijke Ordening en Milieubeheer. Wenzel A. 2011a. Lemna sp. growth inhibition test (OECD 221): Effect of
metazachlor on the growth of Lemna gibba, semi-static conditions with 2 medium renewals. Schmallenberg, Germany: Fraunhofer Institut. Report no. FEI-007/4-54/J/## (confidential).
Wenzel A. 2011b. Lemna sp. growth inhibition test (OECD 221): Effect of metazachlor on the growth of Lemna gibba, semi-static conditions with 1 medium renewal. Schmallenberg, Germany: Fraunhofer Institut. Report no. FEI-007/4-54/J/# (confidential).
List of abbreviations
ADI Acceptable Daily Intake
BCF Bioconcentration Factor BMF Biomagnification Factor
ECx Concentration at which x% effect is observed ERL Environmental Risk Limit
INS International and National Environmental Quality Standards for Substances in the Netherlands
LC50 Concentration at which 50% mortality is observed MACeco Maximum Acceptable Concentration for ecosystems MACfw, eco Maximum Acceptable Concentration for ecosystems in
freshwater
MACsw, eco Maximum Acceptable Concentration for ecosystems in the saltwater compartment
Marine species
Species that are representative for marine and brackish water environments and that are tested in water with salinity > 0.5 ‰.
MPC Maximum Permissible Concentration
MPCfw Maximum Permissible Concentration in freshwater MPCsw Maximum Permissible Concentration in the saltwater
compartment
MPCfw, eco Maximum Permissible Concentration in freshwater based on ecotoxicological data
MPCsw, eco Maximum Permissible Concentration in the saltwater compartment based on ecotoxicological data
MPCfw, secpois Maximum Permissible Concentration in freshwater based on secondary poisoning
MPCsw, secpois Maximum Permissible Concentration in the saltwater compartment based on secondary poisoning
MPCwater, hh food Maximum Permissible Concentration in freshwater and saltwater based on consumption of fish and shellfish by humans
MPCdw, hh Maximum Permissible Concentration in water used for abstraction of drinking water
NC Negligible Concentration NCfw Negligible Concentration in freshwater NCsw Negligible Concentration in saltwater NOEC No Observed Effect Concentration
NOAEC No Observed Adverse Effect Concentration NOAEL No Observed Adverse Effect Level
NOEAEC No Observed Ecosystem Adverse Effect Level SRCeco Serious Risk Concentration for ecosystems
SRCwater, eco Serious risk concentration for freshwater and saltwater ecosystems
TGD Technical Guidance Document TWA Time Weighted Average
Legend to column headings
A test water analysed Y(es)/N(o)
Test type S = static; Sc = static closed; R = renewal; F = flow through; CF = continuous flow; IF = intermittent flow system
Purity refers to purity of active substance or content of active substance in formulation; ag = analytical grade
Test water am = artificial medium; dtw = dechlorinated tap water; dw = deionised/dechlorinated/distilled water; nw = natural water; rw = reconstituted water; rtw = reconstituted tap water; tw = tap water
T temperature
Ri Reliability index according to Klimisch et al. (1997); asterisk indicates citation
Table A1.1. Acute toxicity of metazachlor to freshwater organisms
Species Species
properties A Test type Test compound Purity Test water pH T Hardness CaCO3
Exp.
time Criterion Test endpoint Value Ri Notes Ref.
[%] [°C] [mg/L] [μg
a.s./L]
Cyanobacteria
Anabaena flos-aquae 3 x 10⁴ cells/mL Y S a.s. 98.7 am 7.5-7.7 23-25 96 h EC50 growth
rate >32000 2 10 EC, 2005 (Kubitza, 1998b) Anabaena flos-aquae 3 x 10⁴ cells/mL Y S a.s. 98.7 am 7.5-7.7 23-25 96 h EC50 biomass
(AUGC)* 25200 2 10 EC, 2005 (Kubitza, 1998b)
Algae
Chlorella fusca 2 x 10⁴ cells/mL N S a.s 90-95 am 7.1 20 96 h EC50 growth
rate 16300 2 16 Panman and Linders, 1990
Navicula pelliculosa 1 x 10⁴ cells/mL Y S a.s. 97.7 am 7.9-8.0 23±2 72 h EC50 growth
rate 72500 2 10 EC, 2005 (Scheerbaum, 2000)
Navicula pelliculosa 1 x 10⁴ cells/mL Y S a.s. 97.7 am 7.9-8.0 23±2 72 h EC50 biomass
(AUGC)* 13700 2 10 EC, 2005 (Scheerbaum, 2000) Pseudokirchneriella
subcapitata 1 x 10
4 cells/mL Y S a.s. 98.7 am 8.0 21-23 72 h EC50 growth
rate 31.8 2 10 EC, 2005 (Kubitza, 1998a)
Pseudokirchneriella
subcapitata 1 x 10
4 cells/mL Y S a.s. 98.7 am 8.0 21-23 72 h EC50 biomass
(AUGC)* 16.2 2 10 EC, 2005 (Kubitza, 1998a) Pseudokirchneriella
subcapitata 1 x 10
4 cells/mL Y S BAS 479 22
Species Species
properties A Test type Test compound Purity Test water pH T Hardness CaCO3
Exp.
time Criterion Test endpoint Value Ri Notes Ref.
[%] [°C] [mg/L] [μg
a.s./L] Pseudokirchneriella
subcapitata 1 x 10
4 cells/mL Y S BAS 479 22
H 43.5 (m/m) am 8.0 22±1 72 h EC50 biomass (AUGC)* 7.5 2 15 EC, 2005 (Kubitza, 2000)
Pseudokirchneriella
subcapitata 3 x 10
4 cells/mL N S BAS 479 14
H 43.9 (m/m) am 7.9-8.4 24±1 72 h EC50 biomass (AUGC)* 9 2 16 EC, 2005 (Dohmen, 1990)
Scenedesmus
subspicatus 1 x 10
4 cells/mL Y S FSG 02094 H 45.4
(m/m) am 7.3-8.3 22.0-23.0 72 h EC50 growth rate 50 2 10 EC, 2005 (Scheerbaum, 1997)
Scenedesmus
subspicatus 1 x 10
4 cells/mL Y S FSG 02094 H 45.4
(m/m) am 7.3-8.3 22.0-23.0 72 h EC50 biomass (AUGC)* 29 2 10 EC, 2005 (Scheerbaum, 1997
Scenedesmus
subspicatus 1 x 10
4 cells/mL Y S a.s. 97.7 am 7.9-8.1 23±2 72 h EC50 growth
rate 31 2 11 EC, 2005 (Scheerbaum, 2000)
Scenedesmus
subspicatus 1 x 10
4 cells/mL Y S a.s. 97.7 am 7.9-8.1 23±2 72 h EC50 biomass
(AUGC)* 8.8 2 11 EC, 2005 (Scheerbaum, 2000)
Scenedesmus acutus N S a.s. ag am 23 24 h EC50 biomass 500 3 3 Grossmann et al.
1992 Scenedesmus acutus 50 µg
chorophyll/mL N S a.s. ag am 25 3h EC50 biomass 28 3 2 Couderchet et al., 1998
Scenedesmus acutus 7-15 μg
chlorophyll/mL N S a.s. ag am 25 50 h EC50 biomass 1400 3 1 Couderchet et al., 1998
Scenedesmus
vacuolatus Y S a.s. 98 am 28 24 h EC50 biomass 46.6 3 5 Junghans et al., 2003
Macrophyta
Callitriche palustris Submerged Y S BAS 479 22
H 43.5 (m/m) am 7.8-8.2 19.4-20 165 14 d EC50 biomass (wwt) 24 2 13 EC 2005 (Kubitza and Dohmen, 2002)
Ceratophyllum
demersum Submerged Y S BAS 479 22 H 43.5 (m/m) am 7.8-8.2 19.4-20 165 14 d EC50 length 24 2 13 EC 2005 (Kubitza and Dohmen, 2002) Elodea canadensis Submerged Y S BAS 479 22
H 43.5 (m/m) am 7.8-8.2 19.4-20 165 14 d EC50 biomass (wwt) 73 2 13 EC 2005 (Kubitza and Dohmen, 2002)
Lemna gibba 14 fronds/vessel Y S a.s. 98.7 am 6.6-9.1 25-26 7 d EC50 growth
rate (frond #)
10.7 2 12 EC, 2005
(Dohmen, 1998b)
Lemna gibba 14 fronds/vessel Y S a.s. 98.7 am 6.6-9.1 25-26 7 d EC50 frond # 4.7 2 12 EC, 2005
(Dohmen, 1998b) Lemna gibba 3 fronds/plant, 4
plants Y R a.s. 97.7 am 7.5±0.1 25±2 7d EC50 growth rate
(frond #)
7.1 2 14 EC, 2005
(Scheerbaum, 2000)
properties type compound water CaCO3 time endpoint
[%] [°C] [mg/L] [μg
a.s./L] Lemna gibba 4 fronds/plant, 3
plants Y S BAS 479 22 H 43.5 (m/m) am 7.5-8.9 24-25 7 d EC50 growth rate
(frond #)
14.3 2 12 EC, 2005
(Junker, 2003) Lemna gibba 4 fronds/plant, 3
plants Y S BAS 479 22 H 43.5 (m/m) am 7.5-8.9 24-25 7 d EC50 frond # 2.2 2 12 EC, 2005 (Junker, 2003)
Lemna gibba 9 fronds/vessel Y Sc metazachlor
50 SC 500 g/L am 7.5-8.5 22-24 7 d EC50 growth rate
(frond #)
14.9 1 24 Juckeland, 2011
Lemna gibba 9 fronds/vessel Y Sc metazachlor
50 SC 500 g/L am 7.5-8.5 22-24 7 d EC50 growth rate
(dwt)
37.6 1 24 Juckeland, 2011
Lemna gibba 9 fronds/vessel Y Sc metazachlor
50 SC 500 g/L am 7.5-8.5 22-24 7 d EC50 yield (frond #) 7.52 1 24 Juckeland, 2011
Lemna gibba 9 fronds/vessel Y Sc metazachlor
50 SC 500 g/L am 7.5-8.5 22-24 7 d EC50 yield (dwt) 7.61 1 24 Juckeland, 2011
Lemna gibba 12 fronds/vessel Y R a.s. 96.7 am 7.6-9.1 23-26 48 h EC50 growth
rate (frond #)
> 80 2 25 Wenzel, 2011a
Lemna gibba 12 fronds/vessel Y R a.s. 96.7 am 7.6-9.1 23-26 48 h NOEC growth
rate (frond #)
20 2 25 Wenzel, 2011a
Lemna gibba 12 fronds/vessel Y R a.s. 96.7 am 7.6-9.1 23-26 48 h EC50 growth
rate (dwt)
> 80 2 25 Wenzel, 2011a
Lemna gibba 12 fronds/vessel Y R a.s. 96.7 am 7.6-9.1 23-26 48 h NOEC growth
rate (dwt)
10 2 25 Wenzel, 2011a
Lemna gibba 12 fronds/vessel Y R a.s. 96.7 am 7.6-9.1 23-26 48 h EC50 growth
rate (frond area)
> 80 2 25 Wenzel, 2011a
Lemna gibba 12 fronds/vessel Y R a.s. 96.7 am 7.6-9.1 23-26 48 h NOEC growth
rate (frond area)
10 2 25 Wenzel, 2011a
Lemna gibba 12 fronds/vessel Y R a.s. 96.7 am 7.6-9.1 23-26 48 h EC50 yield
Species Species
properties A Test type Test compound Purity Test water pH T Hardness CaCO3
Exp.
time Criterion Test endpoint Value Ri Notes Ref.
[%] [°C] [mg/L] [μg
a.s./L]
Lemna gibba 12 fronds/vessel Y R a.s. 96.7 am 7.6-9.1 23-26 48 h NOEC yield
(frond #) 20 2 25 Wenzel, 2011a
Lemna gibba 12 fronds/vessel Y R a.s. 96.7 am 7.6-9.1 23-26 48 h EC50 yield
(dwt) > 80 2 25 Wenzel, 2011a
Lemna gibba 12 fronds/vessel Y R a.s. 96.7 am 7.6-9.1 23-26 48 h NOEC yield
(dwt) 40 2 25 Wenzel, 2011a
Lemna gibba 12 fronds/vessel Y R a.s. 96.7 am 7.6-9.1 23-26 48 h EC50 yield
(frond area)
93.4 2 25 Wenzel, 2011a
Lemna gibba 12 fronds/vessel Y R a.s. 96.7 am 7.6-9.1 23-26 48 h NOEC yield
(frond area)
10 2 25 Wenzel, 2011a
Lemna gibba 12 fronds/vessel Y R a.s. 96.7 am 7.6-9.1 23-26 24 h EC50 growth
rate (frond #)
> 400 2 26 Wenzel, 2011b
Lemna gibba 12 fronds/vessel Y R a.s. 96.7 am 7.6-9.1 23-26 24 h NOEC growth
rate (frond #)
≥ 400 2 26 Wenzel, 2011b
Lemna gibba 12 fronds/vessel Y R a.s. 96.7 am 7.6-9.1 23-26 24 h EC50 growth
rate (dwt)
> 400 2 26 Wenzel, 2011b
Lemna gibba 12 fronds/vessel Y R a.s. 96.7 am 7.6-9.1 23-26 24 h NOEC growth
rate (dwt)
50 2 26 Wenzel, 2011b
Lemna gibba 12 fronds/vessel Y R a.s. 96.7 am 7.6-9.1 23-26 24 h EC50 growth
rate (frond area)
> 400 2 26 Wenzel, 2011b
Lemna gibba 12 fronds/vessel Y R a.s. 96.7 am 7.6-9.1 23-26 24 h NOEC growth
rate (frond area)
50 2 26 Wenzel, 2011b
Lemna gibba 12 fronds/vessel Y R a.s. 96.7 am 7.6-9.1 23-26 24 h EC50 yield
(frond #) > 400 2 26 Wenzel, 2011b
Lemna gibba 12 fronds/vessel Y R a.s. 96.7 am 7.6-9.1 23-26 24 h NOEC yield
properties type compound water CaCO3 time endpoint
[%] [°C] [mg/L] [μg
a.s./L]
Lemna gibba 12 fronds/vessel Y R a.s. 96.7 am 7.6-9.1 23-26 24 h NOEC yield
(dwt) <25 2 26 Wenzel, 2011b
Lemna gibba 12 fronds/vessel Y R a.s. 96.7 am 7.6-9.1 23-26 24 h EC50 yield
(frond area)
> 400 2 26 Wenzel, 2011b
Lemna gibba 12 fronds/vessel Y R a.s. 96.7 am 7.6-9.1 23-26 24 h NOEC yield
(frond area)
<25 2 26 Wenzel, 2011b
Lemna minor 3 fronds/plant, 4
plants N S a.s. ag am 5.5 242 7 d EC50 growth rate
(frond area)
2.9 2 6 Müller et al., 2010
Lemna minor 3 fronds/plant, 4
plants N S a.s. ag am 5.5 242 7 d EC50 growth rate
(frond #)
3.8 2 6 Müller et al., 2010
Lemna minor 3 fronds/plant, 4
plants N S a.s. ag am 7 d EC50 growth rate
(frond area)
4.7 3 18 Müller et al., 2010
Lemna minor 3 fronds/plant, 4
plants N S a.s. ag am 7 d EC50 growth rate
(frond #)
52.9 3 18 Müller et al., 2010
Lemna minor 4 fronds/plant, 3
plants Y R FUEGO SC 45.3 (m/m) am 6.5±0.2 24±2 7 d EC50 growth rate
(frond #)
14 2 17 EC, 2005
(Scheerbaum, 2004) Lemna minor 4 fronds/plant, 3
plants Y R FUEGO SC 45.3 (m/m) am 6.5±0.2 24±2 7 d EC50 biomass (AUGC)* 22 2 17 EC, 2005 (Scheerbaum, 2004)
Lemna minor 4 fronds/plant, 3
plants Y R FUEGO SC 45.3 (m/m) am 6.5±0.2 24±2 7 d EC50 biomass (dwt) > 45 2 17 EC, 2005 (Scheerbaum, 2004)
Lemna paucicostata 4 fronds/vessel N S a.s. ag am 25 8 d EC50 frond area 106 2 4 Grossmann et al.
1992 Myriophyllum
heterophyllum Submerged Y S BAS 479 22 H 43.5 (m/m) am 7.8-8.2 19.4-20 165 14 d EC50 length 80 2 13 EC 2005 (Kubitza and Dohmen, 2002) Potamogeton natans Submerged Y S BAS 479 22
H 43.5 (m/m) am 7.8-8.2 19.4-20 165 14 d EC50 biomass (wwt) > 174 2 13 EC 2005 (Kubitza and Dohmen, 2002)
Stratiotes aloides Submerged Y S BAS 479 22