BIOMARKERS IN ACUTE STROKE DIAGNOSIS: A SYSTEMATIC REVIEW PER
BIOMARKER GROUP.
Jasper Joye
Student number: 01300301
Supervisor(s): Prof. Dr. Said Hachimi Idrissi, Dr. Joline Goossens
A dissertation submitted to Ghent University in partial fulfilment of the requirements for the degree of Master of Medicine in Medicine
Deze pagina is niet beschikbaar omdat ze persoonsgegevens bevat.
Universiteitsbibliotheek Gent, 2021.
This page is not available because it contains personal information.
Ghent University, Library, 2021.
Table of Contents
LIST OF ABBREVIATIONS ... i Abstract... 3 Nederlandse samenvatting ... 4 1. Introduction ... 6 1.1. Definition... 61.2. Prevalence and incidence ... 7
1.3. Risk factors ... 7
1.3.1. Non-modifiable risk factors ... 7
1.3.2. Modifiable risk factors ... 8
1.4. Acute stroke diagnosis and treatment ... 8
1.4.1. Initial assessment and differential diagnosis ... 8
1.4.2. Overview on ideal patient flow ... 9
1.4.3. Initial management ... 9
1.4.4. Limitations of the current stroke management ... 11
1.5. Biomarkers ... 11 1.5.1. Genes ... 12 1.5.2. MiRNA ... 12 1.5.3. Proteins ... 13 1.5.4. Metabolites ... 13 1.5.5. Biomarker panel ... 13
1.6. Essential steps in IS pathophysiology and potential sources of biomarkers ... 14
1.6.1. Markers of neuronal cell damage ... 14
1.6.2. Markers of excitotoxicity ... 14
1.6.3. Markers of oxidative stress ... 15
1.6.4. Markers of inflammation ... 15
1.6.5. Markers of BBB dysfunction ... 16
1.7. Goal of this master dissertation ... 16
2. Methodology... 18 2.1. Search strategy ... 18 2.2. Inclusion criteria ... 18 2.3. Data extraction ... 20 2.4. Quality assessment ... 20 2.5. Statistical analysis ... 20 3. Results ... 22 3.1. Genes ... 22
3.1.1 Study characteristics of studies with main focus on gene expression ... 22
3.1.2. Gene expression levels ... 23
3.2. MicroRNA ... 25
3.2.2. MiRNA expression levels ... 26
3.3. Proteins ... 30
3.3.1. Study characteristics of studies with main focus on protein expression levels ... 30
3.3.2. Meta-analysis on protein biomarkers ... 32
3.4. Metabolites ... 40
3.4.1. Study characteristics of studies with main focus on metabolite expression levels ... 40
3.4.2. Metabolite expression levels ... 40
4. Discussion ... 43 4.1. Genes ... 43 4.2. MicroRNA ... 43 4.3. Proteins ... 44 4.4. Metabolites ... 45 4.5. Limitations ... 46 5. Conclusion ... 47 6. References ... 48 7. Supplementary data ... 51
LIST OF ABBREVIATIONS ACTB Actin beta
ASA American stroke association AUC Area under curve
B2M Beta-2 microglobulin BBB blood-brain barrier BNP Brain natriuretic peptid CBF cerebral blood flow CI Confidence interval CRP C-reactive protein
COX cyclooxygenase
CNV Copy number variants
DAMPs damage-associated molecular patterns
DD D-Dimers
DWI-MRI Diffuse weighted imaging MRI
ED Emergency department
ELISA enzyme linked immune sorbent assays ESR Erythrocyte sedimentation rate
GFAP Glial fibrillary acidic protein GC-MS Gas chromatography – MS
GC-RMA Genechip robust multi array averaging
HCY Homocysteine
HS Haemorrhagic stroke
IAT intra-arterial thrombolysis
ICAM-1 Intercellular adhesion molecule-1 ICH intracerebral haemorrhage IL-1β Interleukin-1 βeta
IL-6 Interleukin-1 βeta
IMA Ischemia modified albumin
IS Ischemic stroke
IV Intravenous
IV-RTPA intravenous recombinant tissue plasminogen activator MBP Myelin basic protein
MEKC Micellar electrokinetic chromatography MFI Mean fluorescence intensity
MRA Magnetic resonance angiography MRI magnetic resonance imaging
MS mass spectrometry
MSU Mobile stroke unit
NCCT noncontrast computed tomography NMDA N-methyl-d-aspartate
NOS Newcastle-Ottowa scale NSE Neuron specific enolase
PBMC Peripheral blood mononuclear cells PCR polymerase chain reaction
PLA2 Phospholipase A2
PPIB Peptidylprolyl isomerase B PRR pattern-recognition receptors
qPCR Quantitative polymerase chain reaction
qRT-PCR Quantitative reverse-transcriptase polymerase chain reaction RNA ribonucleic acid
ROC Receiver operating characteristics ROS reactive oxygen species
rRNA Ribosomal RNA
RT-PCR Reverse transcriptase polymerase chain reaction
SAA Serum amyloid A
SAH subarachnoid haemorrhage SD Standard deviation
SNP Single nucleotide polymorphism TIA transient ischemic attack
TIMP-1 Tissue inhibitor of metalloproteinase 1 TLDA Taqman low density Array
TNF-α tumor necrosis factor alpha
UCH-L1 Ubiquitin carboxy-terminal hydrolase L1
UPLC-MS/MS Ultra performance liquid chromatography – tandem MS WBCC White blood cell count
Abstract
Introduction: To date, ischemic stroke (IS) remains to be one of the leading causes of death and long-term disability worldwide. Approximately 15 million stroke events occur on yearly basis which are associated with nearly 5 million deaths and 5 million cases of permanent disability worldwide. Rapid diagnosis and adequate management are crucial due to the narrow therapeutic time window. At this time, due to generally available diagnostic neuroimaging, diagnosing IS is most of the time straightforward. In cases where imaging resources and/or medical expertise is limited, a blood-based biomarker diagnostic panel would be valuable. The goal of this master dissertation is to analyse which biomarker(s) per group, could differentiate ischemic stroke patients from healthy controls.
Methodology: A systematic literature research was conducted, searching all publications on blood biomarkers for IS diagnosis. In total 71 studies met the inclusion criteria for this review: 7 studies on gene expression levels, 25 on miRNA expression levels, 33 on protein
expression levels and 6 on metabolite expression levels. A meta-analysis was conducted on the protein subgroup using Review Manager 5.3. software. When studies did not report mean and standard deviation (SD) of protein biomarkers concentration the formulas of Wan et al and Hozo et al were used to make an estimate of the mean and SD. All data is reported as forest plots. The data yielded on other biomarker groups did not allow for meta-analysis. Results: In the gene subgroup matrix-metalloproteinase-9 and S100A12 seem to have the most potential for differentiating IS from healthy controls. These were the only genes reported to be consistently upregulated between IS patients and healthy controls in 3 separate studies. In the miRNA subgroup 16, 30, 126 and miRNA-221 seemed to a suitable potential biomarker. In the protein subgroup TNF-α, fibrinogen and folic acid were all reported in more than one study and had I² values of < 40 %, indicating these have the most potential. In the metabolite subgroup glycine and proline were the only biomarkers altered significantly, indicating these could be a potential candidate in this category.
Conclusion: A simple blood test that could diagnose patients with IS would have the potential to significantly shorten the time-to-needle, especially in cases of remaining diagnostic uncertainty. However, considering the many limitations of this systematic review, we still are far away from a biomarker/biomarker panel for IS diagnosis would be available. More studies are needed with larger subject groups and lifelike control groups. Furthermore, a consensus needs to be established for a standardized detecting method for gene, miRNA and metabolite levels before introduction into clinical practice can occur.
Nederlandse samenvatting
Introductie: Tot op heden blijft een ischemische beroerte (IB) één van de belangrijkste doodsoorzaken en oorzaak van langdurige invaliditeit. Ongeveer 15 miljoen beroertes doen zich voor per jaar die geassocieerd zijn met 5 miljoen doden en 5 miljoen gevallen van langdurige invaliditeit. Snelle diagnose en behandeling zijn van cruciaal belang door het nauwe therapeutische venster. Tegenwoordig is IB diagnose, met dank aan de
wijdverspreide neurologische beeldvorming, meestal eenvoudig. In gevallen waar
neurologische beeldvorming zijn gelimiteerd, of medische expertise beperkt is, kan een in bloed afgenomen biomarker diagnostisch panel een meerwaarde zijn. Het doel van deze master thesis is om te analyseren welke biomerker, per categorie, het best IB patiënten van gezonde controles kan onderscheiden.
Methodologie: Een systematische literatuurstudie werd verricht om alle publicaties over bloed biomarkers voor IB diagnose te vinden. In totaal voldeden 71 studies aan de inclusie criteria voor deze review: 7 studies over gen expressie levels, 25 over miRNA expressie levels, 33 over proteïne expressie levels en 6 over metaboliet expressie levels. Een meta-analyse werd uitgevoerd op de proteïne subgroep met gebruik van Review Manager 5.3. software. Wanneer studies hun concentraties niet uitdrukten als gemiddelde en standaard deviatie (SD) van de proteïne biomerker werden de formules van Wan et al en Hozo et al toegepast om een schatting te maken van het gemiddelde en de SD. Alle resultaten zijn weergegeven in forest plots. De data uit de andere groepen was niet voldoende om een meta-analyse op uit te voeren.
Resultaten: In de gen subgroep lijken metalloproteinase-9 en S100A12 het meeste
potentiaal te hebben om IB van gezonde controles te differentiëren. In de miRNA subgroep lijken miRNA-16 en miRNA-30, miRNA-126 en miRNA-221 het meeste potentieel te tonen. In de proteïne subgroep waren TNF-α, fibrinogeen en foliumzuur allemaal gerapporteerd in meer dan 1 studie en hadden I² waarden van < 40%, dit indiceert dat deze potentiële
biomarkers zijn. In de metaboliet subgroep waren glycine en proline de enige biomarkers die significant afwijkend waren en zouden potentiële kandidaten zijn in deze categorie.
Conclusie: Een simpele bloed test dat patiënten met een IB kan diagnosticeren heeft het potentieel om de “time-to-needle” significant te verkorten, vooral in gevallen waar er diagnostische onzekerheid is of wanneer minder ervaren medisch personeel de diagnose moeten stellen. Echter, rekening houdend met de vele beperkingen van deze systematische review, is er nog steeds een lange weg te gaan totdat een biomerker panel voor IB diagnose wijdverspreid beschikbaar zal zijn. Meer studies moeten uitgevoerd worden met grotere patiëntengroepen en levensechte controle groepen. Verder moet een consensus worden bereikt over een gestandaardiseerde detectiemethode voor gen-, miRNA- en
1. Introduction
1.1. Definition
Stroke is defined as a “neurological deficit attributed to an acute focal injury of the central
nervous system by a vascular cause”(2). Several types of stroke exist, depending on their
etiology. Stroke can be divided into two large subgroups, ischemic and haemorrhagic strokes (2, 3). Ischemic stroke (IS) accounts for approximately 87% of all stroke incidents, while haemorrhagic stroke accounts for the remaining 13% (4). Ischemic stroke occurs when flow in a vessel is compromised by atherosclerotic plaques on which thrombi form. Thrombi may also be produced elsewhere (for example, in the atria in patients with atrial fibrillation) and pass to the brain as emboli where they then lodge and interrupt the blood flow. Haemorrhagic stroke occurs when a cerebral artery or arteriole ruptures, sometimes but not always at the site of a small aneurysm (3). Based on where the blood vessel erupts, two kinds of haemorrhagic stroke can be differentiated: intracerebral haemorrhage (ICH) and subarachnoid haemorrhage (SAH). Haemorrhagic stroke can be further divided into different subtypes, based on the place where the bleeding occurs: intracerebral haemorrhage (ICH) and subarachnoid haemorrhage (SAH). The definitions given to the different kinds of stroke are as following:
Definition of ischemic stroke: “An episode of neurological dysfunction caused by focal
cerebral, spinal, or retinal infarction” (2).
Definition of haemorrhagic stroke caused by intracerebral haemorrhage: “Rapidly
developing clinical signs of neurological dysfunction attributable to a focal collection of blood within the brain parenchyma or ventricular system that is not caused by trauma” (2).
Definition of haemorrhagic stroke caused by subarachnoid haemorrhage: “Rapidly
developing signs of neurological dysfunction and/or headache because of bleeding into the subarachnoid space (the space between the arachnoid membrane and the pia mater of the brain or spinal cord), which is not caused by trauma” (2).
These definitions are widely accepted and approved by the American Heart Association Science Advisory and Coordinating Committee and are being used by clinicians globally (2).
Furthermore, in a clinical setting a stroke must be differentiated from a transient ischemic attack (TIA) and stroke mimics such as seizures, syncopes, brain tumours and intoxication (5). TIA’s are brief episodes of neurological dysfunction resulting from focal cerebral ischemia without permanent cerebral infarction. Historically, symptoms could last up to 24 hours after symptom onset and it would still be qualified as a TIA. Recent studies however have demonstrated that this threshold was too long. 30%-50% percent of classically defined TIA’s
show brain injury on diffusion-weighted magnetic resonance imaging (MRI) (6). Therefore, alternative definitions have been suggested that did not include the 24 hours time limit (7).
1.2. Prevalence and incidence
To this date, IS remains to be one of the leading causes of death and long-term disability worldwide. Approximately 15 million stroke events occur, per year which are associated with nearly 5 million deaths and 5 million cases of permanent disability worldwide (8). Case fatality rates after all stroke are about 15% at 1 month, 25% at 1 year and 50% at 5 years (9, 10). Based on recently published studies, the age-standardized (to European standard population) incidence of stroke in Europe at the beginning of the 21st century ranged from 95 to 290 /
100.000 per year. A comparison of several studies indicated an East-West and North-South gradient, with higher incidence rates in eastern countries and lower rates in southern countries. These geographical variations could be related to environmental or genetic factors. Furthermore, incidence rates were 1,2 to 2 times higher in men than in women in all European countries. This can probably be attributed to the discrepancy in cardiovascular risk profile between men and women (9).
According to projection studies conducted by the world health organisation (WHO), the future doesn’t look very brightly. Due to the current demographic shift in population (life expectancy keeps on increasing) the incidence of stroke will keep on rising, as the incidence of stroke is closely related to age. The absolute number of patients who will suffer a stroke each year will inevitably continue to rise over the next decades (9). Currently, the proportion of the population aged 65+ accounts for 20% of the total population. By 2050 the elderly will account for 35% of the population (10).
1.3. Risk factors
Risk factors for ischemic stroke can be divided into two groups. Risk factors are either modifiable, something can be done about the risk for stroke occurrence, or non-modifiable, the patient can’t change anything about it.
1.3.1. Non-modifiable risk factors
Non-modifiable risk factors for ischemic stroke are relatively well known, they include age, family history, personal history, sex and ethnicity. After the age of 55, the risk of suffering from a stroke more than doubles every decade (11, 12). Stroke risk also increases if a relative has been diagnosed with stroke at an early age and of course, if the patient already has suffered from an earlier stroke, acute myocardial infarction or a TIA, a recurrent stroke becomes more likely. Africans are twice as likely to die from a stroke as Caucasian people. This can be
explained by the higher incidence of modifiable risk factors in the African American population (11).
1.3.2. Modifiable risk factors
Modifiable risk factors can be further divided into lifestyle risk factors and medical risk factors. Lifestyle risk factors include: an unhealthy diet, sedimentary lifestyle, tobacco and alcohol abuse.
While medical risk factors include: High blood pressure, atrial fibrillation, high cholesterol, diabetes, carotid stenosis and circulation problems. Medical risk factors are directly affected by lifestyle risk factors. For instance, if a person chooses to eat healthier, and stop smoking, this will have a positive effect on his high cholesterol and blood pressure (11).
1.4. Acute stroke diagnosis and treatment
This chapter of the master dissertation will discuss how to handle a patient with stroke like symptoms in the emergency department (ED). Diagnosing an ischemic stroke is a timely matter due to the narrow therapeutic window of 4,5 hours after symptom onset. However, misdiagnosing a patient could have tremendous consequences as well (13). First, we will discuss the initial assessment and differential diagnosis that needs to be considered when a patient with stroke like symptoms presents in the emergency department. Secondly, we will discuss an ideal patient flow. And lastly, we’ll discuss the management and therapy of the patient.
1.4.1. Initial assessment and differential diagnosis
Initial assessment of acute stroke patients should have two major objectives: first, other causes of stroke like symptoms must be ruled out, so called stroke mimics. Secondly, an estimate of the initial stroke onset time needs to be made. This is particularly important as the therapeutic window for ischemic stroke therapy is 4,5 hours (13, 14). To be sure both of these objectives are met, stroke evaluation has 3 important components: anamnesis, clinical assessment and thirdly, laboratory and imaging studies. Laboratory and imaging studies remain the most important diagnostic tool in stroke diagnosis. When an ischemic stroke is suspected, several laboratory and imaging studies are conducted routinely in the ED (13). These laboratory tests can be found in appendix 1. To this date, noncontrast computed tomography (NCCT) remains the cornerstone for suspected stroke patients in the acute setting. NCCT will rule out haemorrhagic stroke and lesions that might mimic acute ischemic stroke such as tumours. The availability and speed make it very useful in the initial evaluation of suspected stroke patients.
Nowadays newer generation multi-slice CT scanners are becoming more readily available, even in peripherally located hospitals. With the use of a rapid injection of intravenous contrast and thin-section helical CT images in the arterial phase, clear images of the cerebral blood vessels can be obtained. With this technique, areas of stenosis or occlusion can be visualised, and aneurysms or other vascular abnormalities can be diagnosed. Conventional brain MRI is impractical in the acute phase of stroke. The test can take up to one hour to complete, which is far too long if you take into consideration that intravenous recombinant tissue plasminogen activator (IV-RTPA) is only considered an effective treatment in the first 4,5 hours after stroke onset. MR diffusion testing however can be conducted within a 10-minute time span and has a better stroke detection rate than standard MRI. It can detect ischemic changes within minutes of stroke onset. A skilled neuroradiologist is often able to predict the progression rate and resolution of strokes with the help of MRI diffusion (15).
1.4.2. Overview on ideal patient flow
The American stroke association (ASA) has released guidelines on the ideal patient timeline in the different stages of diagnosing acute stroke patients (13, 14):
1.4.3. Initial management
The first few hours after stroke symptom onset are of extreme importance. The goal at this time is to reduce infarct volume and to prevent disability or death (13). The focus of the therapy should be administering IV-RTPA in the narrow therapeutic time window, as neurological outcome may be improved by early recanalization therapy. This is why neurologists and other emergency physicians came up with the catchphrase “Time is brain”, to inform the general population about the importance of acting fast (13, 16, 17). Unfortunately, only a small part of IS patients receive IV-RTPA therapy. Most patients with an AIS present later than 4,5 hours after symptom onset in the ED, or some patients have absolute contraindications for IV-RTPA. All these problems led to the development of multimodal intra-arterial thrombolysis (IAT)
Assessment
by
the
emergency
department doctor
Within 10 minutes after arrival
Assessment by the stroke team
Within 15 minutes
Performance of CT scan/ MRI
Within 25 min
Interpretation of CT brain scan within 45
min
Within 45 min
Start of thrombolytic therapy
Within 60 min
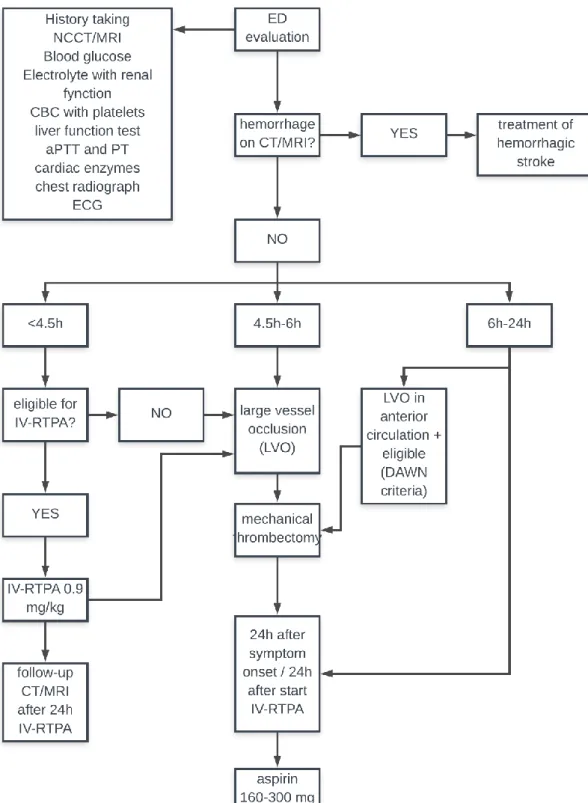
therapies. These IAT therapies include: chemical IAT, combined IV/IAT therapy and endovascular mechanical IAT (mechanical clot retrievers, thromboaspiration, stenting or balloon angioplasty) (13, 18-20). Figure 1 shows a complete algorithm for handling ischemic strokes in the ED.
1.4.4. Limitations of the current stroke management
There are still several shortcomings in the current stroke care. For instance, patient transfer to the nearest hospital with adequate neuroimaging facilities can be rather time consuming. Two solutions have been suggested for this problem: Using mobile stroke units (MSU) to transport the patient (21) or initiating treatment without having a certain diagnosis (22). Administering IV-RTPA to a patient with an uncertain diagnosis is unethical. An ICH is an absolute contraindication for IV-RTPA, as this will only worsen the outcome.
A second issue in the current approach to stroke diagnosis, is the fact that NCCT can only be used to rule out haemorrhagic stroke, but not diagnose IS. NCCT is unable to visualize vascular occlusion and the early signs of cerebral ischemia (23). MRI is a worthy alternative to NCCT. Unfortunately, MRI imaging isn’t widely available and differentiating ischemic stroke from certain stroke mimics may not be possible: other neurological diseases such as Creutzfeldt-Jakob disease or progressive multifocal leukodystrophy may also show high-intensity lesions on diffuse weighted imaging MRI (DWI-MRI), making it impossible to diagnose an ischemic stroke (15, 24). These limitations suggest the need for a diagnostic alternative for ischemic stroke.
1.5. Biomarkers
The term biomarker can be defined as: “A physiological characteristic or substance that is
objectively measured and evaluated as an indicator of normal biological processes, pathogenic processes, or pharmacologic responses to a therapeutic intervention“ (25, 26). This master
dissertation focuses specifically on biomarkers for diagnosis of IS. Biomarkers are currently already being used in the diagnosis of other diseases, for example: human choriogonadotropin can diagnose a pregnancy and cardiac troponins can detect an acute myocardial infarction (27). Many hoped the implementation of troponin would lead the way for a potential stroke biomarker (28), however the brain is a much more complex organ than the heart muscle. Troponin release is directly correlated to the death of myocytes, but the brain consists of multiple kinds of tissue and has a far more complex anatomy than the heart (29). Also, in the differential diagnosis of patients presenting with symptoms of acute myocardial infarction, the others causes are mostly noncardiac conditions (musculoskeletal cause, gastro-intestinal reflux disease, psychological (30). This makes a rise in sudden serum troponins more likely to be caused by a myocardial infarction (27).
Biomarkers aren’t only blood-borne substances. Other categories of stroke biomarkers include physical markers, imaging markers, histological markers, electrophysiological markers and neuronal markers. For instance, hypertension could be a potential physical biomarker to
include in a biomarker panel for stroke diagnosis (26). However, in this master dissertation we limited our search to blood-borne markers to include in our analysis.
For a biomarker to be implemented in a clinical setting, it needs to fulfil a few criteria: it has to have an adequate sensitivity and specificity for diagnosing ischemic stroke, it needs to be cost effective, it needs to have an early and stable release, predictable clearance and measurement of the biomarker must be fast enough to be implemented in the narrow therapeutic time window (31-33).
In the past, numerous substances have been investigated as possible diagnostic biomarkers for stroke. The earliest studies focused on single specific proteins, because these proteins have a known role in stroke pathophysiology. However, when the human genome was sequenced back in 2003, new diagnostic screening tests became available. These tests allowed a large quantity of molecules to be investigated at once instead of single specific markers (31, 34). Suddenly research is not driven, it becomes hypothesis-generating (35). The most important tests are mass spectrometry (MS), microarray and polymerase chain reactions (PCR). MS analyses the masses within a tissue sample. By ionizing a sample, the tissue breaks down in charged fragments. These fragments are then ordered by their mass-to-charge ratio. Then, by accessing a database, these fragments can be identified by correlating them to known masses (36-38). Microarray can detect alterations in DNA sequences. The most common alterations in DNA sequence are single nucleotide polymorphisms (SNPs). SNPs can be the cause of genetic disorders and some of these disorders can cause a stroke (39). These advancements in detecting methods made it possible to investigate other compounds than proteins, such as ribonucleic acid (RNA), miRNA and metabolites.
1.5.1. Genes
Genes studies focuse on the total amount of RNA in a cell or organism. This includes protein-coding, nonprotein-coding, alternatively spliced, polymorphic, sense, antisense and edited RNA transcripts. Concentration levels of the RNA transcripts reflect the actively expressed genes at that moment (39). Meta-analysis studies on gene expression profiles being able to diagnose different forms of cancer have already been published (40, 41). RNA levels are earlier measurable in blood than proteins. Minutes after the vessel occluded RNA expression levels are already increased (42). This makes gene expression levels potentially interesting biomarkers for stroke diagnosis as IS has such a narrow therapeutic window.
1.5.2. MiRNA
MiRNA are a specific subgroup of RNA molecules. Most of them are approximately 22 nucleotides long, single-stranded strings. MiRNA strings play a silencing role in the regulation
of gene expression, they do not code for protein synthesis. Presumably, they regulate at least one-third of the human genome expression and play important roles in various physiologic processes, such as cell differentiation, development, metabolism and apoptosis. Literature suggests that 70 % of MiRNA are expressed in the brain, but only a small list of them is brain-specific (43). .Several miRNA have already been identified as potential biomarkers for some forms of cancer (44-46). Numerous studies have been conducted to determine the value of miRNA as biomarkers for IS (47).
1.5.3. Proteins
Proteins are the most investigated group of molecules as potential biomarkers. As explained in section 1.4., stroke pathophysiology is well known on a protein level. The earliest studies for potential biomarkers were focused on single specific proteins, chosen because of their known role in stroke pathophysiology. The so called hypothesis-driven research method. These markers can be subdivided into brain specific markers, and non-brain specific markers. Brain specific markers include proteins involved in glial or neural cell degradation. Non-specific markers include hemostatic markers, (pro or anti)-inflammatory markers, markers of tissue destruction or indicators of oxidative stress (26).
With the advent of new diagnostic screening tests, a lot of proteins could be sequenced at once. The most important tests for protein testing include enzyme linked immune sorbent assays (ELISA), aptamer-based assays, MS, 2D gel electrophoresis (48).
1.5.4. Metabolites
Metabolites are substances that are intermediate- or end products of metabolic reactions. These substances are generally divided in hydrophilic compounds (sugars, carbohydrates, phosphorylated compounds, organic acids and amino acids) and hydrophobic compounds (fatty acids and membrane lipids). One of the attractive features of metabolite profiling in humans is the relatively small number of human metabolites. The human metabolome consists of approximately 5000 endogenous metabolites and up to 40000 exogenous (food, drugs, environmental contaminants, food additives, toxins and xenobiotics) (49). To put that into perspective, the human genome consists of 25000 genes and the proteome even consists of over 1 000 000 endogenous proteins (50).
1.5.5. Biomarker panel
At present, there is no single biomarker which clinically is useful as diagnostic test for IS. This is probably because of the heterogeneity of IS etiology and the involvement of several pathways in the pathophysiology (31). In addition, many biomarkers associated with ischemia are not stroke specific, and have been associated with other brain injuries or stroke mimics
(51). Therefore, a panel of biomarkers, that each represent a different pathophysiological pathway could be useful in stroke diagnosis (31). These biomarkers could provide information on atherosclerosis, thrombus formation, inflammation, oxidative stress, endothelial injury, blood brain barrier (BBB) disruption and cerebral ischemia (51). Earlier research on possible biomarker panels have shown improved sensitivity and specificity over single biomarkers.
1.6. Essential steps in IS pathophysiology and potential sources of biomarkers
The ischemic stroke pathophysiologic process encompasses a complex series of physiological, biochemical, molecular and genetic mechanisms (12). In this section of the master dissertation, certain essential steps in IS pathophysiology will be discussed and potential sources of biomarkers will be pointed out.1.6.1. Markers of neuronal cell damage
The first step in ischemic stroke pathophysiology is a sudden drop in cerebral blood flow (CBF). In physiologic circumstances the brain receives 20% of the cardiac output at rest. Even a short period of ischemia can trigger a complex cascade that may result in permanent cerebral damage (33). Neurons deprived of oxygen and energy start showing signs of structural injury after only 2 minutes (52). Possible biomarkers for IS could therefore be cytoplasmatic molecules that were able to enter the bloodstream through cracks in the neuronal membranes. A well-researched example is neuron specific enolase (NSE). During physiological circumstances, NSE is a cytoplasmatic molecule involved with regulating intraneuronal chloride levels during neural activity. However, during neuronal hypoxia, NSE is released extracellular, making it detectable in the bloodstream and a possible biomarker for neuronal cell membrane damage (53). Several MiRNAs have also been linked to neuronal cell death. By stimulating key regulators of apoptosis after DNA damage, MiRNAs are able to decrease (or increase in some cases) ischemic neuronal apoptosis (54).
1.6.2. Markers of excitotoxicity
Excitotoxicity is considered to be an essential step for neuronal cell death in stroke. It can be defined as cell death due to toxic actions of excitatory amino acids, primarily glutamate. Although cytotoxic effects of glutamate are mediated through all kinds of glutamate receptors, the N-methyl-d-aspartate (NMDA) glutamate receptors are believed to be the key mediators of cell death during an ischemic insult (55, 56). Activation of these receptors causes an influx of Ca2+ ions into the neuronal cells, causing even more depolarization. Cell depolarization causes
voltage-dependent Ca2+ channels to become activated and even more intracellular Ca2+ and
osmosis, water molecules tend to follow the ions into the neuronal cells through aquaporins, causing swelling of all the cellular elements of the brain. This phenomenon is referred to as cytotoxic edema (57). Once too much Ca2+ ions accumulate inside the cells, certain proteases,
lipases, phosphatases and endonucleases are overstimulated. These enzymes cause extensive cellular damage: cell membrane disruption, DNA fragmentation, mitochondrial dysfunction and oxidative stress (56, 57). MiRNA have been discovered that can influence this process. Previous rat model studies showed that MiRNA-125b targets the NR2A subunit of the NMDA receptors, and negatively regulates its expression level (58). Furthermore, metabolites of glutamate may be potential peripheral biomarkers for excitoxicity during stroke. Glutamate itself cannot easily cross the BB and affect plasma levels. Its metabolites however, such as proline and pyroglutamate, can cross the BBB freely. Studies have already been published that found significant levels of these metabolites in serum samples (59).
1.6.3. Markers of oxidative stress
Oxidative damage has been shown to be a fundamental mechanism of brain and neuronal damage during episodes of ischemia (60).
It occurs when the critical balance between free radical production and endogenous scavenging capacity of cellular antioxidants is disrupted (33, 61). In physiological circumstances, neuronal cells are already prone to oxidative stress due to their high metabolic activity and oxygen consumption (56). In hypoxic circumstances high levels of reactive oxygen species (ROS) are produced due to excitoxicity as explained in section 1.6.2, extramitochondrial enzymes such as NADPH and metabolism of arachidonic acid (56, 62). The most important ROS in ischemic stroke pathophysiology are the superoxide anion (O2-) and
the peroxynitrite radical (56, 57, 61). Once these compounds are produced, they promote lipid peroxidation, DNA damage, protein nitration and oxidation, depletion of antioxidant reserves and breakdown of the BBB (63). Studies have shown that genes encoding for antioxidant enzymes are upregulated at the gene level rodent brains under ischemic circumstances (64). Peroxidation of arachidonic acid, abundant in brain tissue, lead to the formation of F2-isoprostanes (F2Ips) (65).
During an ischemic event, glucose metabolism shifts into the anaerobic pathway. This should lead to an increased level hypoxanthine, pyruvate and uric acid (63).
1.6.4. Markers of inflammation
The inflammatory cascade starts almost immediately after stroke onset. A few minutes after the occlusion, the acute local damage is detected by pattern-recognition receptors (PRR). In response to these pathogen-associated molecular patterns (PAMPs), these receptors send
out host-derived danger signals, so called damage-associated molecular patterns (DAMPs). Damp signals activate the immune system element in various neuronal cells: vasoactive mediators, proteases, tumor necrosis factor alpha (TNF-α) and proinflammatory cytokines (i.e. IL-1, IL-6) are being released (66). Microglia transform into phagocytes and again release TNF-α, interleukin-1β (IL-1β) and IL-6 Astrocytes also start secreting cytokines, chemokines and NO (67). These pro-inflammatory signals are key mediators in the BBB disruption. Beside matrix metalloproteinase-9 (MMP-9) and oxidative stress, the BBB is also disrupted by adhesion molecules, which are regulated by the proinflammatory cytokines. 3 different kinds of adhesion molecule families play a role in BBB dysfunction: selectins, the immunoglobulin superfamily and integrins (57). Subsequently, activated neutrophils, lymphocytes or monocytes transmigrate into the brain parenchyma. (68).
At first, inflammation seems a negative thing due to neuronal death and BBB damage but at the same time, inflammation preserves brain tissue by auto limiting the pathological process and adapting the brain tissue after the insult (66).
1.6.5. Markers of BBB dysfunction
One of the hallmarks of ischemic stroke pathology is breakdown of the BBB. In physiological circumstances the BBB plays a vital role in maintaining the homeostatic environment of the brain. Under pathological conditions, the BBB can be disrupted. When the permeability of the BBB is increased, blood components can leak into the brain parenchyma (57, 69, 70). Matrix metalloproteinases, especially MMP-9, are activated by oxidative stress. These proteinases are capable of cleaving the tight junctions in the BBB (57, 68, 69).
A second way the BBB permeability is increased is by integrin breakdown. Integrins are transmembrane glycoprotein receptors that interact with the basal membrane of the BBB. During ischemic stroke integrins are rapidly degraded, causing BBB dysfunction (68). The consequence of this dysfunction is vasogenic edema. The increased permeability allows high molecular weight molecules to enter the brain parenchyma, passively followed by water due to osmosis. Vasogenic edema can cause secondary damage through increased intracranial pressure (57, 69). The BBB breakdown also seems to be biphasic. The first breakdown, described above, occurs within the first hours after stroke onset. 24 – 72 hours after the insult, a second breakdown occurs. The inflammatory response to the stroke leads to the induction of matrix metalloproteinase-3 (MMP-3) and MMP-9 in neutrophils that transmigrated through the BBB (3, 57, 69).
1.7. Goal of this master dissertation
Up to now, stroke remains to be one of the leading causes of death and long-term disability worldwide. Rapid diagnosis and management decisions are crucial due to the narrow
therapeutic time window. At this time, due to generally available diagnostic neuroimaging, diagnosing IS is most of the time straightforward. In occasions where imaging resources are limited however, blood-based biomarkers for the diagnosis of stroke may be of value. Also, in prehospital settings a reliable blood-based test could be helpful to facilitate early diagnosis and triage patients appropriately, since anamnesis and physical examination alone cannot provide a reliable diagnosis. The goal of this master dissertation is to give an answer to the following research question:
“Which biomarker(s) per group, show the most promise to differentiate IS patients from healthy controls?“
2. Methodology
2.1. Search strategy
A systematic literature search was conducted from 01/01/2000 up to 31/07/2020. Several search strings were prepared in advance and conducted in four well-known medical databases. All search strings consisted of a combination of medical subject headings (MeSH) terms and keywords with appropriate Boolean operators. Medline, EMBASE, google scholar and Web of science were searched. In part 7. Supplementary data, all performed searches are described with their total yield.
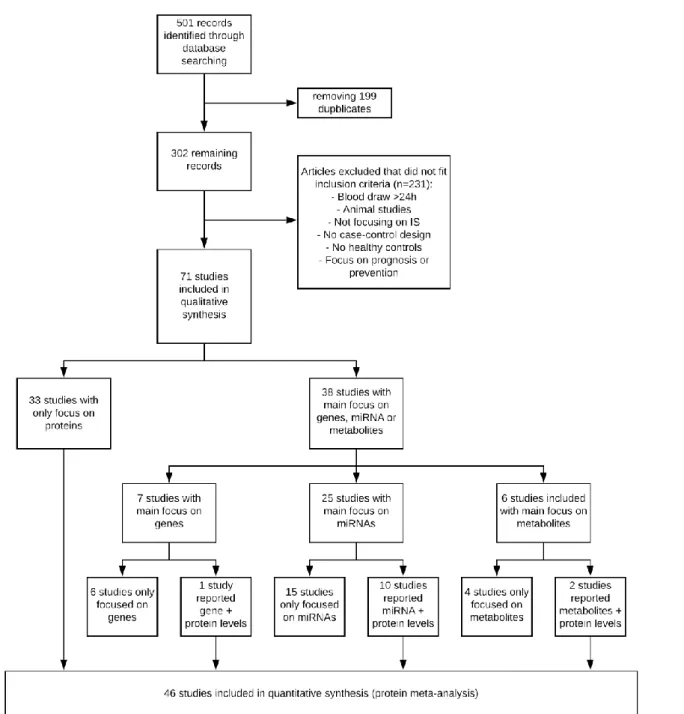
This first compilation of articles was purely based on title and abstract of the article, no articles were read in full at this moment. This preliminary search yielded in total 501 articles: Medline (n = 236), Embase (n = 42), Web of Science (n = 122), Google scholar (n = 101). After eliminating all doubles, 302 articles were read in full to check for eligibility for inclusion in the systematic review. The references of all papers were checked for potential studies that may have been eligible for inclusion as well, the so-called snowball method. In total 71 studies met the inclusion criteria and could be included in the systematic review.
2.2. Inclusion criteria
Studies were eligible to be included into this meta-analysis when they met following inclusion criteria:
1. They had, at least a part, control design. Several studies had a section case-control and a section case-mimics. These are included in this review, as long as data was extractable from the case-control section.
2. Study population consisted of adult humans and not animals. 3. Control population consisted of healthy individuals.
4. Blood samples needed to be drawn within 24 hours of symptom onset. When blood was drawn at several timepoints, the results of the blood draws closest to 24 hours after symptom onset were chosen for analysis.
5. Biomarkers needed to be used for diagnosis of ischemic stroke.
When these inclusion criteria were applied to the 302 found papers, 71 could be used in the systematic review.
Figure 2: Prisma flowchart on article selection.
Of these 71, 33 solely reported protein biomarker levels and therefore could be directly included in the protein meta-analysis. The remaining 38 studies mainly focused on gene, MiRNA or metabolite levels. 13 of these 38 studies also reported several proteins in their study. These protein markers were not the main focus of the study, they did report concentration levels of them rather as patient characteristics instead of actual potential biomarkers. Incorporating these 13 studies in the protein meta-analysis meant that 46 studies could be included.
2.3. Data extraction
Once all studies that met the inclusion criteria had been identified, standardized forms were used to extract data. Each kind of biomarker had its specific form. Out of all studies following characteristics were extracted: Biomarker concentration levels, country of origin, sample size, method of ischemic stroke diagnosis, definition of healthy controls, exact time of blood draw, way of detecting biomarker levels and if applicable normalization/housekeeping genes. When certain data could not be extracted, or was only vaguely described, an attempt was made to contact the authors for clarification. Unfortunately, not all authors could be reached or even answered our request and therefore and certain data are missing in the database.
2.4. Quality assessment
Quality of the included studies was assessed using the Newcastle-Ottowa Scale (NOS) for quality assessment. The NOS is specifically designed for assessing nonrandomized case-control studies for systematic review/ meta-analysis inclusion. Its validity has been established based on a critical review of the items by several experts in the field who evaluated its clarity and completeness for the specific task of assessing the quality of studies to be used in a systematic review (71). It evaluates three quality parameters: selection, comparability of patients and controls, and exposure/outcome. These parameters are evaluated on the basis of 8 questions. Each question is scored from one point. In normal circumstances, the maximum for each study is 9 points, however we choose not to include the question “Is the non-response rate equal for both groups?” as this is not applicable for our included studies. Therefore, the maximum total points a study can acquire is 8. A study that acquires less than 5 points is qualified as a study with high risk of bias (72). The form that was used to examine each study and the individual scores can be viewed in section 7.5 of this master dissertation.
2.5. Statistical analysis
Proteins were the only category of biomarker which had sufficient data for performing a meta-analysis. All analyses were carried out by using Review Manager 5.3 (The Nordic Cochrane Centre, The Cochrane Collaboration, London, UK). All data was extracted using a predetermined form. Biomarker concentrations levels were treated as continuous outcomes. When biomarker levels were presented as medians and interquartile range, the formulas reported by Wan et al (73) were used to make an estimate of the mean and standard deviation (SD). When data was presented as median and range, the formulas reported by Hozo et al (74) were used to make an estimate of the mean and SD. Standard error of the mean was
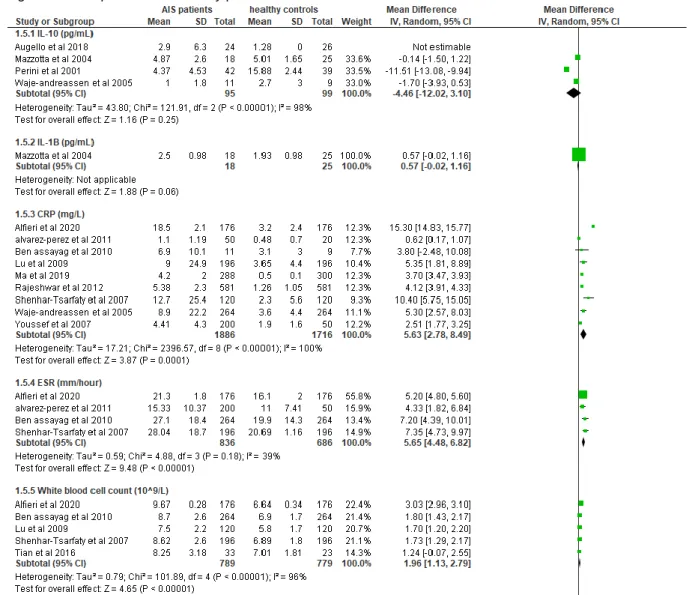
converted to SD data with the help of the Revman calculator function. All biomarkers were converted to their SI-units through an online calculator. Because of this, the mean difference could be calculated as all studies use the same outcome measure for one biomarker, as well as a 95% confidence interval (CI). All analyses are depicted as forest plots, see figure 3 to 8. The x-axis forms the effect scale, plotted on the bottom of the plot. Each row represents a study’s effect size estimate in the form of a cube and the 95% CI. When the CI line does not cross the vertical line of no effect, the results can be considered as significant (75). The 95%CI generated by the combined studies is represented as a black diamond shape. The same principle applies here as in the individual studies. If the edges of the diamond do not cross the vertical line of no effect, the result can be considered as significant. For estimating the extent of heterogeneity between studies, the I² value was calculated. I² is a measure for the proportion of observed variance that reflects real differences in effect size (76). An I² value less of 40% is considered as an index for low heterogeneity. 40%-60% values are considered as moderate heterogeneity between studies and values over 60% represent a substantial amount of heterogeneity, according to the “Cochrane collaboration”. The protein biomarkers are further classified in different subgroups based on their function. 6 different groups could be identified: metabolic, brain specific, endocrine, inflammatory, hemostatic and other protein groups.
3. Results
3.1. Genes
3.1.1 Study characteristics of studies with main focus on gene expression
Study characteristics of gene expression are summarized in table 1 below. The publication years ranged from 2006 to 2019. 4 studies were conducted in the USA (77-80), one in Europe (81) and two in Asia (82, 83). In total, gene expression profiles were examined from 203 IS patients and 131 healthy controls. Several different sorts of detecting and normalization methods have been used to determine the gene expression level: Microarrays, quantitative polymerase chain reaction (qPCR) and reverse transcriptase polymerase chain reaction (RT-PCR) all have different ways of detecting gene levels. Stamova et al (79) tested the same genes discovered by Tang et al (80) in an effort to confirm their findings and improve the power of the research. They increased the cohort size of 15 AIS patients to 70 in which they determined the expression levels of the following genes: Hox 1.11, CKAP4, S100A9, MMP9, S100P, F5, FPR1, S100A12, RNASE2, ARG1,CA4, LY96, SLC16A6, HIST2HAA, ets-2, BCL6,
PYGL and NPL.
Stamova et al (79) and Tang et al (80) were the only studies that drew blood samples at different timepoints within 24 hours after symptom onset. Most genes that differentiated AIS from HC at 3h after symptom onset, stayed differentially expressed at 24 hours after symptom onset.
Only 1 study showed little risk of bias. All other studies showed significant risk of bias according to the modified NOS. The most frequent methodological shortcoming was failure to include consecutive stroke patients and community-based control group subjects. Oh et al (82). was the only study to correct for age, gender and stroke risk factors between AIS and HC.
Table 1: Main characteristics of 7 included studies on gene expression levels.
Author Year Country Sample size Time since symptom onset
Detecting method
Specimen normalization Quality assessment Cases Controls Barr et al (77) 2012 Maryland, USA 39 24 <24 h Microarray qRT-PCR whole blood Beta-actin 3 Grond-Ginsbach et al (81)
2008 Germany 20 15 <24 h microarray PBMC GC-RMA 4
O’Connell et al (78) 2016 Maryland, USA 39 30 Median time 5.3 h Microarray qPCR whole blood B2M, PPIB, ACTB 3 Oh et al (82) 2012 Korea 12 12 <24 h Microarray RT-PCR whole blood quartile method 18s rRNA 6 Pan et al (83) 2019 China 8 4 4 h qRT-PCR Whole blood Beta-actin 3 Stamova et al (79) 2010 California, USA 70 38 <3h, 5h and 24h microarray whole blood RMA internal-gene 4
Tang et al (80) 2006 California, USA 15 8 <3h, 5h and 24h microarray whole blood RMA quantile method 3
Abbreviations: PBMC, peripheral blood mononuclear cells; GC-RMA, genechip robust multiarray averaging; B2m, βeta-2 microglobulin; PPIB,Peptidylprolyl Isomerase B; ACTB, actin beta; rRNA: ribosomal RNA; RMA, robust multi array averaging
3.1.2. Gene expression levels
The results of the systematic review of gene expression profiles is presented in table 2. Genes are ordered alphabetically. Only genes that were significantly differently expressed between groups in at least one study are represented. In total 63 genes were reported to be significantly up or downregulated. Of these 63 only 12 were reported in 2 different studies and 2 (MMP-9 and S100A12) were reported significantly in 3 studies. Relative expression ratios differed a lot between studies. No diagnostic accuracy testing was performed on single genes, therefore no ROC, AUC, sensitivity or specificity data could be extracted.
Table 2: Gene expression profile of single genes.
Genes RER* AUC (95%CI) Sensitivity Specificity Study
ACSL1 2.19 Oh et al (82) AKT2 0.93 Pan et al (83) ANTXR2 1.2 O’Connell et al (78) APLP2 6.31 Grond-Ginsbach et al (81) ARG1 3.5 Barr et al (77) 3.3 Tang et al (80) BCL6 5.01 Grond-Ginsbach et al (74) 2.5 Tang et al (80) BIRC1 2.51 Grond-Ginsbach et al (81) C19orf59 3.83 Oh et al (82) C21orf45 0.16 Grond-Ginsbach et al (81) C5orf21 0.251 Grond-Ginsbach et al (81) CA4 2.12 Barr et al (77) 2.3 Tang et al (80) CCR7 0.48 Barr et al (77) CCRL2 1.03 Pan et al (83) CCL3 1.76 Pan et al (83) CCL3L3 2.14 Pan et al (83) CD151 7.94 Grond-Ginsbach et al (81) CD163 3.98 Grond-Ginsbach et al (81) 1.9 O’Connell et al (78) CD36 6.31 Grond-Ginsbach et al (81) CKAP4 2.0 Tang et al (80) CLC 0.25 Grond-Ginsbach et al (81) COL4A4 0.22 Pan et al (83) CSPG2 2.09 Barr et al (77) 2.51 Grond-Ginsbach et al (81) CTSZ 1.3 O’Connell et al (78) CXCL2 1.48 Pan et al (83) CYBB 7.94 Grond-Ginsbach et al (81) EGR1 2.03 Pan et al (83) EGR2 2.98 Pan et al (83) EOMES 0.45 Oh et al (82) Ets-2 2.1 Tang et al (80) F5 1.99 Grond-Ginsbach et al (81) 2.0 Tang et al (80) FCGR1A 7.94 Grond-Ginsbach et al (81) FLJ22662 1.58 Grond-Ginsbach et al (81) FPR1 2.1 Tang et al (80) GNLY 0.45 Oh et al (82) GNG12 2.05 Pan et al (83) GRAP 0.71 O’Connell et al (78) GUCY1B3 19.95 Grond-Ginsbach et al (81) HIST2H2A 1.9 Tang et al (80) Hox 1.11 2.4 Tang et al (80) ID3 0.63 O’Connell et al (78) IL18R1 2.11 Oh et al (82) IL18RAP 3.40 Oh et al (82) IL1R2 3.21 Oh et al (82) IL3RA 1.68 Pan et al (83) IQGAP1 2.03 Barr et al (77) JUN 1.32 Pan et al (83) KIF1B 1.6 O’Connell et al (78) LOC642103 2.54 Oh et al (82) LTA4H 1.99 Grond-Ginsbach et al (81) LY96 1.8 Barr et al (77) 3.6 Tang et al (80) MAL 0.71 O’Connell et al (78) MGAM 2.48 Oh et al (82) MMP9 2,64 Barr et al (77)
3.40 Oh et al (82) 2.00 Tang et al (80) NKG7 2.05 Oh et al (82) NPL 5.01 Grond-Ginsbach et al (81) 2.2 Tang et al (80) ORM1 2.27 Barr et al (77) PDE4D 0.25 Grond-Ginsbach et al (81) PDK4 1.7 O’Connell et al (78) PPP2CA 0.72 Pan et al (83) PRUNE 5.01 Grond-Ginsbach et al (81) PYGL 2.51 Grond-Ginsbach et al (81) 3.9 Tang et al (80) RNALSE2 7.94 Grond-Ginsbach et al (81) 2.8 Tang et al (80) S100A9 1.9 Tang et al (80) S100A12 2.35 Barr et al (77) 2.51 Grond-Ginsbach et al (81) 2.9 Tang et al (80) SIRPA 3.98 Grond-Ginsbach et al (81) SLC16A6 1.9 Tang et al (80) STK3 1.5 O’Connell et al (78) TJP2 7.94 Grond-Ginsbach et al (81) TLR2 5.01 Grond-Ginsbach et al (81) TRAPPC6 0.20 Grond-Ginsbach et al (81) VASP 0.86 Pan et al (83) XCL1 2.10 Pan et al (83)
Abbreviations: RER, relative expression ratio
*Relative expression ratios are calculated as AIS patients over healthy controls.
MMP-9 was consistently reported as upregulated by Barr et al (77) (Fold change = 2.7), oh et al (82) (Fold change = 3.4) and Tang et al (80) (Fold change = 2). Tang et al drew blood at 3h, 5h and 24 hours after symptom onset. In all 3 data sets, MMP-9 stayed consistently upregulated (fold change 3h = 3.2, 5h = 3.7, 24h = 2.7). Quality assessment of these 3 studies showed that only oh et al (82) had a low risk of bias according to the NOS (6/8). Tang et al (3/8) and Barr et al (3/8) both showed a large risk for possible bias.
S100A12 also was reported as upregulated by 3 independent studies: Barr et al (Fold change = 2.35), Grond-Ginsbach et al (81) (Fold change = 2.51) and Tang et al (80) (Fold change = 2.9). It stayed consistently upregulated withing the first 24h at 3h (Fold change = 2.2), 5h (Fold change = 3.1) and 24h (Fold change = 2.9). Quality assessment of these 3 studies showed that all three had a large risk of bias. Tang et al (3/8), Barr et al (3/8) and Grond-Ginsbach et al (4/8) all had scores lower than 5/9. Several studies tested gene panels as diagnostic tool. These results are presented in table 3 below. no cutoff or AUC values were presented, only sensitivity/ specificity was extractable.
Table 3: gene expression profile of gene panels.
Gene Panel RER* AUC Sensitivity specificity Study
10 gene panel(NTXR2, STK3, PDK4, CD163,MAL,
GRAP, ID3, CTSZ, KIF1B and PLXDC2)
92.3% 100% O’Connell et al (78)
18 gene panel(Hox 1.11, CKAP4, S100A9, MMP9,
S100P, F5, FPR1, S100A12, RNASE2,
ARG1,CA4, LY96, SLC16A6, HIST2HAA,
ets-2, BCL6, PYGL and NPL)
88.9% 100% Tang et al (80)
34 gene panel (OSBPL1,
PHTF1, CKLF, RRAGD, CLEC4E, CKLF, FGD4, CPEB2, LOC100, UBXN2B, ENTPD1, BST1, LTB4R, F5, IFRD1, KIAA031, CHMP1B, MCTP1, VNN3, AMN1, LAMP2, FCH02, ZNF608, REM2, QKI, RBM25, FAR2,ST3GAL, NRNPH, GAB1, UBR5,VAPA, THBD) 87.7% 94.7% Stamova et al (79)
Abbreviations: RER, relative expression ratio
3.2. MicroRNA
3.2.1. Study characteristics of studies with main focus on miRNA expression levels
A summary of the characteristics of the cases and controls included in the 25 studies is presented in table 4. The publication years of these records ranged from 2013 to 2020. In total, miRNA expression levels were examined from 2258 AIS patients and 1526 HC. Most of the studies were conducted in China. Only two studies conducted outside Asia met the inclusion criteria (84) (85). Because of this the dominant ethnicity of patients was Asian. The expression level of miRNA was usually detected by quantitative real-time polymerase chain reaction (qRT-PCR) or microarray. When both microarray and qRT-PCR data were available both were reported. The specimen in which expression levels were determined varied between studies. 10 studies detected expression levels in plasma, 12 in serum, 2 in whole blood and 1 in serum exosomes. Different normalization genes were used to normalise the expression levels. The most common used gene was snRNA-U6. One study conducted by Leung et al used a different format for detecting expression levels. Instead of using a normalization gene they reported their findings in copy number variants (CNV), also known as absolute quantification (86). 5 studies had an inclusion criteria of blood draw within 6 hours after symptom onset (87-91). 15 out of the 25 studies had an NOS score of at least 5/8, indicating a small risk of bias.Table 4:Main characteristics of 25 included studies on microRNA expression levels.
Author Year Country Sample size Time since symptom onset
Detecting method
Specimen normalization Quality assessment Cases Controls
Chen et al (92)
2018 China 30 30 <24h qRT-PCR Serum snRNA-U6 6 Cheng et al
(87)
2018 China 77 42 <6h qRT-PCR Serum snRNA-U6 5
Giordano et al 2019 Italy 18 20 <24h qRT-PCR Plasma syn-cel-lin-39 3
Gui et al (93) 2019 China 87 13 <24h qRT-PCR Serum snRNA-U6 6 Huang et al
(94)
2016 China 346 346 <12h qRT-PCR Serum Beta-actin 6 Ji et al (95) 2016 China 65 66 +-16,5h qRT-PCR Serum
exosomes
cel-mir-39 3 Jia et al (96) 2015 China 146 96 <24h qRT-PCR Serum snRNA-U6 5 Leung et al
(86)
2014 Japan 74 23 <24h qRT-PCR Plasma N/A, absolute quantification 4 Li et al (97) 2015 China 53 50 <24h Microarray qRT-PCR Whole blood syn-cel-lin-39 6
Long et al (98) 2013 China 197 50 24h qRT-PCR Plasma snRNA-U6 6
Ma et al (88) 2018 China 33 20 <6h qRT-PCR Plasma snRNA-U6 5
Peng et al (99)
2015 China 72 51 4,5h < 24h qRT-PCR Serum 18S rRNA 4
Sepramamiam et al (100) 2014 singapore 68 24 <24h Microarray qPCR Whole blood snRNA-U6 3
Tian et al (89) 2016 China 33 23 <6h Microarray qRT-PCR
Plasma cel-mir-54 5
Tiedt et al (84) 2017 Germany 40 40 <24h microarray qRT-PCR
Plasma DESeq2 and EdgeR 5 Wang et al (101) 2014 China 76 116 <24h Microarray qRT-PCR Plasma snRNA-U6 4
Wang et al (90)
2017 China 78 39 <6h qRT-PCR Serum snRNA-U6 5 Wang et al
(91)
2018 china 143 24 <6h qRT-PCR Plasma snRNA-U6 4
Wang et al (102)
2019 China 40 40 <24h qRT-PCR Serum snRNA-U6 4
Wu et al (103) 2015 China 106 120 <24h qRT-PCR Serum snRNA-U6 6
Wu et al (104) 2017 China 50 50 <24h TLDA qRT-PCR
Serum let-7d/g/i 5 Yang et
al(105)
2016 China 114 58 <24h qRT-PCR Plasma snRNA-U6 6
Yang et al (106)
2020 China 76 60 <24h qRT-PCR Serum snRNA-U6 3
Zhao et al (107)
2016 China 168 104 <24h qRT- PCR Serum Cel-mir-39 4
Zhang et al (108) 2014 China 68 21 <24h RT-PCR qRT-PCR Plasma snRNA-U6 cel-mir-39 5
3.2.2. MiRNA expression levels
The miRNAs identified as differentially expressed between controls and stroke patients differs greatly among the studies and are summarized in table 5. 59 miRNAs were reported as significantly differentially expressed of which 18 recurred in at least 2 separate studies. 11 were reported to be strictly downregulated, 41 strictly upregulated and 7 were reported as both. Mir-let-7b, mir-let-7e, mir-16, mir-17-5p, mir-30a, mir-126 and mir-221 were the only miRNA significantly different expressed in 3 separates studies.
20 of the included studies conducted receiver operator characteristic (ROC) analyses to examine the diagnostic potential of several miRNAs. ROC analyses plot sensitivity versus 1-specificity across varying cut-offs generating a curve. This curve is called the ROC curve. The area under the curve (AUC) is an effective and combined measure of sensitivity and specificity that describes the inherent validity of diagnostic tests (109). If AUC = 1, this means that the diagnostic test is perfect in differentiating between the stroke patients and healthy controls (110).
Table 5: MicroRNA expression levels of single microRNA
miRNA RER* AUC (95%CI) Sensitivity Specificity Study Let-7b 3.34 0.93 (0.879-0.98) 84% 92% Long et al (98) 0.70 0.83 (0.76-0.93) 83% 85% Gui et al (93) 0.46 Chen et al (92) Let-7d 1.83 Tiedt et al (84) Let-7i-5p 1.58 Tiedt et al (84) Let-7e 1.36 0.92 (0.86-1) 89% 90% Gui et al (93) UP 0.74 (0.70-0.78) Huang et al (94) UP 0.86 (0.75-0.97) 82.8% 73.4% Peng et al (99) 7-2-3p 2.12 0.87 (0.80-0.95) Gui et al (93) 2.05 0.85 (0.78-0.92) Gui et al (93) 9-3p 4.09 0.80 (0.72-0.89) Ji et al (95) 15a 8.3 0.70 (0.559-0.837) Wu et al (103) 0.57 Chen et al (92) 16 1.33 Leung et al (86) UP 0.78 69.7% 87% Tian et al (89) 4.2 0.82 (0.71-0.931) Wu et al (103) 1.32 Chen et al (92) 17-5p 1.77 Tiedt et al (84) 9.9 0.78 (0.666-0.903) Wu et al (103) 0.93 Chen et al (92) 21 9.85 Chen et al (92) 21-5p 1.77 0.73 (0.667-0.801) Wu et al (104) 0.252 Zhang et al (108) 23a 0.33 Chen et al (92) 0.13 Jia et al (96) 23b-3p 2.45 0.851(0.802-0.899) Wu et al (104) 24-3p 0.29 Zhang et al (108) 27a 3.75 0.89 (0.77-1.01) Sepramaniam et al (100) 27b-3p UP 0.67 (0.53-0.80) 50% 79% Cheng et al (87) 29b 6.0629 Chen et al (92) 29b-3p 1.66 0.79 (0.734-0.848) Wu et al (104) 30a 0.28 0.91 (0.869-0.979) 80% 94% Long et al (98) 0.60 Gui et al (93) 5.7 0.83(0.665-0.998) Wang et al (91) 32-3p 1.57 Li et al (97) 0.57 Chen et al (92) 93 DOWN Ma et al (88) 106-5p 1.74 Li et al (97) UP 0.96 (0.93-0.99) Wang et al(101) 107 2.78 0.97 (0.929-0.991) 94% 92% Yang et al (105) 124-3p 12.05 0.70(0.6506-0.7895) Ji et al (95) 5.09 Wang et al (102) 125a 1.36 0.87 (0.80-0.96) 87% 82% Gui et al (93) 125a-5p 1.8 Tiedt et al (84) 125-b 1.372 0.91 (0.89-0.96) 86% 87% Gui et al (93) 125b-5p 2.54 Tiedt et al (84) 125b-2 1.80 0.95 (0.89-1.02) Sepramaniam et al (100) 126 0.06 0.92 (0.879-0.978) 84% 92% Long et al (98) 0.54 Gui et al (93) 0.54 Chen et al (92) 126-5p 1.99 Tiedt et al (84) 128b 1.83 0.90 (0.853-0.953) 73% 92% Yang et al (105) 130a-5p 3.73 Tiedt et al (84) 134 DNE 0.83 (0.88-0.97) Zhou et al (111) 135b 4.2 0.78 (0.69-0.87) 79% 65% Yang et al (106) 143-3p 1.44 Tiedt et al (84) 145 5.28 Chen et al (92) 3.48 Jia et al (96) 146b 13.93 0.78 (0.628-0.813) Chen et al (92) 148b-3p DOWN 0.66 (0.49-0.84) 51% 80% Cheng et al (87) 151b UP 0.69 (0.54-0.83) 43% 93% Cheng et al (87) 153 2.13 0.89 (0.837-0.950) 91% 74% Yang et al (105) 181a-5p 1.39 Tiedt et al (84) 1.45 0.68 (0.608-0.76) Wu et al (104) 195-5p 4.59 Giordano et al (85) 221 0.14 Chen et al (92) 0.07 Jia et al (96)
DNE 0.81 (0.73-0.90) Wang et al (90)
320d 0.07 0.99 (0.972-1) Wang et al(101)
320e 0.13 0.98 (0.963-1) Wang et al(101)
335 DOWN 0.90 (0.86-0.93) 97.6% 69.2% Zhao et al (107) 0.26 Gui et al (93) 378a-3p 1.23 Tiedt et al (84) 382-5p DNE 0.75 (0.63-0.87) Wang et al (101) 0.53 Gui et al (93) 422a 0.002 0.92 (0.82-1.02) Sepramaniam et al (100) 423-3p 2.14 Tiedt et al (84) 451 7.06 Giordano et al (85) 488 2.12 0.87 (0.75-1) Sepramaniam et al (100) 532-5p 0.37 Li et al (97) 1.54 Tiedt et al (84) 627 3.99 0.54 (0.7-0.98) Sepramaniam et al (100) 920 3.48 0.81 (0.68-0.94) Sepramaniam et al (100) 1246 1.93 Li et al (97) 1908 0.386 0.81 (0.73-0.88) Gui et al (93) 0.653 0.79 (0.72-0.87) Gui et al (93)
Abbreviations: RER, relative expression ratio; AUC, area under curve *Relative expression ratios are calculated as AIS patients over healthy controls.
Mir-let-7b expression levels were reported as significantly by three independent studies ((92, 93, 98), twice downregulated and once as upregulated. Quality assessment of these studies showed that all 3 had a low risk for potential bias: long et al 6/8, Huang et al 6/8 and Peng et al 6/8 as well.
Mir-let-7e expression levels were reported as significantly by three independent studies (93, 94, 99), three times as upregulated. All three studies also performed ROC analysis, reported AUC values of 0.92, 0.74 and 0.86. Average time of blood draw was less than <12 hours in the study conducted by Huang et al, which shows that mir-let-7e is consistently elevated in the first 24 hours. Unfortunately, no study has expression levels earlier than 12 hours after symptom onset. Quality assessment of these studies showed that 2 of these had low risk and 1 had high risk of bias: Gui et al 6/8, Huang et al 6/8 and Peng et al 4/8.
Mir-16 expression levels were reported as significantly by four independent studies (80)(84)(86)(92), four times as upregulated. Two of these studies also performed ROC analysis, reporting AUC values of 0.78 and 0.82. Average time of blood draw was less than 6 hours in the study conducted by Tian et al, which suggest mir-16 might be a potential biomarker to use in clinical practice within the therapeutic window. Quality assessment of these studies showed that 3 of these had low risk and 1 had high risk of bias: Chen et al 6/8, Leung et al 4/8, Tian et al 5/8, and Wu et al 6/8.
Mir-17-5p expression levels were reported as significantly by three independent studies (85)(86)(92). Two times as upregulated, one time as downregulated. No explanation could be found why this differed between studies. One study performed ROC analysis, reporting an AUC value of 0.78. Quality assessment of these studies showed that 2 of these had low risk and 1 had high risk of bias: Chen et al 6/8, Tiedt 5/8 and Wu et al 6/8.
Mir-30a expression levels were reported as significantly by three independent studies (98) (93) (91). Two times as downregulated, one time as upregulated. Wang et al (91) drew blood at <6
hours since symptom onset, and at 24h-72h. In these samples mir-30a was also downregulated instead of up. Possibly, upregulation of mir-30a is specific for the first few hours after stroke onset. Two studies performed ROC analysis, reporting AUC values of 0.91 and 0.83. Quality assessment of these studies showed that 2 of these had low risk and 1 had high risk of bias: long et al 6/8, Gui et al 6/8 and Wang 4/8.
Mir-126 expression levels were reported as significantly by three independent studies (98) (92, 93), three times as downregulated. One study performed ROC analysis, reporting an AUC value of 0.92. Quality assessment of these studies showed that all 3 of these had low risk of bias: long et al 6/8, Gui et al 6/8 and Chen 6/8.
Mir-221 expression levels were reported as significantly by three independent studies (90, 92, 96), three times as downregulated. One study performed ROC analysis, reporting an AUC value of 0.92. Average time of blood draw was less than 6 hours in the study conducted by Wang et al, which suggest mir-221 might be a potential biomarker to use in clinical practice within the therapeutic window. Quality assessment of these studies showed that all 3 of these had low risk of bias: Chen et al 6/8, Jia et al 5/8 and Wang et al 5/8.
3 of the included studies conducted ROC analyses on panels of miRNA biomarkers. These results can be found in table 6. Tiedt et al (84) reported results on 2 different panels. The first panel consisted of mir-125a-5p, mir-125b-5p and mir-143-3p. These 3 miRNAs were earlier identified as significantly different expressed in the discovery step of the study. This biomarker panel was able to distinguish patients from controls with an AUC of 0.927. The second panel consisted of the same 3 miRNA + mir-let7d-3p + mir-126-5p + mir-423-3p. the biomarker panel had an AUC value of 0.834. Wu et al tested a different 3 miRNA panel. First, they tested the miRNA individually, this yielded AUC values of 0.698, 0.82 and 0.784 for mir-15a, mir-16 and mir-17-5p respectively. When combined, a synergistic effect could be observed: the panel had an AUC value of 0.845. Wu et al (104) tested a panel that consisted of mir-23b-3p + mir 29b-3p + mir-181a-5p + 21-5p. They reported an AUC of 0.883. Furthermore, Chen et al tested several combinations of mir-148b, mir-27-3p and 151b (92).
Table 6: MicroRNA expression profile of microRNA panels.
3.3. Proteins
3.3.1. Study characteristics of studies with main focus on protein expression levels
Study characteristics of studies with the main focus on proteins are summarized in table 7 below. In total 46 studies are included in the meta-analysis, however 13 of them were focusing other groups of biomarkers and therefore their study characteristics are discussed elsewhere. Using the mean and standard deviation (SD) of each reported biomarker, a meta-analysis could be performed. The publication years ranged from 2001 to 2020. 13 studies were conducted in Europe, 13 in Asia, 2 in South-America, 2 in Africa and 3 in North-America. In total, protein expression levels were examined from 4139 IS patients and 3371 healthy controls. As all proteins were detected using specific analyzers, ELISA techniques or immunoassays, there was no need for normalization genes.Several studies measured certain protein biomarkers several times within 24 hours after symptom onset to evaluate the progression within the first few hours (112-115).
19 of the 33 studies showed little risk of bias according to the modified NOS (113, 114, 116-132). The most common shortcoming was failure to include consecutive stroke patients. Alfieri et al (117), Kelly et al(114) and Ning et al(113) showed almost no risk of bias according to the NOS.
Table 7:Main characteristics of 33 included studies on protein expression levels.
Author Year Country Sample size Time since symptom
onset
Detecting method
Specimen normalization Quality assessment Cases Controls
Ageno et al (133)
2002 Italy 26 21 <24h D-dimer assay Plasma 3
Alfieri et al (117)
2020 Brazil 176 176 <24h ELISA/ auto-analyzers
Serum 7
Algin et al (116)
2019 Turkey 75 28 <4h ELISA Serum 5
miRNA AUC (95%CI), Sensitivity specificity Study
125a-5p +125b-5p + 143-3p 0.927 Tiedt et al (84) 125a-5p +125b-5p + 143-3p + let-7d-3p + 126-5p + 423-3p 0.834 Tiedt et al (84) 15a +16+17-5p 0.845(0.74-0.949) Wu et al (104) 23b-3p + 29b-3p + 181a-5p + 21-5p 0.883 (0.84-0.93) Wu et al (104) 148b + 151b 0.73 (0.59-0.87) Cheng et al (87) 148b+27b-3p 0.81 (0.70-0.92) Cheng et al (87) 151b+27b-3p 0.7143 (0.58-0.85) Cheng et al (87) 148b+151b+27b-3p 0.77 (0.65-0.89) Cheng et al (87)


![[Review of: Boudewijn Bakker (2004) Landschap en Wereldbeeld. Van Van Eyck tot Rembrandt] - recensie bakker](data:image/gif;base64,R0lGODlhAQABAIAAAP///wAAACH5BAEAAAAALAAAAAABAAEAAAICRAEAOw==)