BUSINESS INTELLIGENCE: CRITICAL
SUCCESS FACTORS
ANALYSIS OF MODERATING FACTORS
Aantal woorden / Word count: 20578Eliz Gottschall
Stamnummer / student number : 01509196
Promotor / supervisor: Prof. Dr. Steve Muylle
Commissaris / Commissioner: Nils Van den Steen
Masterproef voorgedragen tot het bekomen van de graad van:
Master’s Dissertation submitted to obtain the degree of:
Master in Business Engineering: Data Analytics
i
PERMISSION
I declare that the content of this Master’s Dissertation may be consulted and/or reproduced, provided that the source is referenced. Name student: Gottschall Eliz
ii
ABSTRACT
This study aims to determine and validate the critical success factors that influence the success of a BI project and to analyze the effect of moderating variables in this context. Success is defined as the perceived net benefits, based on the D&M IS Success Model by DeLone & McLean (2003). A conceptual framework of ten success factors was proposed based on a review of the existing literature. The ten success factors that are examined are management support, vision, strategic alignment, project teams, deployment approach, user involvement, change management, project manager, resources, and data quality. For the analysis of these success factors, data was collected from 118 usable survey responses of respondents from 33 countries around the world. The theoretical model was tested using structural equation modeling. Two significant success factors were identified for a general-purpose BI project: management support (positive effect) and data quality (negative effect). Significant differences in success factors were found based on specific applications for the BI project (performance management, sales intelligence, reporting, or visualization) and based on the size of the company (small, medium, or large). This finding suggests that instead of using a general BI model, the success factors should be determined specifically based on project and company characteristics.
KEY WORDS
iii
IMPACT OF CORONA
The outbreak of the Coronavirus has not significantly affected this dissertation. The data collection process was not hindered as the data was collected online.
iv
ACKNOWLEDGEMENT
First of all, I would like to thank Steve Muylle and Nils Van den Steen, for guiding me and giving me the opportunity to learn more about Business Intelligence. I would especially like to thank Nils Van den Steen for his valuable input and thoughtful comments that has led me through the work with the thesis. I would not have been able to achieve the final result without his guidance.
I would also like to give special thanks to all the survey participants that made this thesis possible. The data collection could not have been accomplished effectively without their enthusiastic engagement and input.
Finally, I must express my profound gratitude to my parents and to my boyfriend for providing me with all their support and understanding throughout my years of study and through the process of researching and writing this thesis.
v
Table of contents
1 Introduction ... 1
2 Literature review ... 2
2.1 What is business intelligence ... 2
2.1.1 Definition ... 2
2.1.2 Evolution ... 3
2.1.3 The difference between business intelligence and business analytics ... 5
2.1.4 Evolution of BI&A ... 5
2.1.5 Benefits of business intelligence ... 6
2.2 How business intelligence works... 8
2.2.1 Data sources ... 9
2.2.2 ETL and data integration tools... 9
2.2.3 Data warehouse ... 9
2.2.4 BI tools... 10
2.2.5 Analytic applications (front-End applications)... 10
2.3 BI application domains... 11
2.4 BI project success or failure ... 12
2.4.1 D&M IS Success Model ... 12
2.4.2 Net benefits ... 12
2.5 Critical success factors ... 12
2.5.1 Studies that identify BI CSFs ... 13
2.5.2 Case studies ... 19
2.5.3 Gaps in the literature ... 22
3 Development of hypotheses ... 24 3.1 Dependent variable ... 25 3.2 Independent variables ... 25 3.3 Moderator variables ... 25 3.3.1 Sector ... 26 3.3.2 Country ... 26 3.3.3 Company size ... 26 3.3.4 Type of BI application ... 27 4 Research methodology ... 28 4.1 Choice of method ... 28
4.1.1 Qualitative versus quantitative method ... 28
vi
4.1.3 Primary versus secondary data ... 28
4.1.4 Experiments versus observations versus communication methods ... 28
4.1.5 Survey versus interview ... 28
4.1.6 Analytic versus descriptive survey ... 29
4.1.7 Survey versus case study ... 29
4.1.8 The choice of statistical method for data analysis ... 29
4.2 Target population ... 30
4.3 Sample size ... 31
4.4 Instrument ... 32
4.5 Survey structure ... 34
4.6 Survey delivery method ... 35
4.7 Sample Shaping ... 36
4.8 Demographics of respondents ... 36
4.8.1 Number of respondents per continent ... 36
4.8.2 Number of respondents per country ...37
4.8.3 Main application focus of BI ...37
4.8.4 Job description of respondents ... 38
4.8.5 Working experience of respondents ... 38
4.8.6 Age of company ... 39
4.8.7 Industry ... 39
4.8.8 Number of employees... 40
4.8.9 BI tool used ... 40
5 Analysis and results ... 42
5.1 Data cleaning ... 42 5.1.1 Variable coding ... 42 5.1.2 Assumption of normality ... 42 5.2 Measurement validation ... 42 5.2.1 Construct reliability ... 42 5.2.2 Validity ... 44 5.2.3 Multicollinearity ... 45 5.3 Hypothesis testing ... 45
5.3.1 Model with general net benefits and without moderators ... 45
5.3.2 Model with net benefits per application without moderators ... 48
5.3.3 Model with general net benefits and with moderators ... 48
5.3.4 Summary of hypothesis testing results ... 53
vii
6.1 Findings and interpretations ... 54
6.1.1 Finding 1: Two success factors were found that have a significant effect on perceived net benefits ... 54
6.1.2 Finding 2: Data quality has a significant negative effect on perceived net benefits ... 55
6.1.3 Finding 3: Management support has a significant positive effect on perceived net benefits ... 56
6.1.4 Finding 4: Significant differences were found between different application focuses ... 57
6.1.5 Finding 5: Significant differences were found between different company sizes ... 57
6.1.6 Finding 6: No conclusions can be made about the differences between continents and sectors ... 57
6.2 Implications for theory... 58
6.3 Implications for practice ... 58
6.4 Limitations and future research ... 59
6.4.1 Larger and unbiased sample ... 59
6.4.2 Search for other success factors ... 59
6.4.3 Further investigate the effect of the moderating variables ... 59
7 Conclusion ... 60
8 Bibliography ... 61
9 Appendix ... 66
9.1 Appendix 1: Overview of the CSFs in the literature ... 66
9.2 Appendix 2: Overview of different critical success factors used in BI readiness assessment studies ... 75
9.3 Appendix 3: Sample size recommendation in PLS-SEM models (Hair et al., 2013) ... 78
9.4 Appendix 4: Instruments per CSF and their respective survey questions ... 78
9.5 Appendix 5: Survey questions ... 79
9.6 Appendix 6: Other applications focuses of BI mentioned by respondents ... 88
9.7 Appendix 7: Other job descriptions mentioned by respondents ... 88
9.8 Appendix 8: Other BI tools used by respondents ... 89
9.9 Appendix 9: Coding of survey responses to numeric for PLS-SEM input ... 90
9.10 Appendix 10: Descriptive statistics of the sample dataset ... 93
viii
List of Tables
Table 1: Overview of the existing literature on the identification of BI CSFs ... 14
Table 2: Overview of critical success factors for BI implementation in literature ... 16
Table 3: An overview of the different studies related to BI readiness assessment ... 20
Table 4: List of largest countries per continent, source: (“Population > World - Worldometer,” n.d.). ... 31
Table 5: The constructs used in the survey and its sources ... 33
Table 6: Overview of the survey ...35
Table 7: Cronbach’s Alpha of the sample dataset ... 44
Table 8: Heterotrait-Monotrait ratios of the sample subset ... 44
Table 9: Inner VIF of the sample subset ... 45
Table 10: Path coefficients of the inner model with the bootstrapped significances ...47
Table 11: Effect size (f² ) ...47
Table 12: Path coefficients of the model per application ... 48
Table 13: coefficients and p- values for each of the CSFs and the interaction effect with each of the continents ... 49
Table 14: coefficients and p- values for each of the CSFs and the interaction effect with each of the company sizes ... 50
Table 15: coefficients and p- values for each of the CSFs and the interaction effect with each of the sectors ...51
Table 16: coefficients for each of the CSFs per subset by continent ... 52
Table 17: coefficients for each of the CSFs per subset by company size ... 52
Table 18: coefficients for each of the CSFs per subset by sector...53
Table 19: Summary of the hypothesis testing ...53
ix
List of Figures
Figure 1: Business-driven definition of BI visualized (Williams, S., & Williams, 2007) ... 3
Figure 2: The process of deploying BI past the asset creation phase (Williams, S., & Williams, 2007)... 4
Figure 3: Overview of BI&A evolution, applications and emerging research (Chen et al., 2012) ... 5
Figure 4: The nature of Strategic, Tactical, and Operational Benefits (Gibson & Arnott, 2002) ... 6
Figure 5: Overview of the strategic, tactical and functional benefits of BI (“Business Intelligence- The Missing Link,” 2000) ... 7
Figure 6: The relationship between BI functions, decision support benefits and organizational benefits (Rouhani et al., 2016) ... 8
Figure 7: Phases of BI projects (Bordeleau et al., 2009) ... 8
Figure 8: the BI architecture (“IDC,” 2005) ... 9
Figure 9: OLAP or multidimensional data analysis (Chaudhuri et al., 2011) ... 10
Figure 10: The D&M IS Success Model (DeLone & McLean, 2003) ...12
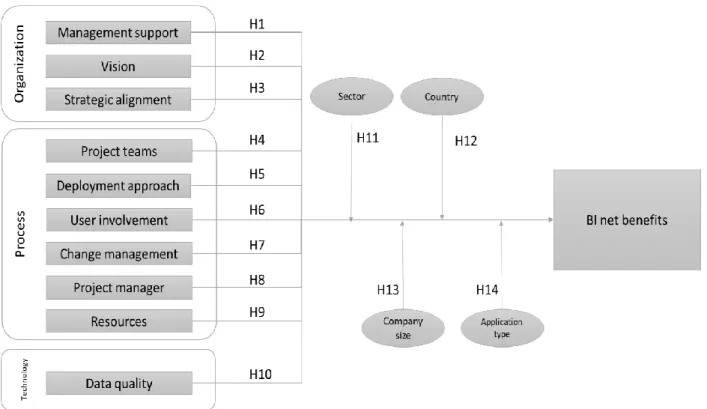
Figure 11: Conceptual model of CSFs for BI net benefits ... 24
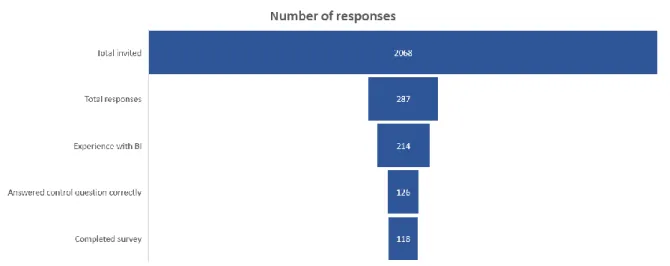
Figure 12: Number of survey responses ... 36
Figure 13: Number of respondents per continent ... 37
Figure 14: Number of respondents per country ... 37
Figure 15: Main application focus of BI ... 38
Figure 16: Job description of respondents ... 38
Figure 17: Years of working experience in current job position ... 39
Figure 18: Age of company ... 39
Figure 19: Industry that respondents work in ... 40
Figure 20: Number of employees in the company ... 40
Figure 21: What BI tools were used ... 41
Figure 22: Output of the PLS algorithm ... 46
Figure 23: Number of successful and unsuccessful BI projects of respondents ... 54
x
List of Abbreviations
BI Business Intelligence
BI&A Business Intelligence And Analytics
BIS Business Intelligence System
CRM Customer Relationship Management
CSF Critical Success Factor
DSS Decision Support Systems
DW Data Warehouse
EIS Executing Information Systems
ERP Enterprise Resource Planning
ETL Extract-Transform-Load
IS Information Systems
KPI Key Performance Indicator
OLAP Online Analytical processing
PLS Partial Least Squares
RDBMS Relational Database Management Systems
ROI Return On Investment
SCM Supply Chain Management
SEM Structural Equation modeling
1
1 Introduction
Business Intelligence (BI) is considered a top technology to invest in globally. Nowadays, data is being collected at an incredible speed and magnitude, and the time for planning and decisions is being reduced by intense competition and customer demands (Eder & Koch, 2018). In this environment, BI can offer many benefits for organizations by allowing managers and decision-makers to make accurate, timely, and relevant decisions (Zaied, Grida, & Hussein, 2018). In the last decade, organizations increasingly invested in BI projects for decision support, performance improvement and enhancement of their competitive advantage (Eder & Koch, 2018; Magaireah, Sulaiman, & Ali, 2017). The IBM Tech Trends Report of 2011 has shown that BI is in the top four technology trends of the period the 2010s (Luftman et al., 2013; Magaireah et al., 2017).
Despite these benefits, BI projects are still considered risky. Garcia, J.M.V. and Pinzon (2017) state that in practice, a large proportion of BI projects fail. This proportion of failure is between 40% to 80%, depending on the type of BI project, the definition of failure, and how it is measured (Beckerle, 2008; Castelán, Hernández, & Octavio, 2010; Ortega, 2013). The success of BI initiatives depends on various factors. Multiple authors state that failure is caused by the organizations not identifying, understanding and managing the critical success factors (CSFs) which influence BI success (Adamala & Cidrin, 2011; Isik, Jones, & Sidorova, 2011; Ravasan & Savoji, 2014; Visinescu, Jones, & Sidorova, 2017; Yeoh, Koronios, & Gao, 2008; Yeoh & Popovič, 2016)
If it were possible to assess the chances of success before the start of the BI project, this would have two practical benefits. Firstly, it would prevent that projects get started that score low on the success factors and thereby have a high chance of failure. Secondly, it would lower the entry barriers to BI for smaller companies. This is because the current failure rate of above 50% prevents smaller companies from attempting these types of projects (Adamala & Cidrin, 2011).
The purpose of this thesis is to identify the factors that distinguish successful BI projects from unsuccessful ones and determine the effect that each of these factors have on the success of the project. BI is a relatively new research topic, and its theoretical foundations still need to be developed. While the CSFs for BI success have been researched abundantly, the findings are not yet at a satisfactory level, meaning that there most likely still are unidentified CSFs (Magaireah et al., 2017). There is no model available proven to be applicable in general for all BI projects (Adamala & Cidrin, 2011). Only limited studies focused on measuring and explaining the influence of CSFs on BI success (net benefits). No studies could be found which controlled for moderating variables, indicating a gap in the literature for a study that measures the influence of these moderators (de Jager, 2017; Hejazi, Abdolvand, & Rajaee Harandi, 2016). This study aims to fill this gap in the literature. The main research question is:
“Is the relationship between CSFs and the BI net benefits affected by moderating variables?”
This study will be structured as follows: first, a conceptual model is developed from the existing literature. This model shows the CSFs for BI implementation success, its relationships to BI net benefits, and the effect of the moderator variables on this relationship. Then, a quantitative study is conducted to measure the influence of the BI CSFs on BI net benefits. Lastly, the effect that the moderating variables have on the relationship between BI CSFs and BI net benefits are analyzed.
2
2 Literature review
2.1
What is business intelligence
2.1.1
Definition
Following the definition of Chaudhuri et al. (2011), business intelligence (BI) can be defined as: “a collection of decision support technologies for the enterprise aimed at enabling knowledge workers such as executives, managers, and analysts to make better and faster decisions” (p. 1).
Watson & Wixom (2007) emphasize that collecting data (getting data in) offers limited value to a company, only when this data can be accessed and used to make decisions (getting data out) does full value get realized. This second activity is referred to as BI. BI is a broad concept; it is an organized and systematic process whereby relevant internal and external information is collected, integrated, analyzed, and circulated (Bordeleau, Mosconi, & Eulalia, 2009; Lönnqvist & Pirttimäki, 2006). By using BI, the organization is committed to use the information available as effectively as possible with the goal of having quality information available at the right moment for effective decision making. This improved decision making results in competitive advantages (Hočevar & Jaklič, 2010; Visinescu et al., 2017). Williams, S., & Williams (2007) lists the three key characteristics of BI:
• Used within a context of key business processes • Supports decisions and actions
• Leads to improved business performance
It is interesting to note that these definitions define BI from a business perspective, rather than from a technical perspective. This clarifies that BI is not a technical term, but rather a combination of tools, techniques, processes, people and technology that helps achieve business goals by assisting in the decision-making process (Dawson & Van Belle, 2013; Williams, S., & Williams, 2007). This business-driven definition is illustrated by figure 1, where it can be seen that the driving force behind BI is gaining competitive advantage, which can be in the form of increased sales, reduced costs, or increased profits (Williams, S., & Williams, 2007).
3
Figure 1: Business-driven definition of BI visualized (Williams, S., & Williams, 2007)
2.1.2
Evolution
In recent years, the use and availability of business intelligence products and services have increased dramatically. Today, it is difficult to think of a successful company that has not yet made use of BI technology to improve its business. This growth has been made possible first of all by the declining cost of both acquiring and storing vast amounts of data. Additionally, the availability of an ever-increasing amount of data that can be collected has accelerated this growth. This is the so-called ‘Big Data challenge’, being the increased desire to architect low-cost data platforms that can handle a much larger amount of data than the traditional RDBMSs (Relational database management systems) can (Chaudhuri et al., 2011). In this big data world, companies are continually looking for the best ways to leverage this available data to make better decisions (Visinescu et al., 2017).
The term business intelligence might be an IT buzzword, but the concepts within it are barely new. BI approaches have evolved over the decades. For example, Decision support systems (DSS) and Executing information systems (EIS) can be considered as early versions of BI (Williams, S., & Williams, 2007).
Williams, S., & Williams (2007) mentioned at that time that: "Information technology so far has been a producer of data rather than a producer of information" (p. 9). He states that the principal investments in the 1990s were in transactional IT. The main objective of these investments was better control over more efficient day-to-day operations. Examples of this type are ERP systems (enterprise resource planning), SCM systems (supply chain management), and CRM (customer relationship management) systems.
Because they did not have systems to combine and store the blizzard of data generated by transactional IT systems, companies started to implement data warehousing (DW) systems. These allowed them to have access to corporate information that is necessary for reporting and data analysis (Beckerle, 2008). The focus was mostly on increasing the efficiency of loading, integrating, and storing large quantities of data (Williams, S., & Williams, 2007).
As the technical aspects became well-understood and companies have large databases filled with transactional data, it is up to BI to extract the information out of it that is critical to the business. There can be more focus on how business value can be obtained from BI to make sure that these investments pay off (Gibson & Arnott, 2002). At the start of the 21st century, many organizations limited their usage of these
4 started to question the business value of these substantial investments. These doubts were for a large part answered by the emergence of business intelligence, as it provided better information to analyze and measure business performance. This process is illustrated in figure 2, highlighting the importance of going past the phase of the technical aspects of the BI project (BI asset creation phase) and reaching the phase of creating business value (value capture phase) (Williams, S., & Williams, 2007).
Figure 2: The process of deploying BI past the asset creation phase (Williams, S., & Williams, 2007)
Therefore the main limitation of DW projects was that they did not systematically analyze the available business data to impact profit and performance. In other words, they did not focus on return on investment (ROI) when they designed these systems. This limitation led to these investments not being profitable in terms of business value (Visinescu et al., 2017; Williams, S., & Williams, 2007). It has been stressed by multiple authors (Hočevar & Jaklič, 2010; Visinescu et al., 2017; Williams, S., & Williams, 2007) that it is essential to focus on the ROI of the BI program from the very beginning of designing the project. Additionally, Williams, S., & Williams (2007) mentioned that in order to get the best return on investment from a BI project, it must be adapted to each company and situation. It must be determined for each case individually what kinds of business information, business analyses, and business decisions that BI must deliver or enable. In other words, the way that BI creates business value must be specified for each situation separately.
This focus on value creation is especially important now, at the start of Industry 4.0. With the emergence of technologies such as sensors, communication protocols, cloud computing, cyber-physical systems, additive manufacturing, business intelligence and big data, a vast volume of technical data is generated that needs to be processed. As the classical BI architecture based on data warehouses alone is not able to process unstructured or vast amounts of data in real or near real-time, the discipline of BI needs to be transformed to fit this new technological environment. Now more than ever, it becomes essential to focus on the desired value creation at the start of the project. In the face of the harsh competitive and economic environment, there needs to be clarity of how the usage of the data will lead to improved business performance.
Additionally, to be able to handle these massive amounts of data, the process of integrating and analyzing needs to happen ideally in an automated way. The authors mention however that most projects failed to measure and demonstrate how their projects created business value. The explanation given for this was that current research on the topic is led by technically-focused engineering schools, which creates opportunities for business intelligence research (Visinescu et al., 2017).
5 According to Williams, S., & Williams (2007), the following steps should be taken in order to implement BI successfully: first of all, the organization’s strategic drivers and goals have to be understood. After that, the business questions need to be stated, which BI needs to answer in order to achieve the organization’s goals. Lastly, the tools, methods, and analytical frameworks to inform decisions and measure performance must be identified. From this, actions can be taken to improve performance.
2.1.3
The difference between business intelligence and business analytics
Companies perform business analytics as a part of their business intelligence strategy. Business analysis is a component of business intelligence and will be used interchangeably in this paper. According to Gartner (2016)’s IT glossary, business analytics “is comprised of solutions used to build analysis models and simulations to create scenarios, understand realities and predict future states. Business analytics includes data mining, predictive analytics, applied analytics and statistics, and is delivered as an application suitable for a business user” (Gartner, 2016).
2.1.4
Evolution of BI&A
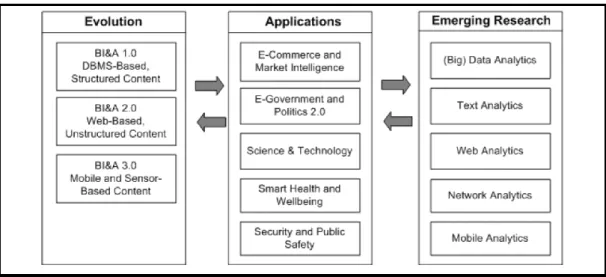
Chen, Chiang, & Storey (2012) describe the evolution of business intelligence & analytics (BI&A) and thereby make a distinction between BI&A 1.0, BI&A 2.0, and BI&A 3.0.
BI&A 1.0
BI&A has its roots in the database management field, where it relied mostly on various data collection, extraction, and analysis technologies. BI&A 2.0
With the emergence of the Internet and the Web, many opportunities arose for unique data collection, making it possible to understand customers’ needs and to identify new business opportunities. Furthermore, web intelligence, web analytics, and collected user-generated content have facilitated a new era of research centered on text and web analytics for unstructured web content.
BI&A 3.0
The emergence of the mobile and sensor-based era as well comes with new research challenges and opportunities. Figure 3 visually presents the evolution, applications, and emerging research of BI&A.
6
2.1.5
Benefits of business intelligence
The main purpose and benefit of BI are to improve fact-based decision-making. In order to have reliable, accurate and timely decisions, the necessary information needs to be provided in a timely manner. Improving the quality of decision-making in turn improves business performance (Bordeleau et al., 2009; Garcia, J.M.V. & Pinzon, 2017). Information provided by BI is mostly required for decisions on the tactical and strategic level (Rouhani, Ashrafi, Zare Ravasan, & Afshari, 2016). When assessing strategic systems such as BI, it can be noted that these systems create benefits that are difficult to attribute to a specific factor or to find directly on the balance sheet. On the other hand, in operational systems, there are well-established methods to calculate the efficiency benefits resulting from those projects (Gibson & Arnott, 2002).
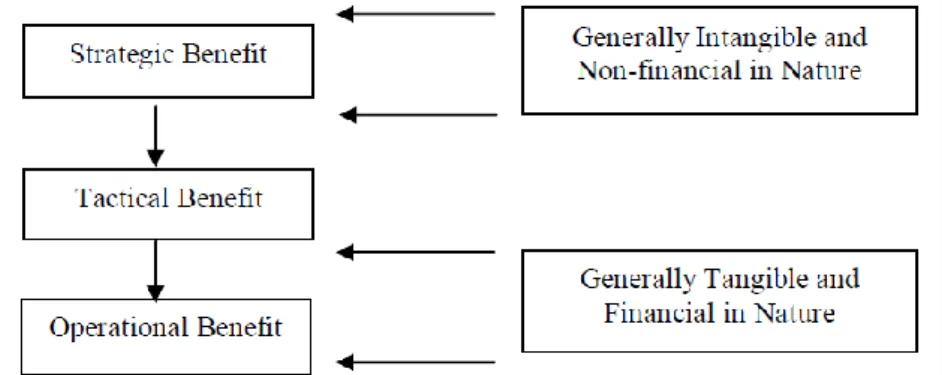
Gibson & Arnott (2002) discuss these benefits. The authors separate the benefits of BI into tangible and intangible benefits. The tangible benefits, such as cost reduction or revenue growth, have a clear impact on the financial statements and are easy to track. However, most of the benefits of BI are intangible and therefore much more difficult to relate back to these IT investments. Indirect benefits include greater business knowledge, improved work processes, more effective relationships, risk reduction and competitive gain (Gibson & Arnott, 2002).
Figure 4 depicts this visually. It can be seen that higher-level benefits, namely strategic and tactical benefits are generally intangible and non-financial, which makes them much harder to identify. The operational benefits are generally more tangible and easier to measure. As the benefits of BI projects are mostly on these higher levels, this shows why it is so difficult to assess the value created by BI projects entirely.
Figure 4: The nature of Strategic, Tactical, and Operational Benefits (Gibson & Arnott, 2002)
Because traditional evaluation techniques are not able to identify these intangible benefits, Gibson & Arnott (2002) have stressed the importance of alternative ways of measuring value creation. As the value created by the BI projects become embedded in the renewed business processes, the value that is created will not be observed if the evaluation methods are not accurate and representative. In that case, managers may only see the resulting costs instead of the created value.
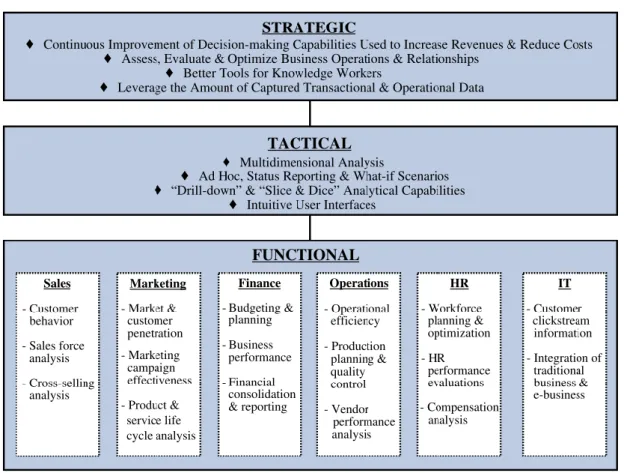
Figure 5 summarizes the various benefits of BI, organized in these three categories, namely strategic, tactical and functional. This figure gives a clear overview of how BI creates value throughout the organization (“Business Intelligence- The Missing Link” 2000). Gibson & Arnott (2002) mention as the top five BI benefits better information, better strategies, better tactics and decisions, and more efficient processes. Hočevar & Jaklič (2010) focus on the competitive advantages created by BI in the form of better access and analysis of data, as well as excellence in customer relationship management by analytical processing of customer information and behavior. Watson & Wixom (2007) mention benefits such as reduced IT infrastructure costs by eliminating redundant data extraction processes and duplicate data,
7 time savings for data suppliers and users because of more efficient data delivery and facilitation of strategic decisions. Examples of this are entering new markets, changing company orientation or launching new product lines.
Figure 5: Overview of the strategic, tactical and functional benefits of BI (“Business Intelligence- The Missing Link,” 2000)
The benefits of BI can also be classified into different categories. For example, Green (2007) discusses how business intelligence can be constructed from business information to identify the main value drivers. There are three major components to business intelligence within a business enterprise:
- Relationship intelligence: insight into how the interactions between knowledge workers influence organizational performance - Competence intelligence: insight into how the abilities of knowledge workers influence organizational performance
- Structure intelligence: insight into how the organization’s infrastructure influences organizational performance
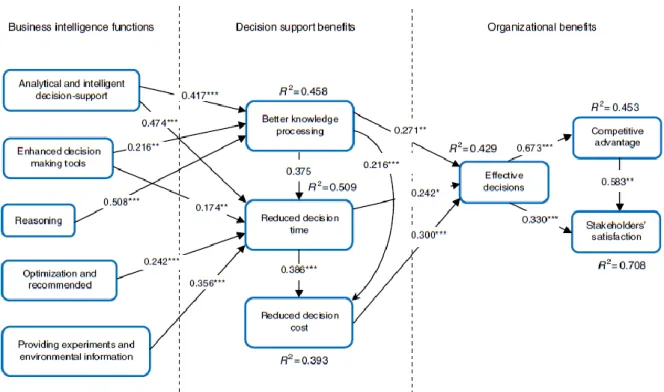
Rouhani et al. (2016) studied a more causal model, namely how the different functions of BI led to decision support benefits, which in turn created organizational benefits. Figure 6 shows the model that was developed. The decision support benefits mentioned were better knowledge processing, reduced decision time and reduced decision costs. These benefits then led to more effective decision making, which then resulted in competitive advantage and stakeholder satisfaction.
8
Figure 6: The relationship between BI functions, decision support benefits and organizational benefits (Rouhani et al., 2016)
2.2 How business intelligence works
Bordeleau et al. (2009) give an overview of the phases of a BI project. In figure 7, it can be seen that a BI system is not a single application but rather a combination of different closely related components. The first step in the process is to collect data from operational or external databased (acquisition). Then this data is checked for errors, transformed into a unique form and loaded (Extract-Transform-Load, or ETL) into the data warehouse (storage). This data storage is the central database of the company for storing and accessing data. From there, the data can be analyzed using analytical tools such as query tools, reporting tools, online analytical processing (OLAP) tools, data mining, control panels and advanced analytical solutions. Finally, these analyses can be presented in an easily understandable form (Bordeleau et al., 2009; Hočevar & Jaklič, 2010).
Figure 7: Phases of BI projects (Bordeleau et al., 2009)
Figure 8 depicts a typical BI architecture, the components and the relations between these different components can be seen. The following sections will explain each part, going from bottom to top. These types of systems are usually constructed as an addition to the already existing ERP systems (Elbashir, Collier, & Davern, 2008).
9
Figure 8: the BI architecture (IDC, 2005)
2.2.1
Data sources
The first component of BI is data sources. The data used in BI can come from various sources. It can come from internal sources such as ERP, SCM, CRM systems, custom apps, historical data, or even external sources such as market research companies or the internet (Ranjan, 2008).
2.2.2
ETL and data integration tools
As a result of this data coming from different sources, the data can be of varying quality or use inconsistent representations, codes, and formats. This creates challenging problems for integrating, cleansing, and standardizing data before it can be stored and used for BI. Additionally, it is ensured that no duplicate data is loaded into the data warehouse, as this can lead to incorrect results later on. Technologies for preparing the data for BI are collectively called Extract-Transform-Load (ETL) tools (Chaudhuri et al., 2011). ETL is sometimes also referred to as data integration. The data transformation logic is defined by the company itself and is known as business rules (H. J. Watson, 2009).
2.2.3
Data warehouse
The data warehouse is the central storage used to store and access data from various sources. The data used for BI is loaded into the data warehouse through the abovementioned ETL process and managed by one or more data warehouse servers (Chaudhuri et al., 2011; Ranjan, 2008). Because the data warehouse integrates data from multiple sources into a single structured and consistent environment, this enables decision-makers to access data from one single version of the truth, which improves the quality of decision making (Negash, 2004; Tvrdikova, 2007). For storing and querying, relational database management systems (RDBMS) are frequently used (Chaudhuri et al., 2011; Ranjan, 2008).
10
2.2.4
BI tools
The data warehouse servers are complemented by multiple BI tools that have specialized functionalities, which can be applied for different scenarios (Chaudhuri et al., 2011).
The first tool is called enterprise search systems (querying). Valuable data is increasingly present in text format. This is why or BI tasks, it is often needed to find an effective search mechanism for this data type. For this scenario, the keywords search paradigm can be used to retrieve and rank information by relevance. Enterprise search supports this paradigm over text-based and structured data. Typically, it makes use of structured data through filtering and sorting over structured attributes of the documents (Chaudhuri et al., 2011).
The second tool is Reporting. Reporting servers allow reports to be defined and executed efficiently. An example of a report could be to report the total sales per region for this year compared to that of the last year. As text data becomes more available and important, this type of reporting grows in importance as well (Chaudhuri et al., 2011).
The third tool is OLAP. Online analytic processing (OLAP) is a delivery technique used for analytical purposes (Bogza & Zaharie, 2008). It is used to explore data and discover new business insights as it provides multidimensional, summarized views of business data using ‘Data Cubes’. Figure 9 gives a visual representation of this concept of multidimensional data analysis. They enable different ways of looking at data and organizing it along different dimensions. Data can be viewed for example by time, by price, or by vendor. It allows applications or users to perform common BI operations such as filtering, aggregation, drill-down, and pivoting for optimizing the business (Beckerle, 2008; Chaudhuri et al., 2011; Ranjan, 2008).
Figure 9: OLAP or multidimensional data analysis (Chaudhuri et al., 2011)
The last tool is data mining. Data mining engines go beyond OLAP or reporting servers and allow in-depth analysis of large quantities of data, which would be nearly impossible with manual effort. They enable predictive modeling to answer questions such as which of the existing customers are most prone to respond to the next catalog mailing campaign. Text analysis engines also can for example be used to identify the most often mentioned products in a survey or to extract the frequently mentioned topics that are present in discussions about a product (Chaudhuri et al., 2011).
2.2.5
Analytic applications (front-End applications)
Users can make use of the BI tools mentioned above to perform BI tasks through several end applications. Some examples of front-end applications are: making spreadsheets, tracking key performance indicators using dashboards, viewing data mining models, and visualizing data to explore patterns (Chaudhuri et al., 2011). Information visualization is a frequently used and effective way of presenting data. Large amounts of data can be summarized in a single or a few screens in the form of scorecards or dashboards. The actual performance
11 of the organization can be monitored closely and compared to goals, benchmarks, and past performance. This enables faster reaction times to problems that might occur (Hugh J. Watson & Wixom, 2007). Beckerle (2008) mentions the term ‘operational business intelligence’ in this context, what this means is that by using triggers, characteristics in the organizational data can be noticed and rapid actions can be taken.
2.3 BI application domains
As BI is a broad term, there are multiple functionalities that the BI can be used for. The article “Business Intelligence Applications | Application Of BI In 2020” by Bergen (2019) gives an overview of the main BI applications:
1. Sales Intelligence
One of the most important applications of BI is improving the touchpoints with the customer. Business analytics and intelligence help in optimizing the organization’s sales operations by discovering trends in client preferences, identifying highly-qualified leads and moving those along the pipeline. Management can be assisted by reports and dashboards generated by BI in order to improve the decision-making process by making data-driven decisions. Additionally, by keeping track of specific key performance indicators (KPI’s) the business can stay aware of its position relative to its competitors. In conjunction with CRM software, BI enables getting more close and personal with the clients to provide the best customer service possible.
2. Visualization
BI software has a wide range of analytic tools that enable organizations to manage and analyze their business operations. By transforming raw data into intuitive visualizations, even the least experienced employee can gain useful insights from it. Examples of applications could be monitoring logistics, sales, productivity, and many other custom reporting possibilities. Communication with other departments and shareholders is made easier by these visuals as well.
3. Reporting
Reporting is another essential functionality of BI. This functionality includes the organization of unstructured collected data in order to create reports for various purposes. Possible application examples are staffing, expenses, sales and customer services. The difference between reporting and data analysis is that reporting focuses on organizing data in summaries with the intention of monitoring business performance. In contrast, data analysis is concerned with the process of exploring data to extract insights that can be used to improve business practices. In summary, reporting turns data into information, while analysis turns it into actionable insights. This means that reporting focuses on the ‘what’ and analysis focuses on the ‘why’.
4. Performance management
BI applications make it possible to monitor the progress of various pre-defined data-driven goals. This functionality saves time and money by making the required information always readily accessible. These goals include project completion deadlines, target delivery time, or sales goals. The BI tools can analyze data of the previous period in order to suggest reasonable goals based on past performance. These systems can give alerts when targets are almost reached or if specific deadlines have almost passed. This assists management in that it helps the company to be aware of their progress and to maintain a goal-oriented way of working.
12
2.4 BI project success or failure
Garcia, J.M.V. and Pinzon (2017) state that in practice, a large proportion of BI projects fail. This proportion of failure is between 40% to 80%, depending on the source, the type of BI project and the definition of failure. According to the authors, the success of BI solutions can be improved if the company scores well on certain critical success factors.
2.4.1
D&M IS Success Model
The study by Delone & McLean (1992) attempted to capture the multidimensional and interdependent nature of the dependent variable, namely IS success (information systems success). They proposed a framework for conceptualizing and operationalizing IS success, which is called the ‘D&M IS Success Model'. This model proposes six major factors of IS success: (1) system quality, (2) information quality, (3) use, (4) user satisfaction, (5) individual impact, and (6) organizational impact. Hundreds of articles in refereed journals have referred to, and made use of this model, so the authors decided in 2003 to update the model and evaluate its usefulness (DeLone & McLean, 2003).
2.4.2
Net benefits
The authors make use of ‘net benefits’ to measure of IS success. In order to simplify the model, this variable is a grouping of the various success measures. It measures the ‘impact’ that the IS system has on individual users, as well as on the organization. The term ‘net benefits’ was chosen as the most accurate descriptor because no outcome can be only positive, without any negative consequences. The variable thus captures the balance of positive and negative impacts on the various stakeholders (DeLone & McLean, 2003).
The updated D&M IS Success Model consists of the following six factors: system quality, information quality, service quality, use or intention to use, user satisfaction, and net benefits. This model can be seen in figure 10. This updated model has then been used by various studies in the literature to measure BI success (Mudzana & Maharaj, 2015; Wixom & Watson, 2001; Yeoh & Koronios, 2010)
Figure 10: The D&M IS Success Model (DeLone & McLean, 2003)
2.5 Critical success factors
Williams & Williams (2004) introduced the concept ‘BI readiness’. BI readiness assessments can be made before implementing a BI project to measure the degree to which the organization has at its disposal the organizational attributes that are necessary to capture the business value of BI fully. These organizational attributes are factors that are positively correlated with an organization’s ability to leverage BI and
13 are often referred to as ‘key success factors’ or ‘critical success factors’. By examining the key success factors upfront, the strengths of the company can be leveraged and the risks can be managed. As a result, successful capitalization on the deployed BI project can be improved and the desired return on investment can be achieved.
In the next sections, a few studies will be listed that have researched what the critical success factors are. First, an overview will be given of the CSFs mentioned in the literature and a summary will be made of the most occurring ones. Then, an overview will be presented of the case studies available on this topic.
2.5.1
Studies that identify BI CSFs
The critical success factors which aid in achieving successful BI implementation have been researched abundantly over the years. Multiple studies performed quantitative as well as qualitative research to find out what the CSFs of BI success are. A review of the literature on the topic was performed to find out what the CSFs are.
First of all, the literature was searched for studies that tried to identify what the success factors for BI success are. Table 1 gives an overview of the literature on this topic and highlights the differences between them. The studies are listed in chronological order.
The CSFs mentioned in these studies were then summarized. The full summary can be found in appendix 1. A common name was used where authors describe the same CSF with different names. The specific terms used in the sources can be found in the second column. A shorter version of this table is table 2. The table is ordered by descending order of the number of times the CSFs were mentioned in different sources.
14
Table 1: Overview of the existing literature on the identification of BI CSFs
Reference Title Goal Method of CSF identification
(Williams & Williams, 2004)
Assessing BI Readiness: The Key to BI ROI Understand the creation of BI value and identify and manage the preconditions for managing this business value
Based on consulting experience with Fortune 1000 companies and Government agencies, and experience as judges for the annual TDWI Best Practices competition, CSFs were identified
(I. Hwang & Hongjiang, 2007)
The Effect of Implementation Factors on Data Warehousing Success: An
Exploratory Study
Better understand implementation factors and their effect on data warehousing success
Perceptions of data warehousing professionals were examined in a cross-sectional survey
(Arnott, 2008) Success factors for data warehouse and business intelligence systems
Improve understanding of DW/BI development by identifying the CSFs
CSFs were identified from previous research. These CSFs were used to analyze the failure and success of two case studies
(Yeoh, Koronios, & Gao, 2008)
Managing the implementation of business intelligence systems: A critical success factors framework
Develop a CSFs framework that consists of factors and associated contextual elements crucial for BI systems implementation
Three-round Delphi study with 15 BI experts in the domain of engineering asset management organizations
(Yeoh & Koronios, 2010)
Business Intelligence Systems University of South Australia
Bridge the gap that exists between academia and practitioners by investigating the CSFs influencing BI systems success
Two-stage qualitative approach: First, a three-round Delphi method was conducted to develop a CSFs framework crucial for BI systems
implementation. Next, the framework and the associated CSFs were delineated through a series of case studies
(Mohamadina, Ghazali, Ibrahim, & Harbawi, 2012)
Business intelligence: Concepts, issues and current systems
Identify the implementation challenges of BI projects A framework of CSFs was proposed based on a review of the existing literature
(Olbrich, Pöppelbuß, & Niehaves, 2012)
Critical contextual success factors for business intelligence: A Delphi Study on their relevance, variability, and controllability
Investigation of CSFs that influence BI system success and design in organizations concerning their relevance, variability, and controllability
The CSFs were identified based on analysis of extant literature, and a Delphi Study was performed with domain experts to validate these CSFs
(Olszak & Ziemba, 2012)
Critical success factors for implementing business intelligence systems in small and medium enterprises on the example of upper Silesia, Poland
Identify the critical success factors (CSFs) for Business Intelligence (BI) systems implementation in small and medium enterprises (SMEs)
A literature review was performed to identify the CSFs of IT projects and BI projects. Using in-depth interviews with SMEs, the SMEs need for BI systems as well as the determinants and barriers to their
implementation are recognized (Dawson & Van Belle,
2013)
Critical success factors for business intelligence in the South African financial services sector
Aim to determine which CSFs are the most important in the financial services sector of South Africa
Delphi-technique approach with key project stakeholders in three BI projects in different business units of a leading South African financial services group
(Mungree, Rudra, & Morien, 2013)
A Framework for Understanding the Critical Success Factors of Enterprise Business Intelligence Implementation
Investigate the success factors and their contextual issues that may help organizations achieve a successful BI system implementation
A research framework for understanding CSFs from existing literature was developed and based on the framework, a set of multi-dimensional CSFs was identified during the course of the interviews with 16 BI consultants who possess substantial experience in the field
15 (Sangar & Iahad,
2013)
Critical factors that affect the success of business intelligence systems BIS implementation in an organization
Explore the CSFs that effect BIS implementation both from the perspectives of management and technology
Based on literature and interviews, a conceptual framework of successful implementation of BIS is proposed
(Ravasan & Savoji, 2015)
An Investigation of BI Implementation Critical Success Factors in Iranian Context
Identify -CSFs that impact the successful implementation of BI systems in organizations
The CSFs were identified through a literature review. Following that, these CSFs were validated using a questionnaire which was filled out by domain experts in BI implementation projects in Iran
(Salehi Nasab, Selama, & Masrom, 2015)
A Delphi study of the critical factors for bi system implementation in the public sector organizations
Depict the effect of CSFs on BI system implementations in the Malaysian context
A literature review was performed to identify the CSFs of IT projects and BI projects. A Delphi study validated these CSFs
(Hejazi et al., 2016) Assessing the Organizational Readiness for Implementing bi Systems
Examine whether the factors affecting the
organizational readiness for BI implementation in all organizations are identical
Comprehensive literature review into the CSFS, followed by a case application in companies in three different sectors
(Garcia, J.M.V. & Pinzon, 2017)
Key Success Factors to BI Solution Implementation
Identify those factors that could contribute to BI solution success, and are linked to benefits that could be potentially achieved
Multi-methodology in four phases: appreciation, where a documental search was conducted through a literature review; analysis, where hypothetical structures related with the key success factors were proposed; assessment, where key success factors were assessed along with experts; and action, where research results discussion was shown (Magaireah, Sulaiman,
& Ali, 2017)
Theoretical framework of critical success factors (CSFs) for Business Intelligence (BI) System
Propose theoretical framework of BI system success which combines the CSFs for BI system with quality constructs as measurements to assess BI success
A framework of CSFs was proposed based on a review of the existing literature
(Rajesh & Saravanan, 2017)
Critical success factors: the success of business intelligence systems
Provide a better understanding of the vital and valuable CSFs and to conduct a survey and comprehensive study of the CSFs before the
implementation phase by categorizing the factors into two main groups; institutional and scientific factors
A framework of CSFs was proposed based on a review of the existing literature
(Eder & Koch, 2018) Critical success factors for the
implementation of business intelligence systems
Provide an update of the existing literature and validate whether the CSFs for business intelligence implementation projects have changed over time
Existing literature was reviewed to extract CSFs. Subsequently, the CSFs that occur in practice were collected through qualitative expert interviews that are analyzed through qualitative content analysis. The CSFs found in the literature were compared with those that have been collected during the expert interviews
(Gaardboe & Svarre, 2018)
Critical factors for business intelligence success
Create an overview of the critical success factors (CSFs) existing in the literature
Examination and integration of existing articles on the topic (Zaied, Grida, &
Hussein, 2018)
Evaluation of critical success factors for business intelligence systems using fuzzy AHP
Determine the prioritization of critical success factors (CSFs)
CSFs of BIS were identified based on previous researches. In order to find out their relative priorities, Fuzzy Analytic Hierarchy Process (FAHP) has been used. Twelve BI experts were asked to pairwise rank the success factors of business intelligence system
16
Table 2: Overview of critical success factors for BI implementation in literature
Critical success factor
Sources Frequency
Management support
(Eder & Koch, 2018)(Garcia, J.M.V. & Pinzon, 2017)(Hejazi et al., 2016)(Gaardboe & Svarre, 2018)(Yeoh, Koronios, & Gao, 2008)(Magaireah, Sulaiman, & Ali, 2017)(Rajesh & Saravanan, 2017)(Zaied, Grida, & Hussein, 2018)(Arnott, 2008)(Dawson & Van Belle, 2013)(Sangar & Iahad, 2013)(Yeoh & Koronios, 2010)(Salehi Nasab, Selama, & Masrom, 2015)(Ravasan & Savoji, 2015)(Olszak & Ziemba, 2012)(Mohamadina, Ghazali, Ibrahim, & Harbawi, 2012)(Mungree, Rudra, & Morien, 2013)(Olbrich, Pöppelbuß, & Niehaves, 2012)(I. Hwang & Hongjiang, 2007)
19
Project team (Eder & Koch, 2018)(Mohamadina, Ghazali, Ibrahim, & Harbawi, 2012)(Mungree, Rudra, & Morien, 2013)(Garcia, J.M.V. & Pinzon, 2017)(Yeoh, Koronios, & Gao, 2008)(Magaireah, Sulaiman, & Ali, 2017)(Rajesh & Saravanan, 2017)(Zaied, Grida, & Hussein, 2018)(Arnott, 2008)(Sangar & Iahad, 2013)(Yeoh & Koronios, 2010)(Salehi Nasab, Selama, & Masrom, 2015)(Ravasan & Savoji, 2015)(Olszak & Ziemba, 2012)
14
User involvement (Eder & Koch, 2018)(Gaardboe & Svarre, 2018)(Gaardboe & Svarre, 2018)(Hejazi et al., 2016)(Yeoh, Koronios, & Gao, 2008)(Magaireah, Sulaiman, & Ali, 2017)(Rajesh & Saravanan, 2017)(Dawson & Van Belle, 2013)(Salehi Nasab, Selama, & Masrom, 2015)(Olszak & Ziemba, 2012)(Mohamadina, Ghazali, Ibrahim, & Harbawi, 2012)(Olbrich, Pöppelbuß, & Niehaves, 2012)(I. Hwang & Hongjiang, 2007)(Ravasan & Savoji, 2015)
14
Vision (Magaireah, Sulaiman, & Ali, 2017)(Gaardboe & Svarre, 2018)(Hejazi et al., 2016)(Zaied, Grida, & Hussein, 2018)(Sangar & Iahad, 2013)(Salehi Nasab, Selama, & Masrom, 2015)(Ravasan & Savoji, 2015)(Olszak & Ziemba, 2012)(Olbrich, Pöppelbuß, & Niehaves, 2012)(Dawson & Van Belle, 2013)(Yeoh & Koronios, 2010)(Garcia, J.M.V. & Pinzon, 2017)(Dawson & Van Belle, 2013)(Salehi Nasab, Selama, & Masrom, 2015)
14
Data quality (Eder & Koch, 2018)(Gaardboe & Svarre, 2018)(Yeoh, Koronios, & Gao, 2008)(Magaireah, Sulaiman, & Ali, 2017)(Rajesh & Saravanan, 2017)(Zaied, Grida, & Hussein, 2018)(Dawson & Van Belle, 2013)(Yeoh & Popovič, 2016)(Sangar & Iahad, 2013)(Yeoh & Koronios, 2010)(Salehi Nasab, Selama, & Masrom, 2015)(Olszak & Ziemba, 2012)(Mohamadina, Ghazali, Ibrahim, & Harbawi, 2012)(I. Hwang & Hongjiang, 2007)
14
Project manager (Eder & Koch, 2018)(Magaireah, Sulaiman, & Ali, 2017)(Gaardboe & Svarre, 2018)(Magaireah, Sulaiman, & Ali, 2017)(Rajesh & Saravanan, 2017)(Zaied, Grida, & Hussein, 2018)(Sangar & Iahad, 2013)(Gaardboe & Svarre, 2018)(Olszak & Ziemba, 2012)(Mohamadina, Ghazali, Ibrahim, & Harbawi, 2012)(I. Hwang & Hongjiang, 2007)(Ravasan & Savoji, 2015)
12
Development approach
(Eder & Koch, 2018)(Yeoh, Koronios, & Gao, 2008)(Magaireah, Sulaiman, & Ali, 2017)(Arnott, 2008)(Yeoh & Koronios, 2010)(Salehi Nasab, Selama, & Masrom, 2015)(Mohamadina, Ghazali, Ibrahim, & Harbawi, 2012)(I. Hwang & Hongjiang, 2007)(Gaardboe & Svarre, 2018)(Sangar & Iahad, 2013)(Garcia, J.M.V. & Pinzon, 2017)
11
Strategic alignment
(Hejazi et al., 2016)(Williams & Williams, 2004)(Yeoh, Koronios, & Gao, 2008)(Magaireah, Sulaiman, & Ali, 2017)(Rajesh & Saravanan, 2017)(Zaied, Grida, & Hussein, 2018)(Arnott, 2008)(Dawson & Van Belle, 2013)(Salehi Nasab, Selama, & Masrom, 2015)(Ravasan & Savoji, 2015)(Mungree, Rudra, & Morien, 2013)
11
Resources (Eder & Koch, 2018)(Garcia, J.M.V. & Pinzon, 2017)(Hejazi et al., 2016)(Yeoh, Koronios, & Gao, 2008)(Magaireah, Sulaiman, & Ali, 2017)(Rajesh & Saravanan, 2017)(Zaied, Grida, & Hussein, 2018)(Arnott, 2008)(Salehi Nasab, Selama, & Masrom, 2015)(Ravasan & Savoji, 2015)(Mungree, Rudra, & Morien, 2013)
11
Change management
(Eder & Koch, 2018)(Garcia, J.M.V. & Pinzon, 2017)(Magaireah, Sulaiman, & Ali, 2017)(Zaied, Grida, & Hussein, 2018)(Sangar & Iahad, 2013)(Yeoh & Koronios, 2010)(Ravasan & Savoji, 2015)(Olszak & Ziemba, 2012)(Mungree, Rudra, & Morien, 2013)(Hejazi et al., 2016)(Gaardboe & Svarre, 2018)
11
Project objective (Eder & Koch, 2018)(Yeoh, Koronios, & Gao, 2008)(Magaireah, Sulaiman, & Ali, 2017)(Arnott, 2008)(Dawson & Van Belle, 2013)(Salehi Nasab, Selama, & Masrom, 2015)(Ravasan & Savoji, 2015)(Mungree, Rudra, & Morien, 2013)(I. Hwang & Hongjiang, 2007)(Sangar & Iahad, 2013)
10
Flexibility (Magaireah, Sulaiman, & Ali, 2017)(Ravasan & Savoji, 2015)(Olszak & Ziemba, 2012)(Mungree, Rudra, & Morien, 2013)(Rajesh & Saravanan, 2017)(Sangar & Iahad, 2013)(Yeoh & Koronios, 2010)(Zaied, Grida, & Hussein, 2018)(Salehi Nasab, Selama, & Masrom, 2015)
17 Project leader or
'champion'
(Garcia, J.M.V. & Pinzon, 2017)(Yeoh, Koronios, & Gao, 2008)(Magaireah, Sulaiman, & Ali, 2017)(Zaied, Grida, & Hussein, 2018)(Dawson & Van Belle, 2013)(Sangar & Iahad, 2013)(Yeoh & Koronios, 2010)(Salehi Nasab, Selama, & Masrom, 2015)(Mohamadina, Ghazali, Ibrahim, & Harbawi, 2012)
9
Skills (Hejazi et al., 2016)(Gaardboe & Svarre, 2018)(Rajesh & Saravanan, 2017)(Magaireah, Sulaiman, & Ali, 2017)(Ravasan & Savoji, 2015)(Yeoh, Koronios, & Gao, 2008)(I. Hwang & Hongjiang, 2007)(Dawson & Van Belle, 2013)
8
Training of employees
(Magaireah, Sulaiman, & Ali, 2017)(Eder & Koch, 2018)(Garcia, J.M.V. & Pinzon, 2017)(Gaardboe & Svarre, 2018)(Yeoh, Koronios, & Gao, 2008)(Sangar & Iahad, 2013)(Ravasan & Savoji,
2015)(Mohamadina, Ghazali, Ibrahim, & Harbawi, 2012)
8
Extensible technical framework
(Yeoh, Koronios, & Gao, 2008)(Magaireah, Sulaiman, & Ali, 2017)(Rajesh & Saravanan, 2017)(Sangar & Iahad, 2013)(Yeoh & Koronios, 2010)(Zaied, Grida, & Hussein, 2018)(Salehi Nasab, Selama, & Masrom, 2015)
7
Metadata/ data management
(Eder & Koch, 2018)(Yeoh, Koronios, & Gao, 2008)(Magaireah, Sulaiman, & Ali, 2017)(Rajesh & Saravanan, 2017)(Arnott, 2008)(Ravasan & Savoji, 2015)(Mungree, Rudra, & Morien, 2013)
7 IT infrastructure (Dawson & Van Belle, 2013)(Sangar & Iahad, 2013)(Olbrich, Pöppelbuß, & Niehaves,
2012)(Gaardboe & Svarre, 2018)(Yeoh, Koronios, & Gao, 2008)(Eder & Koch, 2018)(Williams & Williams, 2004)
7
Environment (Garcia, J.M.V. & Pinzon, 2017)(Hejazi et al., 2016)(Gaardboe & Svarre, 2018)(Zaied, Grida, & Hussein, 2018)(Dawson & Van Belle, 2013)(Olbrich, Pöppelbuß, & Niehaves, 2012)
6 Stable
framework / Architecture
(Eder & Koch, 2018)(Ravasan & Savoji, 2015)(Gaardboe & Svarre, 2018)(Yeoh & Popovič, 2016)(Rajesh & Saravanan, 2017)(Magaireah, Sulaiman, & Ali, 2017)
6
Appropriate technology and tools
(Mohamadina, Ghazali, Ibrahim, & Harbawi, 2012)(Magaireah, Sulaiman, & Ali, 2017)(Arnott, 2008)(Ravasan & Savoji, 2015)(Olszak & Ziemba, 2012)(Sangar & Iahad, 2013)
6
Usability (Ravasan & Savoji, 2015)(Olszak & Ziemba, 2012)(Olszak & Ziemba, 2012)(Ravasan & Savoji, 2015)(Magaireah, Sulaiman, & Ali, 2017)(Salehi Nasab, Selama, & Masrom, 2015)
6 Organisational
culture
(Gaardboe & Svarre, 2018)(Magaireah, Sulaiman, & Ali, 2017)(Eder & Koch, 2018)(Zaied, Grida, & Hussein, 2018)(Sangar & Iahad, 2013)(Salehi Nasab, Selama, & Masrom, 2015)
6 Compatibility to
other systems
(Eder & Koch, 2018)(Magaireah, Sulaiman, & Ali, 2017)(Salehi Nasab, Selama, & Masrom, 2015)(Zaied, Grida, & Hussein, 2018)(Olszak & Ziemba, 2012)
5 Management
method
(Dawson & Van Belle, 2013)(Olbrich, Pöppelbuß, & Niehaves, 2012)(Gaardboe & Svarre, 2018)(Rajesh & Saravanan, 2017)(Ravasan & Savoji, 2015)
5 Data integration
/ source systems
(Garcia, J.M.V. & Pinzon, 2017)(Eder & Koch, 2018)(Rajesh & Saravanan, 2017)(Mohamadina, Ghazali, Ibrahim, & Harbawi, 2012)(Olbrich, Pöppelbuß, & Niehaves, 2012)
5 Project scope (Eder & Koch, 2018)(Yeoh, Koronios, & Gao, 2008)(Arnott, 2008)(Mohamadina, Ghazali,
Ibrahim, & Harbawi, 2012)(Mungree, Rudra, & Morien, 2013)
5 Project budget (Olbrich, Pöppelbuß, & Niehaves, 2012)(Eder & Koch, 2018)(Yeoh & Popovič, 2016)(Dawson &
Van Belle, 2013)(Olszak & Ziemba, 2012)
5 Governance (Eder & Koch, 2018)(Gaardboe & Svarre, 2018)(Yeoh, Koronios, & Gao, 2008)(Eder & Koch, 2018) 4 Sponsorship (Sangar & Iahad, 2013)(Arnott, 2008)(Mungree, Rudra, & Morien, 2013)(Williams & Williams,
2004)
4 Benefits (Magaireah, Sulaiman, & Ali, 2017)(Sangar & Iahad, 2013)(Gaardboe & Svarre, 2018)(Zaied,
Grida, & Hussein, 2018)
4 Consult a
consultancy / external company
(Gaardboe & Svarre, 2018)(Yeoh, Koronios, & Gao, 2008)(Eder & Koch, 2018)(Salehi Nasab, Selama, & Masrom, 2015)
4
Performance measurement
(Yeoh, Koronios, & Gao, 2008)(Garcia, J.M.V. & Pinzon, 2017)(Hejazi et al., 2016)(Eder & Koch, 2018)
4 Use (Gaardboe & Svarre, 2018)(Yeoh & Popovič, 2016)(Gaardboe & Svarre, 2018) 3 Prototyping (Yeoh, Koronios, & Gao, 2008)(Eder & Koch, 2018)(Mohamadina, Ghazali, Ibrahim, & Harbawi,
2012)
3 Problem
definition
18 Culture of using
information
(Hejazi et al., 2016)(Williams & Williams, 2004)(Eder & Koch, 2018) 3 Collaboration
with supplier
(Magaireah, Sulaiman, & Ali, 2017)(Olszak & Ziemba, 2012)(Zaied, Grida, & Hussein, 2018) 3 Risk
management
(Magaireah, Sulaiman, & Ali, 2017)(Ravasan & Savoji, 2015) 2
User literacy (Dawson & Van Belle, 2013)(Salehi Nasab, Selama, & Masrom, 2015) 2
Knowledge-based decision making
(Hejazi et al., 2016)(Williams & Williams, 2004) 2
Perceived social pressure
(Gaardboe & Svarre, 2018) 2
Organizational size
(Gaardboe & Svarre, 2018) 2
Development methodology
(Magaireah, Sulaiman, & Ali, 2017) 2
System learnability
(Magaireah, Sulaiman, & Ali, 2017) 2
Competitor's BI capability
(Dawson & Van Belle, 2013) 2
Continuous process improvement
(Hejazi et al., 2016) 2
Time restrictions (Dawson & Van Belle, 2013) 2
Domain knowledge
(Eder & Koch, 2018) 2
Data model (Ravasan & Savoji, 2015) 2
Managing users' expectations
(Ravasan & Savoji, 2015) 1
Process automation
(Dawson & Van Belle, 2013) 1
Product range (Dawson & Van Belle, 2013) 1
Legislation (Dawson & Van Belle, 2013) 1
Volunariness (Gaardboe & Svarre, 2018) 1
Complexity (Zaied, Grida, & Hussein, 2018) 1
Loyalty (Hejazi et al., 2016) 1
Innovation (Hejazi et al., 2016) 1
Image (Gaardboe & Svarre, 2018) 1
Visibility (Gaardboe & Svarre, 2018) 1
Task compatibility
(Gaardboe & Svarre, 2018) 1
Trust (Gaardboe & Svarre, 2018) 1
Overall business orientation approach
(Yeoh & Koronios, 2010) 1
Culture of learning
(Hejazi et al., 2016) 1
Organizational structure
(Gaardboe & Svarre, 2018) 1
Testing the BI system
(Eder & Koch, 2018) 1
19 Financial
situation
(Olbrich, Pöppelbuß, & Niehaves, 2012) 1
Involvement of stakeholders
(Eder & Koch, 2018) 1
Meet business needs
(Magaireah, Sulaiman, & Ali, 2017) 1
Organizational competence
(Gaardboe & Svarre, 2018) 1
In table 2, we can see that the ten most occurring critical success factors are (in descending order): - Management support - Project teams - User involvement - Vision - Data quality - Project manager - Deployment approach - Strategic alignment - Resources - Change management
In this list, there is only one technological factor (data quality) present. This finding is consistent with the claim of previous studies that non-technical factors, including organizational and process-related factors, are more influential and important than technological factors (Fatima & Linnes, 2019; Yeoh & Popovic, 2015).
2.5.2
Case studies
It is interesting to consider which of these critical success factors discussed in literature were already applied in practice. Studies on the topic of BI readiness were investigated. Such studies assess to which degree the company has implemented certain CSFs before the BI project had started so that an evaluation can be made of the chances of success. As CSFs are considered in practice for specific companies, this type of research is considered as case studies for the purpose of this study.
When considering this type of BI readiness assessment, Fatima & Linnes (2019) state that relatively little previous work has been done on this subject. Some examples of practical research done in this field that could be found are, in chronological order: performing a BI readiness assessment in the context of the Iranian banking industry (Najmi, Sepehri, & Hashemi, 2010), an Indonesian fashion group (Hidayanto, Shihab, & Kristianto, 2012), Malaysian organizations (Anjariny & Zeki, 2013), the banking sector in North Cyprus (Tuccaroglu & Nat, 2016), Australian large organizations in engineering asset management (Yeoh & Popovič, 2016), different Norwegian companies (Fatima & Linnes, 2019) and a Columbian shopping mall (Ramirez-Angulo & Guevara, 2020). Table 3 gives an overview of the differences and similarities between these studies. The studies will be discussed in chronological order.
20
Table 3: An overview of the different studies related to BI readiness assessment
Reference Title Goal Data collection Targeted respondents Number of
respondents
Limitations
(Najmi, Sepehri, & Hashemi, 2010)
The Evaluation of Business Intelligence Maturity Level In Iranian Banking Industry
The current methods for measurement of Business Intelligence maturity are reviewed introducing the application of CMMI as a new measurement tool for this purpose
Questionnaire Experts in both public and private Iranian banks
92 Only one industry
(Hidayanto, Shihab, & Kristianto, 2012)
Measuring Business Intelligence (BI) Implementation Readiness: A Framework Development and Its Application to Small Medium Enterprises (SMEs)
Develop a framework for measuring readiness level of Business Intelligence (BI) implementation
Semi-structured interview
Indonesian Mode Fashion group 1 Only one company
(Anjariny & Zeki, 2013) The important dimensions for assessing organization's readiness toward business intelligence systems from the perspective of Malaysian Organization
Develop a model for assessing an organization's readiness toward BI systems, based on the context of Malaysian Organizations
Questionnaire IT and business managers of Malaysian organizations
35 in the first round, 200 in the second round
Only one industry
(Tuccaroglu & Nat, 2016) The readiness of banks for the application of Business Intelligence solutions
Evaluate the readiness of Local Banks in NC towards implementing a successful BI system and form a base for future studies
Questionnaire Executive managers, IT managers, business unit managers, IT and business unit personnel in both public and private local banks in North Cyprus
21 (Yeoh & Popovič, 2016) Extending the understanding of
critical success factors for implementing business intelligence systems
Enable BI stakeholders to holistically understand the CSFs and the associated contextual issues that impact on the implementation of BI systems
Semi-structured interview
Australian large organizations in engineering asset management
7 Only one industry
(Fatima & Linnes, 2019) The status of business intelligence in small and medium size enterprises in Norway
Investigate the CSFs and their associated contextual issues that impact the implementation of BI systems
Questionnaire Group of Norwegian companies, especially BI developers and consulting firms
67 CSFs not distinguished
by industry in analysis
(Ramirez-Angulo & Guevara, 2020)
Business Intelligence Readiness Assessment for a Shopping Mall: Challenges and Future Directions
Assess BI readiness and promote the skills and competencies oriented to prioritize actions based on research to improve decision making before a BI project
Semi-structured interview