DECARBONISATION OPTIONS
FOR THE DUTCH FERTILISER
INDUSTRY
M. Batool, W. Wetzels
03 October 2019Decarbonisation options for the Dutch fertiliser industry
© PBL Netherlands Environmental Assessment Agency; © ECN part of TNO The Hague, 2019
PBL publication number: 3657
TNO project nr. 060.33956 / TNO 2019 P11160
Authors
M. Batool and W. Wetzels
Acknowledgements
We are grateful to Professor Niklas Höhne (Wageningen University) and Marija Saric, MSc (TNO), for their valuable input.
MIDDEN project coordination and responsibility
The MIDDEN project (Manufacturing Industry Decarbonisation Data Exchange Network) was initiated and is also coordinated and funded by PBL and ECN part of TNO. The project aims to support industry, policymakers, analysts, and the energy sector in their common efforts to achieve deep decarbonisation. Correspondence regarding the project may be addressed to: K.M. Schure (PBL), Klara.Schure@pbl.nl, or A.W.N van Dril (TNO), Ton.vanDril@tno.nl
Production coordination PBL Publishers
This publication is a joint publication by PBL and ECN part of TNO and can be downloaded from: www.pbl.nl/en. Parts of this publication may be reproduced, providing the source is stated, in the form: M. Batool and W. Wetzels (2019), Decarbonisation options for the Dutch fertiliser industry, PBL Netherlands Environmental Assessment Agency & ECN part of TNO, The Hague.
PBL Netherlands Environmental Assessment Agency is the national institute for strategic policy analysis in the fields of the environment, nature and spatial planning. We contribute to improving the quality of political and administrative decision-making by conducting outlook studies, analyses and evaluations in which an integrated approach is considered paramount. Policy relevance is the prime concern in all of our studies. We conduct solicited and
unsolicited research that is both independent and scientifically sound.
ECN part of TNO has a twofold mission: to accelerate the energy transition and to strengthen the competitive position of the Netherlands. ECN part of TNO conducts independent and internationally leading research and we stand for an agenda-setting, initiating and supporting role for government, industry and NGOs.
Contents
Summary 4
INTRODUCTION
5
1
FERTILISER PRODUCTION IN THE NETHERLANDS
6
1.1 The Dutch fertiliser industry 6
1.2 Yara Sluiskil B.V. 9
1.3 OCI Nitrogen B.V. 13
2
FERTILISER PROCESSES
17
2.1 Ammonia production 17
2.2 Urea production 20
2.3 Nitric acid production 21
2.4 Overview of energy flows, mass flows and greenhouse gas emissions 22
3
FERTILISER PRODUCTS AND APPLICATION
25
3.1 Products of the fertiliser industry 25
3.2 Product markets 26
4
OPTIONS FOR DECARBONISATION
27
4.1 Using hydrogen with a lower CO2 footprint 28
4.2 Carbon capture and storage 31
4.3 Other decarbonisation options 34
5
DISCUSSION
36
FINDINGS
Summary
This report describes the current situation for fertiliser production in the Netherlands and the options and preconditions for its decarbonisation.
Fertilisers essentially provide three major nutrients (nitrogen, phosphorus and potassium) in plant crop available forms. This report focuses on the nitrogen-based fertiliser production at Yara Sluiskil and OCI Nitrogen, because these are the largest companies in terms of
production volumes and energy consumption.
Yara Sluiskil produces around 5 million tonnes of fertiliser products per year. The production site has three ammonia plants, four CO2 plants, two nitric acid plants, one urea prilling plant, one urea granulation plant and two nitrate granulation plants. The three ammonia plants (‘C’, ‘D’ and ‘E’) have a combined production capacity of approximately 1.8 million tonnes of NH3 per year. Table S1 shows the estimated natural gas consumption and greenhouse gas emissions of ammonia, urea and nitric acid production at Yara Sluiskil B.V. in 2017.
Table S1 Estimated natural gas consumption and greenhouse gas emissions of ammonia, urea and nitric acid production at Yara Sluiskil B.V. in 2017
Ammonia
plant C Ammonia plant D Ammonia plant E Urea Nitric acid Total
Capacity [kt of product/year] 449 639 731 1,300 1,500 -
Production [kt of product/year] 410 584 668 1,187 1,370 -
Input of natural gas [PJ] 14.0 19.9 22.4 0.0 0.0 56
Greenhouse gas emission [MtCO2eq] 0.8 1.1 1.3 0.0 0.2 3.4
OCI Nitrogen B.V. in Geleen is a large producer of fertilisers and the world’s largest producer of melamine. OCI Nitrogen operates production plants for ammonia, nitric acid, ammonium nitrate, urea, Urea Ammonium Nitrate (UAN), Calcium Ammonium Nitrate (CAN) and melamine. The two ammonia plants (‘AFA-2’ and ‘AFA-3’) have a combined production capacity of approx-imately 1.2 million tonnes of NH3 per year. Table S2 shows the estimated natural gas
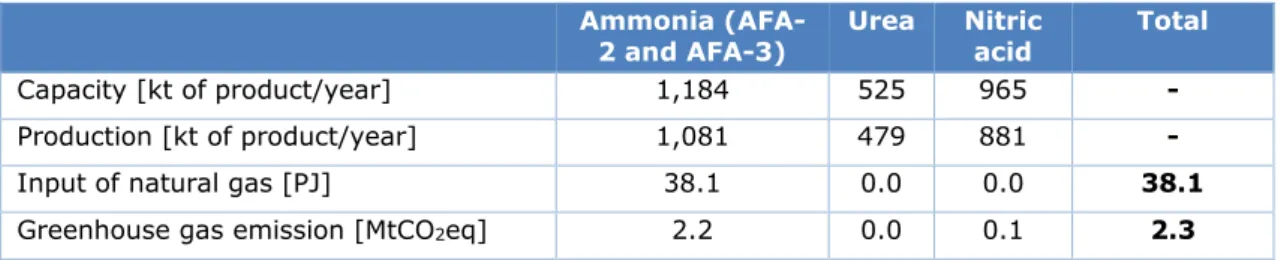
consumption and greenhouse gas emissions of ammonia, urea and nitric acid production at OCI Nitrogen B.V. in 2017.
Table S2 Estimated natural gas consumption and greenhouse gas emissions of ammonia, urea and nitric acid production at OCI Nitrogen B.V. in 2017
Ammonia
(AFA-2 and AFA-3) Urea Nitric acid Total
Capacity [kt of product/year] 1,184 525 965 -
Production [kt of product/year] 1,081 479 881 -
Input of natural gas [PJ] 38.1 0.0 0.0 38.1
Greenhouse gas emission [MtCO2eq] 2.2 0.0 0.1 2.3
Ammonia production is the most energy-intensive process in the fertiliser industry. In the conventional ammonia production process, ammonia is produced by steam methane
reforming of natural gas combined with Haber-Bosch NH3 synthesis. Alternatively, hydrogen
with a lower CO2 footprint (e.g. green hydrogen) can be produced on-site or supplied from
external sources. Ammonia plants produce large flows of almost pure CO2 gas, which are
FULL RESULTS
Introduction
This report describes the current situation for fertiliser production in the Netherlands and the options and preconditions for its decarbonisation. The study is part of the MIDDEN project (Manufacturing Industry Decarbonisation Data Exchange Network). The MIDDEN project aims to support industry, policymakers, analysts and the energy sector in their common efforts to achieve deep decarbonisation. Mapping decarbonisation options is an ongoing process. The MIDDEN project will update and elaborate further on options in the future, in close
connection with the industry.
Scope
Production locations: • Yara Sluiskil B.V. • OCI Nitrogen B.V.
Processes:
• Production of ammonia from natural gas;
• Production of urea from ammonia and carbon dioxide; • Production of nitric acid from ammonia.
Products of the fertiliser industry include: • Ammonia;
• Nitric acid;
• Ammonium Nitrate (AN);
• Calcium ammonium nitrate (CAN); • Urea;
• Urea Ammonium Nitrate (UAN); • Compound fertilisers.
Main decarbonisation options are using hydrogen with a lower CO2 footprint (e.g. green hydrogen from electrolysis) and carbon capture and storage.
Reading guide
Section 1 introduces the Dutch fertiliser industry. Section 2 describes the current situation for fertiliser production processes in the Netherlands and Section 3 discusses the products that are produced in these processes. Options for decarbonisation are examined in Section 4. The feasibility of these decarbonisation options is discussed in Section 5.
1 Fertiliser production
in the Netherlands
This chapter discusses the fertiliser industry of the Netherlands. Detailed information is presented on Yara Sluiskil B.V. and OCI Nitrogen B.V.
1.1 The Dutch fertiliser industry
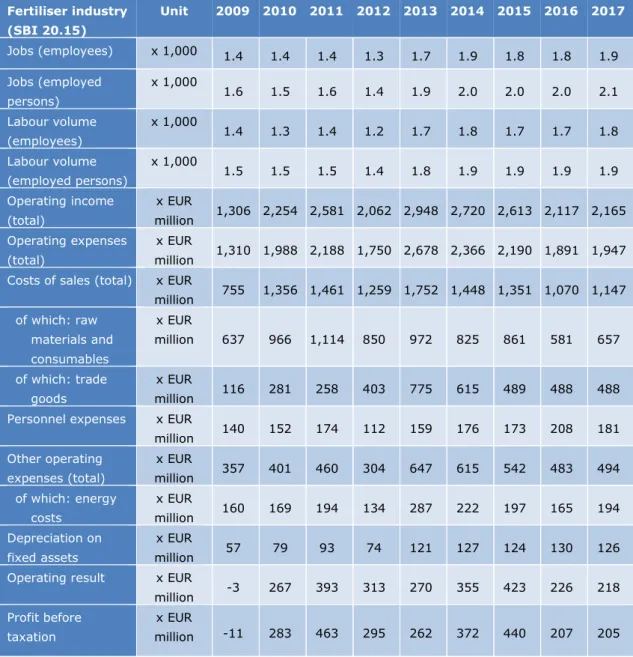
The Dutch fertiliser industry employs approximately 2,000 people. In 2016, the total
operating income was EUR 2.1 billion and the profit before taxation was EUR 0.2 billion. The costs of raw materials and consumables (EUR 0.6 billion) and the costs of energy (EUR 0.2 billion) represent a substantial share of the total operating expenses (see Table 1) (CBS, 2018).
According to the NACE classification, the activities of the fertiliser sector include(Eurostat, 2008):
o manufacture of fertilisers:
straight or complex nitrogenous, phosphatic or potassic fertilisers; urea, crude natural phosphates and crude natural potassium salts; o manufacture of associated nitrogen products:1
nitric and sulfonitric acids, ammonia, ammonium chloride, ammonium carbonate, nitrites and nitrates of potassium.
In the Netherlands, the four main fertiliser producing companies are Yara Sluiskil B.V., OCI Nitrogen B.V., ICL Fertilisers and Rosier Nederland (Meststoffen Nederland, 2015). This report focuses on the nitrogen-based fertiliser production at Yara Sluiskil and OCI Nitrogen, because these are the largest companies in terms of production volume and energy
consumption.
Rosier Nederland B.V. annually produces approximately 500,000 tonnes of fertilisers with nitrogen, phosphate, potassium and sulfur as main components (Rosier Nederland B.V., 2019). In 2017, EU ETS emissions from Rosier Nederland B.V. were 16,245 tCO2eq. ICL Amsterdam produces approximately 600,000 tonnes of (mainly phosphate potassium) fertilisers per year (ICL, 2019). In total, the fertiliser industry in the Netherlands comprises 40 companies2.
1 Ammonium chloride and ammonium carbonate are not produced in the Netherlands.
2 CBS data for the first quarter of 2018 from the statistic ‘Bedrijven; bedrijfstak’ [businesses: business
Table 1 Labour data and financial data for the Dutch fertiliser industry, for 2009– 2017. Source: (CBS, 2018) Fertiliser industry (SBI 20.15) Unit 2009 2010 2011 2012 2013 2014 2015 2016 2017 Jobs (employees) x 1,000 1.4 1.4 1.4 1.3 1.7 1.9 1.8 1.8 1.9 Jobs (employed persons) x 1,000 1.6 1.5 1.6 1.4 1.9 2.0 2.0 2.0 2.1 Labour volume (employees) x 1,000 1.4 1.3 1.4 1.2 1.7 1.8 1.7 1.7 1.8 Labour volume (employed persons) x 1,000 1.5 1.5 1.5 1.4 1.8 1.9 1.9 1.9 1.9 Operating income (total) x EUR million 1,306 2,254 2,581 2,062 2,948 2,720 2,613 2,117 2,165 Operating expenses (total) x EUR million 1,310 1,988 2,188 1,750 2,678 2,366 2,190 1,891 1,947 Costs of sales (total) x EUR
million 755 1,356 1,461 1,259 1,752 1,448 1,351 1,070 1,147 of which: raw materials and consumables x EUR million 637 966 1,114 850 972 825 861 581 657 of which: trade goods x EUR million 116 281 258 403 775 615 489 488 488 Personnel expenses x EUR
million 140 152 174 112 159 176 173 208 181 Other operating expenses (total) x EUR million 357 401 460 304 647 615 542 483 494 of which: energy costs x EUR million 160 169 194 134 287 222 197 165 194 Depreciation on fixed assets x EUR million 57 79 93 74 121 127 124 130 126
Operating result x EUR
million -3 267 393 313 270 355 423 226 218 Profit before
taxation
x EUR
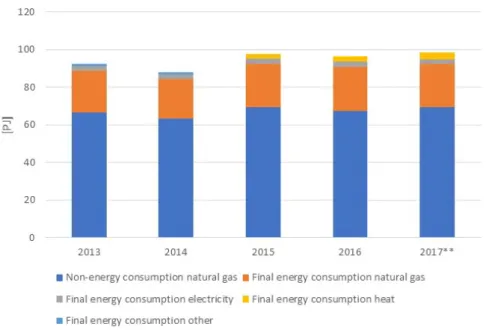
million -11 283 463 295 262 372 440 207 205 Natural gas is the main input for the nitrogen fertiliser industry. In 2017, the total
consumption of natural gas was 96.3 PJ (3.04 billion Nm3).3 Most of the natural gas can be attributed to non-energy consumption (69.6 PJ). The non-energy use of natural gas in the fertiliser industry can be fully allocated to ammonia production (Neelis, 2008). The final consumption of electricity was 2.7 PJ (0.75 TWh).4 The net electricity supply from the grid was 1.8 PJ (0.50 TWh). Natural gas is also used as an input for combined heat and power (CHP) installations, which produce electricity and heat. Figure 1 shows the development of the final energy and non-energy consumption of the Dutch fertiliser industry for the period 2013–2017. Table 2 shows the full energy balance for the sector in the same period.
3 Based on a Net Calorific Value of 31.65 MJ/Nm3. 4 1 TWh = 3.6 PJ.
Figure 1 Final energy and non-energy consumption of the fertiliser industry of the Netherlands in 2013–2017. Source: CBS5
Table 2 Energy balance for the fertiliser industry of the Netherlands. Source: CBS6
[PJ] Energy carrier 2013 2014 2015 2016 2017*
Final energy consumption Natural gas 22.4 21.2 23.2 23.3 22.7 Waste and other energy sources 1 1.1
Electricity 2.5 2.5 2.6 2.7 2.7
Heat 0 0 2.6 3.0 3.4
Non-energy consumption Natural gas 66.5 63.2 69.4 67.5 69.6 Net consumption electricity/CHP transformation Natural gas 4.0 4.1 4.0 3.8 3.9 Electricity -0.9 -0.9 -0.9 -0.8 -0.9 Heat 0 0 -1.5 -2 -2.3
Net consumption other
transformations Waste and other energy sources Heat -1.8 1.8 -1.4 1.4 -2.1 2.1 -1.7 1.7 -2.8 2.8 Total consumption Natural gas 93 88.5 96.5 94.7 96.3 Waste and other energy sources 2.8 2.5 2.1 1.7 2.8
Electricity 1.5 1.6 1.7 1.8 1.8
Heat -1.8 -1.4 -1.1 -0.7 -1.7
Energy supply (+) Natural gas 93 88.5 96.5 94.7 96.3
Electricity 1.5 1.6 1.7 1.9 1.8
Heat 1.1 1.2 1.1 1.1 1.2
Energy delivery (-) Heat 3.0 2.6 2.3 1.8 2.9
Winning Waste and other energy sources 2.8 2.5 2.1 1.7 2.8
5 Sector 2015 ‘Manufacture of fertilisers and nitrogen compounds’. Data for 2017 are revised provisional (CBS, 2018).
1.2 Yara Sluiskil B.V.
Yara Sluiskil produces around 5 million tonnes of fertiliser products per year (Yara Sluiskil B.V., 2017). The production site, which is located at the canal from Gent to Terneuzen, was opened in 1929 (Yara, 2018a). The site was formerly known as Hydro Agri Sluiskil B.V. Now, it is a production site of the Norwegian company Yara International ASA (Yara, 2019). In 2017, Yara Sluiskil had 594 employees (Yara Sluiskil B.V. , 2018).
Yara Sluiskil has three ammonia plants, four CO2 plants, two nitric acid plants, one urea prilling plant, one urea granulation plant and two nitrate granulation plants (Yara,
2018b).The three ammonia plants (‘C’, ‘D’ and ‘E’) use natural gas to produce ammonia and have a combined production capacity of approximately 1.8 million tonnes of NH3 per year.
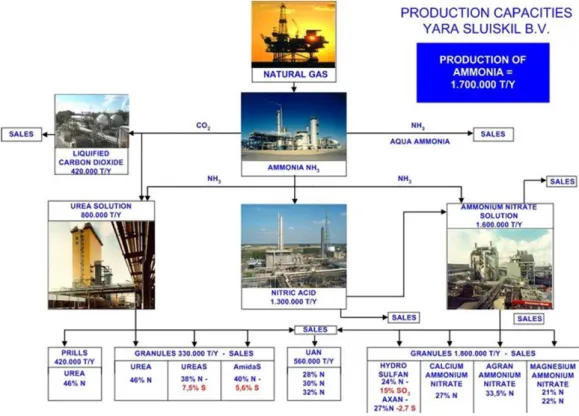
Figure 2 Production capacities of Yara Sluiskil B.V. in 2007 (Verkerke, 2007)
Figure 2 shows the production capacities of Yara Sluiskil in 2007. There have been several changes to the site since then. Some of the main changes are:
• In 2007, Yara replaced the gas turbine in its power station (Yara Sluiskil B.V., 2014). • In 2009, Yara received a permit for a distribution system that delivers heat and CO2
to greenhouse companies in the greenhouse area Kanaalzone in Terneuzen
(Gedeputeerde Staten van Zeeland, 2009a). This ‘WarmCO2’ project is an initiative of Yara Sluiskil and Zeeland Seaports. In 2017, heat and CO2 were supplied to 96 out of a potential 150 hectares (Yara Sluiskil B.V., 2017). The greenhouses are supplied with water at 85 ˚C (Yara Sluiskil B.V. , 2018).
• In 2017, Yara received a permit to add a ‘shell and tube’ heat exchanger at ammonia plant E. The heat exchanger heats water for the WarmCO2 grid and allows to supply an additional 7 MW of heat to the greenhouse area (Gedeputeerde Staten van Zeeland, 2017a).
• Yara has increased its production capacity for urea solution. The ‘Ureum 7’ plant, which has a capacity of 1.3 million tonnes per year (Chemicals Technology, 2019), has replaced the ‘Ureum 5’ and ‘Ureum 6’ urea solution plants (Gedeputeerde Staten van Zeeland, 2015). The ‘Ureum 7’ plant was put into service in 2011 and required an investment of EUR 420 million (Yara Sluiskil B.V., 2014).
• Yara has replaced a steam turbine in its nitric acid plant with a new steam turbine that has a higher efficiency. This enabled an increased steam export (Yara Sluiskil B.V., 2014)7.
• The output of ‘Ureum 7’ (urea solution) is processed into solid end products
(Gedeputeerde Staten van Zeeland, 2016). In March 2016, Yara started construction of a new urea granulation plant (‘Ureum 8’) (Yara Sluiskil B.V., 2017), replacing the ‘Ureum 6’ prilling plant. From 1 January 2018, the prilling tower has no longer been used and the urea solution is now being processed in the new granulator
(Gedeputeerde Staten van Zeeland, 2017b). The granulation plant has a capacity of 660,000 tonnes per year and its construction required an investment of EUR 240 million (Petrochem, 2019)8.
• In March 2018, Yara has received an environmental permit to build and take into production a hydrogen receiving station. The hydrogen will be used in ammonia plant D (Gedeputeerde Staten van Zeeland, 2018).
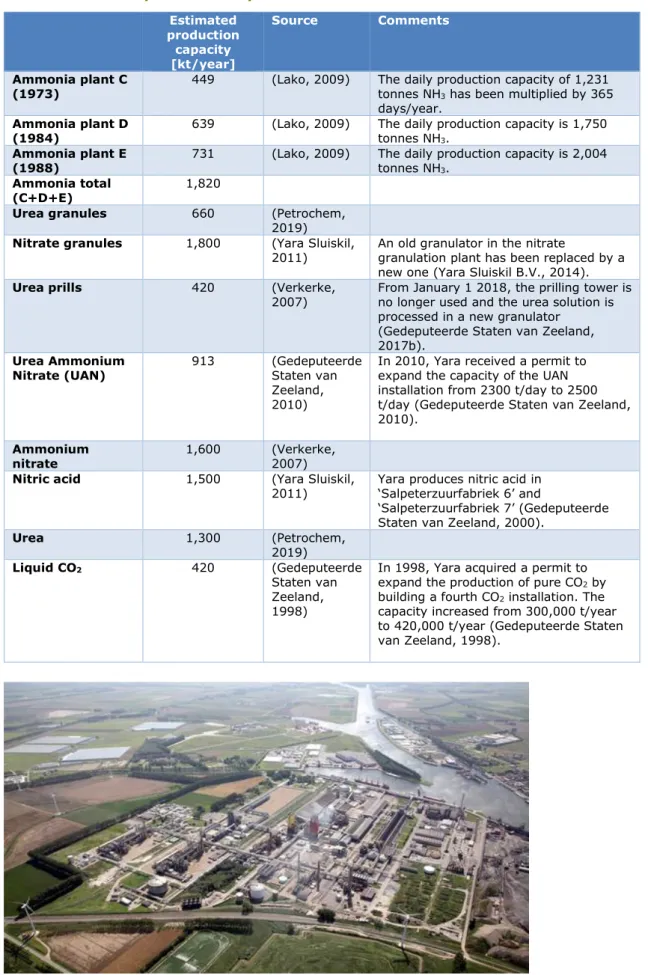
Table 3 provides an overview of the estimated production capacity of Yara Sluiskil in 2017.
7 In 2003, Yara built a new steam turbine to replace three older turbines. The older turbines were taken out of operation (Gedeputeerde Staten van Zeeland, 2003).
8 ‘Ureum 6’ had a capacity of 1,400 t/day. The ‘Ureum 8’ granulator has a production capacity of 1,850 t/day of urea granules or 2,400 t/day of Amidas/Ureas granules. The energy consumption of ‘Ureum 8’ is higher than of ‘Ureum 6’, which is inherent to the process (Gedeputeerde Staten van Zeeland, 2016).
Table 3 Estimated production capacities of Yara Sluiskil B.V. in 2017 Estimated production capacity [kt/year] Source Comments Ammonia plant C
(1973) 449 (Lako, 2009) The daily production capacity of 1,231 tonnes NH3 has been multiplied by 365 days/year.
Ammonia plant D
(1984) 639 (Lako, 2009) The daily production capacity is 1,750 tonnes NH3. Ammonia plant E
(1988) 731 (Lako, 2009) The daily production capacity is 2,004 tonnes NH3. Ammonia total
(C+D+E) 1,820
Urea granules 660 (Petrochem, 2019) Nitrate granules 1,800 (Yara Sluiskil,
2011) An old granulator in the nitrate granulation plant has been replaced by a new one (Yara Sluiskil B.V., 2014). Urea prills 420 (Verkerke,
2007) From January 1 2018, the prilling tower is no longer used and the urea solution is processed in a new granulator
(Gedeputeerde Staten van Zeeland, 2017b).
Urea Ammonium
Nitrate (UAN) 913 (Gedeputeerde Staten van Zeeland, 2010)
In 2010, Yara received a permit to expand the capacity of the UAN installation from 2300 t/day to 2500 t/day (Gedeputeerde Staten van Zeeland, 2010).
Ammonium
nitrate 1,600 (Verkerke, 2007) Nitric acid 1,500 (Yara Sluiskil,
2011) Yara produces nitric acid in ‘Salpeterzuurfabriek 6’ and
‘Salpeterzuurfabriek 7’ (Gedeputeerde Staten van Zeeland, 2000).
Urea 1,300 (Petrochem, 2019) Liquid CO2 420 (Gedeputeerde Staten van Zeeland, 1998)
In 1998, Yara acquired a permit to expand the production of pure CO2 by building a fourth CO2 installation. The capacity increased from 300,000 t/year to 420,000 t/year (Gedeputeerde Staten van Zeeland, 1998).
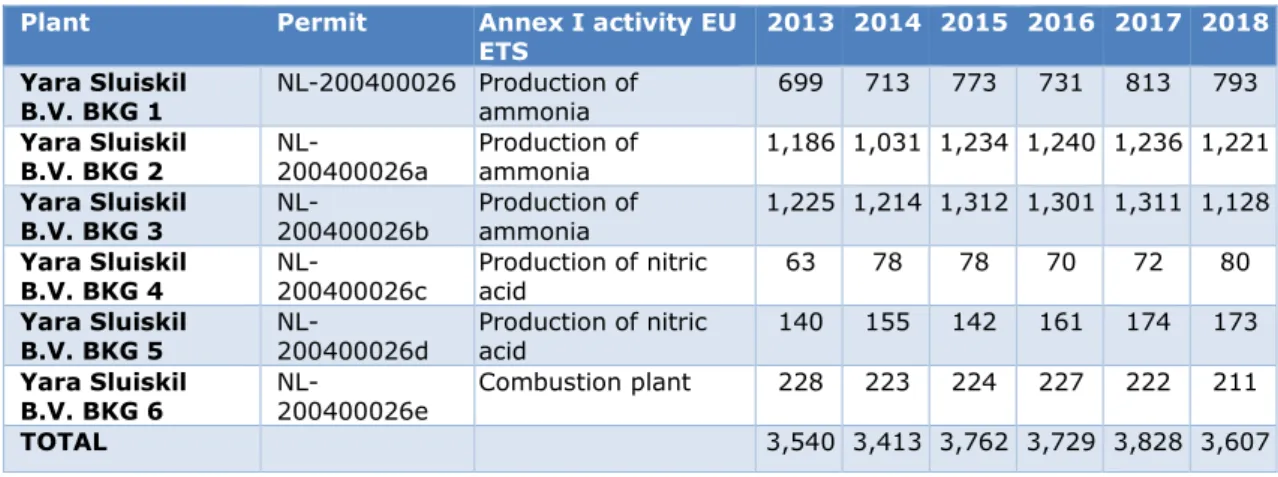
Table 4 shows the EU ETS emissions of Yara Sluiskil B.V. in the period 2013–2018. In 2017, emissions amounted to 3.8 million tonnes CO2eq. The EU ETS covers nitrous oxide (N2O) emissions from the production of nitric acid (European Commission, 2016). The EU ETS not only covers the direct emissions, but also the CO2 that is captured in the urea (to be released in the chain at a later moment) or CO2 that is sold for other purposes (De Bruyn, Koopman, Van Lieshout, Croezen and Smit, 2014).
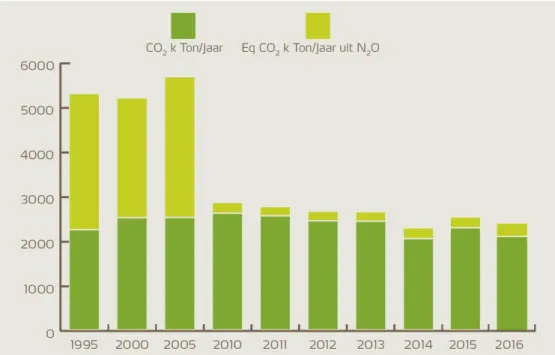
Table 5 shows CO2 and N2O emissions at Yara Sluiskil B.V. from the Dutch Pollutant Release and Transfer Register. In 2017, Yara emitted 3.6 million tonnes of CO2 and 820 tonnes of N2O. In its sustainability report, Yara reports figures that do not include the amount of CO2 for carbon capture and utilisation.9 Investments in catalyst technologies have strongly reduced the amount of emitted N2O (see Figure 4).
Table 4 EU ETS emissions of Yara Sluiskil B.V. in kt CO2eq per year, for the 2013–
2017 period. Source: Dutch Emissions Authority (NEa)
Plant Permit Annex I activity EU
ETS 2013 2014 2015 2016 2017 2018 Yara Sluiskil
B.V. BKG 1 NL-200400026 Production of ammonia 699 713 773 731 813 793 Yara Sluiskil
B.V. BKG 2 NL-200400026a Production of ammonia 1,186 1,031 1,234 1,240 1,236 1,221 Yara Sluiskil
B.V. BKG 3 NL-200400026b Production of ammonia 1,225 1,214 1,312 1,301 1,311 1,128 Yara Sluiskil
B.V. BKG 4 NL-200400026c Production of nitric acid 63 78 78 70 72 80 Yara Sluiskil
B.V. BKG 5 NL-200400026d Production of nitric acid 140 155 142 161 174 173 Yara Sluiskil
B.V. BKG 6 NL-200400026e Combustion plant 228 223 224 227 222 211 TOTAL 3,540 3,413 3,762 3,729 3,828 3,607
Table 5 Emissions of CO2 and N2O by Yara Sluiskil B.V. Source: Pollutant Release
and Transfer Register (PRTR) 10
Carbon dioxide [kt CO2/yr] Nitrous oxide [kt N2O/yr] Nitrous oxide [kt CO2eq/yr] Total [kt CO2eq/yr] 2005 2,549 10.2 3,028 5,577 2010 2,641 0.79 235 2,876 2015 3,547 0.74 220 3,767 2016 3,501 0.78 231 3,732 2017 3,585 0.82 245 3,830
9 According to Yara, the amount of CO2 for carbon capture and utilization was 1.4 Mt CO2 in 2017 (Yara Sluiskil B.V. , 2018).
10 The CO
2 equivalent emissions have been calculated based on a Global Warming Potential (GWP) of N2O of 298 tCO2/tN2O. There are minor differences compared to the ETS emissions in Table 4 which are likely due to rounding.
Figure 4 Greenhouse gas emissions from Yara Sluiskil’s sustainability report (Yara Sluiskil B.V., 2017)
1.3 OCI Nitrogen B.V.
OCI Nitrogen B.V. in Geleen is a large producer of fertilisers and the world’s largest producer of melamine (OCI Nitrogen, 2018a). In 1927, the company ‘Stikstofbindingsbedrijf’ (which was founded by the Dutch State Mines) commenced the construction of a fertiliser plant in Geleen. After several organisational changes, OCI Nitrogen was formed in a merger of DSM Agro and DSM Melamine in 2010 (OCI Nitrogen, 2018b). OCI Nitrogen is a subsidiary of OCI N.V., a global producer and distributor of natural-gas-based fertilisers and industrial
chemicals (OCI N.V., 2018a).
Each year, OCI Nitrogen produces around 1 million tonnes of ammonia, of which
approximately 900 kt are consumed by the Chemelot site users. About 100,000 tonnes of ammonia are sold and transported by rail. and about 6,000 tonnes by truck (OCI Nitrogen, 2018c).
The main office and the main production facilities are located on the Chemelot site in Geleen. OCI Nitrogen owns two port facilities: OCI Terminal Europoort and OCI Terminal Stein (OCI Nitrogen, 2018a). In the region of Limburg, OCI Nitrogen has approximately 500 employees (OCI Nitrogen, 2018a). In 2016, the turnover of OCI Nitrogen was approximately EUR 750 million (OCI Nitrogen, 2018d).
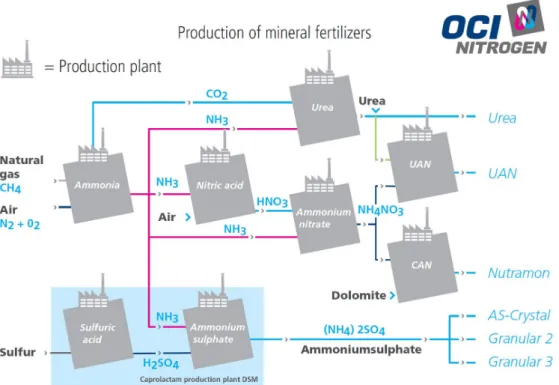
Figure 5 gives an overview of the production of mineral fertilisers at OCI Nitrogen.
OCI Nitrogen operates production plants for ammonia, nitric acid, ammonium nitrate, urea, Urea Ammonium Nitrate (UAN) and Calcium Ammonium Nitrate (CAN). It also produces melamine, which is mainly used in the wood processing industry and for producing tableware, flame retardants and glues (Gedeputeerde Staten van Limburg, 2018a). Utility Support Group BV supplies energy and utilities to the Chemelot site (Gedeputeerde Staten van Limburg, 2017).
Table 6 shows OCI Nitrogen’s production capacities in 2017. Changes that have taken place at the site include:
• One of the nitric acid plants of DSM in IJmuiden was relocated to Geleen in 2010 (OCI Nitrogen, 2018b). In 2009, DSM Geleen had two nitric acid plants with capacities of 500 kt/year and 210 kt/year. The capacities of the DSM plants in IJmuiden were 245 kt/year and 255 t/year (Ecofys, Fraunhofer Institute for Systems and Innovation Research, Öko-Institut, 2009).
• In 2016, OCI Nitrogen invested in a catalyst replacement at its nitric acid plant to reduce its nitrous oxide emissions. According to OCI, this resulted in a 75% decrease in emissions (OCI N.V., 2018a).
Table 6 Estimated production capacities of OCI Nitrogen in the Netherlands in 2017
Estimated production capacity [kt/year] Source Comments Ammonia total (AFA-2 and AFA-3)11
1,184 (OCI N.V., 2018a) In 2009, ECN reported a capacity of 1,500 t/day for AFA-2 (built in 1971) and 1,500 t/day for AFA-3 (built in 1983) (Lako, 2009). 3,000 t/day corresponds to 1,095 kt NH3/year (multiplied by 365 days/year). Urea Ammonium Nitrate (UAN)
730 (OCI N.V., 2018a) Full UAN capacity cannot be achieved when producing max. CAN capacity. Nitric acid 965 (Ecofys, Fraunhofer
Institute for Systems and Innovation Research,
Öko-Institut, 2009)
One of the nitric acid plants of DSM in IJmuiden was relocated to Geleen (OCI Nitrogen, 2018b). Urea 525 (European Commission, 2007) Calcium Ammonium Nitrate (CAN) 1,542 (OCI N.V., 2018a)
Melamine 164 (OCI N.V., 2018a) OCI Nitrogen’s melamine production capacity of 55 ktpa in China is not included.
11 This the gross production capacity for ammonia. The estimated remaining capacity after downstream
Figure 5 Overview of the production of mineral fertilisers at OCI Nitrogen B.V. Source: (OCI Nitrogen., 2012)
Table 7 shows the ETS emissions of Chemelot in the period 2013–2018. In 2017, the EU ETS emissions of the Chemelot site were 4.7 million tonnes CO2eq. Production of ammonia and nitric acid takes place in the plants Chemelot BKG 03-07, with combined emissions of 1.9 million tonnes CO2eq in 2017.
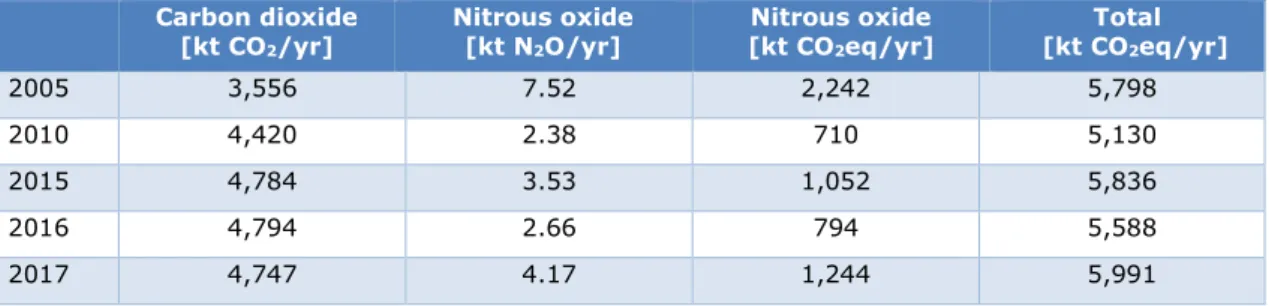
Table 8 shows Chemelot’s emissions of CO2 and N2O from the Pollutant Release and Transfer Register (PRTR). In 2017 Chemelot emitted 4.7 million t/CO2 and the N2O emissions were 4,170 t/N2O.
Table 7 ETS emissions of Chemelot in kt CO2eq. Source: Dutch Emissions Authority
(NEa)
Plant Permit Annex I activity
EU ETS 2013 2014 2015 2016 2017 2018 Chemelot
BKG 01 NL-200400161 Combustion plant 747 769 757 731 595 754 Chemelot
BKG 02 NL-200400161a Production of organic bulk chemicals 1,517 1,755 1,695 1,788 1,772 1602 Chemelot BKG 03 NL-200400161b Production of ammonia 950 857 945 920 1,014 759 Chemelot BKG 04 NL-200400161c Production of ammonia 925 921 707 825 807 946 Chemelot
BKG 05 NL-200400161d Production of nitric acid 26 62 63 26 29 23 Chemelot
BKG 06 NL-200400161e Production of nitric acid 16 14 17 18 30 11 Chemelot
BKG 07 NL-200400161f Production of nitric acid 35 56 76 1 3 2 Chemelot
BKG 08 NL-200400161g Combustion installation 99 66 90 48 86 61 Chemelot
BKG 09 NL-200400161h Production of organic bulk chemicals
171 170 156 168 176 179
Chemelot
BKG 10 NL-200400161i Combustion plant 93 73 84 73 61 92 Chemelot BKG 11 NL-200400161j Combustion plant 45 49 43 44 48 52 Chemelot BKG 12 NL-200400161k Combustion plant 52 68 71 79 54 78 Chemelot BKG 13 NL-200400161l Combustion plant 43 6 4 4 4 5 Chemelot BKG 14 NL-200400161m Combustion plant 83 69 76 69 68 78 TOTAL 4,802 4,936 4,784 4,794 4,747 4,643
Table 8 Emissions of CO2 and N2O by Chemelot site permit B.V. Source:
Emissieregistratie12 Carbon dioxide [kt CO2/yr] Nitrous oxide [kt N2O/yr] Nitrous oxide [kt CO2eq/yr] Total [kt CO2eq/yr] 2005 3,556 7.52 2,242 5,798 2010 4,420 2.38 710 5,130 2015 4,784 3.53 1,052 5,836 2016 4,794 2.66 794 5,588 2017 4,747 4.17 1,244 5,991
12 The CO2 equivalent emissions have been calculated based on a Global Warming Potential (GWP) of N2O of 298 tCO2/tN2O. There are differences compared to the ETS emissions in
Table 7. One reason for this is that not all N2O emissions at the Chemelot site are covered by the EU ETS.
2 Fertiliser processes
This section discusses the processes that are currently applied in the fertiliser industry of the Netherlands. Ammonia production, urea production and nitric acid production are discussed in detail.
Fertilisers essentially provide three major plant nutrients (nitrogen, phosphorus and potassium) in plant available forms (European Commission, 2007). Figure 6 presents a general overview of the process routes that are used to produce mineral fertilisers. In the Netherlands, the nitrogen fertilisers are the most important in terms of production volumes and energy consumption. This report focuses on the nitrogen-based fertiliser production at Yara Sluiskil and OCI Nitrogen.
Figure 6 The production of main fertiliser products. Source: (Fertilizers Europe, 2018)13
2.1 Ammonia production
Ammonia production is the most energy-intensive process in the fertiliser industry. Ammonia is nearly exclusively produced in large scale plants using the Haber-Bosch process, in which ammonia is synthesised from hydrogen and nitrogen on a Fe-based catalyst. The nitrogen is obtained from the air. The hydrogen is most often produced from steam reforming of natural
gas (Bazzanella and Ausfelder, 2017).
Figure 7 gives a schematic overview of the production process for ammonia including the chemical reactions and their input and output flows. The production process involves several steps that will be described in detail below. The description of the ammonia production steps
13 This simplified overview does not include Calcium Ammonium Nitrate (CAN), which is obtained by mixing an ammonium nitrate solution with dolomite, limestone or calcium carbonate (European Commission, 2007).
in this section is based on the reference document on Best Available Techniques for the manufacture of large volume inorganic chemicals of the European Commission (European Commission, 2007).
Figure 7 Schematic overview of ammonia production. The blue arrows show the reactions at different steps of the ammonia production process. The red arrows represent the flow of the reaction. Source: (European Commission, 2007) Table 9 Overview of the ammonia production process. Source (European Commission, 2007)
No Equations Step Heat of reaction
1 CH4 + H2O→CO + 3H2 Reforming +206 kJ/mol
2 CO + H2O →CO2 + H2 Water gas shift reaction – 41 kJ/mol
3 CO + 3H2 → CH4 + H2O Methanation –206 kJ/mol
4 CO2 + 4H2→ CH4 + 2 H2O Methanation –165 kJ/mol
5 N2 + 3 H2→ 2NH3 Ammonia synthesis – 46 kJ/mol
Step 1: Desulfurisation of natural gas
The first step in the ammonia production process is to remove the sulfur content from the natural gas as the catalyst used in the steam reforming process is very sensitive to any sulfur compounds. According to European Commission studies, the sulfur compounds need to be reduced to a concentration of less than 0.15 mg S/Nm3 feed gas. For desulfurisation, the feed gas is pre-heated up to 350–400 °C. Afterwards, hydrogen gas is introduced that reacts with sulfur compounds to form hydrogen sulfide (H2S). The hydrogen required for the reaction is usually recycled from the synthesis reaction of the plant.
Step 2: Reforming
The reforming is divided into primary and secondary reforming. In primary reforming, the desulfurised gas enters the primary reformer at a temperature in the range of 400–600 °C and is mixed with the steam. The hydrocarbons conversion rate is 60% in the primary reformer in most of the conventional steam reforming processes.
After the primary reformer, the gas mixture enters to the secondary reformer and air is entered at this stage that is needed for the production of ammonia. As only about 60% of feed-gas was reformed in the primary reformer, the reforming process is completed in the secondary reformer. A high temperature is provided in order to increase the conversion rate of hydrocarbons. It is achieved by the internal combustion of part of the reaction gas and the process air that is also a source of nitrogen. Later, it is passed through nickel containing catalysts. About 99% of hydrocarbons are converted in the secondary reformer at a temperature of 500–600 °C, whereas the gas outlet temperate is 1000 °C. Heat is removed by the use of a waste heat boiler and the gas is cooled down to approximately 330–380 °C.
Step 3: Shift conversion
In the shift converter, a reaction is carried out in two steps to convert the 10% CO left over in the secondary reformer into CO2 and H2. The main goal of this water gas shift reaction is to produce hydrogen gas. The reaction is exothermic. A copper-based catalyst is currently used for low-temperature water gas shift reactions.
Step 4: Carbon dioxide removal and methanation
The residual CO2 content in the reaction gas is usually in the range of 50–3,000 ppmv. Both physical and chemical absorption processes are used to remove carbon. In a chemical absorption process by using solvents such as mono ethanolamine (MEA), activated methyl diethanolamine (aMDEA) or in a physical absorption process by using solvents such as glycol dimethylethers (Selexol). Small amounts of CO and CO2 (e.g. 0.4% CO and 0.01% CO2), remaining in the synthesis gas, have to be removed to prevent poisoning of the catalyst that is used in the ammonia synthesis step. These compounds are converted into methane in the methanator in the presence of a nickel catalyst at a temperature of 300 °C.
Step 5: Ammonia synthesis
The ammonia synthesis is the last step in the ammonia production plant. It takes place in the presence of an iron-based catalyst at a pressure of 100–150 bar and a temperature that ranges from 300–550 °C. The gas after compression is separated by condensation. The final result is a 10%–20% ammonia yield. The unreacted gas recirculates. To prevent high CH4 and Argon concentrations these gases are separated and methane is used for the heating of the primary reformer.
According to a benchmarking study of the International Fertilizer Industry Association (IFA), in 2008 the average net energy efficiency in 93 ammonia plants was 36.6 GJ/t NH3. The top quartile performed in the range of 28 to 33 GJ/t NH3 (International Fertilizer Industry Association (IFA), 2009).
The best practice technology (BPT) energy use for ammonia production based on natural gas (in final terms) is (IEA, 2009):
• Natural gas (feedstock): +20.7 GJ/t NH3; • Natural gas (fuel): +10.9 GJ/t NH3; • Electricity: +0.3 GJ/t NH3;
• Steam: -3.9 GJ/t NH3; • Total: +28 GJ/t NH3.
In this case, there is a net steam export of 3.9 GJ/t NH3. Modern steam reforming processes can be designed with no steam export or with some export of low/medium pressure steam (Fertilizers Europe, 2000).
The theoretical minimum energy use for the production process is 21.2 GJ/t ammonia. The lower heating value of ammonia is only 18.7 GJ/t, which means that residual heat is generated which may be used for other purposes (IEA/OECD, 2007).
Lako gives the energy efficiency of the ammonia plants in the Netherlands in 200514 (Lako, 2009): • AFA-2 (Geleen): ~31.7 GJ/t NH3 • AFA-3 (Geleen): ~31.7 GJ/t NH3 • Yara C (Sluiskil): ~30.5 GJ/t NH3 • Yara D (Sluiskil): ~30.5 GJ/t NH3 • Yara E (Sluiskil): ~30.0 GJ/t NH3
On average, the energy efficiency improvements of ammonia plants in Europe have been limited in the recent past. Between 2004 and 2011, a modest decline of -0.17% per year was observed for a group of 26 European ammonia plants (CEFIC, 2013). In this report, it is assumed that the energy efficiency of the Dutch ammonia plants has remained unchanged since 2005.
Stoichiometrically, CO2 is formed as coproduct at 0.97 t/CO2 per t/NH3. In reality, average direct (feedstock-related) CO2 emissions from European ammonia plants amount to 1.33 tCO2/tNH3. When the hydrogen is supplied by methane steam reforming, the feedstock-related CO2 emissions are unavoidable (Bazzanella and Ausfelder, 2017).
According to CEFIC, new ammonia plants can achieve an energy demand of 28 GJ/t NH3. This efficiency is reached by an optimised steam reforming section, a low pressure synthesis loop and better process integration (CEFIC, 2013). Greenfield ammonia plants are expected to reach an energy demand of 27 GJ/t NH3 by 2030 and 26 GJ/t NH3 by 2050, assuming high integration with other industrial processes or heat recovery systems (CEFIC, 2013).
2.2 Urea production
Urea is a downstream product of ammonia production. The basic raw materials for urea production are ammonia (NH3) and carbon dioxide (CO2). Both can be obtained from a ammonia-synthesis plant, and therefore urea production is often integrated in ammonia
plants. To synthesise urea, NH3 and CO2 react at high pressure forming ammonium
carbamate, which is then dehydrated by applying heat, forming urea and water (European Commission, 2007).
For urea production, NH3 and CO2 are fed into a reactor which operates at a temperature of 180–210 °C and a pressure of 150 bar. CO2 are NH3 are partially converted into carbamate. In the next step, the unreacted CO2 and NH3 are removed, for which CO2 is used as a stripping agent. During the first reaction, ammonium carbamate is produced. It is a fast and exothermic reaction and takes place at a pressure of 120–250 bar. It is followed by a second reaction that involves the dehydration of ammonium carbamate to produce urea. The second reaction is comparatively slow and endothermic (Fertilizers Europe, 2000).
Usually, the urea solution from the synthesis/recycling stages of the process is concentrated via evaporation or crystallisation to a urea melt. This urea melt is converted to a solid prilled
or granular product. In some cases, urea is produced solely for melamine production (European Commission, 2007).
Table 10 Overview of the urea production process. Source: (European Commission, 2007)
No Equations Step Heat of reaction
1 2 NH3 + CO2 NH2COONH4 Ammonium carbamate
synthesis -160 kJ/mol
2 NH2COONH4 H2O + NH2CONH2 Urea synthesis + 41 kJ/mol
The consumption of NH3 per tonne of urea is estimated to be in the range of 564 to 600 kg (European Commission, 2007). The consumption of CO2 per tonne of urea is estimated to be in the range of 730–750 kg (European Commission, 2007). To calculate the mass flows for OCI Nitrogen and Yara we assume an input of 0.57 tNH3/t urea (Kool, Marinussen and Blonk, 2012) and 0.73 tCO2/t urea (Bazzanella and Ausfelder, 2017).
The new ‘Ureum 7’ plant of Yara Sluiskil is based on the Total Recycling Stripping Process, and uses 80% less electricity than the old urea solution plants ‘Ureum 5’ and ‘Ureum 6’. This is realised by using steam instead of electricity for driving the CO2 compressor and by using a CO2 stripping process that works at low pressure (Gedeputeerde Staten van Zeeland, 2009b).
The energy demand of isolated urea production is hard to estimate, because it is usually highly integrated in the ammonia plant. Based on best practice technology values, it is assumed that 2.2 GJ of steam and 0.3 GJ of electricity are required to produce one tonne of urea (IEA, 2009). Schyns reports a weighted EU average energy consumption of 5,06 GJ/t urea (performance in 2003) (Schyns, 2006).
2.3 Nitric acid production
In Europe, most of the nitric acid (HNO3) is produced by the high-temperature catalytic oxidation of ammonia. This process typically consists of three steps: ammonia oxidation, nitric oxide oxidation, and absorption (Ecofys, Fraunhofer Institute for Systems and Innovation Research, Öko-Institut, 2009).
Nitric oxide is synthesised from the oxidation of ammonia. Subsequently, it is oxidised to nitrogen dioxide. The nitrogen dioxide is absorbed in water to form nitric acid and nitric oxide. The nitric oxide is cycled back for re-oxidation (CEFIC, 2013).
Table 11 Overview of the nitric acid production process. Source (European Commission, 2007)
No Equations Step
1 4 NH3 + 5 O2 4 NO + 6 H2O Oxidation of NH3
2 2 NO + O2 2 NO2 Oxidation of NO
3 3 NO2 + H2O 2 HNO3 + NO Absorption
The input of ammonia is 0.27 tNH3/t HNO3. The conversion efficiency from ammonia to nitric acid is approximately 94% (Yara HESQ/ TK Jenssen, 2011).
Heat can be recovered from the nitric acid production process, which is highly exothermal. The reaction of NH3 to HNO3 theoretically releases 6.3 GJ/t HNO3. However, energy losses and conversion of thermal energy to electrical energy in a steam turbine can reduce the net energy export (European Commission, 2007).
Lako cites a benchmark study of 83 nitric acid producers in which the energy export varied from +1.83 GJ/t HNO3 to -3.8 GJ/t HNO3 (Lako, 2009)15. According to Ecofys and JRC, energy recovery in dual pressure plants amounts to around 2.4 GJ/t HNO3 (Overgaag, Harmsen and Schmitz, 2009). Because of the wide range of the literature values, to calculate the energy flows for OCI Nitrogen and Yara it is assumed that there is no net energy export.
In nitric acid production, nitrous oxide (N2O) is generated as a by-product (European Commission, 2007). N2O is a strong greenhouse gas. Using modern technology N2O
emissions can be highly reduced. The BAT N2O emission level for new plants has a range of 0.12 – 0.6 kg N2O/t HNO3 and for existing plants of 0.12 – 1.85 kg N2O/tHNO3 (Overgaag, Harmsen and Schmitz, 2009).
2.4 Overview of energy flows, mass flows and
greenhouse gas emissions
The energy consumption at OCI Nitrogen and Yara Sluiskil can be estimated by combining the activity levels and the specific energy consumption of the processes at the plants. The characteristics that have been discussed in Chapters 1 and 2 can also be used to estimate the mass flows and the greenhouse gas emissions.
The operation of steam turbines and gas turbines (e.g. for compression of synthesis gas or electricity production) is strongly integrated in the ammonia production process (Boot, 1994). Here, these installations are considered to be part of the ammonia production process. Similarly, the production of end products is strongly integrated. For example, the ammonia plants can export steam to the urea plants. Some of the processes are exothermal, which complicates a detailed analysis at the installation level. The calculations are limited to the processes for ammonia, urea and nitric acid production and are based on 8,000 hours of operation per year.16
Table 12 shows estimated energy flows, mass flows and greenhouse gas emissions at Yara Sluiskil in 2017. Table 13 shows the results for OCI Nitrogen. The total estimated
consumption of natural gas by both companies is 94.4 PJ (2.98 billion Nm3) and the total estimated net consumption of electricity is 1.0 PJ (0.28 TWh). According to the energy balances of Statistics Netherlands (CBS), the consumption of natural gas of the fertiliser sector was 96.3 PJ (3.04 billion Nm3) and the net consumption of electricity was 1.8 PJ (0.50 TWh).
The greenhouse gas emissions of OCI Nitrogen in Table 13 (2.3 Mt CO2eq) are somewhat higher than the EU ETS emissions shown in Table 7 (1.9 Mt CO2eq). The greenhouse gas emissions of Yara Sluiskil in Table 12 (3.4 Mt CO2eq) are somewhat lower than the EU ETS emissions shown in Table 4 (3.8 Mt CO2eq). No public information is available on the production and energy efficiency of the companies.
15 The negative value implies that there is energy import.
Table 12 Estimated energy consumption and emissions of ammonia, urea and nitric acid production at Yara Sluiskil B.V. in 2017
Ammonia
plant C Ammonia plant D Ammonia plant E Urea Nitric acid Total
Capacity [kt product/year] 449 639 731 1,300 1,500 - Operating hours [h] 8,000 8,000 8,000 8,000 8,000 - Production [kt product/year] 410 584 668 1,187 1,370 - Input of ammonia [tNH3/t product] 0 0 0 0.57 0.27 - Input of ammonia [kt] 0 0 0 677 370 1,047 Input of CO2 [tCO2/t product] 0 0 0 0.73 0 - Input of CO2 [Mt] 0.0 0.0 0.0 0.9 0.0 0.9
Input of natural gas (fuel) [GJ/t
product] 13.4 13.4 12.9 0.0 0.0 -
Input of natural gas (fuel) [PJ] 5.5 7.8 8.6 0.0 0.0 22
Input of natural gas (feedstock)
[GJ/t product] 20.7 20.7 20.7 0.0 0.0 -
Input of natural gas (feedstock)
[PJ] 8.5 12.1 13.8 0.0 0.0 34
Input of natural gas (total) [GJ/t
product] 34.1 34.1 33.6 0.0 0.0 102
Input of natural gas (total) [PJ] 14.0 19.9 22.4 0.0 0.0 56 Net input of steam
[GJ/t product] -3.9 -3.9 -3.9 2.2 0.0 -
Net input of steam [PJ] -1.6 -2.3 -2.6 2.6 0.0 -3.9
Net input of electricity
[GJ/t product] 0.3 0.3 0.3 0.3 0.1 -
Net input of electricity [PJ] 0.1 0.2 0.2 0.4 0.1 1.0
CO2 emission (total)
[tCO2/t product] 1.9 1.9 1.9 0.0 0.0 -
CO2 emission (total) [Mt CO2] 0.8 1.1 1.3 0.0 0.0 3.2 CO2 emission (high purity CO2)
[tCO2/t product] 1.3 1.3 1.3 0.0 0.0 4.0
CO2 emission (high purity CO2)
[Mt CO2] 0.5 0.8 0.9 0.0 0.0 2.2 CO2 emission (combustion) [tCO2/t product] 0.6 0.6 0.6 0.0 0.0 1.8 CO2 emission (combustion) [Mt CO2] 0.2 0.3 0.4 0.0 0.0 1.0 N2O emission [kg N2O/t product] 0.0 0.0 0.0 0.0 0.6 - N2O emission [tN2O] 0 0 0 0 780 780 N2O emission [Mt CO2eq] 0.0 0.0 0.0 0.0 0.2 0.2
Greenhouse gas emission
Table 13 Estimated energy consumption and emissions of ammonia-, urea- and nitric acid production, at OCI Nitrogen B.V. in 2017
Ammonia (AFA-2 and AFA-3) Urea Nitric acid Total Capacity [kt product/year] 1,184 525 965 - Operating hours [h] 8,000 8,000 8,000 - Production [kt product/year] 1,081 479 881 2,442
Input of ammonia [tNH3/t product] 0 0.57 0.27 -
Input of ammonia [kt] 0 273 238 511
Input of CO2 [tCO2/t product] 0 0.73 0 -
Input of CO2 [Mt] 0.0 0.4 0.0 0.4
Input of natural gas (fuel) [GJ/t product] 14.6 0.0 0.0 -
Input of natural gas (fuel) [PJ] 15.8 0.0 0.0 15.8
Input of natural gas (feedstock) [GJ/t product] 20.7 0.0 0.0 20.7
Input of natural gas (feedstock) [PJ] 22.4 0.0 0.0 22.4
Input of natural gas (total) [GJ/t product] 35.3 0.0 0.0 35.3
Input of natural gas (total) [PJ] 38.1 0.0 0.0 38.1
Net input of steam [GJ/t product] -3.9 2.2 0.0 -
Net input of steam [PJ] -4.2 1.1 0.0 -3.2
Net input of electricity [GJ/t product] 0.3 0.3 0.1 -
Net input of electricity [PJ] 0.3 0.1 0.1 0.5
CO2 emission (total) [tCO2/t product] 2.0 0.0 0.0 -
CO2 emission (total) [Mt CO2] 2.2 0.0 0.0 2.2
CO2 emission (high purity CO2) [tCO2/t product] 1.3 0.0 0.0 1.3
CO2 emission (high purity CO2) [Mt CO2] 1.4 0.0 0.0 1.4
CO2 emission (combustion) [tCO2/t product] 0.7 0.0 0.0 0.7
CO2 emission (combustion) [Mt CO2] 0.7 0.0 0.0 0.7
N2O emission [kg N2O/t product] 0.0 0.0 0.6 -
N2O emission [tN2O] 0 0 502 502
N2O emission [Mt CO2eq] 0.0 0.0 0.1 0.1
3 Fertiliser products
and application
This section discusses some of the main products of the Dutch fertiliser industry, their applications and product markets.
3.1 Products of the fertiliser industry
According to the sector association Fertilizers Europe, the total European fertiliser production in 2016 was 16.6 million tonnes. Of this amount, 73% consisted of nitrogen (N) fertilisers, 11% of phosphorus (P2O5) fertilisers and 16% of potassium (K2O) fertilisers.
The main intermediate products of the nitrogen fertiliser industry are ammonia and nitric acid:
• Ammonia (NH3) is mainly used for the production of fertilisers. Ammonia is also widely used to produce synthetic materials such as melamine, caprolactam and acrylonitrile. It is used as a raw material for resins and pharmaceuticals and as a refrigerant (KPMG, TNO, ECORYS, 2004).The sector association Meststoffen Nederland (‘fertilisers Netherlands’) estimates that of the total Dutch ammonia production capacity of 2.6 million tonnes, 1.6 to 1.9 million tonnes are used for the production of fertilisers (Meststoffen Nederland, 2015).
• Nitric acid (HNO3) is also mainly used to produce fertilisers. In addition, nitric acid is used to produce explosives and chemicals such as caprolactam (European Commission, 2007). Nitric acid is also used for industrial cleaning (ISPT, 2017).
The European consumption of nitrogen fertilisers can be divided into nitrates (45%), urea (23%), Urea Ammonium Nitrate (13%), compound fertilisers (13%) and others (6%)17: • Ammonium nitrate (AN) is produced by neutralising nitric acid with ammonia in an
exothermic process. The released process heat is used to preheat the nitric acid, to evaporate water or ammonia, and to produce steam (Boot, 1994).
• Calcium Ammonium Nitrate (CAN) is obtained by mixing an ammonium nitrate solution with dolomite, limestone or calcium carbonate (European Commission, 2007). • Urea is used in fertilisers. It is also used as a feedstock for melamine, resins, medicines
and cosmetics (ISPT, 2017). Urea can also be used for DeNOx applications in power plants. Diluted urea is also used to prevent NOx emissions of trucks, cars and vessels (ISPT, 2017). For these purposes, urea solutions (such as Ad Blue) are made from concentrated urea solution by thinning it with demineralised water (Gedeputeerde Staten van Zeeland, 2008).
• For the production of Urea Ammonium Nitrate (UAN), concentrated urea and ammonium nitrate solutions are measured, mixed and then cooled (European Commission, 2007).
• Compound fertilisers contain more than one of the three basic nutrients N, P2O5 and K2O.
Solid fertiliser products are made by prilling and granulation (European Commission, 2007). The formation of spheres by the solidification of liquid droplets of fertiliser material is known as prilling. The prilling process is used to produce prills of ammonium nitrate and urea. Granulation requires a more complicated plant and a variety of equipment, including rotating pans and drums and fluidised beds.
Table 14 Inputs of production processes in the nitrogen fertiliser industry. Source: (Kool, Marinussen, & Blonk, 2012)
Product Input Value
Ammonium nitrate (AN) Ammonia 0.22 t NH3/t AN
Nitric acid 0.81 t HNO3/t AN
Urea Ammonium Nitrate (UAN) Urea 0.35 t urea/t UAN Ammonium nitrate 0.46 t AN/t UAN Calcium Ammonium Nitrate (CAN) Dolomite 0.24 t dolomite/t CAN
Ammonium nitrate 0.76 t AN/t CAN Ammonium Sulfate (AS) Ammonia 0.26 t NH3/t AS
Sulfuric acid 0.59 t H2SO4 /t AS
3.2 Product markets
The Dutch production of nitrogen compounds mainly takes place for fertiliser consumption in the agriculture sector of Western Europe. There is large import and export of fertilisers (De Bruyn, Koopman, Van Lieshout, Croezen and Smit, 2014).
The industry has to deal with increasing costs for greenhouse gas emissions as a result of the EU Emissions Trading System (EU ETS). Other developments that are important for the European ammonia and fertiliser industry are (De Bruyn, Koopman, Van Lieshout, Croezen and Smit, 2014):
• Changes in the costs of natural gas compared to other regions;
• Efficiency improvements in the use of fertilisers, which reduce the demand per unit of crop;
• Increased treatment of manure, which improves the availability of the nutrients for agricultural crops and reduces the demand for fertilisers;
• An increasing demand for agricultural products to produce biomass for energy or the chemical industry, which can increase the demand for nitrogen fertilisers.
In the Netherlands, animal manure and fertilisers are the main sources of nitrogen and phosphate for agricultural land. In the period 2005–2014, the supply of animal manure has remained stable and the supply of mineral fertilisers was reduced from an average of 135 kg N per hectare to an average of 104 kg N per hectare. The amount of phosphate fertiliser has reduced from 24 kg phosphate per hectare to 6 kg phosphate per hectare (Velthof, et al., 2017).
In its results report, OCI N.V. presents benchmark prices18 for main products of the fertiliser industry (OCI N.V., 2018a):
1. Ammonia (NW Europe, FOB): USD 278/t; 2. Ammonia (US Gulf Tampa contract): USD 267/t; 3. Granular Urea (Egypt, FOB): USD 244/t;
4. CAN (Germany, CIF): USD 175/t; 5. UAN (France, FOT): USD 153/t; 6. UAN (US Midwest, FOB): USD 231/t.
4 Options for
decarbonisation
This section discusses options for decarbonisation of the fertiliser industry. Some of the main decarbonisation options are using hydrogen with a lower CO2 footprint (e.g. green hydrogen from electrolysis) and carbon capture and storage.
The options that are discussed are:
1. Using hydrogen with a lower CO2 footprint;
o Green hydrogen produced from electrolysis of water;
o Blue hydrogen produced from natural gas with carbon capture and storage; o Hydrogen from biomass gasification;
o Other hydrogen production processes; o Hydrogen distribution infrastructure; 2. Carbon capture and storage;
o Capture and storage of CO2 emissions from existing processes; 3. Other decarbonisation options;
o Reduced use of fertilisers; o Energy efficiency improvements; o Biogas;
o Heat and CO2 distribution to other sectors (built environment, greenhouse horticulture);
o Solid state ammonia synthesis; o Abatement of nitrous oxide.
4.1 Using hydrogen with a lower CO
2footprint
Green hydrogen produced from electrolysis of waterIn the conventional ammonia production process, ammonia is produced by steam methane
reforming of natural gas combined with Haber-Bosch NH3 synthesis. Alternatively, the
hydrogen that is required for the Haber-Bosch process can be produced by electrolysis of water. In an electrolyser, an electric current splits water into hydrogen and oxygen. No
plants using electrolysis to produce ammonia are currently operational (ISPT, 2017).
Electrolysers operate by passing an electrical current between an anode and a cathode via an electrolyte. Catalysts are used to reduce the electricity consumption. Electrolysis of H2O is
used to supply the H2 and an air separation unit is used to supply nitrogen (N2). An air
separation unit is required, as the supply of pure nitrogen due to oxygen consumption of process air in the secondary reformer is not available anymore. The N2 from the air
separation unit and H2 are mixed for the synthesis of NH3 (Bazzanella and Ausfelder, 2017).
2 H2O 2 H2 + O2, ΔH0 = 571.8 kJ/mol
As the endothermic methane steam reforming is omitted, the corresponding process-related emissions are reduced (Bazzanella and Ausfelder, 2017). On the other hand, no excess steam is generated in the secondary reformer which can be used in other processes.
Compressors are needed to compress hydrogen and nitrogen to a pressure of 100–250 bar required for ammonia synthesis as well as for refrigeration (Bazzanella and Ausfelder, 2017).
Three main technological routes for electrolysis are (Bazzanella and Ausfelder, 2017): 1. alkaline electrolysis;
2. Proton-Exchange-Membrane (PEM) electrolysis, and 3. high-temperature solid-oxide electrolysis.
Alkaline electrolysis and PEM electrolysis are low temperature electrolysis technologies that are commercially available, but not yet at larger than 100 MW scale. High temperature electrolysis technology requires less electricity, but additional heat input. Currently, high
temperature electrolysers are not commercially available (ISPT, 2017).
The main difference between electrolytic ammonia and steam reforming is the production route for hydrogen and nitrogen. The reactors and compressors used in the Haber Bosch process are the same as those used in steam reforming or partial oxidation (Morgan, 2013).
Electrolysis of water consumes more energy per mole of hydrogen produced than steam reforming. The theoretically minimal required electricity input for hydrogen production is
39.4 kWh per kg H2 produced at 0 °C and 1 bar.19 In practice, the losses are higher. The
current Best Available Technique (BAT) specific power consumption for low temperature
electrolysers is 53 kWh per kg H2 produced (ISPT, 2017).
Bazanella and Ausfelder estimate that around 1.4 MWh/t NH3 is needed for compressors and 0.33 MWh/t NH3 for the air separation unit. Investments for the ASU are estimated to be EUR 27/t NH3 (Benner, Van Lieshout and Croezen, 2011). The existing installations for ammonia synthesis can be used (Stork, De Beer, Lintmeijer and Den Ouden, 2018), but adjustments are needed for the new feed-ins before the synthesis.The OPEX excluding
19 In case of solid-oxide electrolysis, the electrical input can be lower, if water is supplied as steam using suitable process heat sources (Bazzanella and Ausfelder, 2017).
feedstocks are dominated by the maintenance costs (ISPT, 2017). Here, the OPEX is assumed to be 3% of the CAPEX.
The investment costs for hydrogen electrolysers are going down fast. Ecofys and Berenschot have assumed that the investment costs for hydrogen electrolysis were EUR 525/kW in 2018 (Stork, De Beer, Lintmeijer and Den Ouden, 2018). Table 17 shows the costs and energy consumption of electrolysis based on the assumptions described before, for 4,500 and 8,000 operating hours. The total electricity demand is 40 GJ/t NH3. For comparison, OCI Nitrogen has estimated that 37–44 GJ of electricity is needed per tonne of NH3 (De Geus, 2017).
Table 15 Costs and energy requirements for electrolysis
Yara
Sluiskil Sluiskil Yara Nitrogen OCI Nitrogen OCI
Operating hours 4,500 8,000 4,500 8,000
Production of ammonia [kt/year] 1,661 1,661 1,081 1,081
Hydrogen required [t/t ammonia]20 0.178 0.178 0.178 0.178
Hydrogen required [kt/year] 296 296 192 192
Electricity demand for electrolysis [kWh/kg
hydrogen] 53 53 53 53
Electricity demand for electrolysis [kWh/kg
ammonia] 9.4 9.4 9.4 9.4
Electricity demand for electrolysis [GJ/t ammonia] 34.0 34.0 34.0 34.0 Electricity demand for electrolysis [TWh] 15.7 15.7 10.2 10.2 Electricity for compressors and air separation unit
[MWh/t ammonia] 1.73 1.73 1.73 1.73
Electricity for compressors and air separation unit
[GJ/t ammonia] 6.2 6.2 6.2 6.2
Electricity for compressors and air separation unit
[TWh] 2.9 2.9 1.9 1.9
Electricity demand (total) [GJ/t ammonia] 40.2 40.2 40.2 40.2
Electricity demand (total) [TWh] 18.5 18.5 12.1 12.1
Capacity of electrolysers [GW] 4.1 2.3 2.7 1.5
Investments electrolysers [euro/kW] 525 525 525 525
Investments air separation unit [EUR/t
ammonia/year] 27 27 27 27
Investments electrolysers [EUR million] 2,164 1,217 1,408 792
Investments air separation unit [EUR million] 45 45 29 29
Investments (total) [EUR million] 2,208 1,262 1,438 821
O&M costs [EUR million/year] 66 38 43 25
The investments required for electrochemical-based NH3 production are higher than the investments for conventional NH3 production based on Steam Methane Reforming. The production costs of large electrolysers are expected to decrease due to (ISPT, 2017):
• Scaling up;
• Optimisation of production processes; • Technological development;
• Stimulation of market demand;
• Development of new types of electrolysers.
Despite being largely modular, electrolysers exhibit economies of scale as the compressors, gas holding tanks, transformers and balance of plant equipment are scaled up (Morgan, 2013). Flexible electrochemical H2 production is proven technology, but needs to made suitable for large scale applications (ISPT, 2017).
Lifetime stack replacement costs vary between 60%–65% of electrolyser costs. The time to replacement can be estimated to be 80,000 hours of operation for low temperature units or 40,000 operating hours for high temperature units (ISPT, 2017).
The Institute for Sustainable Process Technology (ISPT) published a study on the electro-chemical production of NH3 and the storage of electricity in ammonia. From this ‘Power to Ammonia’ study (ISPT, 2017), OCI Nitrogen concludes that CO2-neutral ammonia produced in an electrochemical way from sustainable electricity will be a feasible alternative for ammonia produced from natural gas in the longer term, but that this is not economically feasible currently. The consortium has outlined an innovation and R&D plan to work towards a profitable process by 2030 (OCI N.V., 2018a).
A small scale pilot plant for Power-2-Ammonia at OCI Nitrogen (either at Geleen or
Europoort) has been studied as a business case (ISPT, 2017). The infrastructure for chemical
processes and NH3 is already present, which reduces the investment in utilities and handling, as well as lead time costs and complexity of permits. The investments needed for 20 kt NH3 production have been estimated to be in the order of 30 million euro. OCI Nitrogen has estimated that a large-scale electrolysis pilot unit of 100 MW requires an investment of EUR 50 million (Van Lieshout, Rooijers and Croezen, 2018).
OCI concludes that the electrification route could be profitable before 2030 if investments, mainly in the electrolysers, could be reduced significantly, the pricing of renewable NH3 would be significantly higher, and the costs for CO2 emission would be higher (ISPT, 2017). The capacity of the current electricity grid at OCI Nitrogen is not sufficient to switch to production exclusively based on electrolysis. To enable this, either the grid capacity has to be increased or hydrogen has be supplied to OCI Nitrogen by pipeline. According to OCI
Nitrogen, the electricity grid at Chemelot can handle an additional 24 MW. The ammonia plant can handle an additional 12 MW (De Geus, 2017).
The CO2 footprint of electrochemically produced NH3 depends on the greenhouse gas
emission intensity of electricity generation. If the electricity is produced from fossil fuels, the CO2 footprint can be higher than of conventional NH3 (ISPT, 2017).When hydrogen is made with electrolysis, other sources of CO2 are needed to make urea or supply CO2 for other purposes. The CO2 is no longer supplied by the conventional ammonia process (Stork, De Beer, Lintmeijer and Den Ouden, 2018).
Blue hydrogen produced from natural gas with carbon capture and storage Blue hydrogen is produced from natural gas, usually via steam-reforming, with carbon capture and storage. CE Delft has studied the techno-economic feasibility and sustainability of blue hydrogen (Van Cappellen, Croezen and Rooijers, 2019). Carbon capture and storage is discussed in more detail in Section 4.2.
Hydrogen from biomass gasification
Gasification of (ligno-)cellulose from wood can produce a syngas, which is a mixture of hydrogen, carbon monoxide and carbon dioxide. This gas can be used as a feedstock to produce ammonia (Stork, De Beer, Lintmeijer and Den Ouden, 2018). A major limiting factor
for this technology is the availability of the feedstock (CEFIC, 2013). Biomass gasification requires a high capital expenditure for process equipment (OECD/IEA, 2017).
OCI Nitrogen is studying the feasibility to use biomass or municipal solid waste stream gasification technology to make syngas that can be converted to ammonia (OCI N.V., 2018a).
Other hydrogen production processes
Bazzanella and Ausfelder (Bazzanella and Ausfelder, 2017) discuss other processes to production hydrogen, which still have rather low TRL levels.
• Methane pyrolysis (thermal decomposition of methane) has a reduced energy demand and could be based on renewable methane. This process produces solid carbon and hydrogen and has a TRL level of 4–5.
• Thermochemical processes in which high-temperature heat is used to split water. The heat could be supplied by solar heat or waste heat. The TRL level is 4.
• Photocatalytic processes have a TRL level of 2–3.
Hydrogen distribution infrastructure
Instead of producing hydrogen on the site, it is possible to use hydrogen that is supplied from elsewhere. Chemelot considers hydrogen infrastructure a possible promising route to substitute the current feedstocks by sustainable alternatives (Chemelot Site Permit B.V., 2018). A group of companies in the Delta region (including Yara) see the development of a future-oriented energy infrastructure for both electricity and CO2-free gas (predominantly hydrogen) as a key priority. According to them, the development of a regional open network hydrogen infrastructure will enable reduction of greenhouse gas emissions and decrease the dependency on carbon capture and storage in the long term (Van Lieshout, Rooijers and Croezen, 2018). A first estimate of the investment required to connect all Smart Delta Resources (SDR) companies between Zeeland Refinery in the Sloe area and Arcelor Mittal in the southern part of North Sea Port by a regional H2/O2 net is EUR 60–70 million (Van Lieshout, Rooijers and Croezen, 2018).
Dow, Yara and ICL-IP have recently realised a hydrogen infrastructure between their companies. Hydrogen that is released as a side-product from cracker processes at Dow serves as a feedstock for the production processes at Yara and ICL-IP. The hydrogen is transported using a gas pipeline of Gasunie Transport Services (GTS) that was no longer in use (Yara Sluiskil N.V. , 2016). The construction was started in May 2018, and involved modification of the gas pipeline and the connections at Dow and Yara (Dow Benelux, 2018).
The amount of hydrogen that can be supplied in the first step is 4.5 kt/year. The emission reduction is estimated to be approximately 10 kt CO2 per year (Rijksoverheid en Private Partijen, 2016). In a second phase, Yara can use more hydrogen from Dow, but this requires additional investments. Yara is studying the feasibility of this second phase (Dow Benelux, 2018). When the complete project is finished, the CO2 reduction could amount to 20–40 kt CO2 (Yara Sluiskil N.V. , 2016).
4.2 Carbon capture and storage
Ammonia plants produce large flows of almost pure CO2 gases, which are well suited for carbon capture and storage (CCS). The CO2 is already captured, but needs to be compressed and transported to a storage location.
The first Dutch studies into CCS projects were carried out in 1988 (Hendriks, Koornneef, & Oude Lohuis, 2015). In 2004, the first injection of CO2 in a Dutch gas field under the sea floor took place (Hendriks, Koornneef, & Oude Lohuis, 2015). Afterwards, there have been several CCS initiatives that were not followed through (e.g. in Chemelot, Barendrecht and the North of the Netherlands). In 2017, Uniper and Engie announced to end the ROAD project (Port of Rotterdam, 2017).
Carbon emissions from ammonia production arise from the flue gases of the combustion processes and from the reforming reaction. The CO2 released from the reforming step is highly concentrated and is captured. Part of this CO2 is already used as feedstock for urea production or other downstream utilisation. The CO2 from exhaust gases of heat generation are more difficult to capture and are currently emitted to the air.
CEFIC gives the investment costs and energy requirements for CCS as shown in Table 16. The costs of CCS are lower when the point source of the emissions are larger and the flow of the CO2 is more concentrated.
Table 16 Costs for CCS on pure sources and combustion sources (CEFIC, 2013)
Year of
assessment Capture rate Cost item Plant size [Mt CO2.year] Investment costs [EUR2010/t CO2 annually captured] Heat requirements [GJ/t CO2 captured] Electricity requirements [GJ/t CO2 captured]21 CCS on pure sources (process-related emissions) 2020 100% Capture and compression <0.8 100 0 0.4 0.8 40 >0.8 30 Transport All 80 Storage All 60 CCS on combustion sources 2020 85% Capture and compression 0.13 1,020 3.2 0.48 0.25 714 0.5 500 1.2 300 3.0 200 Transport All 80 Storage All 60 CCS on combustion sources 2030 85% Capture and compression 0.13 612 0 1.13 0.25 429 0.5 300 1.2 225 3.0 125 Transport All 70 Storage All 60 CCS on combustion sources 2050 85% Capture and compression 0.13 327 0 1.46 0.25 229 0.5 160 1.2 130 3.0 90 Transport All 50 Storage All 60
Table 17 shows the amounts of CO2 that can potentially be stored. Around 70% of the CO2 emissions are high purity streams. According to Yara, the amount of CO2 for carbon capture
![Table 6 Estimated production capacities of OCI Nitrogen in the Netherlands in 2017 Estimated production capacity [kt/year] Source Comments Ammonia total (AFA-2 and AFA-3) 11](https://thumb-eu.123doks.com/thumbv2/5doknet/3224830.19379/14.892.131.769.323.814/estimated-production-capacities-nitrogen-netherlands-estimated-production-comments.webp)