DECARBONISATION OPTIONS
FOR THE DUTCH DAIRY
PROCESSING INDUSTRY
J.M. Pierrot, K.M. Schure
08 July 2020Decarbonisation options for the Dutch dairy processing industry
© PBL Netherlands Environmental Assessment Agency; © TNO The Hague, 2020
PBL publication number: 4171
TNO project no. 060.33956 / Publication number TNO 2020 P11006
Authors
J.M. Pierrot and K.M. Schure
Acknowledgements
The authors are grateful to Juliën Voogt of Wageningen Food and Bio-based Research (WFBR, part of WUR) and Gert Jan van den Born (PBL) for reviewing this report.
MIDDEN project coordination and responsibility
The MIDDEN project (Manufacturing Industry Decarbonisation Data Exchange Network) was initiated and is also coordinated and funded by PBL and TNO. The project aims to support industry, policymakers, analysts, and the energy sector in their common efforts to achieve deep decarbonisation. Correspondence regarding the project may be addressed to:
D. van Dam (PBL), Dick.vanDam@pbl.nl, K.M. Schure (PBL), Klara.Schure@pbl.nl, or A.W.N van Dril (TNO), Ton.vanDril@tno.nl.
This publication is a joint publication by PBL and TNO Energy Transition Studies and can be downloaded from: www.pbl.nl/en. Parts of this publication may be reproduced, providing the source is stated, in the form: [Pierrot, J.M. and Schure, K.M. (2020), Decarbonisation options for the Dutch dairy processing industry. PBL Netherlands Environmental Assessment Agency and TNO, The Hague].
PBL Netherlands Environmental Assessment Agency is the national institute for strategic policy analysis in the fields of the environment, nature and spatial planning. PBL contributes to improving the quality of political and administrative decision-making by conducting outlook studies, analyses and evaluations in which an integrated approach is considered paramount. Policy relevance is the prime concern in all of PBL’s studies. PBL conducts solicited and unsolicited research that is both independent and scientifically sound.
TNO Energy Transition has a twofold mission: to accelerate the energy transition and to strengthen the competitive position of the Netherlands. TNO conducts independent and internationally leading research and we stand for an agenda-setting, initiating and supporting role for government, industry and NGOs.
The companies mentioned did not review this report. PBL and TNO are responsible for the content. The decarbonisation options and parameters are explicitly not verified by the companies.
Contents
SUMMARY
4
INTRODUCTION
5
1
DAIRY PROCESSING IN THE NETHERLANDS
7
1.1 FrieslandCampina 10
1.2 Royal A-ware & Fonterra 11
1.3 Promelca/Vreugdenhil Dairy Foods 11
1.4 DOC Kaas B.V. 12
1.5 Danone Nutricia Early Life Nutrition 12
2
DAIRY PRODUCTION PROCESSES
13
2.1 General 15
2.2 Cheese 16
2.3 Butter 17
2.4 Milk powders and condensed milk 18
2.5 Whey powder and other whey products 22
3
DAIRY PRODUCTS AND APPLICATION
24
3.1 Dairy end products 24
3.2 Prices and trade 26
3.3 Consumption and substitution 27
4
OPTIONS FOR DECARBONISATION
29
4.1 Process design options 30
4.2 Fuel substitution 37
4.3 Other options: CCU/CCS 40
5
DISCUSSION
41
REFERENCES
43
APPENDIX A: PRODUCTION CAPACITY ESTIMATES OF THE DUTCH
DAIRY PROCESSING LOCATIONS IN EU ETS
51
APPENDIX B: MASS AND ENERGY CALCULATIONS ON DAIRY
PROCESSES
54
B.1 Mass flow dairy products 54
B.2 Energy flow dairy products 57
FINDINGS
Summary
This report describes the situation of dairy processing in the Netherlands as of 2020, and looks into the possibilities for decarbonisation of this sector, based on publicly available literature. The goal is a general view on the present production processes that are used in the sector, and decarbonisation options coupled to these processes.
In the Netherlands, there are 53 dairy processing facilities, which are supplied with around 14 billion kilograms of milk annually. 43 of them, including all EU-ETS registered facilities, participate in the MJA3 covenant of the dairy sector. They consumed about 21 PJ of energy in 2018 (RVO, 2019), and used 7.7 PJ electricity and 12.1 PJ natural gas (Doornewaard, Hoogeveen, Jager, Reijs, & Beldman, 2019, pp. 210, 211). Of these 43 facilities, 11 are, largely because of their size, registered under the EU ETS, being FrieslandCampina (7 locations), Promelca Dairy Foods (Gorinchem), DOC Kaas (Hoogeveen), Royal A-ware / Fonterra (Heerenveen), and Danone Nutricia (Cuijk). The total greenhouse gas emissions of the diary processing sector are approximately 1.1 Mt CO2-eq, of which the aforementioned
EU ETS facilities are responsible for 0.47 Mt.
These facilities produce a wide variety of products, among which are cheese, butter,
condensed milks, milk powders, whey powders and lactose. For many of these products large amounts of water have to be removed from the feedstock, which requires large amounts of heat. This heat is typically supplied through the combustion of natural gas, either in gas boilers or combined heat and power (CHP) plants. Some facilities use biogas instead of natural gas. Since the production processes do not emit CO2, all registered emissions can be
attributed to natural gas combustion.
Options for decarbonisation exist in the form of changing the heat supply from natural gas boilers to boilers using biogas, hydrogen or electricity. Geothermal energy can also be used as a carbon-neutral heat source. Because of the large amounts of waste heat available in dairy processing facilities, heat pumps can be used to use all waste stream efficiently.
Other options relate to the energy-efficiency of the facilities and include using zeolite in a closed-loop spray drying process, pre-concentrating of the feedstock through the use of membranes, and the application of energy-efficient mechanical vapour recompression during evaporation.
FULL RESULTS
Introduction
This report describes the current situation for production of dairy products in the Netherlands and the options and preconditions for its decarbonisation. The study is part of the MIDDEN project (Manufacturing Industry Decarbonisation Data Exchange Network). The MIDDEN project aims to support industry, policymakers, analysts, and the energy sector in their common efforts to achieve deep decarbonisation. The MIDDEN project will update and elaborate further on options in the future. MIDDEN encompasses reports and data from all large industry sectors with Dutch production locations in the EU ETS. In this way a complete picture of the industry is formed, as well as a complete picture and potential size of the decarbonisation options. MIDDEN can also contribute to synergy potential across the different industry sectors or location.
Aim of this report is mapping the different types of processes and the potential and relevance of specific decarbonisation options. The processes at the companies were not individually investigated, but default processes were chosen based on the best available information, looking to the processes from feedstock (milk/whey) to end product. Therefore, the specific and current situations may deviate from the general numbers in this report due to diversity in processes, products and use (e.g. semi-finished vs final product). Also, different companies may be in different phases of the renewal cycles or turnaround periods. This report does not aim at comparing the companies and does not provide decarbonisation advice or an assessment concerning individual companies or the sector. Furthermore, the report focuses on the technical processes and decarbonisation options and does not focus on specific business cases including subsidy schemes etc.
Scope
The global mapping of the sector is based on the production locations that are part of the EU ETS and the registration at the Dutch Emissions Authority NEa. Decarbonisation is equally important for the other dairy production locations that are not part of the scope of this report. The Dutch dairy production locations in the EU ETS (and thus in the scope of this report) include1:
• DOC Kaas BV, location Zuivelpark; Hoogeveen, Drenthe • FrieslandCampina Bedum; Bedum, Groningen
• FrieslandCampina Beilen; Beilen, Drenthe
• FrieslandCampina DMV location Veghel; Veghel, Noord-Brabant • FrieslandCampina Domo location Borculo; Borculo, Gelderland • FrieslandCampina Leeuwarden; Leeuwarden, Friesland
• FrieslandCampina Lochem; Lochem, Gelderland • FrieslandCampina Workum; Workum, Friesland • A-ware and Fonterra; Heerenveen, Friesland
• Promelca Dairy Foods (Vreugdenhil); Gorinchem, Zuid-Holland.
1 Since 2018 Danone Nutricia Early Life Nutrition in Cuijk is also part of the register at NEa. Its emissions have been small with respect to the listed locations. The location is discussed shortly in Section 1 but not taken into account in the remainder of the report.
Production processes include: • Standardisation • Heat treatments • Evaporation
• Spray drying (with fluid-bed drying) • Membrane processes. Products include: • Milk powders • Whey powders • Cheese • Butter
• (Sweetened) condensed milk.
The main options for decarbonisation are: • The use of zeolite for spray-drying • Innovative use of membrane processes
• Application of mechanical vapour recompression • Electric and biogas boilers
• Heat pumps • Geothermal energy • Water reuse.
A number of these options have already been addressed or considered by the companies, which are all participants in the MJA3 covenant for energy efficiency improvement (RVO, 2019).
Reading guide
Section 1 introduces the Dutch dairy processing industry. Section 2 describes the current situation for production processes for dairy products, and Section 3 describes the relevant products of these processes, while options for decarbonisation are systematically quantified and evaluated in Section 4. The feasibility of and requirements for those decarbonisation options are discussed in Section 5.
1 Dairy processing in
the Netherlands
Contributing to around 7% of the trade balance of the Netherlands, the dairy processing industry is one of the main industries in the country (ZuivelNL, 2020). Yearly, an amount of around 14 billion kilograms of milk is processed and turned into consumer’s milk, butter, cheese, milk and whey powders and other products (CBS, 2020). The Dutch dairy chain consists of 16,250 companies providing milk, keeping 1.6 million heads of cattle, delivering milk to 53 milk processing factories, employing 49,000 people and creating products with a value of EUR 12.5 billion in 2017, of which EUR 7.6 billion by the milk processing industry (ZuivelNL, 2020). Of the products, 35% remains in the Dutch market, while 45% is exported to the European Union and 20% to other countries. The Netherlands also imports dairy products with a total value of EUR 3.8 billion, mostly from Germany and Belgium (ZuivelNL, 2019a). A part of the quantities above includes transit products.
The dairy sector emitted about 22 million tonnes (Mt) of CO2-equivalents in 2018, taking into
account the entire production chain. Of this amount, over 93% stem from processing at the dairy farm (the majority of emissions coming from enteric fermentation in the form of methane, ~13.3 Mt) and production of the required feed (in the form of CO2 and nitrous
oxide, ~7.4) (Doornewaard, Reijs, Beldman, Jager, & Hoogeveen, 2018; Doornewaard, Hoogeveen, Jager, Reijs, & Beldman, 2019). In total, an amount of 1.48 kg CO2-eq is
emitted per kg of Dutch milk delivered to the factory (Dolfing, 2017).
Only a small fraction (~1.1 Mt) of the emissions of the dairy sector occurs at the dairy processing locations. Processing of the different dairy products is included in these numbers, but not transport. The scope of the industry is defined by SBI (‘Standaard BedrijfsIndeling’) class 105: manufacturing of dairy products.
The largest dairy processing company in the Netherlands is FrieslandCampina, which
processed around 11.8 billion kilograms of milk in 2018. The company is the 6th largest dairy
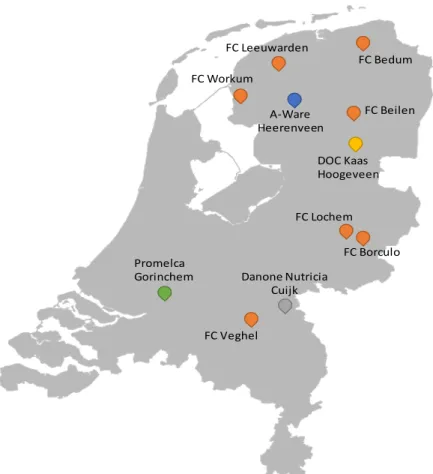
processing company in the world, generating a turnover of EUR 11.55 billion in 2018 (FrieslandCampina, 2019a). Other large companies in the Dutch dairy sector are Royal A-aware (turnover of EUR 1.3 billion in 2017), Vreugdenhil (EUR 730 million in 2018) and DOC Kaas (EUR 276 million in 2018) (DOC Kaas, 2019a; Royal A-ware, 2018; Vreugdenhil Dairy Foods, 2019a). An overview of the Dutch dairy companies registered under the ETS is given in Table 1 below, with their registered CO2 emissions in 2018. The locations of the production
facilities are mapped in Figure 1.
Based on public sources and the analysis of the processes, we have estimated the production volumes of the different locations. An overview of this can be found in Appendix A, together with estimates of the number of employees.
Table 1 Overview of ETS registered dairy product producers in the Netherlands, including the absolute CO2 emissions in 2018 as registered with the NEa, with the
thermal capacities of heat supply at different processing locations
Producer/ETS registration Direct CO2 emissions in 2018 registered at NEa (tonne)2 Fuel input
(PJ)3 Type of heat supply capacity Heat
[MWth] Danone Nutricia Early
Life Nutrition Cuijk 1,329 0.02 Natural gas boilers and heaters
404
DOC Kaas BV, location
Zuivelpark 45,488 0.80 CHP
Friesland Campina
Bedum 37,136 0.66 Natural gas boiler
Friesland Campina Beilen
52,554 0.93 Natural gas boiler 655
Friesland Campina DMV
B.V., location Veghel 103,830 1.80 Natural gas boiler Friesland Campina
Domo location Borculo 41,845 natural 0.89 gas, 0.09
biofuel6
Mixed fuels boiler (biofuels, natural gas) 1305 Friesland Campina Leeuwarden 57,779 1.00 CHP 95 5 Friesland Campina
Lochem 34,746 0.61 Natural gas boiler
Friesland Campina
Workum 24,919 0.44 Natural gas boiler
Cheese- and
wheypowder factory A-ware and Fonterra H.
19,597 0.35 Natural gas boiler
Promelca Dairy Foods 50,002 0.88 Natural gas boiler
In Table 1, the calculated natural gas use is shown, as well as the heat capacities of the heat-generating installations of the various processing facilities. The natural gas use is based on the CO2 emissions of that facility in 2018, assuming these arise from combustion of
natural gas. The heat capacities are based on data available on large combustion plants (with a size of over 50 MWth) or local permit information. The total fuel use of these installations
amounts to about 8.5 PJ in 2018.
2 Dutch Emissions Authority, 2019.
3 Unless otherwise mentioned, calculated based on emission data from 2018 from NEa, assuming natural gas use and an emission factor of 56.6 kg CO2/GJ natural gas used.
4 Based on local permit information (Provincie Noord-Brabant, 2019); two 15.8 MWth steam boilers and two heaters of 5.6 and 3.1 MWth.
5 Taken from data on LCP (EEA, 2019). For FrieslandCampina Leeuwarden there are two entries (for different combustion plants), the higher value was used.
6 Taken from LCP (EEA, 2019). Most recent data used, for 2017. Natural gas use is calculated based on the emissions reported by the NEa for 2017. The used biomass consists of pyrolysis oil and biogas. In 2019, 35% of the natural gas demand was replaced by pyrolysis oil and biogas (FrieslandCampina, 2019f).
Figure 1 Locations of the EU ETS registered production facilities of the Dutch dairy producers. FC means FrieslandCampina.
Development over time of the CO2 emissions in the Dutch dairy processing industry is
depicted in Figure 2. The emissions have continuously decreased since 2016, which is almost entirely attributed to reduced emissions at FrieslandCampina, which showed a simultaneous increase in production (see Figure 3).
Figure 2 Development of emissions in dairy processing sector per production location (Dutch emissions authority, 2020)
FC Bedum FC Borculo FC Veghel FC Beilen FC Leeuwarden FC Lochem FC Workum DOC Kaas Hoogeveen A-Ware Heerenveen Promelca
Gorinchem Danone Nutricia Cuijk 0 100 200 300 400 500 2013 2014 2015 2016 2017 2018 2019 Em issi on s ( kt C O2 -e q)
Promelca Dairy Foods
Kaas- en weipoederfabriek A-ware en Fonterra H.
FrieslandCampina Workum FrieslandCampina Lochem FrieslandCampina Leeuwarden FrieslandCampina Domo locatie Borculo FrieslandCampina DMV B.V., locatie Veghel
FrieslandCampina Beilen FrieslandCampina Bedum DOC Kaas BV, vestiging Zuivelpark DOC Kaas ba, vestiging Alteveerstraat Danone Nutricia Early Life Nutrition
1.1 FrieslandCampina
FrieslandCampina was created through the merger of two Dutch dairy companies, Friesland Foods and Campina, in 2008. However, the company can trace back its roots to 1871, when nine dairy farmers took over a Dutch cheese factory, to secure the sale of their milk before it spoiled (FrieslandCampina, 2019c). Nowadays, FrieslandCampina is still a cooperation, owned by dairy farmers. FrieslandCampina has branch offices in 34 countries, of which 49 are in the Netherlands, and employs 23,769 people globally (FrieslandCampina, 2019d; FrieslandCampina, 2019a). Of these locations, only seven are registered under the European ETS scheme, the largest of which is located in Veghel, where production started in 1926. All of these production locations produce, among others, dried dairy products. For the
production of these types of products, large amounts of water have to be removed from the milk or whey input (see Section 2 for a more detailed explanation), which is an energy intensive process. Because of this, these locations have relatively high CO2 emissions and
therefore they are registered under the ETS. Together, the seven ETS registered locations have a processing capacity of around 8.2 billion kilograms (see Appendix A) of milk yearly, which amounts to around 58% of the total Dutch milk supply in 2018.
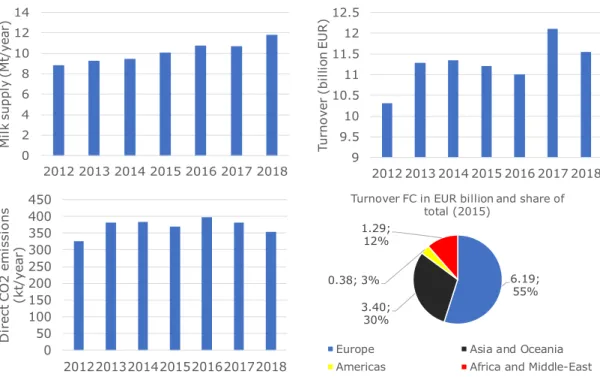
The total milk supply and turnover of FrieslandCampina, the emissions from the ETS
registered locations and a breakdown of the total turnover of FrieslandCampina in 2015 (EUR 11.265 billion7) per geographical area are shown in Figure 3below.
Figure 3 Milk supply (top-left), turnover (top-right), direct CO2 emissions of ETS
registered locations (bottom-left) and breakdown of total revenue per geographical location in 2015 (bottom-right, showing turnover in billion EUR and share of the total) of FrieslandCampina (Dutch Emissions Authority, 2014; Dutch Emissions Authority, 2019; FrieslandCampina, 2016; FrieslandCampina, 2017a;
FrieslandCampina, 2018; FrieslandCampina, 2019a)
7 This number is inconsistently reported in documents by FrieslandCampina. The number for the turnover (top-right) in 2015 used in Figure 2 (EUR 11.21 billion) is taken from FrieslandCampina (2017)
0 2 4 6 8 10 12 14 2012 2013 2014 2015 2016 2017 2018 M ilk su pp ly (M t/ ye ar ) 9 9.5 10 10.5 11 11.5 12 12.5 2012 2013 2014 2015 2016 2017 2018 Tur no ve r (b ill io n E U R ) 0 50 100 150 200 250 300 350 400 450 2012201320142015201620172018 D ir ect C O 2 em issi on s (kt /ye ar ) 6.19; 55% 3.40; 30% 0.38; 3% 1.29; 12%
Turnover FC in EUR billion and share of total (2015)
Europe Asia and Oceania Americas Africa and Middle-East
From this figure, it can be determined that, in the time period shown, FrieslandCampina had its highest turnover per amount of milk in 2013 (EUR 1218 per ton of milk supplied) and its lowest in 2018 (EUR 979 per ton of milk supplied). Also, the direct CO2 emissions per unit
turnover or unit milk supply have been the lowest in 2018 for the whole time period, with 30.5 g CO2/EUR and 29.9 g CO2/kg milk supplied respectively.
FrieslandCampina aims to reduce its emissions in 2020 to the level of 2010. In 2010 the company emitted 12,307 kton of CO2-equivalents across its entire production chain
(including emissions from the dairy farms). In 2018, this amount was 12,462 kton, meaning that the company has to reduce its emissions with 155 kton CO2-equivalents (1.24%) in
2019 and 2020 to reach this target (FrieslandCampina, 2019a).
1.2 Royal A-ware & Fonterra
A-ware Food Group, a Dutch cheese manufacturing and processing company, was created in 2010 through the merger of Anker Cheese and Bouter Cheese. These separate companies were founded in 1890 and 1963 respectively, and were originally focused on the sale and storage of cheese (Royal A-ware, 2019a). Nowadays, the activities of the company have expanded to include the production of cheese and other dairy products, giving the company access to the entire supply chain from milk to consumer (Royal A-ware, 2019b). This was achieved through the construction of a new cheese factory in Heerenveen in 2013.
The factory originally had a production capacity of 60-80 ktons of cheese per year, but this was expanded in 2015 to 100 ktons (Royal A-ware, 2012; Boerderij, 2015). The new factory was realised in cooperation with Fonterra, from New Zealand, one of the largest dairy processing companies in the world. Fonterra receives the whey, that is produced during the cheese-making process, from Royal A-ware, and processes lactose and whey protein powder from it in a neighbouring facility.
In 2018, A-ware started with the construction of a new factory in Heerenveen, where mozzarella will be produced. The company will do this for FrieslandCampina, which will take care of the milk supply. The new factory was scheduled to be opened at the end of 2019. Fonterra will buy the excess produced cream and whey to turn it into other products (Royal A-ware, 2019c).
1.3 Promelca/Vreugdenhil Dairy Foods
Promelca Dairy Foods is a subsidiary of Vreugdenhil Dairy Foods, a Dutch dairy company that was founded in 1954. Since then, Vreugdenhil has opened production locations in
Voorthuizen (1964), Barneveld (1991), Scharsterbrug (2002) and Gorinchem (2005) (Vreugdenhil Dairy Foods, 2019c). The company specialises in the production of different types of milk powders, such as full cream milk powder and fat filled milk powder, a powder in which milk fat has been replaced by 100% sustainable palm oil. The company processed 1.3 billion kilograms of milk in 2018, from which it produced around 160-170 ktons of milk powders8 (Vreugdenhil Dairy Foods, 2019d).
Specifically for the production location in Gorinchem, production of milk powder started with the take-over of a factory from Nestlé. The name chosen for the production company here
8 Vreugdenhil states that 8 litres of milk are needed for 1 kilogram of whole milk powder (Vreugdenhil Dairy Foods, 2019d)
was Promelca Dairy Foods. Production was then expanded in 2016 with the completion of a new factory next to the old one. The production location then has a total capacity of 120 kt powder (Gemeente Gorinchem, 2013). Vreugdenhil exports its products to 130 countries, with 75% of its products leaving Europe (Vreugdenhil Dairy Foods, 2019d). Because of its favourable location at the Merwede river, almost all transport of products from the factory in Gorinchem happens over water, with 95% of the containers leaving the factory by water in 2014 (Vreugdenhil Dairy Foods, 2015).
1.4 DOC Kaas B.V.
The start of DOC (Drents-Overijsselse Coöperatie) Kaas B.V. can be traced back to the foundation of the cooperative Stoomzuivelfabriek in 1895. In 1962 the cooperation DOC was founded, when the Stoomzuivelfabriek joined with other cooperations. First DOC produced mostly butter and condensed milk. Then, in 2003, a cheese factory was taken into use, at the Zuivelpark in Hoogeveen. DOC Kaas reached its final form after merging with German dairy company DMK Group in 2016, becoming its subsidiary. At the same time the
cooperation DOC Kaas B.A. became part owner of DMK Group (DOC Kaas, 2019c).
In 2018 DOC Kaas processed 796 million kilograms of milk from its own dairy farmers, 4.3% less than in 2017 (832 million kilograms) (DOC Kaas, 2019a).
At its location at the Zuivelpark, DOC Kaas produces around 90 ktons of cheese yearly, with an additional 30 ktons being produced at their other location in Hoogeveen, at the
Alteveerstraat (DOC Kaas, 2016). The whey that is produced at the Zuivelpark is processed by a joint venture between DOC Kaas and Volac International, called DVNutrition, which is also located at the Zuivelpark, preventing the need for long-distance transport. At the Zuivelpark, electricity and heat are provided by a Combined-Heat-and-Power (CHP) plant, which uses natural gas as fuel and has a total efficiency (energy content of heat and electricity output divided by the energy content of the gas input) of around 90%. DOC Kaas also produces its own process water, which it obtains by leading the moisture that is evaporated from the processed whey through reverse osmosis membranes. By doing this, the company saves around 800 million litres of water yearly at the Zuivelpark (DOC Kaas, 2019d; SenterNovem, 2006).
1.5 Danone Nutricia Early Life Nutrition
Danone is a French-based food company that took over the Dutch food company Nutricia in 2007 (Nutricia, 2020). The company manufactures early life nutrition products, in particular infant milk powder, in Haps, gemeente Cuijk, Noord-Brabant. A new factory was opened in 2019, which is able to produce milk powder for 3.5 million babies per day (Omroep Brabant, 2019). The annual production is aimed to be 60 kt milk powder, which will be extended to 102 kt of milk powder (Provincie Noord-Brabant, 2015). No realised production numbers are known yet.
The energy consumption of the company is mainly due to the drying of the milk to obtain milk powder. The company utilises two steam boilers with a capacity of 15.8 MWth each and
2 Dairy production
processes
The Dutch dairy industry produces a wide range of products, all with different production processes and techniques. In this section the processes for the main products of the
production locations under the ETS will be discussed. The processes are described in generic terms, since no information relating to the variety of processes at the specific production locations was available. Therefore, the actual processes at the production locations may be different, both in terms of the process steps itself and in terms of the exact numbers. Also, differences may exist because companies are in different phases of renewal cycles or turnaround periods.
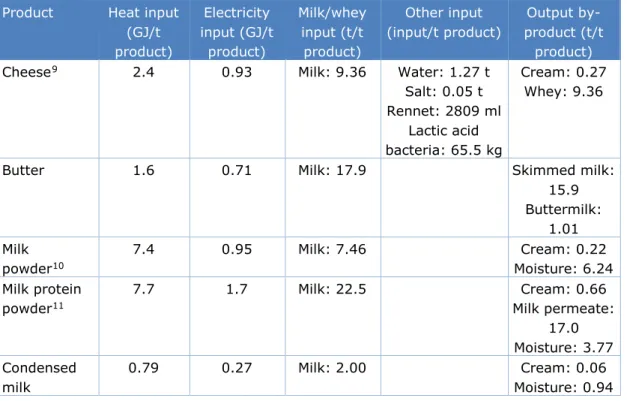
A detailed study of the location-specific processes was beyond the scope of this report and its aims. As a best estimate, a summary of the mass and energy in- and outputs is given in Table 2 below. The values shown for the heat and electricity in- and outputs correspond to the values shown in Figure 4, Figure 6 and Figure 7. The calculations on which these numbers are based can be found in Appendix B.
Table 2 Energy (final energy) and mass in- and outputs for various dairy products. These numbers refer to default processes; the actual numbers at the production locations discussed in this report may be (significantly) different, depending on the specific type and use of product
Product Heat input (GJ/t product) Electricity input (GJ/t product) Milk/whey input (t/t product) Other input (input/t product) Output by-product (t/t product)
Cheese9 2.4 0.93 Milk: 9.36 Water: 1.27 t
Salt: 0.05 t Rennet: 2809 ml Lactic acid bacteria: 65.5 kg Cream: 0.27 Whey: 9.36
Butter 1.6 0.71 Milk: 17.9 Skimmed milk:
15.9 Buttermilk: 1.01 Milk powder10 7.4 0.95 Milk: 7.46 Cream: 0.22 Moisture: 6.24 Milk protein powder11 7.7 1.7 Milk: 22.5 Cream: 0.66 Milk permeate: 17.0 Moisture: 3.77 Condensed milk 0.79 0.27 Milk: 2.00 Cream: 0.06 Moisture: 0.94 9 Gouda assumed.
10 Whole milk powder assumed.
Product Heat input (GJ/t product) Electricity input (GJ/t product) Milk/whey input (t/t product) Other input (input/t product) Output by-product (t/t product) Sweetened condensed milk 0.74 0.27 Milk: 2.23 Sugar: 0.44 t Lactose crystals: 0.005 t Cream: 0.06 Moisture: 1.61 Whey powder12
7.6 1.1 Whey: 15.4 Cheese fines
and whey cream: 0.46 Moisture: 13.9 Whey protein
powder13
11.2 2.95 Whey: 62.6 Cheese fines
and whey cream: 1.88 Whey permeate: 50.4 Moisture: 9.32 Lactose14 5.0 1.0 Whey permeate: 17.0 Whey concentrate: 0.58 Moisture: 15.4
In Table 3 the energy inputs as determined in this report (the base values from Figure 4, Figure 6 and Figure 7) are compared against values found in literature. There is a significant discrepancy between some of the inputs. A number of possible reasons can be given for this. First, it is important to note that the values found in literature correspond to technologies typical for the late 1990s, and therefore efficiency developments will have taken place in the meantime. Furthermore, the energy requirements for the shown products depend strongly on the exact type of technology use. For instance, the energy requirements for evaporation can be either more than twice as high or twice as low as the value used in this report. To show the impact of this choice, a range in the energy consumption of evaporated products is shown in Table 3, using a value between 77 kJ per kg water evaporated (for MVR (TetraPak, 2019a)) and 0.5 MJ per kg water evaporated (for three stage TVR (European Commission, 2018a)). For cheese and butter, the impact of a deviation of 5 percentage points in the amount of heat regenerated from in- or outflowing flows is shown. Finally, there is a large heterogeneity in the products that fall under one product-category as those shown in Table 3, and all specific products will have their own specific energy consumptions. For instance, the energy consumption for lactose found in literature also includes another product group, namely caseins, which can have a significantly different energy consumption than lactose.
12 Demineralised whey powder assumed.
13 Protein content of 35% of total dry matter assumed. 14 Lactose produced from whey permeate assumed.
Table 3 Comparison of determined energy input for different dairy products with values found in literature. The range in energy input indicates the sensitivity of the inputs to regenerative heating (for cheese and butter) or the evaporation energy (for milk powder, condensed milk, whey powder and lactose). The variation is only in heat; electricity is the same as in Table 2
Product Energy input determined in this report (GJ/t product)
Energy input from literature (GJ/t product)15 Cheese 2.9 – 3.7 4.3 Butter 1.6 – 2.9 2.2 Milk powder 7.4 – 10.0 11.1 Condensed milk 0.9 – 1.4 2.5 Whey powder 8.0 – 9.9 8.2 Lactose 2.9 – 11.4 5.6
2.1 General
2.1.1 General processes
In general, when milk is received by the processing plant, it first undergoes thermisation. This entails heating the milk to around 65°C for 15 seconds, thereby preventing the growth of bacteria that can cause a deterioration of the milk’s quality (Tetra Pak, 1995).
Afterwards, the milk undergoes standardisation. During this process the milk is subjected to centrifugation to separate the fat content from the skimmed milk. Afterwards, the two are mixed back together in the desired ratio. Doing this ensures the composition of the used milk is correct for the subsequent steps (Brush, 2012).
Often milk is homogenised before further treatment, except milk destined for cheese production. During homogenisation, the fat globules in the milk are reduced in size (to a mean diameter of 1 to 2 μm) (European Commission, 2018a). The reduction in size is achieved by forcing the milk through small holes, across which a large pressure gradient is created. This process inhibits the separation of the water- and fat-soluble components of the milk (Brush, 2012).
Afterwards, the milk generally receives some form of heat treatment, depending on the product being made. This is done to increase the shelf-life and decrease the amount of harmful microorganisms. Typically milk is pasteurised, which entails heating it to 72 °C and subsequently keeping it at that temperature for 15 seconds. The heat for pasteurisation can be supplied by hot water at a temperature slightly above 72°C, or low-pressure steam (Tetra Pak, 1995). Another option is to sterilise the milk, which is achieved by heating it to a minimum of 135 °C and keeping it for 1 second. Sterilisation yields milk with a longer shelf-life, but this type of milk is generally not used to make other dairy products (European Commission, 2018a). The energy-requirements for heat treatment are reduced by using the cold inflowing milk to cool down the hot outflowing milk, and vice versa. This process, called ‘regenerative heating’, can reduce the energy needed for pasteurisation by 95% (Tetra Pak, 1995).
15 Ramírez, Patel, & Blok (2006).
2.1.2 Cleaning-in-place (CIP)
During operation a residue will form on the used equipment, which will inhibit proper further functioning and might cause contamination of the products. Typically this occurs by
deposition of material on a mono-molecular layer which forms quickly during processing. A distinction between two types of deposition can be made. One forms at temperatures above 100°C (called milkstone or scale), while the other forms at lower temperatures.
To remove the deposits, and to clean the equipment for subsequent processing, sanitation is needed. This generally takes the form of Cleaning-In-Place (CIP). This entails cleaning of the equipment without disassembling or moving it. Equipment with a small internal volume (like heat exchangers) can be cleaned by operating them normally, using a cleaning liquid instead of product feed. Larger pieces of equipment require spraying of cleaners (Walstra, Wouters, & Geurts, 2006). CIP generally takes place at 65–75°C, which means it requires a significant amount of energy, around 10–26% of the total energy requirements (Ramírez, Patel, & Blok, 2006).
2.1.3 Wastewater treatment
The dairy industry produces a large volume of waste water, of around 0.2–10 litres of effluents per litre of milk processed (Vourch, Balannec, Chaufer, & Dorange, 2008). This amount mostly comes from CIP-operations, which require large volumes of water to operate, thereby generating 50–95% of the total waste water volume (Daufin, et al., 2001). Apart from the chemicals used for CIP, dairy wastewater has relatively high Chemical- and Biochemical Oxygen Demand (COD and BOD), which indicate the amount of oxygen needed to break down the effluents present in the wastewater, meaning it is a measure of the impact a waste-source will have on its receiving environment (Kothari, Kumar, Pathak, & Tyag, 2017). The wastewater can be treated at an offsite sewage treatment plant or an onsite wastewater treatment plant. If treatment occurs onsite, it happens either aerobically or anaerobically. During aerobic treatment, microorganisms break down the organic matter present in the waste stream, turning it into carbon dioxide and water. Anaerobic treatment happens similarly, but in an oxygen-free environment, in which the organic material is converted into methane and carbon dioxide (Britz, Van Schalkwyk, & Hung, 2004).
2.2 Cheese
Like the wide variety of products made from dairy, there is a large number of different cheeses that can be made, all with slightly differing production methods. However, a general production process can be described, which is shown in Figure 4 below.
The milk is first standardised to achieve the desired fat content for the cheese being made. To change the solids non-fat content (SNF), ingredients such as cream or milk powder can be added. For Gouda cheese (one of the major types of cheese produced in the Netherlands), the fat content of the milk has to be around 26% to achieve the final desired cheese fat content of between 48 and 52% on a dry basis (Bijloo, 2015; FAO, 1988).
After pasteurisation, certain microorganisms will still be present in the milk. These organisms could disrupt the cheese-making process, and therefore need to be sterilised, generally before pasteurisation occurs. This is done in one of two ways: bactofugation or
microfiltration. During bactofugation, special centrifuges are used to separate the bacteria strains from the milk. The bacteria-containing concentrate can then be sterilised (at 130 °C for a few seconds) and mixed back in with the milk, which can then be pasteurised.
Microfiltration makes use of membranes with pores of 0.8 to 1.4 micrometre and an applied pressure of less than 1 bar. These membranes can filter bacteria from skimmed milk. Skimmed milk and cream are separated during standardisation and the skimmed milk
undergoes microfiltration, after which the bacteria concentrate is sterilised together with the cream (at 120-130 °C). The two streams can then be mixed back together and pasteurised (Tetra Pak, 1995).
After the bacteria reducing treatment a coagulant is added. The type of coagulant used depends on the type of cheese being made. Most often rennet and/or lactic acid bacteria are used (Brush, 2012). By adding lactic acid bacteria, the lactose in milk is converted into lactic acid, lowering the pH of the milk. By doing this the negative charges surrounding the protein are neutralised, allowing for aggregation of protein clumps (Cheese Science, 2019). Rennet then removes the negatively charged kappa casein from the protein particles in the milk, undoing their mutual repulsion so the proteins can start to coagulate (The Courtyard Dairy, 2013). This process takes around 30 minutes, and creates cheese curds, which are then cut. This process occurs at a temperature of around 30-40°C. Afterwards, some of the left-over liquid, called whey, is removed from the curds. Typically around 35% of the whey is removed. Next, the cheese curds are heated. Depending on the temperature, this is called ‘cooking’ (above 40°C) or ‘scalding’ (above 44°C). The heating is achieved through the addition of hot water (Tetra Pak, 1995). The curds are then pressed into the desired shape and typically brined (at 12-15°C). Afterwards, the cheese is wrapped and stored, ripening it depending on the cheese variety (European Commission, 2018a; Tetra Pak, 1995).
1.27 t water 2.7 l rennet 63.64 kg lactic acid bacteria
MILK PREPARATION CHEESE MAKING AND CLEANING-IN-PLACE 9.09 t milk 0.76 GJ 0.85 GJ 1.61 GJ 0.08 GJ 1 t cheese Mass flow Heat Electricity 9.36 t milk 0.27 t cream 9.36 t whey
Cheese: 9.36 t milk input, 2.38 GJ heat and 0.93 GJ electricity per t product
Figure 4 Production processes for cheese, showing energy and mass in- and outputs
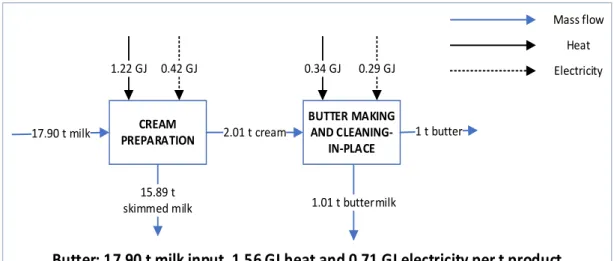
2.3 Butter
The butter production process is shown in Figure 2Figure 5 below. Butter (with a fat content of 80-90%) is made by centrifugally separating milk into skimmed milk and cream (Chandan, Kilara, & Shah, 2008). The cream (with a fat content of around 40%) is then pasteurised at a temperature of 95 °C or higher, and chilled to a desired temperature for ripening. During this process the fat content of the cream crystallises, which helps the formation of butter grains during the churning process. Also, it will prevent fat remaining in the buttermilk (Brush, 2012; Tetra Pak, 1995). The cream can then be churned into butter grains. Churning breaks down the fat in the cream, causing globules to stick together. Typically, between 99.55% and 99.30% of the fat content of the cream ends up in the butter grains, while the rest leaves with the buttermilk (Tetra Pak, 1995). The grains are then washed in water, after the leftover liquid, buttermilk, is removed. By kneading and folding the grains (called ‘working’), butter can be formed (European Commission, 2018a). If desired, salt can be added during
the working stage. CREAM PREPARATION BUTTER MAKING AND CLEANING-IN-PLACE 17.90 t milk 2.01 t cream 1.22 GJ 0.42 GJ 0.34 GJ 0.29 GJ 1 t butter Mass flow Heat Electricity 1.01 t buttermilk 15.89 t skimmed milk
Butter: 17.90 t milk input, 1.56 GJ heat and 0.71 GJ electricity per t product
Figure 5 Production processes for butter, showing energy and mass in- and outputs
2.4 Milk powders and condensed milk
Milk consists for approximately 87% out of water. By removing the water content of milk, the solids, such as proteins, fat, lactose and calcium can be obtained as a dry powder. By adding water to this powder, milk can be formed again. Powdered milk has the benefits of reduced transportation costs and an increased shelf-life. The protein content of milk can be
concentrated and dried, creating milk protein powder. Milk can also be concentrated through evaporation, resulting in condensed milk, or, if sugar is added, sweetened condensed milk.
For these four products, the milk first undergoes heat treatment. For (sweetened) condensed milk, the milk is heated to 120 °C, which serves not only to kill any microorganisms but also improves the stability of the product later on. To produce milk powder, the milk is generally heat-treated at 95 °C for 1 minute, and for milk protein powder at 72°C (Tetra Pak, 1995; Walstra, Wouters, & Geurts, 2006). Afterwards, the milk undergoes evaporation, after which the concentrated milk can be further processed. The production processes for each product are shown in Figure 6.
During evaporation, the liquid is generally exposed to a heat exchanger in a falling film, causing the moisture in the feed to evaporate up to a dry matter content of around 60% (Tetra Pak, 1995). The milk is often circulated through multiple cycles of falling film
evaporation, with the exhaust heat of one cycle (or ‘effect’) being used to heat the next one. Doing this lowers the energy consumption of the process (Brush, 2012). Typically, the pressure between each effect is lowered, resulting in a lower boiling point of the milk, lowering the heating requirement. To heat the effects, steam at a pressure of 10 bar is used. Typically, around 1–1.1 kg of steam is needed to evaporate 1 kg of water if a single effect is used, but if multiple effects are added the steam consumption with 1 effect can be divided by the number of effects (so 0.5 kg for a 2-effect system). Adding effects is also necessary to prevent denaturation of the proteins in the milk, which occurs around 100 °C.
Steam consumption can be further reduced by adding a thermal vapour recompression (TVR) or mechanical vapour recompression (MVR) to the system. In a TVR part of the vapour from an effect is compressed by adding steam of a higher pressure. Doing so means that the vapour from one effect is boosted to a higher temperature resulting in an increase in energy
efficiency of the evaporator. Multiple TVRs can be added to an evaporation unit, and adding one TVR has an effect comparable to adding an extra effect, but the costs are typically lower. In an MVR, the total amount of vapour from the evaporator is compressed using a
compressor, increasing the temperature of the vapour so it can be reused. Using such a system minimises steam consumption (to around 0.03 kg steam/kg water evaporated)16,
since all the available steam in the system is reused. Only during start-up steam has to be injected into the system, but when the evaporator is running, no additional steam is needed. A trade-off is that using an MVR significantly increases the electricity consumption of the evaporator (to several hundred kW) (GEA Process Engineering, 2010; TetraPak, 2019a). For this report, a value of 230 kJ/kg water evaporated was assumed for milk-based products, corresponding to a 6-effect evaporator with TVR, and a value 10% higher, 253 kJ/kg water evaporated, was assumed for whey products due to their higher heat capacity (Walstra, Wouters, & Geurts, 2006).
To produce condensed milk, the concentrated milk (with a 74% moisture content) is homogenised (at a pressure of 125-250 bar) and cooled for packaging (generally in cans). The packages are then sterilised to ensure a long shelf-life of the product (Tetra Pak, 1995). Sweetened condensed milk is made similarly to unsweetened condensed milk. The sugar (0.44 kg of which is added for 1 kg of sweetened condensed milk) can be added at two stages: after standardisation of the raw milk or during evaporation. After evaporation, the concentrated milk (with a moisture content of around 50%, excluding the sugar)17 can be
homogenised, but this is not always done. The milk is then cooled to allow the lactose in the milk to crystallise. By letting this happen at low temperature, the crystals will be small in size, as to not ruin the texture of the end product (Tetra Pak, 1995). The sweetened condensed milk can then be inspected and packaged. The addition of sugar to the milk creates a high osmotic pressure, causing most of the microorganisms in the end product to be destroyed, removing the need for sterilisation of the packaged goods (Tetra Pak, 1995).
To produce milk powder, the next step after evaporation is to use spray drying to change the concentrated milk into a powder with a moisture content of 2.5-5% (Tetra Pak, 1995). This is done by feeding the milk through an atomiser, which sprays it into the drying chamber as a mist of fine particles. In the drying chamber, the particles come into contact with hot air (typically 175-250 °C), which causes the moisture to evaporate from their surface. This causes the hot air to cool down, which is transported out of the drying chamber (GEA Process Engineering, 2010). The hot powder is then cooled on a fluid bed, where also the final drying occurs on a (often shaking) fluid bed. Shaking the bed ensures proper mixing of the product, and therefore a more homogeneous powder, and it also increases powder contact with air, increasing the drying rate (Tetra Pak, 1995). The final drying occurs on this fluid bed since the final amount of water to be evaporated requires the largest energy input (around 23 kg of steam/kg water evaporated to decrease the moisture content from 6% to 3.5% in the spray drying chamber), and the relatively long residence time allows for a better transfer of heat to the particles in the fluid bed compared to the spray drying chamber, resulting in lower steam consumption (around 4 kg/kg water evaporated) (GEA Process Engineering, 2010). Homogenisation of the evaporated concentrate may occur before drying, but this is not always done, since this will increase its viscosity, which has negative effects on the spray drying process. Additionally, atomisation of the concentrate has a similar effect on the product as homogenisation, so it is not required to homogenise it separately (Walstra, Wouters, & Geurts, 2006).
Finally, milk protein powder can be created. To achieve this, the pasteurised milk undergoes ultrafiltration before being evaporated (Mistry, 2002). In this process, the milk is pumped
16 GEA Process Engineering (2010) states that 375 kg of steam is needed to evaporate 12,300 kg of water 17 See Appendix A.1
over a membrane (with pore size of 10-2 to 10-1 µm) under a pressure of 20 to 40 bar. Doing
so retains the protein content of the milk, but it lets through some of the other dry matter, raising the relative abundance of protein in the retentate (Tetra Pak, 1995). This process can yield protein powders with up to around 65–70% protein content in the dry matter (Tetra Pak, 1995; Walstra, Wouters, & Geurts, 2006). To further increase the protein content the retentate has to undergo diafiltration, a process in which a volume of water is added to the retentate so it can undergo a subsequent step of ultrafiltration, thereby filtering out even more non-protein dry matter (Mistry, 2002). The retentate can then be further processed, undergoing evaporation (to 55% dry matter), spray drying and fluid-bed drying to yield a dried protein powder of around 95% dry matter.
MILK PREPARATION EVAPORATION 2.00 t milk 1.94 t milk 0.06 t cream 0.20 GJ 0.08 GJ 0.21 GJ 0.10 GJ Mass flow Heat Electricity 0.94 t moisture FINAL PROCESSING AND CLEANING-IN-PLACE 1 t condensed milk 0.37 GJ 0.09 GJ 1 t condensed milk
Condensed milk: 2.00 t milk input, 0.79 GJ heat and 0.27 GJ electricity per t product
MILK PREPARATION EVAPORATION 2.23 t milk 2.17 t milk 0.06 t cream 0.22 GJ 0.09 GJ 0.37 GJ 0.11 GJ Mass flow Heat Electricity 1.61 t moisture FINAL PROCESSING AND CLEANING-IN-PLACE 1 t sweetened condensed milk 0.15 GJ 0.07 GJ 1 t sweetened condensed milk 0.44 t sugar 0.0005 t Lactose crystals
Sweetened condensed milk: 2.23 t milk input, 0.74 GJ heat and 0.27 GJ electricity per t product
MILK PREPARATION EVAPORATION 7.46 t milk 7.24 t milk 0.22 t cream 0.54 GJ 0.23 GJ 1.22 GJ 0.36 GJ Mass flow Heat Electricity 5.30 t moisture DRYING, FINAL PROCESSING AND CLEANING-IN-PLACE 1.94 t evaporated milk 5.63 GJ 0.36 GJ 1 t milk powder 0.94 t moisture
Milk powder: 7.46 t milk input, 7.40 GJ heat and 0.95 GJ electricity per t product
MILK PREPARATION
AND FILTRATION
EVAPORATION
22.46 t milk 4.77 t milkretentate
0.66 t cream 1.63 GJ 1.14 GJ 0.70 GJ 0.23 GJ 3.04 t moisture DRYING, FINAL PROCESSING AND CLEANING-IN-PLACE 1.73 t evaporated milk retentate 5.33 GJ 0.37 GJ 1 t milk protein powder 0.73 t moisture 17.04 t milk permeate
Milk protein powder: 22.46 t milk input, 7.66 GJ heat and 1.74 GJ electricity per t product
Mass flow Heat Electricity
Figure 6 Production processes for condensed milk, sweetened condensed milk, milk powder and milk protein powder, showing energy and mass in- and output
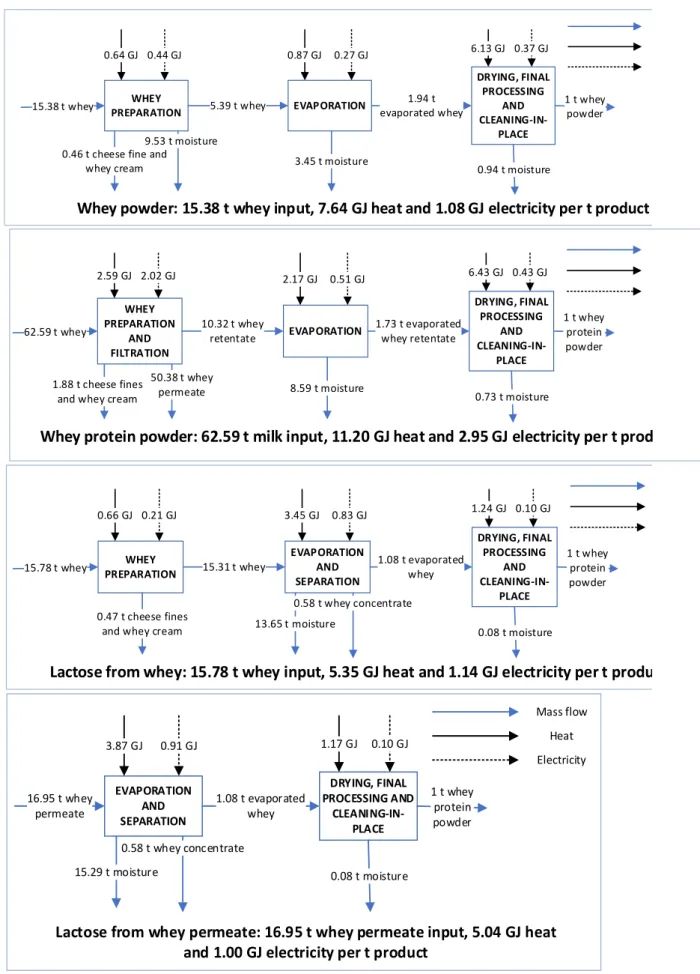
2.5 Whey powder and other whey products
The leftover whey from the cheese-making process can be used to make a wide variety of products, as it still contains proteins, fat, lactose and minerals. As with milk powder
production, removing water from the whey is an important step, since whey consists of even more water than milk (around 93%). The first step of whey processing is separation of the fine cheese particles and the free fat content present in the whey (Tetra Pak, 1995). After separation, the whey can be heat treated and subsequently processed into a wide variety of products. The processing steps for whey products are shown in Figure 7 below.
If whey powder is produced, the whey largely follows the same steps as for milk powder processing. Before evaporation the whey is generally cooled to 5-10 °C for preservation, and undergoes reverse osmosis to increase the dry matter content up to 18–24%, decreasing the energy requirements during evaporation (Chandan, Kilara, & Shah, 2008; Moejes & Van Boxtel, 2017). During reverse osmosis, the whey is pumped over a membrane with pore sizes of 10-4-10-3 micrometres at a pressure of 30 to 60 bar. The membrane lets water
through while retaining the solid components of the whey, thereby concentrating it (Tetra Pak, 1995). Afterwards the whey goes through evaporation (to 40–60% dry matter), spray drying and fluid-bed drying, until the final moisture content of around 97% is reached (GEA Process Engineering, 2010). Whey has a high salt content, which makes it largely unsuitable for direct consumption. Therefore, most often whey is separated into its constituent dry matter, such as whey protein and lactose. These products can then be used for instance as food ingredients or supplements (Tetra Pak, 1995). Whey powder can also be demineralised before evaporation, either through nanofiltration (for low degree demineralisation),
electrodialysis or ion-exchange. Electrodialysis makes uses of semi-permeable membranes that selectively let through positively and negatively charged particles, thereby depleting the whey of ions. During ion-exchange, ions are adsorbed by resin beads added to the whey (Tetra Pak, 1995).
Whey protein powder is created analogously to milk protein powder. First the separated and heat-treated whey undergoes ultrafiltration, after which the whey retentate can be further processed, undergoing evaporation (to 55% dry matter), spray drying and fluid-bed drying to yield a dried protein powder of around 95% dry matter. The permeate can be used as fodder for animals, or can further processed, for instance to separate its lactose content (Chandan, Kilara, & Shah, 2008; Tetra Pak, 1995).
Lactose, the main constituent of dry matter in whey, is separated through crystallisation, either from the post-evaporation concentrated whey or permeate left over after ultrafiltration of whey (European Commission, 2018a). Crystallisation occurs by adding seed crystals, after which the lactose crystals (with 92% dry matter) are separated from the remaining
concentrate through the use of screw conveyors. The concentrate can be used as animal fodder when dried. The crystals are then dried, generally using fluid bed drying, since the high temperatures used in spray drying would cause the lactose to denaturise. The crystals (with a moisture content of 0.1-0.5%) can then be ground down to the desired size and packaged (Tetra Pak, 1995).
WHEY
PREPARATION EVAPORATION
15.38 t whey 5.39 t whey
0.46 t cheese fine and whey cream 0.64 GJ 0.44 GJ 0.87 GJ 0.27 GJ 3.45 t moisture DRYING, FINAL PROCESSING AND CLEANING-IN-PLACE 1.94 t evaporated whey 6.13 GJ 0.37 GJ 1 t whey powder 0.94 t moisture 9.53 t moisture
Whey powder: 15.38 t whey input, 7.64 GJ heat and 1.08 GJ electricity per t product
WHEY PREPARATION
AND FILTRATION
EVAPORATION
62.59 t whey 10.32 t wheyretentate
1.88 t cheese fines and whey cream
2.59 GJ 2.02 GJ 2.17 GJ 0.51 GJ 8.59 t moisture DRYING, FINAL PROCESSING AND CLEANING-IN-PLACE 1.73 t evaporated whey retentate 6.43 GJ 0.43 GJ 1 t whey protein powder 0.73 t moisture 50.38 t whey permeate
Whey protein powder: 62.59 t milk input, 11.20 GJ heat and 2.95 GJ electricity per t prod
WHEY PREPARATION EVAPORATION AND SEPARATION 15.78 t whey 15.31 t whey 0.47 t cheese fines and whey cream
0.66 GJ 0.21 GJ 3.45 GJ 0.83 GJ 13.65 t moisture DRYING, FINAL PROCESSING AND CLEANING-IN-PLACE 1.08 t evaporated whey 1.24 GJ 0.10 GJ 1 t whey protein powder 0.08 t moisture 0.58 t whey concentrate
Lactose from whey: 15.78 t whey input, 5.35 GJ heat and 1.14 GJ electricity per t produ
EVAPORATION AND SEPARATION 3.87 GJ 0.91 GJ Mass flow Heat Electricity 15.29 t moisture DRYING, FINAL PROCESSING AND CLEANING-IN-PLACE 1.08 t evaporated whey 1.17 GJ 0.10 GJ 1 t whey protein powder 0.08 t moisture 0.58 t whey concentrate 16.95 t whey permeate
Lactose from whey permeate: 16.95 t whey permeate input, 5.04 GJ heat
and 1.00 GJ electricity per t product
Figure 7 Production processes for whey powder (demineralised), whey protein powder (35% protein in dry matter) and lactose, showing energy and mass in- and outputs
3 Dairy products and
application
3.1 Dairy end products
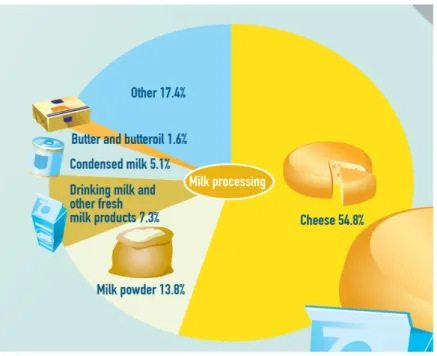
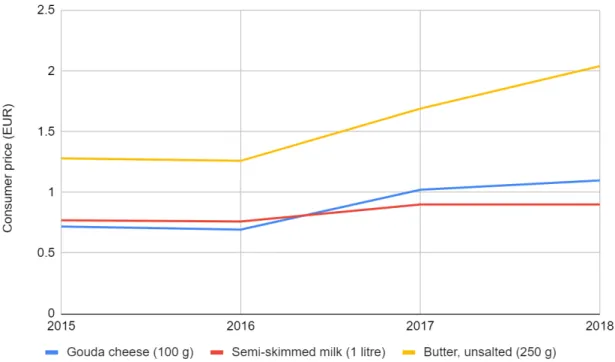
Of the roughly 14 billion kilograms of milk processed yearly, the Dutch dairy processing sector makes a wide variety of products. A breakdown of the use of this amount of milk is shown in Figure 8 below. Since different products require different amounts of milk, the production shares differ from the shares shown in the figure. Yearly milk supply and production of some dairy products in the Netherlands are shown in Table 4. Historical Dutch consumer prices for some of the products are shown in Figure 9 below.
Figure 8 Use of Dutch milk in 2018 (ZuivelNL, 2019a, p. 4)
Table 4 Milk supply and dairy production in the Netherlands (CBS, 2020)
Year Milk
supply (kt)
Production (kt)
Butter Cheese Milk powders Condensed
milk 2014 12,473 140.5 771.9 204.8 382.2 2015 13,331 147.6 845.0 204.2 407.8 2016 14,324 161.3 887.8 235.9 372.2 2017 14,296 149.0 874.2 249.9 367.0 2018 13,881 153.7 878.9 226.4 344.3 2019 (preliminary) 13,788 137.8 897.4 242.9 382.0
Figure 9 Development of consumer prices for Dutch dairy products (ZuivelNL, 2019b)
Many of the products can be used by direct consumption by the consumer. Other products, such as milk (protein) powders and whey (protein) powders, are mostly used for other purposes. Milk powder can be added to a variety of other foods during their production process. For instance, during chocolate production, addition of milk powder helps to reduce the viscosity of the chocolate, making it easier to process (Sharma, Jana, & Chavan, 2012).
Whey products, especially those further processed to remove or concentrate certain constituents of the original whey, can be used for a wide variety of applications, various of which are shown in Figure 10 below.
3.2 Prices and trade
Figure 11 below shows the price development for raw milk in the EU and the Netherlands.
Figure 11 Development of milk prices in European Union and the Netherlands (European Commission, 2019a)18
The export value of the Dutch dairy industry equalled EUR 7.7 billion in 2018, 5.7 billion of which was exported to countries in the European Union (mostly Germany (33% of intra-EU trade) and Belgium (22%)) and 2.0 billion to countries outside of the European Union (mostly China (12% of extra-EU trade)). A breakdown of the export value of Dutch dairy products is shown in Figure 12. Cheese and butter exports (over 880 kton and 290 kton respectively in 2018) are mostly destined for the European market (over 84% and 90% respectively), while milk powder (over 320 kton exported in 2018) is mostly exported to countries outside of the European Union (almost 70%) (ZuivelNL, 2019b). The export volume of Dutch dairy products is the 5th highest globally, and the highest of any country in the European Union. At the same
time, the Netherlands imports dairy products with a value of EUR 3.8 billion, mostly from Germany and Belgium (ZuivelNL, 2019a).
Figure 12 Export value of Dutch dairy products (ZuivelNL, 2019b)
3.3 Consumption and substitution
In the Netherlands, the average yearly dairy consumption was 79 kg of milk19, 3 kg of butter
and 21 kg of cheese per capita in 2018 (Wageningen University and Research, 2019). However, the national level of dairy consumption is decreasing. The National Institute for Public Health and the Environment has undertaken surveys to study the food consumption patterns of Dutch citizens. The surveys showed that the consumption level of dairy products decreased between 3.7% and 19.9% for the researched age groups between the surveys of 2007–2010 and 2012– 2014 (National Institute for Public Health and the Environment, 2016). However, more recent figures show a decline of 1.6% and an increase of 11% in the per capita consumption of milk and cheese respectively in the Netherlands between 2017 and 2018 (ZuivelNL, 2019b).
However, as shown in section 3.2, a significant amount of Dutch dairy products is exported abroad, and consumption of dairy products is expected to increase in many regions. For instance, in China and Africa consumption is expected to outpace domestic production, leading to an increase in imports from the European Union, at least until 2028. This increase mostly concerns imports of milk powder, as increases in demand for cheese and fresh dairy products come primarily from domestic consumption. China, for instance, is like to increase its imports with around 400 kt of milk-equivalents per year. This, and increases in other dairy importing countries, will lead to increases in European dairy-exports of around 1.4 million tons of milk-equivalents yearly between 2014 and 2025 (European Commission, 2015).
There is also a growing market for dairy alternatives, such as soy and other dairy-free milk, which accounted for 12% of total fluid milk sales globally. This market had a market share of around 3% of the total dairy market (dairy and dairy alternatives), with a value of USD 18 billion in 2018. And while global dairy demand is expected to grow with 2.5% the coming years, the demand for dairy alternatives is expected to grow twice as fast, with 5%, until 2022 - especially in the Netherlands, a relatively large increase in the retail volume and value of dairy
19 This probably includes drinking milk products, since ZuivelNL (2019a) reports a value of 42 kg, but this value explicitly excludes ‘other fresh milk products’.
alternatives has occurred between 2012 and 2017, increasing with around 20% and 25% annually respectively (European Commission, 2018b; Rabobank, 2018).
By (partially) substituting dairy products with a high environmental impact with products with comparable nutritional value or properties the total production of the dairy sector can be lowered, thereby reducing their emissions. The reduction in emissions will mostly stem from the reduced milk production, thereby preventing the relatively high dairy farm emissions (1.48 kg CO2-eq/kg Dutch milk, see Section 1). The emissions from processing of plant-based products
at the factory will typically be higher than those of dairy products, but this is offset by the lower emissions pre-factory gate. Life cycle assessments of plant-based milk alternatives are scarce, but show a carbon footprint that is 2.5-5 times lower for soy and almond milk compared to cow’s milk, based on the volume produced (Henderson & Unnasch, 2017; Poore & Nemecek, 2018; Roos, Garnett, Watz, & Sjors, 2018). As mentioned, substitutes should be found based on nutritional similarity, so comparing plant-based and cow’s milk based on volume can skew the results, as these products generally have different nutritional content, or more plant-based feedstock is needed to produce products with similar nutritional content.
4 Options for
decarbonisation
In this section options for reducing the CO2-emissions of the Dutch dairy processing sector will
be discussed. Categories for CO2-reduction measures are shown in Figure 13 below.
For the dairy processing sector, the main categories of decarbonisation options that apply are those related to fuel substitution and process design. In terms of fuel substitution, alternative methods for producing steam can be applied, such as electric boilers, boilers fuelled with biogas or green gas, and heat pumps or geothermal energy. Process design alternatives are in
development and/or partly exist in the form of the use of zeolite in spray drying, membranes for concentration purposes, or implementation of MVRs for evaporation. The decarbonisation
options are investigated for the dairy processing sector in general, and not all options may be applicable to specific companies. In the following sections the decarbonisation options will be explained further.
Generally, the decarbonisation options can be considered in two steps: first, increasing energy efficiency by process options, or by re-using the large amount of residual heat, either internally or externally. The second step, fuel substitution, can then be implemented with minimum impact and costs. In this way the entire process is decarbonised an at the same time the energy demand is minimised.
4.1 Process design options
4.1.1 Closed-loop spray drying with zeolite
Spray drying is the most energy intensive process used by the dairy processing industry, accounting for 27–55% of the energy requirements for the production of dried products. While the amount of moisture evaporated in a falling-film evaporator is generally much larger than in the spray dryer, energy use in the evaporator is much lower. This is partly because the exhaust heat can be reused in the process. As of 2020, this is not being done for the spray drying process, even though high temperature waste heat is available. This is partly due to the presence of fine powder particles in the dryer exhaust air, which cause fouling of the needed heat exchangers, preventing them from operating correctly, meaning that the sensible heat of the air cannot be recovered. These fines can be prevented through the use of monodisperse droplet atomisers (Moejes, Visser, Bitter, & Van Boxtel, 2018).
Atomisers used in 2020 produce polydisperse droplets, meaning that they are non-uniform in shape and size, resulting in different drying times for each droplet and differing shape and nutrient content in the final product (Wu, Patel, Rogers, & Chen, 2007). Monodisperse droplets can be created using a low-pressure feed paired with a piezo-electric element, which changes shape if an electric current is applied to it, sending a small shockwave through the feed, sending droplets out of the atomiser (European Commission, 2019b). Without the fines, the sensible heat in the dryer exhaust air can be recovered. It also opens up the possibility to recover the latent heat.
To recover the latent heat of the humid air leaving the dryer, a zeolite adsorption wheel can be used. Zeolite is an adsorption material, consisting of crystalline aluminosilicates, which can bind water molecules, thereby dehumidifying the air, making it suitable for reuse as drying air. At the same time, the latent heat present in the exhaust air is released through condensation in the zeolite, thereby increasing the temperature of the air, which can then be used for heating in the production process20. Zeolite has a large relative dehumidifying potential when operating in low
relative humidity, as compared to other adsorbents, making it suitable for use in the production process of dairy powders.
The zeolite needs to be regenerated after adsorption, a process in which the adsorbed water is released, which requires around 3320 kJ per kg of water to be removed. To ensure the energy efficiency of the drying system is increased when using zeolite, the heat for regeneration needs to be produced efficiently. This can be achieved by using ambient air or steam at high
temperatures (van Boxtel, Boon, van Deventer, & Bussmann, 2014). The surplus heat of regeneration can subsequently be used to heat the dehumidified air, reducing the energy use of the spray drying process with 38%21, if superheated steam at a temperature of 250°C is used
for regeneration (Moejes, Visser, Bitter, & Van Boxtel, 2018). By placing the zeolite on a rotating wheel, it can continuously pass between the adsorption and regeneration phase, thereby making continuous production possible (van Boxtel, Boon, van Deventer, & Bussmann, 2014).
The process flow for this option is shown in Figure 14 below. The costs of such an installation are shown in Table 5 below.
Friesland Campina started a pilot program using zeolite wheels for spray drying in 2014, aiming to produce steam at a temperature of up to 350°C at 1 bar, which could then be used in other
20 For instance, ambient air at 20°C and 70% relative humidity can be raised to around 60°C and a relative humidity below 1% using zeolite (van Boxtel, Boon, van Deventer, & Bussmann, 2014).
21 Other studies state an energy reduction potential of 30–50% (van Boxtel, Boon, van Deventer, & Bussmann, 2014), or 35–45% (Topsector Energie, 2019).
industrial processes (possibly after being mixed with steam at a higher pressure). The project finished at the end of 2018, showing that the zeolite-system is reliable, with the next step being the search for the proper conditions for a commercial test (Topsector Energie, 2019).
Figure 14 Process flow for a closed-loop system using a zeolite adsorber for producing milk powder (Moejes, Visser, Bitter, & Van Boxtel, 2018, p. 26)
Table 5 Techno-economic parameters for a zeolite wheel for spray drying
Parameter Value Source
Capacity [kg water/h] 1400 (Moejes, Visser, Bitter, & Van Boxtel, 2018)
Load hours [h/yr] 8000 Assumption
Electricity use
[% increase during spray drying]
25 Assumption
Lifetime [yr] 5 (Moejes, Visser, Bitter, & Van Boxtel, 2018) CAPEX22 [EUR/unit capacity] 250,000 (Moejes, Visser, Bitter, & Van Boxtel, 2018)
Fixed OPEX [EUR/yr] 7500 Assumed 3% of CAPEX
Table 6 below shows the amount of energy that can be saved if zeolite wheels are applied in the Dutch dairy processing sector for several products. Energy savings can be significant using zeolite, especially for products where the spray-drying process accounts for a large share of the total energy requirements (mostly milk and whey powder).
Table 6 Energy saved by application of zeolite in the Dutch dairy sector
Parameter Milk powder Milk protein powder Whey powder Whey protein powder (35%) Whey protein powder (58%)
Energy use spray drying without zeolite [GJ/t product]
4.38 3.92 4.82 4.31 4.31
Energy use spray drying with zeolite [GJ/t product]
2.72 2.43 2.99 2.67 2.67
4.1.2 Pre-concentrating milk/whey with membrane processes
22 Note that CAPEX does not necessarily scale with the capacity; this value is thus applicable for the presented capacity, and may deviate when the capacity is largely different.