PBL Note
Review landscape
appreciation model
Hans Farjon and Arjen van Hinsberg Corresponding author: hans.farjon@pbl.nl
January 2015
Summary
PBL needs reliable indicators, data and models to evaluate the perception,
appreciation and recreational use of nature and landscape. However, the application of existing models has revealed some limitations. PBL Netherlands Environmental
Assessment Agency requested the Department for Legal Research Tasks in the policy area Nature & Environment of the Wageningen University and Research Centre (WOT-WUR) to develop a landscape appreciation model that is based on revealed
preferences in recreational use instead of on stated preferences as in the existing model. PBL organised an external review of the WOT-WUR proposal for this new model to assess whether it would meet the PBL Term of Reference.
The review focused on four issues:
1. Indicators that best suit PBL policy studies for the Dutch Government 2. Scale to be considered (e.g. the countryside or the Netherlands as a whole,
including urban areas) 3. Type of data
4. Sufficient discrimination to assess the effects of policy measures set out in the Terms of Reference.
This note describes the review approach and the results, leading to the following conclusions:
• There is a need for a more profound evaluation of the four options for an indicator of landscape appreciation. This evaluation should take into account the future availability of primary data.
• There is an urgent need to redesign the data acquisition tool to optimise its use in calibration and validation of the prediction indicator. Other reasons to redesign this tool are technical developments and the high non-response level of inquiry panels. A promising approach to collecting more data with greater accuracy and improved data handling opportunities would be to convert the web-based survey tool to an app for mobile devices.
• PBL requested WUR-WOT to execute the proposed improvements in the predictive power of the model and to incorporate policy measures into the model as set out in the Terms of Reference.
Introduction
PBL Netherlands Environmental Assessment Agency in cooperation with the
Department of Legal Research Tasks in the policy area Nature and Environment of the Wageningen University and Research Centre (WOT-WUR) and the University of Groningen (RUG) have developed a set of indicators, monitoring systems and models to evaluate landscape quality for use in strategic policy analysis and assessment. The indicator set elaborates the definition of spatial quality in national policy documents on spatial planning in the period from 1985 to 2010 (VINO, VINEX, VIJNO, Nota Ruimte), see Box 1. PBL is now reconsidering indicators for the evaluation of perception, appreciation and recreational use of nature and landscape because of the recent shift in policies to the environment, spatial planning and nature. The national government prefers to evaluate policies from a welfare and economics perspective, for instance, in cost-benefit analysis.
PBL landscape quality indicators
Biodiversity and landscape appreciation are the key indicators to estimate and
evaluate the impacts of policy measures on nature and landscape. However, these two indicators do not cover all relevant impacts on the quality of nature and the
landscape1.
A more effective indicator is required for the impact on the cultural quality of nature and landscape, including landscape design. Landscapes are not static entities. Their qualities and how they are perceived by people change continuously, and can acquire new meanings as a result of landscape design.
A set of criteria is available to evaluate the cultural heritage (Witteveen+Bos, 2008; Commissie voor de milieueffectrapporatge, 2012) but an operational system hampered by a shortage of data. While development of such a system is not part of the PBL mission, the urgency of and requirements for such a system have been discussed with other institutes, such as Rijksdienst Cultureel Erfgoed (RCE). The design quality should been evaluated at project by expert teams.
PBL evaluates biodiversity and landscape appreciation of nature and landscape in a functional framework. We want to place our indicators in international and national functional frameworks, such as ecosystem services and cost-benefit analysis (CBA), which is a requirement to evaluate national government investment in the land system. In order to fit into these frameworks, PBL is re-designing an indicator to evaluate landscape appreciation to take into consideration the intensity of recreational use of nature and landscape.
1 PBL distinguishes four aspects of landscape quality; landscape appreciation, biodiversity, cultural quality and suitability for use, which is based on the translation of Vitruvius criteria of good design (venustas, firmitas, comoditas) into four aspects of spatial quality in the policy document on spatial planning, 'Nota Ruimte'. De
elaboration of the four aspects, is presented in Dossier Landschap of Compendium voor de Leefomgeving
( http://www.compendiumvoordeleefomgeving.nl/onderwerpen/nl0012-Landschap.html?i=12 )
Knowledge about perception and appreciation of nature and landscape is required for monitoring systems and models. Data on landscape preferences are collected by the Hotspotmonitor (HSM) (www.hotspotmonitor.eu; Sijtsma et al., 2013; De Vries et al., 2013). The models currently used are GLAM (GIS-based Landscape Appreciation Model; De Vries et al., 2007; Van der Wulp, 2008) and AVANAR to determine the balance between demand for and supply of recreational opportunities (De Vries et al., 2010). As these models have various limitations, PBL requested WOT-WUR to develop a landscape appreciation model ‘GREAT’ (GIS-based REcreational ATtractiveness), based on revealed preferences in recreational use.
In October 2012, PBL and WOT-WUR organised a review to determine how the GREAT model could be developed to meet PBL requirements as a basis for WOT-WUR
proposals for a landscape appreciation model for the 2013-2015 period. Approach review
Four experts were invited to review the model in April and May of 2013. Professor Mari Sundli Tveit (Universitetet for Miljø og Biovitenskap, Ås, Noorwegen) and Professor Agnes van den Berg (University of Groningen) accepted the invitation. Professor Dirk Sijmons, who is a member of the PBL Advisory Board, agreed to discuss the review results.
The review was carried out in three stages. In the first stage, the reviewers were presented with PBL requirements and the WOT-WUR project plan, set out in the following documents:
• PBL Terms of Reference (Attachment 1)
• Descriptions of PBL and WOT-WUR instruments to monitor and model landscape perception
• WOT-WUR project plan to develop the landscape appreciation model (GREAT) (Attachment 2).
The first stage concluded with a review meeting on 28 May 2013 with Wim
Nieuwenhuizen and Sjerp de Vries, PhD, from WOT-WUR and Arjen van Hinsberg, PhD, and Hans Farjon, MSc, from PBL. Frans Sijtsma, PhD, of the University of Groningen was invited to present the HSM data acquisition tool.
In the second stage, the reviewers prepared the recommendations (17 June 2013; see Attachments 3 and 4), and the WOT-WUR research team was asked to comment (Attachment 5).
In the third and final stage, PBL summarised the results and prepared a research proposal for the period from 2013 to 2015 (this note). On 5 November 2013, this note was discussed with Professor Dirk Sijmons and Steffen Nijhuis, MSc, Landscape Architecture, Delft University of Technology (Attachment 6).
1. the most suitable indicator for PBL policy studies for national government; the indicator most suitable for cost-benefit analysis in policy analysis; and the appropriate best aggregation level to address appreciation;
2. whether the indicator and the model should address only the countryside or include the whole of the Netherlands including urban areas;
3. the relationship between the proposed model and the Hotspotmonitor (HSM) data acquisition tool;
4. whether the proposed model has sufficient discriminating power to assess effects of policy measures described in the Terms of Reference, and which of those policy measures could be evaluated. Consideration was given to whether there are policy measures that cannot be evaluated by any model using state of the art knowledge.
A summary and conclusions are given for each of the four issues above, under the following headings:
• PBL Terms of Reference
• Proposal for the GREAT model by WOT-WUR • Review
• Response by the WOT-WUR team • PBL conclusions
Results - Indicator PBL Terms of Reference
PBL requested WOT-WUR to develop an improved landscape appreciation model based on revealed preferences in recreational use. The indicator should fit with CBA in addressing the effects of policy measures on human welfare, and should be based on revealed preferences and the estimated size of the impact population. This indicator is defined as the value of potential recreational use by the Dutch population and is based on the physical characteristics of an area and the impact population.
Proposal for the GREAT model by WOT-WUR
WOT-WUR proposed stepwise development of the landscape appreciation model, starting from a visual attractiveness indicator, via an indicator of attractiveness for recreational use and an indicator of recreational use, to finally an indicator of the value of recreational use. Only the first two stages have been elaborated in the GREAT model proposal.
Review
The reviewers recommended considering another indicator with higher relevance for policymakers, such as the restorative power of nature or even the health effects of nature.
They support an attractiveness indicator that is broader than visual attractiveness. Rather than focusing on recreational use, the recommendation was to make a
distinction between appreciation and recreational use. Doubts were expressed about whether the revealed preferences approach would be feasible.
Response by the WOT-WUR team
The team subscribed to the notion that an indicator of the health effects of nature would score higher than recreational value on the political agenda, but
implementation would have far-reaching consequences. There is little evidence of health effects of nature and landscape other than in relation to proximity. These effects have only been reported on a local scale. More knowledge and data on quality of the urban environment would be required. The team was not convinced of the needs for a broad, non-specified attractiveness indicator, because a broad definition introduces uncertainties about the context of the stated preferences.
PBL conclusions
PBL choses to develop an indicator of nature and landscape appreciation based on preferences in recreational use. This choice is based on the fact that other aspects of appreciation of nature and landscape are covered by other indicators, such as those on the contribution of nature to the appreciation of the living environment, and on the value of biodiversity and cultural quality.
Many hedonic pricing studies have been carried out on the relationship between real estate value, an indicator for appreciation of the living environment, and nature and landscape characteristics. A meta-analysis of these studies in the United States was carried out by Brander and Koetse (2011). Dutch studies have been carried out on this theme by, for instance, Luttik (2000), Bervaes and Vreke (2004), Crommentuijn et al. (2007), Dekkers (2010) and Marlet et al. (2013). This knowledge has already been applied in cost-benefit analyses of government policies.
For the evaluation, expert judgement on the value of biodiversity, cultural history and design seems to be more appropriate than citizens’ stated preferences.
The reviewers recommended that PBL considers an indicator for the health benefits of nature and landscape. However, PBL did not adopt this recommendation because it considers nature ‘on people’s doorstep’ to be more important for health than nature in the distant countryside and in nature reserves. One of the reviewers is in agreement on this point.
The review also showed that there is not yet a clear operational definition for the landscape appreciation indicator based on revealed preferences in recreational use. Furthermore, the reviewers doubted whether preferences could be revealed from recreational behaviour. The recommendation was to select an integrated appreciation indicator. For more information on this issue, see Chapter 4..
Results - Spatial aspects PBL Terms of Reference
The model should discriminate between effects at local, regional and national scale (as in the Hotspotmonitor).
The model should be sensitive to present effects on national, regional and ecosystem or landscape level.
Proposal for the GREAT model by WOT-WUR
The proposal addressed the regional scale; day trips. It was assumed that preferences are the same for both national and regional scale.
Review
The reviewers recommended that less emphasis be put on the national scale because national preferences are robust and stable. The local scale should be included because of its relevance in terms of impact on appreciation, proximity and frequency of contact.
Response by the WOT-WUR team
The team concluded that the reviewers favoured the local scale. However, the local scale has major consequences and will require more knowledge and data on urban quality. It is doubtful whether integrated modelling at local and regional scales would be feasible.
PBL conclusions
PBL concluded that the key variables to explain recreational use frequency are distance from and accessibility of nature and landscape. Thus, it would be preferable to include these variables in modelling landscape appreciation rather than to
distinguish different levels in data collection and modelling. The implication is one model for the all of the Netherlands, and this has implications for the further development of the Hotspotmonitor and for the proposed GREAT model. Results - Data acquisition
PBL Terms of Reference
Data source requirements were not included for the model, except for linking it with the data collection tool, Hotspotmonitor.
Proposal for the GREAT model by WOT-WUR
The proposal for the GREAT model includes data from the websites ‘My place to be’, Hotspotmonitor and WoON, used for calibrating and validating the indicator of recreational attractiveness and the underlying sub-indicators of scenic beauty. The proposal also makes it clear there is no on-going monitoring programme that generates reliable data on visits to specific location, which is needed to validate the indicator recreational use.
Review
The reviewers stressed the need for primary data acquisition on preferences and appreciation, and suggested using the potential of Hotspotmonitor in data acquisition, and recommended optimising the connection between Hotspotmonitor and the GREAT model.
Response by the WOT-WUR team
The HSM questionnaire should be adjusted to meet the requirements of the indicator and the model (the aggregation level of the indicator and the type of object
evaluated). PBL conclusions
PBL adopted the reviewers’ recommendations to optimise the link between the model and the data acquisition tool, Hotspotmonitor. The need for primary data acquisition on preferences for nature and landscape and recreation is evident. The HSM
questionnaire should be adjusted to fit better with the indicator and model. The primary data set should meet the needs of indicator calibration and validation in the model. The links between data acquisition, indicator definition and model design have to be elaborated further before the model can be built.
Results - Discriminating power to assess effects of policy measures PBL Terms of Reference
In combination with other PBL models, the model should be able to estimate the effects of most of the following types of policy measures:
• Public investment on construction, restoration and improvement of nature reserves, parks, landscape elements and recreational facilities (e.g. paths); • Public financial allocations for management of nature areas, parks, high-value
agricultural land and natural and cultural landscape elements;
• Restrictions to or plans for building new elements that disturb the landscape such as wind parks, large sheds and new infrastructure.
Proposal for the GREAT model by WOT-WUR
The proposal aims to improve the discrimination and predictive power of modelling of scenic beauty by improving the sub-indicator naturalness in the GLAM model and adding a sub-indicator on variety in scenery, peace and quiet, and (non-natural) points of interests.
Review
The reviewers state that the predictive power of the GLAM model is high but not sufficient for all relevant policy measures, and could be improved by using more detailed data about naturalness (land-use classes and biodiversity data). Data on variety, complexity, landscape mystery or points of interest might improve the predictive power of the GLAM model. The stepwise approach to the GREAT model seems time consuming and full of risks, and thus it would be preferable to use the
most aggregated indicator. In the GREAT model, this would be the value of recreational use.
Response by the WOT-WUR team
The team is working in the direction suggested by Agnes van den Berg, but it remains to be seen whether this will improve the predictive power for scenic beauty.
PBL conclusions
The reviewers indicated that the GLAM model has good explanatory and predictive power. Thus, it would be a good investment to improve this power by upgrading the naturalness indicator with new secondary data, such as land-use classes and biodiversity data sets. Variables for POIs, variety of scenery and peace and quiet might also improve the predictive power.
It is doubtful whether higher predictive power will improve evaluation of all policy measures included in the Terms of Reference. Incorporating policy measures in the model requires further elaboration in the GREAT model proposal.
Conclusions
The indicator definition requires further elaboration, especially on (1) how nature and landscape characteristics contribute to recreational behaviour, and (2) how citizen satisfaction can be derived from the data available. An in-depth evaluation of the options for a landscape appreciation indicator is required before starting modelling, because the reviewers expressed concerns about the political relevance of a recreational use indicator and the difficulties involved in revealing landscape preference from recreational data. These options are the contribution of the characteristics of nature and landscape to:
• the stated happiness of a person at a specific location;
• the stated appreciation of a specific location, not specified for aspects such as scenic beauty or recreational use;
• the stated appreciation of a specific location for specified recreational activities; • the frequency of recreational use of a certain location or area.
The evaluation of these options should specifically take into account:
• the availability of primary data to calibrate and validate the predicted indicator; • the options to start modelling the indicator without a stepwise approach as
proposed in the GREAT model. Stepwise calibration of subsets of variables does not seem to offer advantages over a direct calibration with all variables. There is an urgent need to redesign the Hotspotmonitor to optimise its use in
calibration and validation of the predicted indicator. Other reasons for redesigning the Hotspotmonitor are technical developments and the high percentage of non-responses in inquiry panels. A promising approach to collecting more data with greater accuracy and improved data handling opportunities would be to convert the web-based survey tool to an app for mobile devices. Examples to consider are the MAPPINESS App of the London School of Economics (http://www.mappiness.org.uk/; MacKerron, 2012 )and the Landscapiness project of Delft University of Technology.
PBL requested WOT-WUR to improve the predictive power of the sub-model for appreciation of scenic beauty described in the GREAT model proposal, because it was fully supported by the reviewers. This action was started in June 2013.
PBL requested WOT-WUR to incorporate policy measures as input variables, in the landscape appreciation model. The policy measures to be incorporated are
References
Brander LM and Koetse MJ. (2011).The value of urban open space: Meta-analyses of contingent valuation and hedonic pricing results. Journal of Environmental Management 92: 2763–2773.
Bervaes JCAM and Vreke J. (2004). De invloed van groen en water op de transactieprijzen van woningen. Alterra Report 959, Alterra, Wageningen. Crommentuijn L, Farjon JMJ, Van der Wulp NY and Den Dekker C. (2007).
Belevingswaardenmonitor Nota Ruimte 2006: Nulmeting landschap en groen in en om de stad. Netherlands Environmental Assessment Agency (MNP), Bilthoven. De Vries S, Roos-Klein Lankhorst J and Buijs AE. (2007). Mapping the attractiveness of
the Dutch countryside; a GIS-based landscape appreciation model. Forest, Snow and Landscape Research, 81 (1/2): 43–58.
De Vries S, Staritsky I, Clement J, Kiers M and Roos-Klein Lankhorst J. (2010). Vraaggerichte recreatieplanning op regionaal niveau; naar een betere afstemming van geboden op gevraagde mogelijkheden voor recreëren in het groen middels AVANAR-plus. Alterra Report 2093. Alterra, Wageningen.
De Vries S, Buijs AE, Langers F, Farjon H, Van Hinsberg A and Sijtsma FJ. (2013). Measuring the attractiveness of Dutch landscapes: identifying national hotspots using Google Maps. Applied Geography 45: 220–229.
Dekkers J. (2010). Externalities, land use planning and urban expansion. PhD thesis VU University Amsterdam.
Luttik J. (2000). The value of trees and open space as reflected by house prices in the Netherlands. Landscape and Urban Planning, 48, 161–167.
MacKerron G. (2012). Happiness and environmental quality. PhD thesis, London School of Economics.
Marlet G, Ponds R and Van Woerkens C. (2013). De groene stad, in: Atlas voor gemeenten 2013. VOC Uitgevers, Nijmegen.
Sijtsma FJ, Farjon H, Van Tol S, Van Kampen P, Buijs A and Van Hinsberg A. (2013). Evaluation of landscape impacts – enriching the economist’s toolbox with the Hotspotindex In: C.M van der Heide and W.J.M. Heijman. The economic value of landscapes. Routledge studies in Ecological Economics 136–164.
Witteveen+Bos. (2008). Handreiking cultuurhistorie in m.e.r. en MKBA.
Commissie voor de milieueffectrapportage. (2012). Aandacht voor landschap in MER. Factsheet.
Van der Wulp NY. (2008). Belevingswaardenmonitor Nota Ruimte 2006; Nulmeting Landschap naar Gebieden. WOt Report 75. Wageningen UR, WOT-WUR Natuur & Milieu, Wageningen.
Parts of this publication may be reproduced, providing the source is stated, in the form: PBL (2012), Review landscape appreciation model, PBL publication number 1352, The Hague, PBL Netherlands Environmental Assessment Agency.
Gewijzigde veldcode
Attachment 1 Terms of Reference for modelling preferences for recreational use of nature and landscape
Hans Farjon and Arjen van Hinsberg, 13 May 2013 Introduction
Over the last 10 years, PBL Netherlands Environmental Assessment Agency, in cooperation with Wageningen UR (WUR) and University of Groningen (RUG), has developed knowledge on the appreciation for and recreational use of nature and the landscape. This knowledge has been implemented in monitoring systems and models used by PBL for strategic policy analysis and assessment. The Hotspotmonitor (HSM) is used to collect data on landscape preferences. The models currently used are the GIS-based Landscape Appreciation Model (GLAM) and AVANAR (a model to determine the balance between demand for and supply of recreational opportunities). However, the application of these models has revealed some limitations. Therefore, PBL has requested WOT-WUR to develop an improved landscape appreciation model based on revealed preferences in recreational use.
This note sets our PBL’s requirements for this improved model, starting with its application in PBL research to support political discussions and government decision-making. Subsequently, the limitations of the current model (GLAM) are summarised, and the requirements for future model improvements are specified.
Field of application
PBL Netherlands Environmental Assessment Agency is the national institute for strategic policy analysis in the fields of the environment, nature and spatial planning. We contribute to improving the quality of political and administrative decision-making by conducting outlook studies, analyses and evaluations in which an integrated approach is considered paramount. Policy relevance is the prime concern in all our studies. We conduct solicited and unsolicited research that is always independent and scientifically sound.We conduct solicited and unsolicited research that is always independent and scientifically sound. Our core tasks are :
• to investigate and document current environmental, ecological and spatial quality;
• to explore future social trends that influence environmental, ecological and spatial quality, and evaluate policy options;
• to identify social issues of importance to environmental, ecological and spatial quality and raise them for discussion;
• to identify strategic options for achieving government objectives in environment, nature and spatial policy.
In our analysis on nature, we focus on the functions of nature with respect to biodiversity, utility and appreciation. We define nature broadly to include landscape
as defined by the European Landscape Convention1. Our analytical toolbox includes a set of linked indicators, monitoring systems and models. The indicators are used to quantify functions in policy relevant terms. The monitoring systems use tools to describe and evaluate the current status of functions. Monitoring results are published and frequently updated on
http://www.compendiumvoordeleefomgeving.nl/onderwerpen/#Natuur.
We use models to assess future trends and effects of policy options2. Our standard national models are Meta NatuurPlanner for biodiversity, GLAM for appreciation and AVANAR for aspects of the recreational utility function. PBL applies these models in outlook studies and ex-ante evaluations of government policies and plans. Recent outlook studies include the Nature Outlook 2010-2040
(http://themasites.pbl.nl/natureoutlook) and the scenario study Welfare, Prosperity and Quality of the Living Environment
(http://www.welvaartenleefomgeving.nl/context_UK.html). Recent ex ante evaluations have been published on the National Policy Strategy for Infrastructure and Spatial Planning3 and the 2012 National Election Manifestos4 and cost-benefit analysis (CBA) of integrated spatial projects funded by the national government (see Sijtsma et al., 2013).
Limitations of current tools
Application of the GLAM and AVANAR models in PBL studies has revealed some serious limitations. Firstly, the current set of indicators for appreciation and recreational use does not fit the government requirements for integrated evaluation studies based on cost-benefit analysis (CBA). Secondly, the predictive and discriminating power of the GLAM model is a serious limitation in some applications.
Indicators do not fit in cost-benefit analysis
In the Netherlands, CBA has become an important method for the ex-ante evaluation of national investments, for example, in infrastructure, ecological restoration, housing programmes and integrated spatial projects. PBL undertakes these evaluations quite often in cooperation with Netherlands Bureau for Economic Policy Analysis (CPB). CBA determines the effects of public and private investments on society, providing insight into all effects on welfare. CBA monetises effects, and if possible on revealed
preferences. However, effects on nature are often difficult to monetise and figure as PM items in these evaluations. This is a serious limitation in CBA.
There are three further reasons for the limited influence of our indicators of appreciation and recreational utility function of nature in decision-making.
1 ‘An area, as perceived by people, whose character is the result of the action and interaction of
natural and/or human factors.’ (Council of Europe 2000)
2 PBL uses models also to interpolate monitoring data
3http://www.pbl.nl/publicaties/2011/ex-ante-evaluatie-structuurvisie-infrastructuur-en-ruimte 4 http://www.pbl.nl/publicaties/2012/keuzes-in-kaart-2013-2017-een-analyse-van-tien-verkiezingsprogrammas
Firstly, the current appreciation indicator is based on stated preferences and not on behaviour or revealed preferences. From this perspective, our indicators on
appreciation should be based on the relationship between behaviour and physical characteristics of nature rather than on a relationship between stated preferences and these characteristics.
Secondly, the current indicator is too narrowly defined with regard to effects on welfare. The indicator calculated by the GLAM model is defined as the attractiveness of a landscape in terms of its scenic beauty. This limited definition does not take in consideration other types of value, such as the attractiveness of the landscape as the environment for living, working and recreation.
However, there is another methodological issue to be considered. It is unclear what aspects are included in the stated preference of respondents, and what they consider to be nature and landscape. Several studies5 have clearly shown that people differ in perception and appreciation of nature and landscape. The respondent’s socio-economic and cultural background influences their perception, just as their practical value of nature and landscape does. Thus, there is no shared perception or definition of nature and landscape. The problem of a lack of a shared definition will not tackled by applying a sharp definition in questionnaires.
A further weak point in the current model is the lack of information about the impact population. It is not clear how many people would benefit from a calculated increase in landscape attractiveness and whether it is the happy few in the direct neighbourhood or all inhabitants of the Netherlands. The GLAM model evaluates the landscape attractiveness for people living within a 20 km range, and does not include changes in attractiveness for tourists and travellers. This is a serious limitation in evaluating national investment in local projects.
The GLAM model's limited discriminating and predictive power
The discriminating and predictive power of the GLAM model is too limited, both qualitatively and spatially, for application in PBL evaluations and outlook studies. With regard to the first aspect, the model only discriminates changes between three broad land use classes, but not changes in the classes of natural, agricultural and urban land use. For example, a hectare of monoculture production forest has the same value as a
5Berg, A.E. van den, 1999. Individual Differences in the Aesthetic Evaluation of Natural Landscapes. PhD
Thesis, University of Groningen, the Netherlands.
Van den Born, R. 2007 Thinking nature Everyday philosophy of nature in the Netherlands, Thesis, University of Nijmegen, the Netherlands.
Buijs, A.E. 2009. Public Natures: Social representations of nature and local practices. PhD Thesis, Wageningen University, the Netherlands.
Crommentuijn, L., J.M.J. Farjon, N.Y. van der Wulp en C. den Dekker (2007). Belevingswaardenmonitor
Nota Ruimte 2006: Nulmeting landschap en groen in en om de stad. Milieu- en Natuurplanbureau, Bilthoven, Nederland.
Steg, L. & A.E. Buijs. 2004. De psychologie van milieugedrag en natuurbeleving. Vakreview Psychologie en Duurzame Ontwikkeling.
hectare of coastal dunes or heathland. Thus, the model has little use in evaluating measures in nature and spatial planning policies.
With regard to predictive power or the explained variation in its regression model, GLAM reviewers concluded in 2005 that they considered the model ‘a useful and cheap instrument to get a rough estimate of the geographical variation of perceived
landscape quality that can be used in combination with other much more expensive methods that provide more detailed data’. The reviewers advised investing in improving the predictive power of the GLAM model. However, various attempts to improve the predictive power using larger and geographically more distinct data on stated preferences have meet with little success. This experience was the main argument for developing another method to collect data with Hotspotmonitor. Reference
To improve the quality of decision making on policies related to the quality of nature and landscape, PBL needs to develop a coherent set comprising an indicator, a monitoring system and a model for the appreciation of nature and landscape to assess effects of policy measures on nature in terms of welfare and prosperity of the society. In 2010, a new method was developed to survey nature and landscape preferences (Hotspotmonitor) and to calculate a new indicator (Hotspotindex). The first monitor results6 seem useful for policy support and applicable in CBA. In 2013, consideration was given to improving the GLAM model to meet four requirements:
1. The model should assess a policy relevant indicator; the value of potential recreational use by the Dutch population based on the physical characteristics of an area and the size of the impact population.
2. The model should be useful in assessing effects of policy measures. 3. The model should enable comparison of the effectiveness of measures in
different regions and thus be sensitive to spatial differences. 4. The model should fit in the PBL model framework.
Ad 1): Deliver a policy relevant indicator
• The output variable should reveal the potential value of areas for recreational use, based on revealed preferences for the physical characteristics of the area and its surroundings.
• The size of the impact population should be included in the calculation. • The indicator should integrate aspects of appreciation and recreational utility
value.
Ad 2) Sensitive to relevant policy measures
6Sijtsma, F.J. et al. 2013. Evaluation of landscape impacts – enriching the economist’s toolbox with the
Hotspotindex In: C.M van der Heide and W.J.M. Heijman. The economic value of landscapes. Routledge studies in Ecological Economics 136-164.
De Vries, S et al. (submitted to Applied Geography) Measuring the attractiveness of Dutch landscapes: identifying national hotspots using Google Maps.
The model should estimate (in combination with other PBL models) the effects of most of the following types of policy measures:
• Public investment on construction, restoration and improvement of nature reserves, parks, landscape elements and recreational facilities (e.g. paths); • Public financial allocation to management of nature areas, parks, high-value
agricultural land and natural and cultural landscape elements;
• Restrictions to or plans for building new elements that disturb the landscape, such as wind parks, large sheds and new infrastructure.
• The typology of current input variables in the GLAM model (naturalness, urbanity, disturbing landscape elements) is not sufficiently discriminating to evaluate these policy measures.
Ad 3) Sensitive to relevant spatial differences
• The model should be sufficiently sensitive to estimate regional differences in effects of policy measures.
• The model should discriminate between effects on local, regional and national scale (as in Hotspotmonitor).
• The model should be sensitive to present effects on national, regional and ecosystem or landscape type.
Ad 4) Fit in the PBL model framework
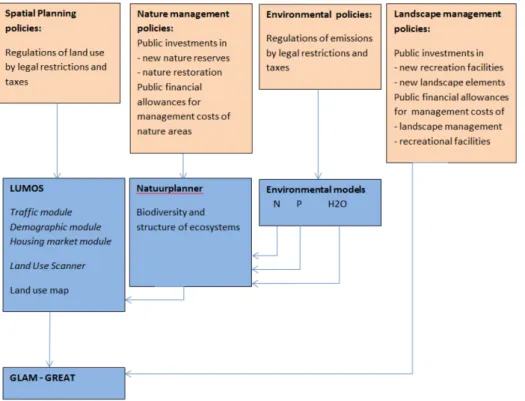
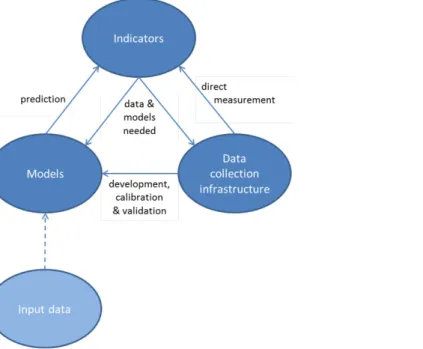
• The model should fit in the PBL model framework used in outlook studies and ex ante policy evaluations, see Figure 1.
• The model should communicate with other relevant models, most of which work with a spatial resolution of 100*100 m grid.
• There should be adequate interface with Ruimtescanner, a model that simulates land use changes, and MetaNatuurplanner, a model that simulates changes in biodiversity and ecosystems.
Figure 1: Input of the GREAT and GLAM models in terms of policies and output of other models in the PBL model framework.
Attachment 2: Towards a GIS-based REcreational ATtractiveness model; GREAT Project proposal
Sjerp de Vries and Wim Nieuwenhuizen, WOT-WUR Wageningen UR 1 Introduction
1.1 Background and goal
The Netherlands Environmental Assessment Agency (PBL) needs tools to conduct prospective (ex ante) evaluations of spatial developments, planned and unplanned. Such developments may take place in the city or in the countryside. As a national agency, PBL is mainly concerned with the countryside and assesses the consequences of developments in the countryside for a wide range of functions and values. One of these is the value an area has for the Dutch population, the citizens. This value may be based on many different functions of an area for different groups of people. PBL would prefer an integrated value assessment for citizens, and for the value
assessment to be a suitable input for social cost-benefit analyses (SCBA) and environmental impact assessments (EIA).
By definition, ex ante evaluations deal with future situations. This means that revealed preference approaches are not feasible, unless combined with benefit transfer models. The first type of tool is information collection by which people are asked directly how much they value a specific area (directly stated preference). In the case of ex ante evaluations, this would be a hypothetical area, which has to be presented to the survey participants in a way so that they become familiar with it. Because of the many possible functions, which differ in relative importance for people, an adequate and unbiased presentation is not easy. Moreover, taking a presentation (becoming familiar with the new situation) is likely to be time-consuming for survey participants. It may lead to low response levels, leaving only highly motivated people in the final sample.
If the ex ante evaluation concerns a development plan for an area to be executed in the foreseeable future, the transition phase (from old to new situation) may influence value ratings (De Vries, 2007). While valuation of the transition phase is useful information, planned spatial developments are usually intended to create long-lasting (sustainable) new end states. In this respect, the impact of the transition phase on an intended valuation of the end state may easily be greater than considered desirable. In addition, the social and policy process surrounding the physical transition may influence value ratings strongly. Psychological resistance to change based on uncertainty about the form of the new situation and reaction to uncalled for change may be relatively short lived. These issues are important in their own right. For example, they may influence acceptance of the proposed development plan. However, in a long-term evaluation of the new end state, based mainly on its spatial and physical characteristics, the survey approach may not be the most suitable method. For the above reasons, PBL requested WOT-WUR to assess the potential for
areas after proposed plans involving substantial changes have been implemented. Modelling should start with the spatial and physical characteristics of the area and focus on the countryside. Such an approach immediately raises an important issue. While people may be asked to assign an overall, integrated value to a certain area, for model development it is necessary to know the functions on which the assigned value is based. The desired function more or less defines the characteristics of the area that are likely to be of high importance for the value assigned, and thus guides model development. To model an integrated value rating, several sub-models may be needed, one for each function. Most Dutch people use the countryside mainly for recreation. Arguably, this makes recreation the most important function of the countryside (De Vries, 2009). Thus, it was decided to assess the potential for developing a spatially explicit model for the recreational value of the Dutch countryside. This is referred to as recreational attractiveness.
In addition to the theoretical framework for the new model, three factors are crucial in determining the effectiveness of knowledge systems in contributing to sustainable development ; salience, credibility and legitimacy of the model output (Cash et al, 2003). The legitimacy for the development is stated here as a reflection of PBL needs for modelling recreational attractiveness. For credibility, see section 4 on calibration and validation. To ensure the model is salient, chapter 5 presents how the new model is related to the products that PBL aims to produce.
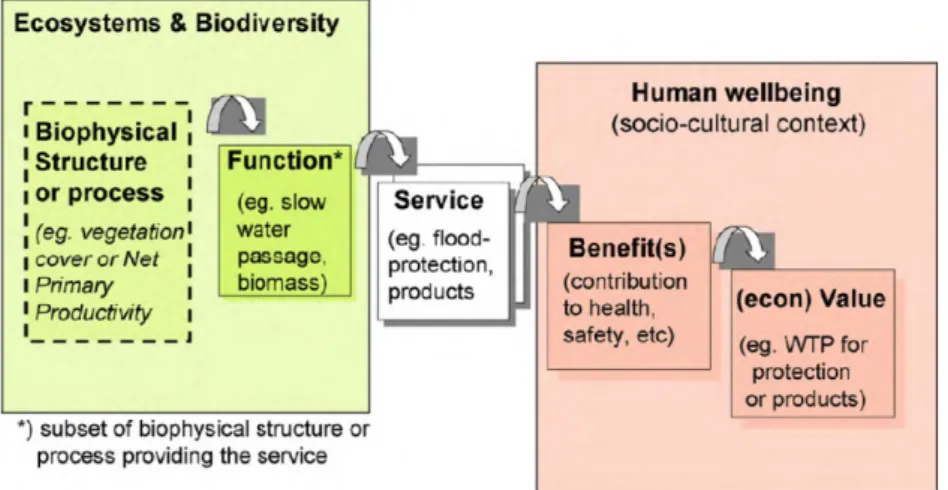
Valuation of ecosystem services in general ; ‘cascade’ model (De Groot et al., 2010) Opportunities for nature-based recreation may be considered an ecosystem or landscape service (Termorshuizen and Opdam, 2009). De Groot et al. (2010)
developed a generic conceptual model for such services and goods. The ecosystem or landscape has a structure that is defined by spatially explicit landscape characteristics. Based on this structure, it fulfils certain functions. When a specific function is used and valued by humans, it becomes a service with benefits that can be valued, possibly in economic or monetary terms.7 This model offers a framework in which to position the cultural ecosystem or landscape services of aesthetic appreciation and recreational use.
7 People are not always aware of the use and/or value derived from this use. In our opinion, awareness is
not necessary for a service. For instance, people at street level are not always aware of the positive effects of green roofs on air quality and ambient air temperature in cities. Another issue is whether non-use values, such as existence, option and bequest values, should be included.
Figure 1: ‘Cascade’ model (De Groot et al., 2010)
The term ‘value’ is used here in an economic, utilitarian sense, as opposed to a moral sense (see also Figure 1). Different types of economic value may be distinguished. Here, the focus is on the value that individuals derive from their use of the resource. Use value is only generated when an individual actually uses the resource. This may be distinguished from the potential use value ; the value generated when the opportunity would be used, regardless of whether this use actually occurs (similar to the distinction between function and service made by De Groot et al., 2010). The end point of our modelling is the value that people derive from the recreational use of or visits to natural environments.
1.2 Contours of the new model
The GLAM model (Roos-Klein Lankhorst et al., 2011) focuses too exclusively on scenic beauty for the present purposes. Scenic beauty is assumed to be a key component of the recreational attractiveness of an area, but not the only one. On the other hand scenic beauty is also considered to be of importance outside a nature-based leisure or recreational context. For example, the landscape can be appreciated while going to work, school or home. Thus, it was decided to keep this model intact and even develop it further in its own right. The GLAM output will be used as input for the new model for recreational attractiveness to cover the scenic beauty component. The scenic beauty rating of an area is assumed not to differ according to recreational activity.8 The perception quality component will be complemented by an utilisation quality component (see Goossen and Langers, 2000). The latter may be expected to differ according to activity. Thus, each activity requires its own sub-model. We
propose to develop a model with a similar structure to the GLAM model. Since spatially explicit modelling is almost impossible without GIS data, the name chosen for the new model is 'GIS-based REcreational ATtractiveness' (GREAT).
8 This rating may differ according to transport mode, for instance due to differences in velocity. A landscape
considered boring as a setting for a recreational walk may be more attractive as a setting for a bicycle tour. This has to do mainly with the level of variation encountered ‘along the way’.
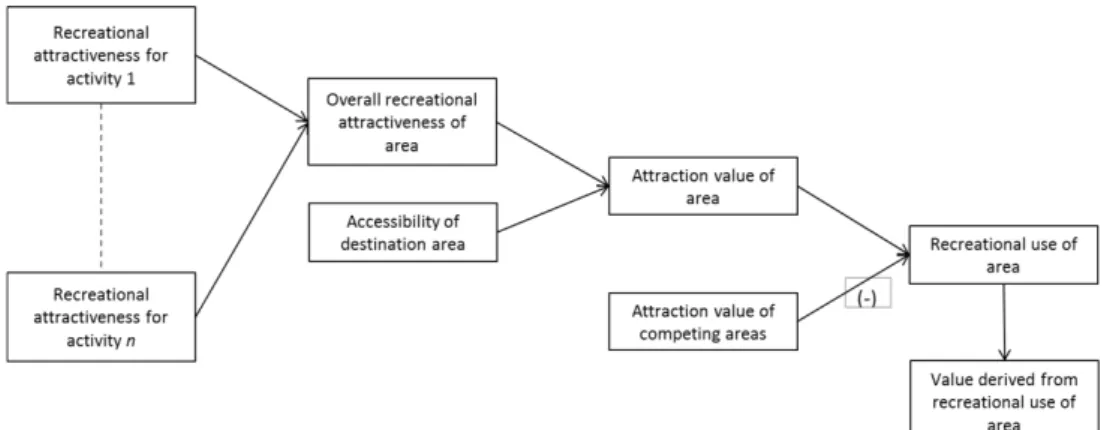
Figure 2: Conceptual scheme of the GREAT model for a destination area to be elaborated by activity.
The conceptual scheme for the GREAT model is presented in Figure 2. However, modelling recreational attractiveness is only the first step in modelling the use value generated by recreational visits to a natural environment or destination area. An intermediate step is the recreational use made of the area. In addition to the overall recreational attractiveness of the area, other factors include:
• accessibility of the area from a person’s place of residence (permanent or temporary);
• attraction value of competing destination areas.
The annual number of recreational visits to a destination area may be considered a proxy for its recreational use value. But not all visits are of the same duration. The total amount of time spent in the area per year may be a better proxy. Based on these ideas, a simple conceptual scheme for the recreational use value is presented in Figure 3. However, the quality of the experience during recreational visits is also importance. High densities of visitors in the destination area may reduce the quality. At some point, more visits at one time may reduce the aggregated use value of all people simultaneously visiting the area. The step from visits or use to use value is not as straightforward as the scheme in Figure 3 suggests (see also, De Vries, 2009).
Figure 3: Scheme for extended model for the recreational use value of a destination area
The rest of this proposal focuses on a model for recreational attractiveness, but eventually a model for the recreational use value of natural environments as
destination areas will be developed. Next steps could be to model the recreational use of an area and its recreational use value. Another approach would be to start with modelling recreational use value. Given the budget and time constraints, this approach would be at the expense of the level of detail in and thoroughness of modelling
recreational attractiveness. However, later parts of the model may be refined. Thus, there are two possible approaches:
• Start with a crude model for recreational use to be refined later;
• Stepwise approach, starting with recreational attractiveness and later including use and use value.
This proposal is for a roadmap for the second option and is presented below. 1.3 Scope of the model
The model will focus on the attractiveness of countryside areas for nature-based recreation. It will generate predictions for all of the Dutch countryside but not for urban areas and large water bodies. Furthermore, the model will be limited to nature-based recreation. Large-scale attraction and theme parks, zoos and events may generate many visits , but their visitors rarely visit the area surrounding the park or event site. These leisure destinations are not included. Historical sites embedded in the landscape and small facilities that are usually not the sole or even primary reason to visit an area are considered to be a part of the landscape.
The model focuses on the attractiveness of an area as a destination for nature-based daytrips. This is expected to differ from its attractiveness as a holiday destination. Opportunities for nature-based recreation are assumed to be a factor in the choice of a holiday destination, and concern opportunities in a wider region around the holiday accommodation. In addition to this difference in scale, other factors are expected to influence the choice of holiday destination, for example, the holiday accommodation (availability, type, facilities and amenities, quality, price) and supply of other types of
leisure destinations (cultural, historical, amusement, shopping).9 However, in terms of nature-based recreational activities, holiday-makers are expected to value the same qualities in an area as local and regional recreationists. Thus, the GREAT model may offer useful input for a model that predicts the attractiveness of larger areas as a holiday destination.10
The model will predict the potential value of an area when visited. It will not model the use value, which also depends on the number and duration of visits made and the value derived from these visits. However, the potential value is thought to be an important determinant of the probability that an individual will visit an area. Thus, the GREAT model may offer useful input for a model to predict numbers of visits to an area for nature-based recreation or for a model to predict the value people derive from such visits (De Vries, 2009).11
Initially, relatively little attention will be given to individual differences as to why an area is considered an attractive setting for a certain recreational activity (for market segmentation purposes). While there may be substantial individual differences, the objective is not to predict attractiveness for individuals, but for larger groups of people, mainly defined spatially. It is assumed that most individual differences will average out quickly, already at a detailed spatial scale.12 There is empirical support for this assumption for the scenic beauty part of the model. For example, Van der Wulp (2008) showed that only average age had some added predictive value (see also, Ode and Miller, 2010). However, account will be taken of the fact that individuals in the Dutch population differ in their desire to participate in a certain recreational activity (size of demand).13 This is important in aggregating attractiveness by recreational activity into an overall recreational attractiveness score.
1.4 Relationships with existing models and tools
The proposed model is related to models and tools developed by WOT-WUR and/or PBL, at least conceptually and some also functionally. In this section, these relationships are described to help position the new model.
9 This is about destinations that might be considered ‘foot loose’. As mentioned,, in as far as things are
deeply embedded, a part of the landscape so to speak, they will in principle be included.
10 Note that the nature-based day trips people make when on holiday are also part of the recreational use
(and sometimes may outweigh use by ‘local’ people). They can be included in a model for recreational use. However, how many (Dutch) people spend how many holiday nights where is an additional question. See also Henkens et al. (2005).
11By modeling potential use value separately, later on this may be compared with actual use. This
comparison may help to identify areas whose potential is not yet utilized.
12 A possible exception is the ethnic origin of people, because a. differences in desired qualities/facilities may
be substantial, and b. the composition of local populations in these terms may differ considerably. See also Buijs et al, 2006).
13 It has been established that there is a large difference in the yearly number of nature-based day trips per
person between people living in the Randstad region and the people living outside this region (Agricola et al., 2011). However, it is unclear to what extent this difference is due to a smaller and less attractive supply of opportunities for such activities in the Randstad region, or to different preferences of the population of this region.
GIS-based Landscape Appreciation Model (GLAM)
The GIS-based Landscape Appreciation Model (GLAM; De Vries et al, 2005) predicts the scenic beauty of the landscape, also referred to as the visual attractiveness of an area. Predicted stated preferences refer to a function that does not necessarily become a service (see Figure 1). To experience scenic beauty, an area has to be visited. In this sense, potential for visual enjoyment is modelled.
Based on a literature study, landscape spatial and physical characteristics that are expected to affect visual landscape appreciation were identified. For each
characteristic, an indicator was developed using data from national GIS databases. This enabled the construction of a spatial map of the present (predicted) landscape attractiveness for all the Dutch countryside.
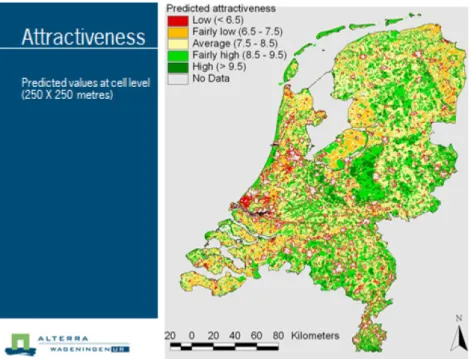
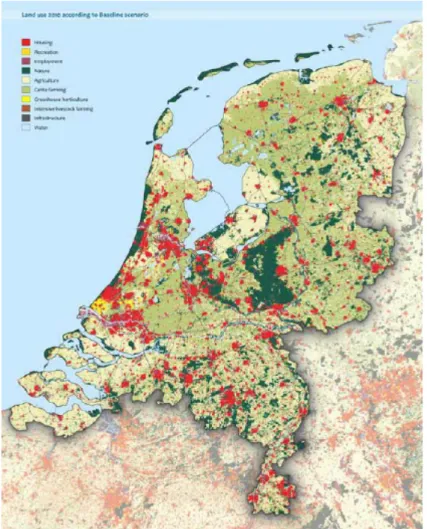
Each indicator was validated separately and adjusted where necessary and feasible. The indicators were combined in a linear model. The weight of each indicator was determined empirically based on survey data and using linear regression (calibration phase). The model generates predicted values for 250 m cells (see Figure 4). However, the calibration was based on average predictions for areas with a 5-km radius. The present GLAM model (2.1) has four indicators:14 Naturalness, Historical character, Urbanity, and Skyline disturbance.
The GLAM model was validated with data from other surveys, and the results varied considerably with the survey used. Explained variances ranged between 1% and 59%. This might be due largely to the formulation of the question in the surveys on which the validations were based. As the GLAM model focuses on scenic beauty, strong references to the visual aspect of the area may need to be included in the question to get a good correspondence. Therefore the optimal question is considered to be how attractive is the landscape in the specified area looked at? This is a more specific question than, for instance, how attractive do you find the specified area? If the above hypothesis is correct, this would reinforce the argument made earlier that clarity is essential about what the new model is intended to predict.
Recreational Quality Indicators
Based on a literature study, Goossen and Langers, (2000) identified factors for assessing the quality of a rural area for a specific recreational activity. These factors were divided into two groups. One group concerned the scenic beauty (perception quality) and the other group the fitness for use of the area for the activity (utilisation quality). The relative importance of these factors and their levels were determined for each activity, using a conjoint analysis design. Hypothetical areas were described in terms of their levels of the factors and rated by study participants (stated preference). Some factors and their levels were operationalised as quality indicators using GIS data
14 Similar characteristics and accompanying indicators may also be found in studies on landscape character
(see e.g. Tveit et al., 2006; Van Eetvelde & Antrop, 2009). However, the purpose here is somewhat different. The purpose is not to define a landscape typology, regardless of how the types are valued, but to
predict scenic beauty ratings (seealso, Ode et al., 2008; Uumeaa et al., 2009). These approaches may
to produce in a national map of predicted stated preference. This last step in the model development was not calibrated and validated. The model deals with the attractiveness or suitability for the recreational function, and not use or the value derived from this use. At least conceptually, this model may be considered a predecessor for the new model. A distinction will be made between scenic beauty indicators and fitness for use indicators, with the latter being dependent on the recreational activity.
Figure 4 Output map of the GLAM model (version 2.1) FORVISITS
In contrast to the two previous models, FORVISIT (De Vries et al., 2004; Henkens et al., 2005) predicts use, and more specifically the annual number of visits to individual forest and nature area in the countryside. The number of visits may be considered a first proxy for the recreational value a natural area has for an individual, and when aggregated, for society as a whole (see De Vries, 2009).
FORVISITS is a distribution model. The average number of visits is assumed to be independent of the local and regional supply of forest and nature areas. Moreover, even the distribution of transport by car and by bicycle (modal split) is assumed to be fixed. Each transport mode has its own sub-model.15 On the supply side, the inputs are the size and recreational quality of nature and forest areas, with quality estimated by the model described above. On the demand side, inputs are the size and
15 Other modes of transport have not bee included in applications However, in version 2.0 of FORVISITS,
composition of neighbourhood populations. Another input is the distance between neighbourhood and destination area. For visits by car, distance to the parking area for the destination area is used. For visits by bicycle, beeline distances are used, with a higher ‘resistance’ of the distance through built-up areas. Distance and quality are used to calculate the relative attractiveness of each destination area within 25 km of the neighbourhood by car or by bicycle. Subsequently, the number of visits expected to be generated by a neighbourhood is distributed according to the relative
attractiveness of the destinations within this choice set, by mode of transport. The number of visits originating from different neighbourhoods and modes of transport are aggregated to arrive at a predicted number of visits per destination area. Calibration and validation of the model proved to be difficult because of lack of reliable data on number of visits to forest and nature areas. The new model could offer an improved, and more empirically based recreational quality indicator as input for a model such as FORVISITS.
MyPlaceToBe
The Dutch version of MyPlaceToBe (Goossen et al., 2011a) is a website that enables custom-made maps of the Netherlands to be generated indicating the attractiveness of various parts of the Dutch countryside for recreation according to user’s own
preferences.16 The first step is a presentation of the landscape surrounding the user’s residential area in terms of land use. The user can change this composition to accommodate personal preferences. A constraint is that changes can only be made within the range of land use that occur in the Netherlands. In addition to land use, the website visitor can indicate preferred levels of aspects, such as traffic noise and skyline disturbance. The user can assign weights to different types of land use and other aspects. The percentage of each land use type and the level of each aspect are known for the whole of the Netherlands except for large water bodies. This makes it possible to generate custom-made maps. Before a map is created, the website visitor is asked questions, such as how attractive do they consider the landscape
surrounding their place of residence.
The map gives an attractiveness value per 500 m cell, based on the area within a 5-km radius of the cell. Based on the composition of the landscape surrounding the place of residence and the score on additional aspects, a regression analysis was performed for the average attractiveness score per 4-digit postal code area. Only post code areas from which at least five visitors originated were included in this analysis (n = 1664). Eight land use types and four additional aspects were included in the final model that had considerable predictive value (52% explained variance).17 However, the variables in the regression model are largely inter-correlated, making
interpretation of regression weights difficult as the size of unique contributions
(possible multicollinearity issues). Nevertheless, this model and the data behind it may offer useful insights for the new model. A positive feature is that a website visitor is confronted with the composition (in terms of land use) and aspect scores of the
16 There is also a European/English version: www.myplacetobe.eu
17 This percentage of explained variance concerns the fit of the model after calibration. It has not been
landscape surrounding his/her place of residence, as a reference point. Thinking about landscape preferences may help to anchor the subsequent preference rating of the individual’s ‘own’ landscape.18 The variable on which the regression model was calibrated (criterion variable) focused on the landscape attractiveness. The word ‘landscape’ is assumed to have a strong visual connotation. The website visitor is not asked for the desired infrastructure and facilities for recreational activities, for neither general nor specific activities. The focus is on perception qualities.
Hotspotmonitor
Hotspotmonitor (HSM; www.hotspotmonitor.eu) is a web-based tool for collecting information on which places people consider to be attractive or valuable.19 It generates spatially explicit information. Respondents are asked firstly to indicate where they live, and subsequently to mark the place they consider most attractive, valuable or important. However, there are some constraints. A place may be in or outside a city or village, but it should be green, water or nature. It may be a place in a park, by a lake, at the sea, in the forest, near cows in the meadow, in a tulip field, a place to watch birds. These can be places the individual has never visited or places visited frequently (Sijtsma et al., in press). The choice set from which to select the place is limited. More specifically, participants were asked to place markers at three levels: local (<= 2 km from home), regional (<= 20 km from home) and national (all of the Netherlands). At the national level, two markers could be placed, the most preferred and second most preferred place.
The Hotspotmonitor identifies the most valuable places at different spatial levels, regardless of the reasons these places are highly valued. It is an integral, overall valuation of the place.20 Moreover, the difference in spatial level is thought to be highly relevant when HSM data are to be used in SCBAs because both the size of the impact and size of the impact population are important. With regard to use in an SCBA for a proposed regional development plan, the valuation of the new situation should also be available. In addition to stated preference for the existing situation, the predicted stated preference for the new situation after the development is also required. Although the Hotspotmonitor is not a model, attempts have been made to develop a model based on the average density of markers an area of a certain type receives (Sijtsma et al., in press). When continued, this could be considered a related, or parallel model development to the proposed new model.
HSM data give information on the overall attractiveness of a place and not on its use value (see Figure 3). For development of the GREAT model, data at local and regional level may be more important than at national level. There are clear indications that many of the markers placed at the national level signify high attractiveness as a
18 Although the answering scale has predefined end points, this process may still make it somewhat of a
self-anchoring scale (Cantril, 1965).
19 Dutch version 1.2: http://www.wetenschapwerkt.nu/hotspot/5/survey/index.php?lang=nl
English (demo) version 1.0: http://www.wetenschapwerkt.nu/hotspot/4/en/survey/index.php
20In second instance, people are asked to indicate on which qualities they base the placing of their marker.
They have to make a choice from a predefined list with 14 qualities or values, and may add a free-format description.
holiday destination (De Vries et al., submitted). As already argued, additional factors are likely to come into play for holiday destinations compared to day trips. HSM data seem especially useful in identifying fine discriminations people make at the high end of the attractiveness continuum.
2 GREAT conceptual model 2.1 Preface
Our initial ideas for the detailed development of the GREAT model are presented. Chapter 2 focuses on the conceptual model and operationalisation of the conceptual model is presented in Chapter 3. These two phases will not take place in a strict sequence in the development process. We will start with developing a conceptual model, followed by a first operationalisation of a proposed quality that we expect to be important as a GIS-based indicator. However, the plan is to validate this first
operationalisation as well as possible (based on available data) and, if deemed desirable, to adjust the operationalisation (and maybe even the underlying conceptual quality). The next step is to try to validate this new version. After operationalising several fitness of use qualities (or additional perception qualities), we will calibrate the model thus far and look at its fit. We will also perform an error analysis and examine the spatial distribution of errors. This may lead to adjustment of indicators and conceptual qualities. Thus, the development process is iterative in nature. As stated above, each recreational activity requires a sub-model.
2.2 Improved and/or additional perception qualities
Scenic beauty is considered to be a perception quality and will be covered in the GREAT model by another model, GLAM 2.1. However, the GLAM model may be improved, and in addition to scenic beauty, there are other perception qualities to consider.
Naturalness
In the present version of the GLAM model, naturalness is one of the four indicators. Validation of the GIS-based indicator shows reasonable correlation with the average naturalness rating given by people familiar with an area (Van der Wulp, 2008: r = 0,61 for amount of nature and r = 0.66 for spontaneity of nature). The naturalness rating (amount of nature) is strongly related to the attractiveness rating. If the rating on the amount of nature is included in a regression analysis, as well as the four GLAM indicators, the explained variance in attractiveness almost doubles. So, improving the naturalness indicator, in the sense that it coincides more closely with perceptions of naturalness will improve prediction of the scenic beauty of an area considerably. At present, this indicator makes little distinction between different types of nature or ecosystems.
Variety in scenery
In the literature, variety (or complexity) is considered an important aspect (see e.g. Tveit et al., 2006). Usually, it is expected to contribute to scenic beauty, unless it makes the scenery chaotic or messy. Most studies deal with variety at the level of a single scene or view shed (see e.g. Ode et al., 2010). However, for daytrips, variety at
a higher spatial level may also be relevant, such as variety in scenery encountered on the trip.21 While variety at both levels may be expected to be related, especially in areas of low visual openness, low variety at the viewshed level does not have to imply low variety across scenes.
Peace and quiet
One of the frequently mentioned reasons for visiting the countryside is peace and quiet (Coeterier and De Boer, 2001). This is usually connected to low intensity of human activity, and to ‘slow’ activities. The absence of signs of highly dynamic activities contributes to this perception quality. Such signs may be visual or auditory. Industrial or traffic noise (silence or no non-natural sounds), and noise made by other people contribute negatively to this experience. Recreational use may also detract from this quality, when use is intensive (high density of visitors). See also, De Vries et al. (2010).22
Points of interest (non-natural)
Recreational trips may include short stops to visit a point of interest, which need not be nature-based, or about scenic beauty. Such points may be visited because they are considered interesting rather than of scenic beauty. They may also be beautiful without fitting into the surrounding landscape (e.g. some land marks). They can be historical and/or cultural in nature. This is a more cognitive dimension of
attractiveness. In line with the focus on nature-based recreation, points of interest are limited to those that are not the main reason to visit to an area and are only a small part of the daytrip. Landscapes may be rated as highly attractive because they are considered interesting or intriguing rather than of scenic beauty. Rather than pleasing the senses, a landscape may tickle the mind.
2.3 Fitness for walking
As fitness for use qualities may differ per recreational activity, qualities are described partly by activity. The focus is on three of the most popular nature-based activities (Goossen et al., 2010, p. 19) ; walking, cycling, water-based recreation (including swimming).
Infrastructure for recreational walking
A key aspect of fitness for use for recreational walking is a network of paths and roads. People tend not to like walking up and down the same road, and like to have choice on where and how long to walk. Compared to other modes of transport, walking is done at low speeds, and thus a rather dense network is considered preferable. Path density (including suitable roads) might be considered a first indicator. However, this is only an approximation of network density. Nodes in the network are important because they determine how many routes and distances are possible in an area. Sometimes, a small stretch of path, or even crossing a previously
21 For holiday destinations, variety at a higher spatial level is likely to be relevant, allowing for
daytrips to different types of areas.
22 An exception should be made for water-based recreation, especially when swimming is
included. This activity usually takes place at high densities. If the sub-model can be calibrated by activity, this will not constitute a problem. See also, Goossen and Langers (2000).