On health risks of ambient PM in the
Netherlands
Full Report
Netherlands Aerosol Programme
October 2002
RIVM report 650010 032
Editors: Eltjo Buringh and Antoon Opperhuizen Authors:
Aben, J.1;Ameling, C.B.1; Beck, J.1; Boere, A.J.F.; Breugel, P.B. van1; Brink, H.M. ten3
; Brink, R.M.M. van den1
; Buijsman, E.1
; Brunekreef, B.4 ; Buringh, E.1; Cassee, F.R.1; Dekkers, A.L.M.1; Dolmans, J.1; Eerens, H.C.1; Fischer, P.H.1
; Harmelen, A.K. van2
; Keuken, M.P.2
; Kooter, I.M.1
; Loon, M. van2 ; Loveren, H. van1; Marra, M.1; Matthijsen, J.1; Noordijk, H.1; Opperhuizen, A.1; Schaap, M.2,3
; Schlesinger, R.B.5
; Slanina, J.3
; Smeets, P.1 ;
Smeets, W.L.M.1; Spoelstra, H.2; Steerenberg, P.A.1; Visschedijk, A.J.H.2; Visser, H.1
; Vries, W.J. de1
; Weijers, E.3
; Winter, R. de1 ;
1) Rijksinstituut voor Volksgezondheid en Milieu, Bilthoven
2) Nederlandse Organisatie voor Toegepast Natuurwetenschappelijk Onderzoek, Apeldoorn 3) Energieonderzoek Centrum Nederland, Petten
4) Institute of Risk Assessment Studies, University of Utrecht
Abstract
Particulate Matter (PM) in the ambient air can lead to health effects and even to premature mortality. This result has been found in a score of epidemiological studies, but their cause is not yet clear. It is certain, however, that these effects are so serious and so extensive that further action is warranted. In the scientific literature ambient aerosols are known as PM, short for Particulate Matter. Depending on the diameter or size of the particles, they are termed PM10 (for particles with diameters of up to approximately 10 micrometres) or PM2.5 (for those less than 2.5 micrometres in diameter). One micrometre is a thousandth of a millimetre. Humans inhale particles smaller than 10 micrometres, which end up deep in our airways.
Recent studies have presented well-founded assumptions concerning the biological mechanisms involved and the groups of people that are probably more susceptible to PM. Particulate Matter is a generic term for a complex mixture of large and small airborne particles. However, the causal factors within this complex mixture are difficult to disentangle and have not yet been identified. The second Section of this report looks at the different types of PM, their atmospheric behaviour and the methods of measuring them. The health effects associated with PM are also presented. Section 3 discusses the most recent epidemiological, toxicological and human clinical findings and their mutual relationships.
On the basis of epidemiological studies it has been estimated that in the Netherlands some 1,700 to 3,000 people per year die prematurely as a result of inhaling ambient PM. These figures reflect only the effects of acute exposure to air pollution. If the long-term effects of chronic exposure are taken into account, premature mortality could affect 10,000–15,000 people a year in the Netherlands. These last estimates for chronic exposure are more uncertain, because chronic effect studies are much fewer in number. The estimate of the chronic effects was based on foreign studies, which are not completely comparable with the Dutch situation.
Section 4 gives an overview of the most recent information relating to sources of PM and emissions in the Netherlands, while the last Section presents a critical evaluation of the current and future EU standards.
It is recommended that PM10 be retained as a standard for the time being, as it covers the effects of both fine and coarse particles. In view of the emerging evidence implicating fine particles in health effects, it is recommended that a standard for fine PM and/or a source-related fraction be developed as well.
Even with PM concentrations well below European Union (EU) standards, people's health will still be affected because no threshold has been found for the occurrence of health effects. PM is a complex mixture containing fractions that are to a greater or lesser extent health-relevant. This differentiation in potency has profound implications for an efficient and effective reduction of health impacts through PM emission
abatement.
PM abatement can be justified by the precautionary principle. Further source- oriented actions could focus on reduction of the total PM10 aerosol mass or, first of all, on those PM fractions that are expected to be more health-relevant. This last option is
preferred. These fractions are probably transport-related (diesel soot) and, more generally, combustion-related primary PM emissions. Abatement should therefore focus on these sources. In this respect, the abatement of uncontrolled shipping emissions has been identified as one of the more cost-effective control options.
Abatement of other combustion sources such as industrial combustion, wood burning in fireplaces, and off-road machinery are also possible, but less cost-effective.
The European Union has decided on two standards for PM, a daily and an annual average value. The current EU standards for daily and annual average values are not equivalent, as was originally intended. In the Netherlands the following options are equivalent to the EU annual standard of 40 µg/m3
: a daily level of 50 µg/m3
with 80 exceedances (while the EU allows 35 exceedances) or a daily level of 100 µg/m3 with 7 permitted exceedances per year. For practical reasons a daily standard of 100 µg/m3 is preferred. Although the EU has proposed two standards for PM, there are several arguments that only one standard would suffice – annual mean concentrations being the best choice. However, for reasons of communication to the public daily standards may be appropriate.
Compliance with the annual average EU standard seems feasible for PM10 in the Netherlands in 2005, although local exceedances at ‘hot spots’ cannot be ruled out. Compliance in 2010 with the indicative annual average EU standard of 20 µg/m3
is not feasible, even at high cost. Expectations are that there will still be 36–40 exceedances per year of the EU daily standard of 50 µg/m3
even after all planned abatement measures (Current Legislation of Emissions (CLE)) have been taken in 2010. Therefore, compliance with the current EU daily standards for 2005 and 2010 does not seem feasible in the Netherlands and adverse health effects will continue to occur.
Samenvatting
Fijn stof in de lucht kan leiden tot gezondheidsklachten en zelfs vroegtijdige sterfte. Dat blijkt uit een honderdtal epidemiologische studies. Hoe die effecten precies ontstaan is nog niet duidelijk. Vast staat echter dat de gezondheidseffecten door fijn stof zo ernstig en omvangrijk zijn dat nadere actie geboden is. In de
wetenschappelijke literatuur staat fijn stof bekend als ‘deeltjesvormige
luchtverontreiniging’ (Engels: Particulate Matter, ofwel PM.). Afhankelijk van de doorsnee van de stofdeeltjes wordt gesproken van PM10 (voor deeltjes met een
doorsnee tot 10 micrometer) of PM 2,5 (doorsnee tot 2,5 micrometer). Een micrometer is een duizendste millimeter. Deeltjes kleiner dan 10 micrometer worden door mensen ingeademd en dringen door in de luchtwegen.
Dankzij recente studies zijn er gegronde vermoedens over de biologische
mechanismen die in het spel zijn en welke groepen mensen waarschijnlijk gevoelig zijn voor blootstelling aan fijn stof. Maar aangezien ‘fijn stof ’ een verzamelnaam is voor een complex mengsel van allerhande grote en kleinere stofdeeltjes in de
luchtverontreiniging blijft het lastig om oorzakelijke verbanden te ontrafelen. In hoofdstuk 2 van dit rapport komen de verschillende fijn stof deeltjes, hun onderlinge wisselwerking in de atmosfeer en de diverse meetmethoden aan bod. Ook wordt een overzicht gegeven van de gezondheidsklachten die fijn stof kan veroorzaken. In hoofdstuk 3 worden de nieuwste epidemiologische, toxicologische en medische inzichten in onderlinge samenhang besproken.
Op grond van epidemiologische studies wordt geschat dat in Nederland jaarlijks zo’n 1700 tot 3.000 mensen vroegtijdig overlijden door het inademen van fijn stof. En dan hebben we het alleen nog over de acute gevolgen van blootstelling aan
luchtverontreiniging. Nemen we ook de lange-termijneffecten van chronische blootstelling aan fijn stof in beschouwing, dan zouden in Nederland mogelijk zelfs 10.000 tot 15.000 mensen jaarlijks vroegtijdig overlijden. De laatste schattingen zijn met meer onzekerheid omgeven, aangezien chronische effecten in minder studies gekwantificeerd zijn dan acute effecten. Bovendien is de berekening het resultaat van een vertaalslag van internationale onderzoeksresultaten naar de Nederlandse situatie en die is niet helemaal vergelijkbaar.
Hoofdstuk 4 van dit rapport geeft een overzicht van de meest recente informatie over bronnen en emissies van fijn stof in Nederland. Aansluitend wordt in hoofdstuk 5 de huidige en toekomstige Europese normstelling kritisch beoordeeld.
Aanbevolen wordt om voorlopig PM10 te blijven hanteren als Europese standaard voor luchtverontreiniging door grove èn fijnere stofdeeltjes. Daarnaast zou er voor het fijnste stof een aparte normstelling of een meer brongerichte normstelling ontwikkeld moeten worden omdat er steeds meer aanwijzingen komen dat kleinere stofdeeltjes de gezondheid bedreigen.
Overigens is nooit aangetoond dat de gezondheidseffecten pas boven een bepaalde drempelwaarde optreden. Zelfs van fijn stof concentraties ver onder de huidige Europese normen zijn gezondheidseffecten in de bevolking te verwachten. Fijn stof is een complex mengsel van allerlei fracties die meer of minder van belang zijn voor de gezondheid. Die verschillen in toxische potentie wegen zwaar mee bij een
doeltreffend emissiebeleid.
Bestrijding van de uitstoot van fijn stof valt te rechtvaardigen vanuit het voorzorgbeginsel.
Door verdere brongerichte maatregelen kan men de totale massa PM10 aërosol in de luchtverontreiniging terugdringen, of eerst die fracties aanpakken die vermoedelijk het meest relevant zijn voor de gezondheid. Waarschijnlijk behoren tot de relevante fracties het dieselroet uit de vervoerssector en fijn stof afkomstig van overige verbrandingsprocessen. Dergelijke bronnen verdienen prioriteit in het beleid voor uitstootbeperking van fijn stof. Bestrijding van de ongecontroleerde
scheepvaartemissies blijkt bijzonder kosten-effectief. De aanpak van andere verbrandingsprocessen, zoals industriële verbranding, open haarden en mobiele werktuigen is ook mogelijk, maar minder kosten-effectief.
De EU heeft voor fijn stof twee normen vastgesteld, namelijk een dag- en een
jaargemiddelde. Deze beide normen zijn niet gelijkwaardig, hoewel dat oorspronkelijk wel de bedoeling was. De Europese jaargemiddelde PM10 norm bedraagt 40
microgram fijn stof per kubieke meter lucht (µg/m3). In Nederland kunnen we dat vertalen naar een dagelijkse norm van 50 µg/m3
met 80 toegestane overschrijdingen per jaar (terwijl de EU-norm maar 35 overschrijdingen toestaat) of een dagelijkse norm van 100 µg/m3
met 7 toegestane overschrijdingen per jaar. Om praktische redenen verdient die laatste norm de voorkeur. Overigens zijn er goede argumenten om maar één norm, en dan liefst een jaargemiddelde, te hanteren. Een daggemiddelde norm kan echter van pas komen bij publieksvoorlichting.
In 2005 lijkt de jaargemiddelde EU norm van 40 µg/m3 voor fijn stof in Nederland in het algemeen haalbaar. Lokale overschrijdingen op ‘hot spots’ zijn echter niet uit te sluiten. In 2010 is de indicatieve jaargemiddelde waarde van 20 µg/m3 in Nederland echter niet haalbaar, zelfs niet tegen hoge kosten. Zelfs als in 2010 alle voorgenomen stofbestrijdingsmaatregelen zijn uitgevoerd zullen vermoedelijk nog steeds 36 tot 40 maal per jaar daggemiddelde concentraties boven de 50 µg/m3
voorkomen. De dagelijkse EU normen voor 2005 en voor 2010 lijken voor Nederland dan ook niet haalbaar en gezondheidseffecten zullen blijven bestaan.
Contents
Abstract 0 - 2
Samenvatting (in Dutch) 0 - 4
Contents 0 - 6
Summarised conclusions 0 - 12
Samenvattende conclusies (in Dutch) 0 - 16
1. Introduction 1 - 1
2. Physico-chemical characteristics of ambient PM 2 - 1
2.1.General information 2 - 1
2.1.1. Size, composition and sources 2 - 1
2.1.2. PM in the Netherlands 2 - 2
2.1.3. Introduction to the chapter Physico-chemical
Characterisation 2 - 4
2.2. Mass measurement of PM 2 - 4
2.2.1. General methods 2 - 4
2.2.1.1. Uncertainties in PM measurements 2 - 5
2.2.2. Continuous monitors 2 - 7
2.2.3. Black Smoke and carbonaceous PM 2 - 7 2.2.4. Other methodologies for PM analysis 2 - 8
2.3. Ambient levels of PM 2 - 9
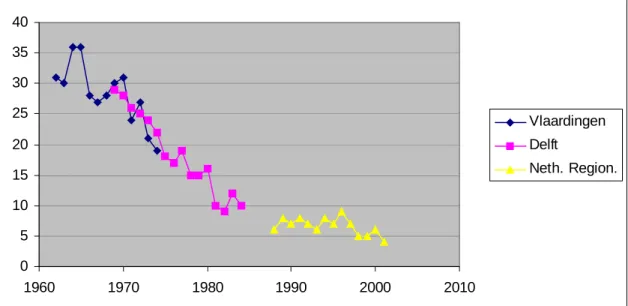
2.3.1. Annual average of PM 2 - 10
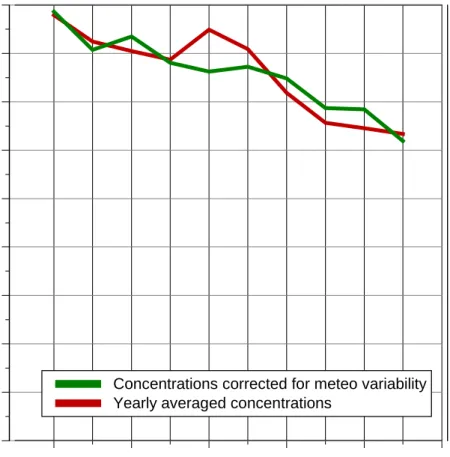
2.3.1.1. Historical trends 2 - 13 2.3.1.2. Current trends corrected for meteo 2 - 14 2.3.2. Smaller scale temporal variations in PM 2 - 18 2.3.2.1. Hourly variations 2 - 18 a. Wind direction and PM10 2 - 18
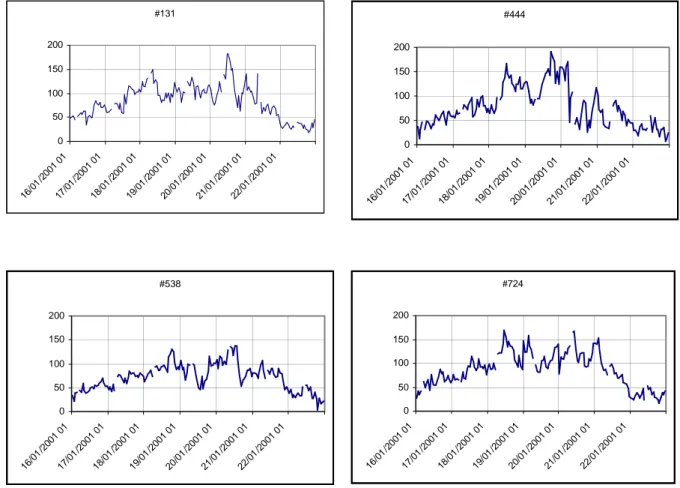
2.3.2.2. Daily variations 2 - 20
a. Description of PM ‘episodes’ 2 - 21 b. Frequency distribution of daily av. 2 - 23 2.3.2.3. Weekly variations 2 - 27 2.3.2.4. Monthly variations 2 - 28 2.3.2.5. Seasonal variations 2 - 30 2.4. Natural sources and global background 2 - 32 2.4.1. Northern hemisphere background 2 - 32 2.4.2. Wind-blown crustal material 2 - 33
2.4.3. Sea salt 2 - 34 2.5. Modelling 2 - 34 2.5.1. Primary emissions of PM 2 - 34 2.5.1.1. The Netherlands 2 - 34 a. Dutch PM inventory 2 - 35 b. Primary PM10 emissions 2 - 37 c. Primary PM2.5 emissions 2 - 43 d. Uncertainty 2 - 44 2.5.1.2. Europe 2 - 46
2.5.2. Emissions of precursor gases of SIA 2 - 46 2.5.3. Dispersion modelling of PM 2 - 46
2.5.3.1. Modelling of annual averages 2 - 46 a. Modelling results for PM10 2 - 49 b. Modelling results for PM2.5 2 - 52
c. Uncertainties 2 - 55
2.5.3.2. Modelling of daily concentrations 2 - 56
a. EUROS 2 - 56
b. LOTOS 2 - 58
c. Modelling results of SIA 2 - 62 d. Scenario study for 2010 2 - 63 2.6. Agreement of models and measurements 2 - 66 2.6.1. Non-modelled part of PM 2 - 66 2.6.1.1. Uniform correction factors 2 - 67 a. Regional ammonium nitrate 2 - 68 2.6.1.2. Site specific correction factors 2 - 71 2.6.1.3. Handling the non-modelled fraction 2 - 71
a. Introduction 2 - 71
b. PM10 2 - 72
b. PM2.5 2 - 74
2.6.2. Validation of short-term models 2 - 76 2.6.2.1. Measurements of SIA 2 - 76
2.6.2.2. Modelling of SIA 2 - 81
2.6.3. Validation of long-term models 2 - 84 2.6.3.1. Urban contribution of traffic 2 - 84
a. Introduction 2 - 84
b. Modelled traffic contribution 2 - 84 c. Measured traffic contribution 2 - 86 2.6.3.2. Contribution of a regional highway 2 - 87 2.6.3.3. Modelled and measured SIA 2 - 89 2.7. Relevance of a stationary background monitor 2 - 91
3. Epidemiology of PM 3 - 1
3.1. Nature of PM-associated health effects 3 - 1
3.1.1. Mortality studies 3 - 1
3.1.1.1. Acute exposure to PM 3 - 1 3.1.1.2. Chronic exposure to PM 3 - 3 a. Transferability to the Netherlands 3 - 6
3.1.2. Morbidity studies 3 - 8
3.1.2.1. Hospital admissions and ER visits 3 - 8 3.1.2.2. Cardiovascular hospital admissions 3 - 9 3.1.2.3. Individual cardiovascular outcomes 3 - 9 3.1.2.4. Lung function and respiratory sympt 3 - 9 3.1.2.5. Long-term exposure 3 - 11 3.1.3. Conclusions on morbidity and mortality 3 - 11 3.2. Form of concentration-response curve and threshold 3 - 11
3.3. Specific populations at risk 3 - 12
3.3.1. The elderly 3 - 12
3.3.2. Pre-existing diseases 3 - 12
3.3.3. Children 3 - 13
3.3.4. Conclusion 3 - 13
3.4. Recent Dutch results with acute exposure 3 - 13 3.4.1. Update of mortality time-series 3 - 13
3.4.1.3. Results time-series update mortality 3 - 16 3.4.1.4. Discussion and conclusion 3 - 17 3.1.4.5. Conclusions on the mortality update 3 - 23 3.4.2. Update of hospital admissions time-series 3 - 23
3.4.2.1. Study design 3 - 23
3.4.2.2. Results 3 - 24
3.4.2.3. conclusions on hospital admissions 3 - 27 3.4.3. Assessing heterogeneity in study results 3 - 27 3.5. Quantification of estimated health risks 3 - 28
3.5.1. Health risks for PM 3 - 28
3.5.2. Health risks for other pollutants 3 - 30 3.6. Relevance for PM as a proxy or a causal factor 3 - 37
4. Dosimetry and Toxicology of PM 4 - 1
4.1. Introduction 4 - 1
4.2. Dosimetry of PM 4 - 3
4.3. Toxicological evidence for causality 4 - 8 4.3.1. Ambient particles and disease models 4 - 8 4.3.2. Health effects of PM model compounds 4 - 18
4.3.2.1. Physical characteristics 4 - 19 a. PM charge or radiation 4 - 19 b. PM diameters 4 - 20 c. PM surface area 4 - 21 4.3.2.2. Biological characteristics 4 - 22 4.3.2.3. Chemical characteristics of PM 4 - 23 a. Secondary Inorganic Aerosol, SIA 4 - 23
b. Crustal material 4 - 30
c. Sea salt 4 - 30
d. Organics 4 - 31
e. Transition metals and fly ash 4 - 31 4.3.2.4. PM in combination with gases 4 - 33 4.4. Hypotheses on mechanisms of PM 4 - 34 4.4.1. Respiratory tract path way 4 - 34
4.4.2. Cardiovascular pathway 4 - 35
4.4.3. Mechanisms 4 - 35
4.4.3.1. Neurogenic inflammation 4 - 37
4.4.3.2. Oxidative stress 4 - 37
a. Reactive oxygen species (ROS) 4 - 38 b. Antioxidant mechanisms 4 - 39 c. Signal transduction 4 - 41
4.4.4. Susceptibility 4 - 42
4.4.5. Summary on mechanisms 4 - 42
4.5. Summary and conclusions 4 - 43
5. Standards for PM 5 - 1
5.1. Previous standards for PM 5 - 1
5.2. Particle sizes for a PM standard 5 - 1 5.3. Averaging period for a PM standard 5 - 4
5.4. Quantification of a standard 5 - 8
6. Reduction of PM levels 6 - 1
6.1. Reduction of PM and risk reduction 6 - 1 6.2. PM emission trends – Current legislation scenario 6 - 3
6.2.1. In the Netherlands 6 - 3
6.2.1.1. National scale 6 - 5
a. PM10 6 - 5
b. PM2.5 6 - 7
6.2.1.2. Urban Scale 6 - 8
6.2.2. Other European countries 6 - 10 6.2.3. Precursor emission trends 6 - 11 6.3. PM emission abatement scenarios 6 - 11 6.3.1. PM10–maximal technically feasible reduction 6 - 12 6.3.2. PM10–‘2010quart red’ emission reduction 6 - 12 6.3.3. PM10– transport abatement scenarios 6 - 14 6.4. PM10 abatement options in detail 6 - 16
6.4.1. Industry 6 - 16
6.4.2. Transport 6 - 18
6.4.3. Agriculture 6 - 19
6.4.4. Consumers 6 - 20
6.4.5. Construction 6 - 20
6.4.6. Storage and handling companies 6 – 20 6.5. PM10 and PM2.5 – cost curves for industrial sources 6 - 21
6.5.1. Comparison of cost curves 6 - 21 6.5.2. PM10 or PM2.5 as a basis for reduction 6 - 22
6.6. Modelling future levels of PM 6 - 23
6.6.1. Introduction 6 - 23
6.6.2. Results of current policies in 2010 6 - 24 6.6.3. Modelled concentrations 1995 and 2010-CLE 6 - 27 6.6.4. Effects of additional policy measures 6 - 29 6.6.5. Spatial effects of additional policy measures 6 - 30
6.7. Summary and conclusion s 6 - 32
7. Conclusions 7 - 1
7.1. Summarised conclusions 7 - 1
7.2. Current answers to the questions 7 - 4 Annex A. Main results of update time-series study on mortality A - 1
A.1. Monitoring points A - 1
A.2. Air pollution concentrations A - 2
A.3. Association between air pollution and total mortality A - 6 A.4. Season specific analysis of total mortality A - 7 A.5. Analysis of total mortality in two-pollutant models A - 8 A.6. Association between air pollution and respir. mortality A - 10 A.7. Season specific analysis of respiratory mortality A - 11 A.8. Analysis of respir. mortality in two-pollutant models A - 12 A.9. Association between air pollution & COPD mortality A - 14 A.10. Season specific analysis of COPD mortality A - 15 A.11. Analysis of COPD mortality in two-pollutant models A - 16 A.12. Association with pneumonia mortality A - 18 A.13. Season specific analysis of pneumonia mortality A - 19 A.14. Analysis of pneumonia mortality in two-poll. models A - 20 A.15. Association with cardiovascular mortality A - 22 A.16. Season specific analysis of cardiovascular mortality A - 23 A.17. Analysis of cardiovascular mort. in two-poll. models A – 24
Introduction B - 3
Physicochemical properties of SIA B - 3
Ambient concentrations of SIA B - 7
Toxicology of Particulate Sulfur Oxides B - 9
Sulfuric acid B - 9
Sulfate Salts B - 14
Sulfate coated particles B - 17
Toxicology of Particulate Nitrogen Oxides B - 18
Toxicology of Sea salt Particulates B - 21
Considerations in the use of tox data for risk assessment B - 22
Chemical basis for toxicity B – 23
Interspecies extrapolation B - 24
Concentration, duration response relationships B - 25
Conclusions B - 27
References B - 31
Annex C. Nuclear factor-kappa B C - 1
Annex D. Further PM reductions in transport D - 1
D.1. Introduction D - 1
D.2. Inland shipping D - 1
D.3. LDV and diesel-engined passenger cars D - 1
D.4. Mobile machines D - 2
D.5. Wear of tyres, bake linings and road surfaces D - 2
D.6. Other source categories D - 2
D.6.1. Gaseous fuels for HDV D - 2
D.6.2. Retrofit of particulate traps for HDV D - 3 D 6.3. Emulsified diesel fuel for road vehicles D - 3 D.6.4. Further reduction of sulphur to 10 ppm D - 3 D.6.5. Lowering sulphur content of residual oil D - 3 D.6.6. Particulate traps on European ships D - 3 D.6.7. Fuel cells in passenger cars D - 4
D.6.8. Electric cars D - 4
D.7. Summary of results and conclusions D - 5
D.7.1. Realistic penetration D - 5
D.7.2. Full penetration in 2010 D - 5
D.7.3. Conclusions D - 6
D.8. Emission of Ultrafines (UF) D - 7
D.8.1. Size distribution of PM by traffic D - 7 D.8.2. Particle numbers per vehicle kilometre D - 7 References and Acronyms
References
Section 1 Ref - 1
Section 2 Ref - 1
Section 3 and Annex A Ref - 7
Section 4 and Annex B and C Ref - 17
Section 5 Ref - 38
Section 6 and Annex D Ref - 39
Section 7 Ref - 42
Summarised Conclusions
Assessment of PM health risks
Epidemiological studies present worldwide evidence for particulate matter (PM) associated serious health effects in the general population, which may lead to hospital admissions and premature mortality. Dutch observations are in line with the
international scientific literature. In spite of the ongoing scientific debate and prevailing uncertainties concerning the quantification of acute and chronic health effects, the overall conclusion is that PM-associated health effects are so extensive and serious that further action is warranted.
Epidemiological studies could not identify a threshold for exposure levels related to PM health effects. This precludes regular standard setting, with a No Observed Adverse Effect Level (NOAEL) and safety factors. It implies that for any PM standard a certain level of impact on health will have to be accepted.
Because there is no threshold, adverse health effects are less effectively avoided by reducing episodic high concentrations than by reducing annual average concentrations (which will reduce the magnitude of occasional peak concentrations as well).
Overall, health effects are consistently associated with PM10 and PM2.5. (These terms refer to ambient particles with diameters of up to approximately 10 and 2.5
micrometre). These associations are found in spite of the local differences in air quality, sources and the proportion of the susceptible sub-population. However, there seems to be heterogeneity between locations within the various epidemiological time-series studies for PM-associated health effects. This heterogeneity is manifested in differences in the size of the effects and may probably be influenced by local ambient and population-related circumstances. As for the future, a gradually ageing population and an increasing proportion of asthmatics or people with circulatory problems will proportionally enlarge the potentially susceptible sub-population.
Choice of PM indicators
Support is emerging for supplementing the current PM standard with other (smaller sized or source-related) indicators than PM10. There is currently a lack of reliable information on ambient levels of these smaller sized or source-related fractions which is representative of the situation in the Netherlands. At the moment the available toxicological and epidemiological evidence is insufficient for regulating ultrafine (UF) particulate concentrations, though this is another field that needs more research as the potential health implications of UF may be considerable. It is recommended that PM10 be retained as a standard for the time being as it covers the effects of both fine and coarse particles. In view of the emerging evidence implicating fine particles in health effects, it is recommended that a standard for fine PM or a source-related fraction be developed as well.
Monitoring of PM
The levels of PM10 measured by a stationary site monitor seem to be representative of the personal exposure of the general public to ambient PM10. Accurate measurement of PM is complicated. In the Netherlands a substantial fraction of the PM is
ammonium nitrate, a salt that is in dynamic equilibrium with the gas phase of ammonium and nitrate. While PM is measured, the sample is heated to minimise interference from water. However, this volatises some of the PM, especially ammonium nitrate. The automatic PM10 monitoring network in the Netherlands therefore corrects for losses of semi-volatile material by using a factor of 1.3, as an
approximation. The accuracy of PM measurements needs to be increased, as semi-volatile ammonium nitrate is a principal component of PM in the Netherlands. More information on the specific chemical composition and size distribution of PM representative for typical situations in the Netherlands is needed to test relevant hypotheses concerning health effects, source contributions and possible atmospheric influences.
Risk reduction with current PM emission control
Current policies will reduce emissions of PM10 by about 20% from 1998 to 2010. The fraction of PM10 that is combustion-related and suspected of being health-relevant will show an even larger reduction of 40%, based on projections of energy use,
transportation developments and performance of new technology in real-world conditions. Dutch emissions of PM2.5 will decrease by about 30%. Traffic is an important source of carbonaceous PM (which can be broken down into Elemental Carbon (EC) and Organic Carbon (OC), the mixture of which comprises diesel soot) and ultrafines, which are emitted at breathing height, close to a large part of the population in the Netherlands.
Whether a reduction in PM levels leads to a proportional reduction in health effects is still uncertain. PM is a complex mixture with fractions that are to a greater or lesser extent health-relevant. Changes in the composition of this mixture might change the health impact. So, the most cost-effective policy will be to reduce that part of PM that causes the health problems. Unfortunately, there are currently only suggestions for the causal fractions as they have not yet been identified.
These health-relevant fractions are probably transport-related (diesel soot) and, more generally, combustion-related primary PM emissions. Certain fractions of ambient PM probably do not cause significant health effects. These include particle-bound water and probably sea salt particles. A number of epidemiological studies suggest that the crustal fraction is less health-relevant than combustion-related fractions. Toxicological studies with pure ammonium sulphate and nitrate (Secondary Inorganic Aerosol (SIA)) have not established overt toxicity of these components, even at concentrations considerably above ambient levels. In contrast, epidemiological studies continue to find strong associations between adverse health effects and secondary aerosol components such as sulphates and nitrates. This divergence of results has not yet been resolved.
The daily PM standard revisited
In 1999, the European Union promulgated PM standards for 2005 and 2010. The values for 2010 are indicative. This means that the values for 2010 become definitive after the evaluation in 2003. In this evaluation the experience of Member States in meeting the standards for 2005 will be taken into account, as well as the most recent scientific insights. The current EU PM standards can be found in the following table:
EU standards for PM10. Phase1 1 January 2005 Phase2* 1 January 2010 Annual average 40 µg/m3 20 µg/m3
Daily average (24-hour) 50 µg/m3
50 µg/m3
Number of exceedances per year 35 7
*indicative value
The EU's original position paper envisaged promulgating two equivalent PM standards. However, the current EU annual average standard (40 µg/m3
) and daily standard (50 µg/m3, 35 exceedances) for 2005 are not equivalent in the Netherlands. With 80 permitted exceedances per year, a daily average of 50 µg/m3 would be equivalent to an annual average of 40 µg/m3
, and a daily standard of 100 µg/m3 PM10 with 7 exceedances. For practical reasons a standard with a value of 100 µg/m3and 7 exceedances is preferred to a value of 50 µg/m3
that may be exceeded on 80 days. In general, the public is able to comprehend a standard with a small number of
exceedances better. Although the EU has proposed two standards for PM, there are several arguments that only one standard would suffice – annual mean concentrations being the best choice. However, for reasons of communication to the public, daily standards may be appropriate. Whether or not two averaging times are needed for an EU PM standard is a policy decision.
Dutch compliance with air quality standards with current control policy
Annually averaged values in the Netherlands obtained through modelling are consistent with measurements of PM10 here. Compliance with the annual average value of 40 µg/m3 seems feasible for PM10 in the Netherlands, although local
exceedances at ‘hot spots’ cannot be ruled out. However, compliance with the daily average value of 50 µg/m3 with 35 permitted exceedances is probably not feasible in 2005. Because of the relatively large contribution of foreign PM in a small country like the Netherlands, combined with our substantial natural background levels caused by sea salt, crustal and other natural material, a daily level of 50 µg/m3
will easily be exceeded. Expectations are that there will still be 36–40 exceedances per year of the EU daily standard of 50 µg/m3
even after all planned abatement measures (Current Legislation of Emissions (CLE)) have been taken in 2010. Compliance with the indicative annual average value of 20 µg/m3
for PM10 and with the indicative daily average value of 50 µg/m3 with 7 permitted exceedances in 2010 is not possible in the Netherlands. If abatement measures are implemented in neighbouring countries (as one might expect they will), the number of exceedances will decrease.
The prospect of additional PM abatement
The ultimate potential for reducing primary PM10 emissions (on top of currently agreed measures, CLE) could be 60% in the Netherlands. This abatement package is called 'MFRult': ultimate Maximum Feasible Reduction. The cost of achieving the 'MFRult' is about 6000 million euro per year. The 'MFRult' reduction of 60% in primary PM10 emissions in the Netherlands will result in a 1.1 µg/m
3
lower PM10 concentration averaged over the country. An emission reduction up to a cost-efficiency of 55
euro/kg PM10 will lead to a reduction by a quarter (abatement package: '2010quart red'). This can be achieved at a cost of 210 million euro per year and will result on average in a 0.3 µg/m3
lower PM10 concentration. From the absolute value of the PM10 levels one can conclude that, averaged on a national level, these reductions seem fairly
small. Locally, however, higher reductions in PM10 levels of 1 to 5.5 µg/m 3
are modelled in the '2010quart red' abatement package. The maximum reductions will be achieved in Rotterdam, which is densely populated. It is interesting to note that the measures directed at transport in the '2010quart red' abatement package focus on the shipping sector only. When concentrating on probably more health-relevant fractions of PM, like traffic-related diesel soot, modelled reductions are relatively higher even. The presented abatement packages ('2010quart red' and 'MFRult') correspond to a decrease of 20% and 50% respectively in average traffic-related diesel soot concentration levels of Dutch origin. These effects would increase even further if similar reduction technologies were to be applied to traffic in foreign countries also.
Supplementary PM abatement can be based on the precautionary principle. Further source-oriented actions could focus on the more cost-effective reduction of the total PM10 aerosol mass, or could first of all focus on those PM fractions that are expected to be more health-relevant. This last option is preferred. These fractions are probably transport-related (diesel soot) and, more generally, combustion-related primary PM emissions. In this respect, the abatement of uncontrolled shipping emissions has been identified as one of the more cost-effective control options. The abatement of other combustion-related sources such as industrial combustion, wood burning in fireplaces, and off-road machinery is also possible, but is less cost-effective. Additionally,
climate change mitigation strategies may reduce combustion-related PM emissions.
Residual risk with improved PM air quality
A substantial part of the PM10 levels in the Netherlands cannot be influenced by policy measures, as natural sources are responsible for their ambient concentrations. Because future abatement measures will further reduce the anthropogenic fraction, the
contribution of the natural fraction will increase proportionally. More insight into the chemical composition (specific tracers) and contribution of different sources to the currently ‘non-modelled’ and generally natural part of PM10 is necessary to find out how much of the current PM levels may eventually be influenced by abatement measures.
PM air quality will improve in the future. Despite the air quality, it could be
conjectured that the health impact associated with PM will nevertheless become more pronounced. In the Netherlands the gradual ageing of the population and other
demographic developments could lead to a more than proportionate rise in the susceptible sub-groups. However speculative the previous remark, continuing vigilance seems required for this only partially understood problem of PM.
Samenvattende conclusies
Beoordeling van gezondheidsrisico’s van fijn stof
Epidemiologische studies uit de hele wereld wijzen op een verband tussen fijn stof (Eng.: Particulate Matter of PM) en ernstige gezondheidsklachten, die tot
ziekenhuisopname en vroegtijdige sterfte kunnen leiden. Dat beeld wordt bevestigd door Nederlands onderzoek. Over ernst en omvang van de acute en chronische gezondheidseffecten woedt nog een wetenschappelijk debat. Er zijn nog veel
onzekerheden. Vast staat echter dat de gezondheidseffecten door fijn stof zo ernstig en omvangrijk zijn dat nadere actie geboden is. In epidemiologische studies is geen drempelwaarde aangetoond waaronder géén gezondheidseffecten meer met fijn stof in verband gebracht kunnen worden. Er is dan ook geen klassieke grenswaarde of
normstelling met een zogenoemde “No Observed Adverse Effect Level (NOAEL)” voor fijn stof. Welke normstelling men ook kiest, de bijbehorende
gezondheidseffecten in de bevolking zullen nooit helemaal uit te sluiten zijn.
Omdat er voor gezondheidsklachten door fijn stof, geen drempelwaarde bestaat, zijn dergelijke gezondheidseffecten doeltreffender te verminderen door de jaargemiddelde concentraties fijn stof te verlagen dan door incidentele piekconcentraties te bestrijden. Bovendien zal het verlagen van de jaargemiddelde concentraties fijn stof ook tot vermindering van de incidentele piekbelastingen leiden.
Wereldwijd kunnen de gezondheidseffecten van fijn stof worden gekoppeld aan PM10 en PM2.5. (Dat zijn stofdeeltjes met een diameter tot ongeveer 10 respectievelijk 2,5 micrometer). Dit verband wordt steeds opnieuw gevonden ondanks lokale verschillen in luchtkwaliteit, wisselende bronnen en een wisselend aandeel van gevoelige groepen in de bevolking. Toch komen er in de diverse epidemiologische studies ook
verschillen tussen lokaties aan het licht. De omvang van de gezondheidseffecten is vermoedelijk afhankelijk van lokale omgevingsfactoren of
bevolkingsomstandigheden. In de toekomst zal een groter deel van de bevolking extra gevoelig zijn voor fijn stof. Dat komt door de toenemende vergrijzing en door het stijgende aantal astmatici en mensen met hart- en vaatstoornissen.
Keuze van indicatoren voor PM
Naast de huidige Europese PM10 normstelling voor fijn stof groeit de behoefte aan normstellingen, gericht op fijnere deeltjes of fracties afkomstig uit specifieke bronnen. Over de Nederlandse situatie ontbreekt echter voldoende betrouwbare informatie. Aanbevolen wordt om voorlopig PM10 als normstelling voor grove èn fijnere stofdeeltjes te handhaven. Daarnaast zou er voor fijnere stofdeeltjes een aparte
normstelling of een meer brongerichte normstelling ontwikkeld moeten worden omdat er steeds meer aanwijzingen komen dat kleinere stofdeeltjes de gezondheid kunnen schaden.
De huidige toxicologische en epidemiologische informatie is onvoldoende om regelgeving op te stellen voor de ultrafijne (UF) deeltjes, die kleiner zijn dan 0,1 micrometer. Een flink deel van die ultrafijne deeltjes is afkomstig van het verkeer. Op dit gebied is meer onderzoek nodig, want de gezondheidsschade door ultrafijne deeltjes zou aanzienlijk kunnen zijn.
Meten van PM
De PM10 niveaus in de buitenlucht die op een vast meetpunt worden gemeten, blijken in de praktijk ook representatief te zijn voor de persoonlijke blootstelling van het algemene publiek aan PM10. Het nauwkeurig meten van fijn stof is echter lastig. In Nederland bestaat een flink deel van het fijn stof uit ammoniumnitraat, een zout dat in
een dynamisch evenwicht verkeert met de gasfase van zowel nitraat als ammonium. Tijdens de metingen van het fijn stof in de stofmonitor worden de luchtmonsters verwarmd om storing door water te minimaliseren. Daarbij vervluchtigt echter een deel van het monster, vooral ammoniumnitraat.Het huidige automatische meetnet in Nederland hanteert daarom een factor van 1,3 om te corrigeren voor de verliezen van het semi-vluchtige deel van het fijn stof. Het is wenselijk dat de precisie van deze PM metingen vergroot wordt.
Ook is meer informatie nodig over de specifieke chemische samenstelling en
deeltjesgrootteverdeling voor representatieve situaties in Nederland. Daarmee kunnen hypotheses over gezondheidseffecten, bronbijdragen en mogelijke atmosferische invloeden worden getoetst.
Risicoreductie en de bestrijding van emissies
Door het al vastgelegde fijn stof beleid gaan de emissies van PM10 tussen 1998 en 2010 in Nederland met zo’n 20 procent omlaag. De fijn stof fractie die verbranding gerelateerd is zal zelfs met 40 procent afnemen, en de PM2.5 emissies met 30 procent. Verkeer is een belangrijke bron van ultrafijne deeltjes en koolstofhoudend fijn stof. Dieselroet is een mengsel van elementaire en organische koolstof. Verkeersemissies komen op leefniveau in woonwijken terecht en dicht bij belangrijke
bevolkingsconcentraties.
Of een vermindering van fijn stof concentraties ook tot een evenredige vermindering van de gezondheidseffecten zal leiden is nog onzeker. Fijn stof is immers een
complex mengsel, waarin sommige fracties meer gezondheidsrelevant zijn dan andere. Veranderingen in de samenstelling van dit mengsel kunnen van invloed zijn op de omvang en aard van de gezondheidseffecten. De meest kosten-effectieve maatregelen richten zich met name op de meest toxische fracties in het fijn stof. Helaas weten we momenteel nog niet met voldoende zekerheid welke fracties dat zijn. Waarschijnlijk behoren tot de voor de gezondheid relevante fracties het dieselroet uit de vervoerssector en fijn stof afkomstig van overige verbrandingsprocessen.
Bepaalde fracties fijn stof in de buitenlucht, zoals zeezoutdeeltjes of het water in de stofdeeltjes, veroorzaken waarschijnlijk geen gezondheidseffecten. Een aantal epidemiologische studies doet vermoeden dat bodemstofdeeltjes minder relevant zijn voor de gezondheid dan stofdeeltjes afkomstig van verbrandingsprocessen.
Toxicologische studies met zuiver ammoniumsulfaat en -nitraat (secundaire anorganisch aërosol) wijzen niet op een hoge toxische potentie van deze beide componenten, zelfs niet bij aanmerkelijk hogere concentraties dan in de buitenlucht. Wèl wordt in epidemiologische studies keer op keer een samenhang gevonden tussen gezondheidsklachten en aanwezigheid van sulfaat en nitraat als bestanddelen van secundaire anorganisch aërosol. Deze tegenstrijdigheid valt nog niet te verklaren.
Europese normstelling opnieuw bekeken
In 1999 heeft de Europese Unie de fijn stof normstelling voor 2005 en 2010
vastgesteld. De normstelling voor 2010 betreft een zogenoemde indicatieve waarde. Dat wil zeggen dat deze normen pas definitief worden vastgesteld na een evaluatie in 2003 van de ervaringen die in de diverse lidstaten zijn opgedaan met de normstelling van 2005. Bovendien zal rekening worden gehouden met de nieuwste
EU normen voor fijn stof (PM10) Fase 1 1 Januari 2005 Fase2* 1 Januari 2010 Jaargemiddelde 40 µg/m3 20 µg/m3 Daggemiddelde (24-uur) 50 µg/m3 50 µg/m3 Aantal overschrijdingen per jaar 35 7 *indicatieve waarde
In het document dat oorspronkelijk ten grondslag lag aan de EU normstelling werd aangekondigd dat beide EU fijn stof normen (daggemiddeld en jaargemiddeld) gelijkwaardig ofwel equivalent zouden zijn. In de praktijk blijkt echter dat in Nederland de huidige EU jaargemiddelde PM10 norm voor 2005 van 40 µg/m 3
niet equivalent is aan de daggemiddelde norm van 50 µg/m3
met 35 toegestane
overschrijdingen per jaar. Pas met 80 toegestane overschrijdingen per jaar zou een daggemiddelde norm van 50 µg/m3
equivalent zijn aan de jaargemiddelde norm van 40 µg/m3. Datzelfde geldt voor een daggemiddelde norm van 100 µg/m3 met 7 overschrijdingen.
Om praktische redenen wordt de voorkeur gegeven aan een daggemiddelde norm van 100 µg/m3
met 7 overschrijdingen boven een daggemiddelde norm van 50 µg/m3 met 80 overschrijdingen. In het algemeen zal ook het publiek een hogere norm met een geringer aantal overschrijdingen beter kunnen begrijpen.
Hoewel de EU twee normen heeft voorgesteld, is er een aantal argumenten waarom voor fijn stof één norm toch voldoende is. De jaargemiddelde norm is dan de beste keuze. Om redenen van risicocommunicatie kan een daggemiddelde norm toch nuttig zijn. Aan beleidsmakers de keuze of er twee EU normen nodig zijn voor fijn stof.
Voldoet Nederland aan de luchtkwaliteitsnormen bij het huidige beleid?
De jaargemiddelde fijn stof concentraties die we in Nederland modelleren zijn consistent met onze metingen. We verwachten dat het voldoen aan een
jaargemiddelde PM10 norm van 40 µg/m 3
in Nederland in 2005 wel haalbaar zal zijn, hoewel plaatselijke overschrijdingen op een aantal met name verkeersbelaste ‘hot spots’ niet uit te sluiten zijn. Daarentegen is het niet waarschijnlijk dat we in 2005 overal de daggemiddelde norm van 50 µg/m3
met 35 toegestane overschrijdingen halen. Vooral in zo’n klein land als Nederland met een relatief grote buitenlandse bijdrage en een relatief hoge achtergrondsbelasting door zeezout wordt een daggemiddeld niveau van 50 µg/m3 gemakkelijk overschreden.
De verwachting is dat zelfs als alle overeengekomen bestrijdingsmaatregelen in 2010 zullen zijn uitgevoerd volgens het ‘current legislation scenario’ (CLE) er in
Nederland toch nog 36 tot 40 overschrijdingen van de EU daggemiddelde norm van 50 µg/m3 zullen zijn. De indicatieve EU normen voor 2010 van 20 µg/m3 als
jaargemiddelde en een daggemiddelde norm van 50 µg/m3
met 7 overschrijdingen zijn dan ook voor Nederland geen van beide haalbaar.
Perspectief voor een verdere vermindering van fijn stof
Uiteindelijk is het technisch mogelijk om de Nederlandse PM emissies met nog eens 60 procent extra te verminderen (bovenop de al voorgenomen maatregelen volgens het current legislation scenario). Dit maatregelenpakket wordt “MFRult” genoemd: de ultieme Maximaal bereikbare Reductie. Dit maatregelenpakket kost jaarlijks ongeveer 6 miljard Euro. Gemiddeld over Nederland zal een extra reductie van de fijn stof
emissies met 60 procent leiden tot een 1.1 µg/m3
lagere jaargemiddelde concentratie aan PM10.
Daarnaast is nog een ander maatregelenpakket doorgerekend, dat aanmerkelijk goedkoper uitpakt. Hierbij wordt de emissiereductie beperkt tot maatregelen met een marginale kosten-efficiëntie van 55 Euro per bespaarde kg PM10. Dit
maatregelenpakket, waarbij de Nederlandse emissies met ongeveer 25 procent ofwel een kwart afnemen, wordt “2010quartred” genoemd. Het pakket kost jaarlijks 210 miljoen Euro. Gemiddeld over Nederland zal een reductie van de fijn stof emissies met 25 procent leiden tot een 0.3 µg/m3
lager jaargemiddelde concentratie aan PM10. Dat lijkt maar een kleine vermindering van de huidige concentraties fijn stof in Nederland. Plaatselijk worden echter forsere reducties verwacht. Zo leidt het pakket “2010quart red” plaatselijk tot verminderingen van 1 tot 5.5 µg/m3. De maximale reducties kan men bij dit pakket verwachten in het dichtbevolkte Rotterdam.
Interessant is ook dat de op het verkeer gerichte maatregelen in het pakket “2010quart red” alleen betrekking hebben op de scheepvaart. Als we ons concentreren op de waarschijnlijk meer verkeersgerelateerde fracties van fijn stof, zoals dieselroet, dan zijn de gemodelleerde verminderingen zelfs relatief belangrijker. De al genoemde pakketten “2010quart red” en “MFRult” leiden tot een afname van het Nederlandse dieselroet afkomstig van de transportsector van respectievelijk 20 procent en 50 procent. Als ook in het buitenland vergelijkbare maatregelen worden getroffen, wordt de aanpak nog effectiever.
Aanvullende fijn stof bestrijding kan gebaseerd worden op het ‘voorzorgbeginsel’. Bij verdere brongerichte acties kan men zich richten op het zo kosten-efficiënt mogelijk terugdringen van ofwel de totale PM10 massa ofwel op de waarschijnlijk meer gezondheidsrelevante fractie daarvan. Aan de laatste optie wordt de voorkeur gegeven. Deze fracties zijn waarschijnlijk verkeersgerelateerd dieselroet of meer in het algemeen verbrandinggerelateerde PM emissies. Daarom is het bestrijden van de nu nog vrijwel onbestreden scheepvaart emissies een bij uitstek kosten-effectieve optie. Het bestrijden van andere verbrandinggerelateerde bronnen zoals industriële verbranding, stoken van openhaarden en mobiele werktuigen is ook mogelijk, maar minder kosten-effectief. Ook aanvullende maatregelen in het kader van het
klimaatbeleid kunnen de verbrandinggerelateerde fijn stof emissies helpen terugdringen.
Welke risico’s blijven nog over bij een verbeterde luchtkwaliteit?
Een aanzienlijk deel van de PM10 niveaus in Nederland is niet door
beleidsmaatregelen te beïnvloeden, aangezien het afkomstig is van natuurlijke bronnen. Naarmate de door mensen veroorzaakte emissies verder worden teruggedrongen, stijgt het aandeel van de natuurlijke bronnen. Er is meer inzicht nodig in de chemische samenstelling en in de bijdragen van de diverse bronnen aan de merendeels natuurlijke en tot nog toe meestal niet gemodelleerde fijn stof fracties in de lucht. Daaruit valt af te leiden in hoeverre het fijn stof probleem uiteindelijk door milieumaatregelen kan worden aangepakt.
Ook al wordt het fijn stof probleem aangepakt, de bijbehorende gezondheidsklachten zullen niet van de agenda verdwijnen, integendeel. In Nederland worden mensen steeds ouder en wellicht leiden ook andere demografische ontwikkelingen tot een meer dan evenredige toename van extra gevoelige bevolkingsgroepen. Hoe dat uitpakt is de vraag, maar bij een nog zo slecht begrepen fenomeen als fijn stof blijft
1. Introduction
In 1998, a proposal was made for a daughter directive for inter alia PM10 based on the
European Union (EU) Framework Directive on Ambient Air Quality, c.f. Table 1. Table 1 EU standards for PM10.
Phase 1 1 January 2005
Phase 2* 1 January 2010
Annual average 40 µg/m3 20 µg/m3
Daily average (24-hour) 50 µg/m3 50 µg/m3
Number of exceedances per year 35 7
*indicative value
This PM10 standard is to be evaluated in 2003 and brought into line with new
scientific developments in knowledge about the effects of PM10 on health and the
environment. In addition, the practical experience of Member States in applying the standards, as well as the feasibility of meeting the standards, are to be considered. The association of ambient PM with serious health effects caused the World Health Organisation (WHO) to provide guidelines for PM (WHO, 2000). Because of the health risks, the European Union (EU) provided standards for PM in a daughter directive (1999/30/EC) of the EU Air Quality Framework Directive (96/62/EC). The values and averaging times are presented in Table 1.
For the Dutch government these air quality standards gave rise to five questions concerning PM, to which it would like an answer before evaluation of the EU daughter directive on PM in 2003.
• How do the various indicators of PM compare as relevant for the causation of health effects?
• What is the relationship between concentrations of ambient PM and health effects in order to make a substantiated choice of PM standard?
• What are the actual PM concentrations in the Netherlands and how big are the contributions of the different source categories to these concentrations?
• Which indicator of PM is preferable if, besides health relevance, risk management considerations are also taken into account?
• What is the quantification of the total source-risk chain now and in the foreseeable future?
These five questions will be answered in subsection 7.2 of this report, to the extent our current knowledge permits.
The EU daughter directive on PM naturally forms the basis of this project. To answer the five questions put by the Ministry, we need to establish which information was available when the daughter directive was drawn up and how this information may have changed over the last five years. The then available scientific information was
1997. (http://europa.eu.int/comm/environment/air/pp_pm.pdf) The original scientific information covered the pollutant description, risk assessment, measurement and cost. The first of these is the pollutant description (PM10). New research suggests that there
are currently other descriptors like finer PM, ultrafine (UF) or source-related PM that also need to be considered for purposes of standard setting. The second aspect is that of the averaging time. Risk estimates based on recent measurements in the
Netherlands suggest that either standard would lead to similar risk estimates. The monitoring of PM is the third aspect. In the position paper and the accompanying documents the need for the use of a correction factor was indicated because the semi-volatile fraction of PM is only partially measured in the currently used automatic measuring devices. Compliance assessment is difficult in these circumstances. The fourth aspect is that of cost. For this last, but certainly not least, aspect more
information has again become available since 1997. The EU has decided that a new position paper is warranted in 2003 and is working on it.
This report has been prepared for a number of Dutch Ministries in the context of the Netherlands Aerosol Programme to facilitate a Dutch position in the evaluation process of the EU PM directive in 2003. The Netherlands Aerosol Programme was instigated at the request of three Ministries, that of Housing, Spatial Planning and the Environment (VROM), that of Transport, Public Works and Water Management (VW) and that of Economic Affairs (EZ). It is being conducted jointly by the Netherlands Institute of Public Health and the Environment (RIVM, Bilthoven), the National Organisation for Applied Scientific Research (TNO, Apeldoorn), the Energy Research Foundation (ECN, Petten) and the Institute for Risk Assessment Studies (IRAS, Utrecht).
In July 2001, the Netherlands Aerosol Programme distributed a discussion document on health risks of particulate matter in ambient air. This document, also known as the 'orange document', was discussed inter alia at a speciality workshop held on 6
September 2001 following the annual ISEE conference, which took place that year in Garmisch Partenkirchen, Germany. Some 30 experts from Europe and the US
attended this speciality workshop and discussed the ideas presented in the discussion document. A second formal opportunity for international discussion arose during a two-day workshop in June 2002 with some 20 experts from the Netherlands and US-EPA in Research Triangle Park (North Carolina) in the United States. Judging by the discussions that followed, including those outside the regular workshops, the 'orange document' fulfilled its purpose well. The feedback we received helped us improve the original document.
However, on a number of issues the scientific evidence available regarding the role of PM is as yet indecisive. Weighing the current evidence, experts sometimes arrive at different conclusions. This report, therefore, by no means contains definitive answers. The whole process we went through has resulted in the common ground presented here. This position will constitute a major element in the Dutch contribution to evaluation of the EU daughter directive on ambient PM in 2003.
In this report we present the answers to the Ministry’s five questions on PM in relation to the review of the EU daughter directive based on the current level of our knowledge. Though a number of other questions will undoubtedly remain after this report has been read, in some respects the report is quite unique. It is the first PM risk
evaluation in which the annual average PM10 concentration based on emission
inventories, assessments and modelling is brought into balance with PM10
measurements. It is the first risk evaluation of PM based on epidemiological data for seven years of PM10 measurements and health effects occurring in one country. It
comprises more than 100 million person years of epidemiological data for one country. It is the first report to have this data set, allowing us to look at the quantitative behaviour of PM risks in space (urban versus rural) and in time. The report comprises the following Sections:
• Section 2 is devoted to the physico-chemical information relating to air quality in the Netherlands. The problems involved in measuring PM are briefly described and an overview presented of the typical chemical composition, mass balance and typical size distribution of PM in the Netherlands. This section on air quality goes on to describe the emissions, modelling and current ambient concentrations of PM. Complementary to the anthropogenic sources, the natural sources of PM and their contribution to ambient levels in the Netherlands are also described. The overview concludes with information on the typical ambient average levels and the levels that can be seen during episodes in the Netherlands. As a bridge to the next section, the relevance of the central site monitor to personal exposure is described.
• Section 3 covers the epidemiological evidence for PM-associated public health problems. First of all, a brief overview is given of the different health risks associated with ambient PM. The most recent information on the form of the concentration-response relationship in the Netherlands is also presented. The possibility of a risk to a specific population is explored, as are the health effects in the Dutch population based on short-term exposures, daily average values and the effects to be expected from chronic exposure to air pollution. The health risks for the Netherlands are quantified on the basis of the most recent concentration-response relationships. This section concludes with a paragraph on the relevance of PM as a proxy or causal factor by way of an introduction to the next section on toxicology.
• Section 4 is devoted to the available toxicological evidence. It describes the different chemical fractions of PM and the corresponding doses in airways and lungs. In this section, space is given to the in vitro experiments with PM and the resulting dose-effect relationships. Next, the in vivo experiments are presented, leading on to a paragraph on human clinical evidence concerning PM and the resulting dose-response relationships. On-site toxicology using an Ambient Fine Particle Concentrator (AFPC) is also described. Concluding this section, the available toxicological information from foreign scientific literature concerning possible mechanisms and routes of action is evaluated for its relevance in the light of the knowledge of concentrations of these specific fractions in the Netherlands. • Section 5 gives a description of the standards that could be used to prevent or
mitigate PM-associated health effects. The scientific evidence for a specific size-related PM standard or for a specific averaging period is evaluated.
• Section 6 is devoted to the reduction of PM health problems. Triggered by the indicative annual average value for PM10 in 2010 of 20 µg/m3 compared with the
40 µg/m3 standard in 2005, the question of whether a reduction of PM levels will also lead to a similar reduction in health risks is discussed. Reducing emissions of
their possible significance for heath risks, some additional information is
presented on ultrafines (UF) and their sources. It goes without saying that specific measures for traffic are also elaborated.
• Finally, Section 7 presents the summarised conclusions and the answers to the five questions put by the Ministry based on the available evidence. As more results of Dutch and foreign research become available in the future, the current conclusions will undoubtedly need to be revised in line with advancing understanding.
2. Physico-chemical characteristics of ambient PM
2.1. General information
Particulate Matter (PM) has both a primary component, which is emitted directly by sources, and a secondary component, which is formed in the atmosphere via chemical reactions of gases. Examples of primary man-made sources are traffic and industry, while natural sources include soil particles blown by the wind, and sea salt. The most important secondary particulate matter derives from sulphur dioxide, oxides of nitrogen, ammonia and volatile organic carbon compounds. Both primary and
secondary PM can be of natural or man-made (anthropogenic) origin. PM can also be the vehicle for heterogeneous chemical reactions of gases, which produce new and sometimes highly reactive components like nitrous acid.
PM can be emitted and exist in the atmosphere in a wide range of particle sizes. Particles with an aerodynamic diameter of 10 µm or less are called inhalable, as this is the fraction that is inhaled by humans. Particulate Matter within a specific size range, a 50% cut-off diameter of 10 µm, is referred to as PM10. Particles with a 50% cut-off
diameter of less than approximately 4 µm can end up deep in the lungs even. From a human health point of view, PM generally larger than 10 µm in diameter and forming a large part of TSP (Total Suspended Particulates) is probably of less concern,
because we do not inhale it. From the point of view of nuisance dust, large particles or TSP can be a problem, though. Information on the PSD (Particle Size Distribution) is essential to understand the potential health effects of PM. The deposition of PM in the respiratory tract and lungs (inhaled dose) varies with particle size. Apart from its size distribution, the chemical speciation and bioavailabilty of PM is information that is also needed to understand the health effects of PM. For an understanding of the current health-related problems of PM, a distinction is generally drawn between three size ranges. The smallest particles are the ultrafine particles or ultrafines (UF), which are less than 0.1 µm in diameter. The next size class is that of the particles smaller than 2.5 µm (but bigger than 0.1 µm) and the largest is the coarse fraction of PM10 in
the range between 2.5 and 10 µm.
Other particle measures are sometimes reported as well, and as they will be presented in this report, too, they need to be mentioned here. In the USA, measurements taken using nephelometers have been used to estimate PM2.5. In the past, Black Smoke
measurement, based on the decreased reflectance or increased light absorbance of filters loaded with soot, was used to indicate the total particulate matter
concentration. The US alternative, the coefficient of haze (CoH), seems to be a less reliable parameter (Allen and Koutrakis, 1999). BS particles are mostly smaller than a few µm. The calibration curve for BS is based on the measured concentrations of PM in the UK in the 1950s. Although the ambient mix of PM has changed, the original calibration curve is still used, as nothing better is available.
2.1.1. Size, composition and sources
processes or the handling of dusty materials. Crustal material re-suspended as a result of turbulence caused by traffic, wind-blown soil particles or PM caused by sea spray and wood burning also result in fairly coarse particles. However, there is no strict relationship between size distribution and source of emissions, as natural emissions of sea salt, for example, contain both fine and coarse particles. The high ambient relative humidity in the Netherlands and the hygroscopic nature of the SIA here are the
reasons for the droplet shape being the most common form of the average PM2.5
particles in this country.
Ultrafine particles are formed during high-temperature combustion processes of either mobile sources or fossil fuel-based power production. However, in the summer UF also forms as a result of photochemical reactions (Birmilli and Wiedensohler, 2000; Tuch et al., 1997; O'Dowd et al., 1998).
The atmospheric residence times and hence ranges of travel of these different size fractions vary considerably. Table 2.14 gives the average residence times and
travelling distances of the five size classes of aerosol differentiated in the OPS model. They range from more than sixty hours to less than two hours for different size
classes.
Apart from its size range and emission sources, PM can also be characterised by its chemical composition. The chemical composition of PM in ambient air depends on the contribution made by both anthropogenic and natural sources. The natural sources mainly consist of primary emissions of sea salt, wind-blown soil dust and some secondary organic particulate matter. The chemical composition of PM varies in accordance with these different emission sources. One can distinguish carbonaceous PM or PMcarb (elemental carbon (EC) and organic particulate matter (OC)), secondary
PM or PMsec (ammonium salts of nitrates and sulphates), also known as SIA
(Secondary Inorganic Aerosols), and natural PM or PMnat (sea salt, crustal material,
sulphate, nitrate and secondary organic particulate matter from natural emissions of precursors). The generic term SOA (Secondary Organic Aerosol) may comprise aerosols formed from natural as well as man-made emissions. Elemental carbon and ammonium salts are chemically well-defined, while organic PM, sea salt and crustal material consist of mixtures of chlorides, oxides of metals and silicates, and a wide range of organic compounds. Heterogeneous atmospheric reactions of ambient PM with gases can in the right circumstances result in highly reactive products like nitrous acid, which in turn is a source of the reactive OH. Owing to their high reactivity, these components are hard to measure. These considerations need to be taken into account when crude particle measures like concentrations of PM10 or PM2.5 are compared with
health effects.
A substantial part of the PM2.5 in the Netherlands consists of semi-volatile components
like ammonium nitrate. This causes sampling and measurement problems, as will be discussed in detail in subsection 2.2.1.1.
2.1.2. PM in the Netherlands
The Netherlands Aerosol Programme (NAP), which is the subject of this report, studied ambient PM concentrations in the Netherlands. Of importance in this respect were measurements of and model calculations made for PM10 and PM2.5 at rural,
urban and industrial locations during the one-year period 1998–1999 (Visser et al., 2001). Relevant emission sources were identified using source receptor modelling in
combination with dispersion modelling and national and European emission
inventories for PM. In addition, special studies focused on estimating contributions to PM concentrations in the Netherlands made by emission sources outside Europe (Weijers et al., 2000), wind-blown soil particles and re-suspended road dust (Keuken
et al., 1999) and on background information relating to EC/OC and ultrafine (UF)
particles (Ten Brink and Keuken, 2000). Some of the research connected with the NAP is still ongoing.
The physical and chemical aspects, as well as the concentrations, of PM in ambient air vary in accordance with the relative contribution made by different emission sources. Consequently, PM concentrations and the physico-chemical properties of PM show temporal and spatial variation even in a relatively small country like the Netherlands. The average results of PM research in the Netherlands conducted on three spatial scales and in six locations – street, urban background and rural background – during the period from August 1998 to September 1999 were presented by Visser et al. (2001). The estimate for the annual average of PM10 in the Netherlands was compiled
from this project and from the above references and is presented in Table 2.1 below. A default value of 10% unknown and/or water was assumed.
Table 2.1 Estimate of the annual average PM10 contribution to aerosol levels in the
Netherlands from various sources in the late 1990s.
Subtotal µg/m3 PM10 µg/m3 Source Primary natural
Sea salt 4-7 (Visser et al., 2001)
Crustal material 2 (Visser et al., 2001)
Subtotal natural 6-9
Primary anthropogenic
EU and NL contribution (non-traffic) 4-7 (Visser et al., 2001)
Traffic (EU and NL) 2-5 (Visser et al., 2001)
Netherlands road dust 1-2 (Keuken et al., 1999)
Subtotal primary anthropogenic 7-14
Secondary anthropogenic (SIA)
European contribution 7-9 (Visser et al., 2001)
Dutch contribution 3-5 (Visser et al., 2001)
Subtotal SIA 10-14
Other
Northern Hemisphere background 1 (Weijers et al., 2000)
Unknown 10% 3-4 Default
Subtotal 4-5
Total PM10 27-42
Natural secondary organic aerosol is not included as it represents only a small fraction (<< 10%) of the anthropogenic contribution.
The range of 27– 42 µg/m3
in annual average PM10 reflects the uncertainties and
spatial variation in the estimated contribution made by various sources to PM10 in the
33 and 32 µg/m3
respectively (Hammingh, 2001). In the large cities, assessed urban background concentrations still exceeded 40 µg/m3
in the 1990s. All the NAQMN values of PM10 were corrected by a factor of 1.3 for volatilisation losses; see
subsection 2.2.1.1. The different PM concentrations on the three spatial scales – regional, urban background and street – will be treated in 2.3.
The light blue shaded areas in Table 2.1 are the only sources for which emission data are currently known and included in European and Dutch emission databases. Only for those sources the dispersion models can present calculated yearly average values. The other sources can not be modelled in the classical dispersion models because of lack of data and have to be estimated by way of a non-modelled fraction, for the Netherlands this fraction has been determined at 18 µg/m3 as a country average. This value will be used later on to bridge the gap between dispersion models and actual measurements of ambient PM10.
2.1.3. Introduction to the chapter on physico-chemical
characterisation
This subsection is structured such that the measurement of PM10 and its ensuing
problems are presented first in Section 2.2. Section 2.3 presents the typical ambient levels of PM10 in the Netherlands on three spatial scales: regional, urban background
and urban street. These have been divided into two time domains: annual average and smaller time scales. In 2.4 the natural contribution to PM10 levels in the Netherlands is
explored and an estimate is made of the part of PM10 that cannot be influenced by
European abatement measures. In 2.5 the modelling of PM10 is presented. This section
starts with an overview of emissions both in the Netherlands and in the countries within the modelling area mentioned. Then, the models for calculating the annual average (OPS) and daily average values (EUROS/LOTOS) are presented, as well as the results they produced. Section 2.6 compares the results of models and
measurements, showing that a previously observed ‘gap’ between measurements and modelling has been adequately closed. In Section 2.7 the divide between ambient air quality and epidemiologically relevant data will be bridged via a discussion of the relationship between PM levels as measured at measuring sites and personal exposure.
2.2. Mass measurement of PM
2.2.1. General methods
The standard procedure in Europe for measuring PM consists of sampling the desired fraction using an appropriate inlet and a filter. The filters are equilibrated for constant weight at a prescribed temperature (20 0C) and relative humidity (50%) before and after sampling, and the mass of aerosol is determined as the difference in weight before and after sampling.
There is a standard procedure for sampling PM in the EU, which is CEN standard EN12341. Unfortunately, the reference instrument, the WRAC (Wide Range Aerosol Classifier), is so cumbersome to use that for daily monitoring of PM other instruments are employed. These have, of course, been compared with the reference instrument. Another fact that should be considered is that the prescribed filter material gives rise
to large artefacts in the collection of PM, as described in a special review paper on measurement methods for compliance in the US (Chow et al., 1995).
RIVM’s National Air Quality Monitoring Network (NAQMN) in the Netherlands performs continuous PM measurements using an FAG-type β-dust monitor (Van Elzakker, 2000). Other countries (UK, France) use the ‘TEOM’. Both instruments (TEOM and FAG) have pre-treatment of the aerosol by heating, which introduces losses of semi-volatile components; see 2.2.1.1. below. To correct for these losses the measured concentrations were increased by 30%. This factor of 1.3 was also
presented by Williams et al. (2001) in a guidance note on PM10 monitoring to EU
member states and in intercomparisons with the reference method.
2.2.1.1. Uncertainties in PM measurements
A problem in measurements of mass concentrations of PM is the behaviour of the so-called semi-volatile compounds, both of inorganic and organic nature. An important inorganic species by mass in the Netherlands aerosol is ammonium nitrate. For instance, Figure 2.1 (Schaap et al., 2002) shows that nitrate is a major compound in the aerosol of a rather large area of Europe. For the Netherlands, ammonium is also an important component on account of our extensive husbandry on a relatively small surface. These factors therefore make ammonium nitrate a highly relevant contributor to aerosol mass levels in the Netherlands. Ammonium nitrate is especially liable to losses.
Figure 2.1 Nitrate in aerosol (µg.m-3), annual average, (Schaap et al., 2002).
Losses of ammonium nitrate may influence the measured PM levels not just in the Netherlands, but in a large area of northwest Europe, Switzerland and Italy. The losses occur because ammonium nitrate is in equilibrium with nitric acid and
ammonium. This equilibrium shifts during sampling. As sampling in the Netherlands is carried out for a 24-hour period, this procedure may result in an unpredictable rate of loss of ammonium nitrate (e.g. Herring and Cass, 1999 and Keuken 1989). Losses depend to a great extent on the filter material. Glass fibre and cellulose will retain