Sexually transmitted infections,
including HIV, in the Netherlands
in 2008
ted infections
, including H
IV
, in the Netherlands in 2008
F.D.H. Koedijk | H.J. Vriend | M.G. van Veen | E.L.M. Op de Coul |
I.V.F. van den Broek | A.I. van Sighem | R.A. Verheij | M.A.B. van der Sande
RIVM
National Institute for Public Health and the Environment
Centre for Infectious Disease Control P.O. Box 1
3720 BA Bilthoven The Netherlands
Sexually transmitted infections,
including HIV, in the Netherlands
in 2008
F.D.H. Koedijk1 H.J. Vriend1 M.G. van Veen1 E.L.M. Op de Coul1 I.V.F. van den Broek1 A.I. van Sighem2 R.A. Verheij3
M.A.B. van der Sande1
Department: Epidemiology and Surveillance, Centre for Infectious Disease Control Institute: 1. National Institute for Public Health and the Environment (RIVM) 2. Stichting HIV Monitoring (SHM)
3. Netherlands Institute for Health Services Research (NIVEL) Contact: Femke Koedijk, Epidemiology and Surveillance,
ronment
In collaboration with: STI centres
Stichting HIV Monitoring & HIV treatment centres ISIS/OSIRIS
A publication by the
National Institute for Public Health and the Environment P.O. Box 1
3720 BA Bilthoven The Netherlands www.rivm.nl All rights reserved © 2009 RIVM
RappoRt IN Het koRt
Seksueel overdraagbare aandoeningen,
waaronder hiv, in Nederland in 2008
Chlamydia, gonorroe, syfilisNa een stabilisatie van het percentage positieve chlamydiatesten in 2007, is dit in 2008 weer toegenomen. Vooral onder jonge heteroseksuelen en bij mannen die seks hebben met mannen (MSM) komt chlamydia veel voor. Het percentage positieve gonorroe- en syfilistesten nam in 2008 verder af. Deze infecties werden het meest gediagnosticeerd bij MSM.
Hiv
In 2008 werden 393 nieuwe hivdiagnoses gesteld in de soacentra, bijna de helft van de 851 hivpositieven die dat jaar landelijk werden gediagnosticeerd en geregistreerd in de hivcentra. Het percentage bezoekers van de soacentra dat zich in 2008 op hiv liet testen nam toe tot 90%. Eind 2008 waren in totaal 15.538 personen in Nederland met hiv gere-gistreerd. Het aandeel MSM onder de nieuwe hivinfecties nam in 2008 verder toe. MSM
Bij 22% van MSM werd een of meerdere soa gevonden; bij MSM die weten dat ze hivpositief zijn was dit 36%. Daarnaast wordt in deze groep sinds 2004 regelmatig lymfogranuloma venereum (LGV), een agressieve variant van chlamydia, en sinds 2007 acute hepatitis C geconstateerd.
Jongeren
Sinds 2008 houden GGD’en speciaal voor jongeren onder de 25 jaar de zogeheten Sense-spreekuren. Daar kunnen zij met hun vragen over seks terecht en direct een afspraak maken voor een soa-onderzoek. In 2009 wordt het essentieel om de samenhang te inten-siveren tussen maatregelen die erop gericht zijn soa’s te voorkomen en te genezen. De soacentra
De soacentra bieden zorg aan hoogrisicogroepen, waaronder jongeren, MSM en personen afkomstig uit gebieden waar soa’s relatief veel voorkomen. In 2008 hebben ruim 88.000 personen zich laten testen, een toename van 13% ten opzichte van 2007.
abStRact
Sexually transmitted infections, including
HIV, in the Netherlands in 2008
Chlamydia, gonorrhoea and syphilis
Chlamydia was the most common bacterial sexual transmitted infection (STI) diagnosed in Dutch STI centres in 2008. Similar to previous years, infections were reported as occurring especially in young heterosexuals and men who have sex with men (MSM) in 2008, the proportion of positive chlamydia tests increased again both in heterosexuals and MSM, after a stabilisation in 2007. The positivity rate for gonorrhoea and syphilis continued to decrease in 2008. These infections were most frequently diagnosed in MSM.
HIV
In 2008, 393 new positive HIV cases were diagnosed in STI centres in the Netherlands. This number amounts to almost half of the total number of 851 positive HIV cases registered nationwide in 2008. The proportion of consultations with an HIV test in STI centres increased to 90%. At the end of 2008, a total of 15,538 HIV cases in care were registered in the Netherlands. The proportion of MSM among new HIV cases rose further in 2008. MSM
In line with previous years, concurrent STIs were diagnosed very frequently among MSM visiting STI centres who had known HIV positive status in 2008 (36%). In this group of men, lymphogranuloma venereum (LGV), an aggressive type of chlamydia, has been reported frequently since 2004; this has also been the case for acute hepatitis C infections since 2007.
Young people
In 2008, parallel to additional STI care in the specialised STI centres, the public sexual healthcare (Sense) has started, aimed at young people. In 2009, intensification of the integration between prevention and cure is essential in this group.
The STI centres
The specialised STI centres in the Netherlands offer STI testing and care targeted at high risk groups, including young people, MSM and people who come from an STI endemic area. In 2008, more than 88,000 people used this service, an increase of 13% compared to 2007.
pReface
This annual report presents the national surveillance data and a review of the epidemi-ology of sexually transmitted infections (STI), including HIV/AIDS, in the Netherlands in 2008. The report aims to produce an overview of recent trends and current developments in the field of STI from data sources available.
We expect that this report contributes to a better understanding of the distribution and determinants of STI, including HIV, in the Netherlands, resulting in further targeting of (preventive) interventions and assessment of their effectiveness on STI transmission. The information is directed at policy makers, researchers in the field of STI and related subjects as well as others interested in STI trends in the Netherlands. More information on STI and HIV in the Netherlands is available at www.soahiv.nl and www.hiv-monitoring.nl. A copy of this report can also be downloaded in PDF format from www.soahiv.nl
Acknowledgements
We gratefully acknowledge the cooperation of physicians, public health doctors and nurses, microbiologists, epidemiologists, dermatologists, behavioural scientists, preven-tion workers and other professionals working in the field of STI and HIV. We would like to thank the following organisations for their continuing collaboration in collecting data: the STI centres (STI clinics and municipal health services), Stichting HIV Monitoring (SHM) and GGD Nederland. We also thank SOA AIDS Nederland, Rutgers Nisso Group, HIV Vereniging, Schorer Stichting, Dutch Working Party on Antibiotic Policy, Netherlands Institute for Health Services Research (NIVEL), in particular the Information Network of General Practice (LINH), Dutch Working Group on Clinical Virology, Sanquin Blood Supply Foundation, Netherlands Organization for Applied Scientific Research (TNO), as well as the other units in the Centre for Infectious Disease Control: Laboratory for Infectious Disease and Screening (LIS), the Policy, Management and Advice unit and the Preparedness and Response unit for their support. Furthermore, we would like to thank Han de Neeling, Daan Notermans and Tineke Herremans (all LIS) for their contribution.
Further information
Any comment or suggestion to improve the usefulness of this report is much appreciated and can be sent to soahiv@rivm.nl.
coNteNtS
SAMENVATTING 13 SuMMARy 15LIST OF ABBREVIATIONS 17 INTRODuCTION 19
1 METHODOLOGy OF STI AND HIV SuRVEILLANCE 21 1.1 National surveillance at STI centres 21
1.2 Antimicrobial resistance of gonococci in the Netherlands 22 1.3 Congenital syphilis 22
1.4 National screening of pregnant women 22 1.5 STI surveillance in the general practice 23 1.6 Anonymous HIV surveillance at STI centres 23 1.7 HIV incidence data 23
1.8 National registration of HIV treatment centres 24 1.9 Blood donors 24
1.10 Notification of hepatitis B and C 25 2 STI CONSuLTATIONS 27
2.1 Key points 27
2.2 Consultations and characteristics of attendees 27 BACTERIAL STI 33
3 CHLAMyDIA AND LyMPHOGRANuLOMA VENEREuM 35 3.1 Key points 35
3.2 Characteristics, risk groups and trends 35 3.3 Lymphogranuloma venereum 39
4 GONORRHOEA 41 4.1 Key points 41
4.2 Characteristics, risk groups and trends 42
4.3 Antimicrobial resistance of gonococci in the Netherlands 45 5 SyPHILIS 47
5.1 Key points 47
5.2 Characteristics, risk groups and trends 48 5.3 Screening pregnant women 50
VIRAL STI 53
6 HIV AND AIDS 55
6.1 Key points - STI centres 55
6.2 Key points - HIV treatment centres (Source: SHM) 55 6.3 STI centres 56
6.4 HIV treatment centres 59 6.5 Other sources 71
7 GENITAL WARTS 75 7.1 Key points 75
7.2 Characteristics, risk groups and trends 75 8 GENITAL HERPES 79
8.1 Key points 79
8.2 Characteristics, risk groups and trends 79 9 HEPATITIS B 83
9.1 Key points 83
9.2 Characteristics, risk groups and trends 83 9.3 Screening pregnant women 86
9.4 Infectious hepatitis B in the STI centres 87 10 HEPATITIS C 89
10.1 Key points 89
10.2 Characteristics, risk groups and trends 89 11 GENERAL CONCLuSIONS AND RECOMMENDATIONS 91 APPENDIx A. NATIONAL SuRVEILLANCE OF STI CENTRES 95 APPENDIx B. STICHTING HIV MONITORING 97
SameNVattINg
In 2008 werden in totaal 88.435 nieuwe soaconsulten uitgevoerd bij de soacentra, een stijging van 13% ten opzichte van 2007. De soacentra richten zich op hoogrisicogroepen door toepassing van een landelijk vastgesteld triagesysteem. Deze hoogrisicogroepen, waaronder MSM (16% in 2008), personen afkomstig uit soa/hiv endemische gebieden (14%) en jongeren tot 25 jaar (41%), worden gratis getest. In 2008 voldeed 94% van de soaconsulten aan deze gestelde criteria voor hoogrisico, of gaf aan anoniem getest te willen worden.
Bacteriële soa
In 2008 was chlamydia opnieuw de meest gediagnosticeerde bacteriële soa in de soacen-tra met 9.403 gerapporteerde gevallen. Na een stabilisatie van het percentage positieve chlamydiatesten in 2007, is in 2008 weer een toename te zien: bij heteroseksuelen werd 10,6% positief getest en bij MSM was dit 11,6%. De meerderheid van de chlamydia-infecties bij heteroseksuelen werd bij jongeren onder de 25 jaar gediagnosticeerd (52%). LGV, een agressieve variant van chlamydia, werd ook in 2008 alleen bij MSM gevonden. Sinds de uitbraak van LGV in 2004 wordt deze infectie nog steeds regelmatig gevonden: in 2008 werden in totaal 100 gevallen van LGV gediagnosticeerd binnen de soacentra. Het percen-tage positieve gonorroe- en syfilistesten nam verder af in 2008 (respectievelijk 2,2% en 0,7%). Beide infecties werden het meest gevonden bij MSM (56% van de gonorroe en 90% van de syfilis diagnoses) en dan vooral in de leeftijdsgroepen vanaf 35 jaar. Bij specifieke etnische groepen (onder andere afkomstig uit Suriname, Nederlandse Antillen en Aruba) was het percentage positieve testen voor chlamydia en gonorroe (mannen en vrouwen), en voor syfilis (alleen MSM) hoger dan bij autochtone Nederlanders, wat aangeeft dat preventie gericht op specifieke groepen essentieel is.
Virale soa
In de soacentra werden 393 nieuwe hivdiagnoses gesteld in 2008. Het percentage posi-tieve hiv-testen nam toe voor MSM tot 3,0% en bleef stabiel bij heteroseksuele mannen en vrouwen (respectievelijk 0,2% en 0,1%). In 2008 werden 1.329 nieuwe aanmeldingen van hivpositieve personen gerapporteerd in de anonieme nationale hivregistratie bij de Stichting HIV Monitoring, waarvan er 851 gediagnosticeerd werden in 2008. Eind 2008 waren in totaal 15.538 personen met hiv in Nederland geregistreerd. Het aandeel nieuw gerapporteerde hivinfecties bij MSM nam in 2008 verder toe tot 68%, daarnaast steeg het aandeel nieuwe infecties onder 50-plussers, vooral door MSM. Bij ruim een derde (36%) van de hiv-positieve MSM die de soacentra bezochten werd één (of meerdere) soa gediagnos-ticeerd. Zowel op gebied van preventie als interventie zijn innovatieve methoden nodig om de continue transmissie van soa en hiv in deze hoogrisicogroep te verminderen. Het aantal diagnoses van andere virale soa steeg in 2008 in de soacentra. Het aantal gerapporteerde diagnoses van genitale wratten, de meest gediagnosticeerde virale soa in de nationale soasurveillance, nam toe met 20% en het aantal diagnoses van genitale herpes (HSV) nam toe met 8%. Hierbij moet worden opgemerkt dat onderzoek van
geni-vergelijkbaar is met die van de besproken bacteriële soa en hiv, waarop routinematig getest wordt. uit de verplichte aangifte van hepatitis B bleek dat het aantal acute hepatitis B-infecties in 2008 vergelijkbaar is met het aantal gerapporteerde gevallen in 2007. De stijging van gerapporteerde acute hepatitis C-gevallen die in 2007 bij MSM werd gezien, heeft zich in 2008 gestabiliseerd.
SummaRy
In 2008, 88,435 new STI consultations were carried out in the national network of STI centres in the Netherlands, an increase of 13% compared to 2007. The STI centres target high-risk groups by patient selection based on a standardized list of criteria. High-risk groups, such as MSM (16% in 2008), persons originating from STI/HIV endemic areas (14%) and young people under 25 years of age (41%) are tested for free. In 2008, 94% of attendees fulfilled one or more of the criteria or wanted to be tested anonymously.
Bacterial STI
In 2008, chlamydia remained the most commonly diagnosed bacterial STI in the STI centres. After a stabilisation in positivity rates of chlamydia in 2007, there was an increase in 2008: in heterosexual men and women the positivity rate increased to 10.6% and in MSM this was 11.6%. The majority of chlamydia cases were diagnosed in heterosexuals younger than 25 years of age (52%). LGV, a vicious strain of chlamydia, was found in MSM only. Since the outbreak of LGV in 2004, this infection continues to be reported frequently: in 2008 there were 100 new LGV cases diagnosed in MSM. The positivity rates for gonor-rhoea and syphilis continued to decrease further in 2008 (2.2% and 0.7%, respectively). Both infections were most prevalent among MSM (56% of gonorrhoea and 90% of syphilis diagnoses) especially in the age groups of 35 years and older. Specific ethnic minorities (for instance from Surinam, the Netherlands Antilles and Aruba) had higher positivity rates for chlamydia and gonorrhoea (men and women) and syphilis (only MSM) than autochthonous Dutch, pointing to the need for targeted intervention by risk profile. Viral STI, including HIV
At the STI centres, a total of 393 new HIV cases were diagnosed in 2008. HIV positivity rates at the STI centres slightly increased to 3.0% in 2008 for MSM and remained fairly stable for heterosexual men and women (0.2% and 0.1%, respectively).
In 2008, 1,329 new HIV positive persons were recorded in the anonymous national HIV registry of the SHM; 851 of them were diagnosed in 2008. As of December 2008, a total of 15,538 HIV cases under medical care had been recorded in the Netherlands. The propor-tion of MSM among HIV cases reporting for care increased over time, up to 68% in 2008; in addition, the fraction of new diagnoses among persons of 50 years or older increased between 2000 and 2007, mainly due to new diagnosis among MSM.
More than one third of the HIV positive MSM consulting the STI centres (36%) were co-infected with one or more other STI. STI prevention and -intervention programmes need to adopt innovative methods specifically aimed at bringing down the transmission in this high-risk group.
The number of other viral STIs increased in the STI centres in 2008. The reported number of genital warts, the most common viral STI in the national surveillance, increased by 20% and the number of cases of genital herpes (HSV) increased by 8%. Testing on these two
the bacterial STI and HIV described above, on which is screened routinely. The number of cases of acute hepatitis B in 2008 was comparable to 2007. The increase in acute hepatitis C cases in MSM in 2007 has stabilised in 2008.
LISt of abbReVIatIoNS
ACS Amsterdam Cohort Studies
AIDS Acquired Immune Deficiency Syndrome ATHENA AIDS Therapy Evaluation in the Netherlands CIb Centrum Infectieziektebestrijding,
Centre for Infectious Disease and Control
CSW Commercial Sex Worker
ECDC European Centre for Disease prevention and Control GP General Practitioner
GRAS Gonococcal Resistance to Antimicrobials Surveillance programme HAART Highly active anti-retroviral therapy
HBV Hepatitis B virus
HCV Hepatitis C virus
HIV Human Immunodeficiency virus
HPV Human papilloma virus
HSV Herpes simplex virus
IDu Intravenous Drug users
IGZ Inspectorate of Health
LGV Lymphogranuloma venereum
LIS Laboratory for Infectious Disease and Screening LINH Landelijk Informatienetwerk Huisartsen,
Information Network of General Practice
MSM Men who have sex with men
NIVEL Nederlands Instituut voor onderzoek van de Gezondheidszorg, Netherlands Institute for Health Services Research
RIVM Rijksinstituut voor Volksgezondheid en Milieu,
National Institute for Public Health and the Environment SHM Stichting HIV Monitoring, HIV Monitoring Foundation SOAP Online STI registration system
STI Sexually Transmitted Infection
TNO Nederlandse Organisatie voor toegepast-natuurwetenschappelijk onderzoek, Netherlands Organization for Applied Scientific Research
INtRoductIoN
This report describes current trends in the epidemiology of STIs, including HIV, in the Netherlands. It is prepared by the Centre for Infectious Disease Control (CIb) at the National Institute for Public Health and the Environment (RIVM). The CIb collaborates with various partners in the field of STI to collect data for surveillance and to generate insights into trends and determinants: the STI centres, the Stichting HIV Monitoring (SHM), public health laboratories and other health care providers.
Available data on STI from surveys, national registries and cohort studies are compiled in this report and provide an overview of the current status of STI, including HIV in the Netherlands. Preliminary data have been presented in the Thermometer (April 2009). Outline of the report
In chapter 1 the methodology of STI surveillance in the Netherlands is described, including all data sources used for this report. In chapter 2 the characteristics of STI centre attendees are presented for 2008. Chapter 3-5 deal with bacterial STI (chlamydia, gonorrhoea and syphilis) and Chapter 6-10 focus on viral STI, including HIV, genital warts, genital herpes, hepatitis B and C. Conclusions and recommendations are described in chapter 11.
metHodoLogy of StI aNd HIV SuRVeILLaNce
1
National surveillance at StI centres
1.1
Since 1995 STIs are registered into an STI registration at the RIVM in the Netherlands. In 2003, an STI sentinel surveillance system was put in place, which reached national coverage in 2004 with inclusion of all major STI centres. Since January 2006, reporting into the national STI surveillance system is organised in eight regions, with each one STI centre that is responsible for regional coordination of STI control (Figure 1.1). In total, 29 specific STI centres, mostly within the municipal health services and some of them with different test locations, provide low threshold STI/HIV testing and care, free of charge, targeted at high risk groups and people who want to be tested anonymously. Currently, persons matching one of the following criteria: (1) presence of STI-related symptoms, (2) notified or referred for STI-test, (3) age below 25 years, (4) MSM, (5) involved in commercial sex, (6) originating from an HIV/STI endemic area or (7) three or more sexual partners in previous six months, are considered to be at increased risk for STI acquisition. Further-more, persons who indicate they want to be tested anonymously can also make use of the STI centres to guarantee ‘low threshold’ STI care. All consultations and corresponding diagnoses are reported online to the CIb for surveillance purposes, facilitated by a web based application (SOAP). The unit of analysis is ‘new STI consultation’, and anonymised reports contain epidemiological, behavioural, clinical and microbiological data on a wide range of STI.
Figure 1.1 Eight regions with coordinating STI centre indicated Regio Oost GGD Regio Nijmegen Regio Limburg GGD Zuid-Limburg Maastricht Regio Noord GGD Groningen Hulpverleningsdienst Groningen Regio Utrecht GG&GD Utrecht Regio Noord Holland Flevoland
GGD Amsterdam Regio Noordelijk Zuid Holland
GGD Den Haag, dienst OCW Regio Zuidelijk Zuid Holland
GGD Rotterdam e.o.
Regio Zeeland Brabant GGD Hart voor Brabant, Den Bosch
In this report, results of national surveillance of STI centres are presented with respect to the number and nature of new consultations and diagnoses. Trends in positivity rates by risk profile (based on demographic and behavioural indicators) in time are based on data from the STI centres in the national surveillance since 2004. Where data were not complete for a specific period or STI centre, this is indicated. We focus on the major bacterial and viral STI, including HIV infection.
antimicrobial resistance of
1.2
gonococci in the Netherlands
In 1999, the surveillance of antibiotic resistance of gonococci at national level was discon-tinued and since then insight in gonococcal susceptibility patterns has been limited. Concern for increasing resistance to quinolones at (inter)national level led to a RIVM laboratory survey of resistance of gonococci in 2002. The results demonstrated the need for a nationwide systematic surveillance of gonococcal antimicrobial resistance. Therefore, in 2006, the Gonococcal Resistance to Antimicrobials Surveillance programme (GRAS) has been implemented in the Netherlands. This surveillance consists of systematically collected data on gonorrhoea and resistance patterns linked with epidemiological data. Participants are patients from the STI centres.
congenital syphilis
1.3
Since many years, RIVM offers IgM diagnostics for neonates and young infants (<1 year) who are suspected of being infected with congenital syphilis. The number of requests for congenital syphilis varied between 64 and 94 per year. In this report, results from 1997-2008 are presented.
National screening of pregnant women
1.4
Standard HIV screening is offered to all pregnant women since January 2004 (opting out method). The test is offered in the first trimester of pregnancy as part of the prenatal screening that includes also hepatitis B (since 1990) and syphilis (since 1960). Currently, preliminary nationwide data (estimations) are available for 2005-2007 (see Chapters HIV, hepatitis B, syphilis). Since 2006, the Centre for National Screening Programmes is coordinating the screening programme on infectious diseases in pregnant women. TNO recently published a process evaluation of the national programme and the CIb is
In Amsterdam, pregnant women have been tested for HIV from 1988 onwards in a senti-nel surveillance study in two hospitals and an abortion clinic. Since 2003, all pregnant women in Amsterdam are screened for HIV and these data are described.
1.5 StI surveillance in the general practice
Data on STI diagnoses in general practice were obtained from the electronic medical records database of the Netherlands ‘Information Network of General Practice’ (LINH) from 2002 to 2007 2. The GP surveillance network LINH consisted in 2007 of 81 Health Centres, geographically and socially reflecting the Dutch population with 327.725 patients registered, equal to 2.0% of the population in the Netherlands. The pool of practices in the network differs from year to year as some practices leave and others join up, varying between 61 to 83 practices in from 2002-2007. Complaints and illnesses were recorded using the ICPC system. The number of STI-episodes was extrapolated to the total Dutch population, adjusting for age and gender breakdown of the Dutch population. Patients’ characteristics include age, sex and urban/rural residence. For syphilis, no data was avai-lable in the database.
anonymous HIV surveillance at StI centres
1.6
HIV surveillance among STI centre attendees is conducted since 1991 in Amsterdam and since 1994 in Rotterdam. In Amsterdam, two cross sectional studies including 1000 visitors each are conducted every year. In Rotterdam STI centre attendees are included year round.
HIV incidence data
1.7
HIV incidence data are obtained in the Amsterdam Cohort Studies (ACS) on HIV/AIDS, which started in 1984 among MSM and in 1985 among IDu. These cohorts give insight in
2 Verheij RA, Van Dijk CE, Abrahamse H, Davids R, Van den Hoogen H, Braspenning J, Van Althuis T. Landelijk Informatienetwerk Huisartsenzorg. Feiten en cijfers over huisartsenzorg in Nederland. utrecht/Nijmegen:
Table 1.1: Number of pregnant women screened for hepatitis B, syphilis and HIV#
Nr pregnant women % with unknown test result* Nr with test result
2006/7 2005/6 2006/7 2005/6 2006/7 2005/6
Hepatitis B 184,801 189,526 0.5 0.6 183,863 188,406
Syphilis 184,801 189,526 0.5 0.6 183,830 188,368
HIV 184,801 189,526 1.2 1.0 182,574 187,718
* unknown test results include ‘unknown’, ‘not provided’, ‘refusal’, and pregnant women with both a ‘positive’ and ‘negative’ test (not interpretable)
HIV rises in an early state in a specific population and can be supportive for prevention activities to respond effectively to the ongoing HIV epidemic. From 1995 and 1998, special recruitment started among young (<30 years) MSM and IDu, respectively. However, since April 2006 participation is open again for MSM of all ages with at least one sexual partner in the preceding six months. The ACS, a collaboration between the Amsterdam Health Service, the Academic Medical Centre of the university of Amsterdam, the Sanquin Blood Supply Foundation and the university Medical Centre utrecht, are part of the SHM and financially supported by the RIVM [www.amsterdamcohortstudies.org].
National registration of HIV treatment centres
1.8
From January 2002, an anonymous HIV/AIDS reporting system for patients entering care was implemented in the Netherlands. Longitudinal data of all newly registered HIV infec-ted individuals are collecinfec-ted by the SHM (www.hiv-monitoring.nl). The goal of SHM is to monitor HIV infected individuals registered in the 25 recognised HIV treatment centres (including four children’s centres) in the Netherlands to study changes in the epidemic, the natural history of HIV and the effects of treatment.
All HIV infected individuals registered in this cohort are followed prospectively from the time of reporting for care. HIV infected individuals in care, who were diagnosed prior to the start of SHM, were as far as possible included in the cohort retrospectively. SHM largely follows the organisational structure that had been established for monitoring HIV in the ATHENA project, a clinical study following HIV infected individuals who are treated with highly active anti-retroviral therapy (HAART). The HIV cases diagnosed before 1996 only include persons who survived up to the start of the ATHENA project in 1996. The epidemiological data on newly reported HIV infections, as well as trends in new AIDS diagnoses after 2000, are reported in collaboration with the CIb at the RIVM.
Between 1987 and 2002, AIDS cases were reported on a voluntary basis to the Inspecto-rate of Health (national AIDS registry, IGZ). With the start of the HIV/AIDS monitoring system in 2002 by SHM, the national AIDS registry was ended. In this report, AIDS cases from 1999 or earlier are obtained from the AIDS registry. From 2000, AIDS cases from the SHM monitoring system were used. Data on deaths among HIV patients (including AIDS patients) were obtained through the SHM (≥ 2002 and previously from National Statistics Netherlands (www.cbs.nl) <2002).
blood donors
1.9
onwards. Prevalence and incidence were calculated with the data provided by the blood bank register (www.sanquin.nl).
Notification of hepatitis b and c
1.10
The obligatory notification of newly diagnosed acute hepatitis B virus (HBV) infections (since 1976) and hepatitis C virus (HCV) infections and chronic HBV infections (both since April 1999, but reporting of chronic HCV cases was stopped in 2005) includes epidemiological data on the occurrence of disease within specific risk groups. Since 2002, all public health services notify HBV and HCV infections by using the web based application OSIRIS.
StI coNSuLtatIoNS
2
key points
2.1
In 2008, 88,435 new consultations were registered in the national surveillance in STI •
centres, an increase of 13% compared with 2007. Increase was highest in MSM (25%). Characteristics of attendees were as follows: young age (40% under 25 years old), Dutch •
origin (81%), MSM (16%) and commercial sex workers (9%), 10% had a history of STI and 46% was not previously tested for HIV.
Of the attendees, 87% had both an STI examination and an HIV test, 12% only had an •
STI examination (tested for chlamydia, gonorrhoea or syphilis) and 0.5% only had an HIV test. Of the 13% not tested for HIV, 20% were known HIV positives.
Twenty-six percent reported three or more sex partners in past six months: for MSM •
this was 43%.
Ninety four percent of all STI centre attendees fulfilled one or more of the criteria set •
as indicators of high risk or were tested for reasons of anonymity.
In GPs, number of episodes of fear of STIs, a proxy for STI consultation, also increased •
steadily.
consultations and characteristics of attendees
2.2
Footnote: 1995-2002: STI registration; 2000: STI centre Erasmus Medical Centre Rotterdam was included; 2003: Implementation of STI sentinel surveillance network; 2004-2008: National STI surveillance network.
Figure 2.1: Number of consultations in the national STI surveillance in the Netherlands, 1995-2008 2008 100000 70000 80000 90000 30000 1995 1996 1997 1998 1999 2000 2001 2002 2003 2004 2005 2006 2007 10000 20000 40000 50000 60000 0
Table 2.1: Number of consultations by gender and sexual preference, 2006-2008
gender and sexual preference 2006 2007 2008 (%)
Heterosexual men 25712 (37.2) 28689 (36.8) 31770 (36.0)
MSM 9770 (14.2) 11048 (14.1) 13764 (15.6)
Women 33317 (48.3) 38210 (48.9) 42796 (48.5)
Transgenders* 2 (0.0) 29 (0.0) 34 (0.0)
Sexual preference unknown* 156 (0.2) 85 (0.1) 71 (0.1)
Total 68977 78062 88435
* Categories transgenders and ‘sexual preference unknown’ are disregarded in the rest of the tables
Table 2.2: Number of consultations per month
month total (%) January 7513 (8.5) February 6858 (7.8) March 6433 (7.3) April 7468 (8.4) May 6979 (7.9) June 7704 (8.7) July 7759 (8.8) August 7207 (8.2) September 7822 (8.8) October 8017 (9.1) November 7474 (8.5) December 7167 (8.1) Total 88330
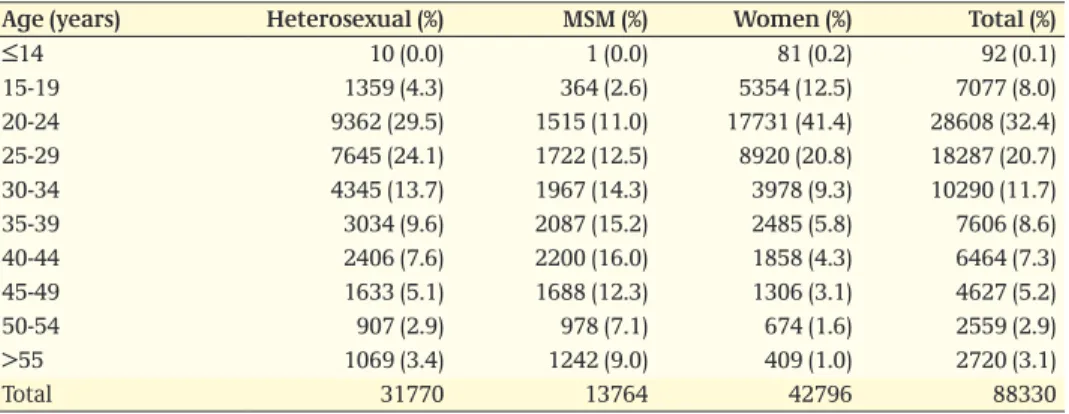
Table 2.3: Number of consultations by age, gender and sexual preference
age (years) Heterosexual (%) mSm (%) Women (%) total (%)
≤14 10 (0.0) 1 (0.0) 81 (0.2) 92 (0.1) 15-19 1359 (4.3) 364 (2.6) 5354 (12.5) 7077 (8.0) 20-24 9362 (29.5) 1515 (11.0) 17731 (41.4) 28608 (32.4) 25-29 7645 (24.1) 1722 (12.5) 8920 (20.8) 18287 (20.7) 30-34 4345 (13.7) 1967 (14.3) 3978 (9.3) 10290 (11.7) 35-39 3034 (9.6) 2087 (15.2) 2485 (5.8) 7606 (8.6) 40-44 2406 (7.6) 2200 (16.0) 1858 (4.3) 6464 (7.3) 45-49 1633 (5.1) 1688 (12.3) 1306 (3.1) 4627 (5.2) 50-54 907 (2.9) 978 (7.1) 674 (1.6) 2559 (2.9) >55 1069 (3.4) 1242 (9.0) 409 (1.0) 2720 (3.1) Total 31770 13764 42796 88330
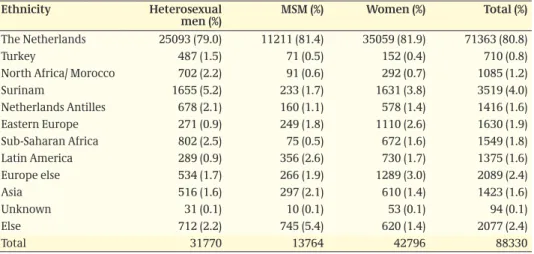
Table 2.4: Number of consultations by ethnicity, gender and sexual preference
ethnicity Heterosexual
men (%) mSm (%) Women (%) total (%)
The Netherlands 25093 (79.0) 11211 (81.4) 35059 (81.9) 71363 (80.8)
Turkey 487 (1.5) 71 (0.5) 152 (0.4) 710 (0.8)
North Africa/ Morocco 702 (2.2) 91 (0.6) 292 (0.7) 1085 (1.2)
Surinam 1655 (5.2) 233 (1.7) 1631 (3.8) 3519 (4.0) Netherlands Antilles 678 (2.1) 160 (1.1) 578 (1.4) 1416 (1.6) Eastern Europe 271 (0.9) 249 (1.8) 1110 (2.6) 1630 (1.9) Sub-Saharan Africa 802 (2.5) 75 (0.5) 672 (1.6) 1549 (1.8) Latin America 289 (0.9) 356 (2.6) 730 (1.7) 1375 (1.6) Europe else 534 (1.7) 266 (1.9) 1289 (3.0) 2089 (2.4) Asia 516 (1.6) 297 (2.1) 610 (1.4) 1423 (1.6) unknown 31 (0.1) 10 (0.1) 53 (0.1) 94 (0.1) Else 712 (2.2) 745 (5.4) 620 (1.4) 2077 (2.4) Total 31770 13764 42796 88330
Table 2.5: Number of consultations by male client of CSW and sexual preference
client of cSW Heterosexual
men (%) mSm (%) total (%)
No 28382 (89.3) 13466 (97.8) 41848 (91.9)
yes, in past 6 months 3281 (10.3) 246 (1.8) 3527 (7.8)
unknown 107 (0.3) 52 (0.4) 159 (0.4)
Total 31770 13764 45534
Table 2.6: Number of consultations by female CSW
cSW female cSW (%)
No 38787 (90.6)
yes, in past 6 months 3832 (8.9)
unknown 177 (0.4)
Total 42796
Table 2.7: Number of consultations by injecting drug use, gender and sexual preference
Injecting drug use Heterosexual
men (%) mSm (%) Women (%) total (%)
No 31327 (98.6) 13510 (98.2) 41774 (97.6) 86611 (98.1)
yes, ever 56 (0.1) 26 (0.2) 81 (0.2) 163 (0.2)
yes, in past 6 months 31 (0.1) 9 (0.1) 39 (0.1) 79 (0.1)
unknown 356 (1.1) 219 (1.6) 902 (2.1) 1477 (1.7)
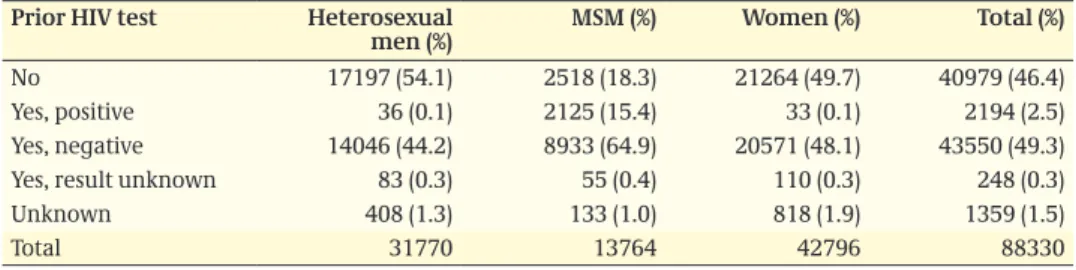
Table 2.8: Number of consultations by prior HIV test, gender and sexual preference
prior HIV test Heterosexual
men (%) mSm (%) Women (%) total (%)
No 17197 (54.1) 2518 (18.3) 21264 (49.7) 40979 (46.4)
yes, positive 36 (0.1) 2125 (15.4) 33 (0.1) 2194 (2.5)
yes, negative 14046 (44.2) 8933 (64.9) 20571 (48.1) 43550 (49.3)
yes, result unknown 83 (0.3) 55 (0.4) 110 (0.3) 248 (0.3)
unknown 408 (1.3) 133 (1.0) 818 (1.9) 1359 (1.5)
Total 31770 13764 42796 88330
Table 2.9: Number of consultations by previous GO/CT/syphilis in anamnesis, gender and sexual preference
previous go/ct/
syphilis Heterosexual men (%) mSm (%) Women (%) total (%)
No 28448 (89.5) 10648 (77.4) 37622 (87.9) 76718 (86.9)
yes 2288 (7.2) 2860 (20.8) 3862 (9.0) 9010 (10.2)
Do not know 633 (2.0) 621 (1.5) 621 (1.5) 1384 (1.4)
unknown 401 (1.3) 126 (0.1) 691 (1.6) 1218 (1.4)
Total 31770 13764 42796 88330
Table 2.10: Reported indication by gender and sexual preference
Indication Heterosexual
men (%) mSm (%) Women (%) total (%)
STI/HIV endemic area 5400 (17.0) 1532 (11.1) 5775 (13.5) 12707 (14.4)
Symptoms 8632 (27.6) 4129 (30.4) 10239 (24.3) 23000 (26.5)
Partner in risk group 6489 (20.4) 11711 (85.1) 9400 (22.0) 27600 (31.3)
Referred 1128 (3.6) 1159 (8.4) 1209 (2.8) 3496 (4.0)
Notified 3207 (10.1) 1933 (14.0) 3072 (7.2) 8212 (9.3)
Anonymous test 12351 (38.9) 4398 (32.0) 17809 (41.6) 34558 (39.1)
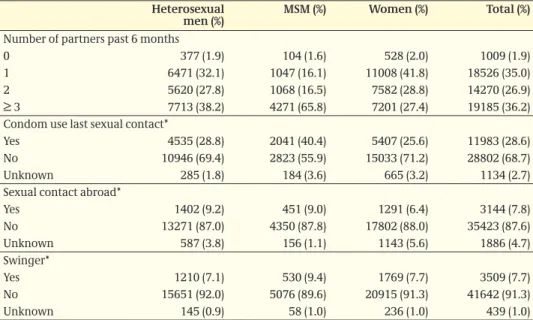
Table 2.11: Behavioural indicators by gender and sexual preference, NA GGD Amsterdam
Heterosexual
men (%) mSm (%) Women (%) total (%)
Number of partners past 6 months
0 377 (1.9) 104 (1.6) 528 (2.0) 1009 (1.9)
1 6471 (32.1) 1047 (16.1) 11008 (41.8) 18526 (35.0)
2 5620 (27.8) 1068 (16.5) 7582 (28.8) 14270 (26.9)
≥ 3 7713 (38.2) 4271 (65.8) 7201 (27.4) 19185 (36.2)
Condom use last sexual contact*
yes 4535 (28.8) 2041 (40.4) 5407 (25.6) 11983 (28.6)
No 10946 (69.4) 2823 (55.9) 15033 (71.2) 28802 (68.7)
unknown 285 (1.8) 184 (3.6) 665 (3.2) 1134 (2.7)
Sexual contact abroad*
yes 1402 (9.2) 451 (9.0) 1291 (6.4) 3144 (7.8) No 13271 (87.0) 4350 (87.8) 17802 (88.0) 35423 (87.6) unknown 587 (3.8) 156 (1.1) 1143 (5.6) 1886 (4.7) Swinger* yes 1210 (7.1) 530 (9.4) 1769 (7.7) 3509 (7.7) No 15651 (92.0) 5076 (89.6) 20915 (91.3) 41642 (91.3) unknown 145 (0.9) 58 (1.0) 236 (1.0) 439 (1.0) * question voluntary
Figure 2.2: Reporting rate (number of episodes per 100,000 population) of fear of STI at GPs in the Netherlands, 2002-2007 (Source: LINH)
2007 2006 2005 2004 2003 700 300 2002 100 200 400 500 600 0 800 men women
Table 2.12: Number of diagnoses by gender and sexual preference
diagnosis Heterosexual
men (%) mSm (%) Women (%) total (%)
Gonorrhoea 415 (6.6) 1095 (18.7) 454 (4.9) 1964 (9.2) Chlamydia 3350 (53.3) 1579 (27.9) 4504 (48.6) 9433 (44.1) Syphilis: primary 15 (0.2) 188 (3.2) 7 (0.1) 210 (1.0) “” : secondary 9 (0.1) 150 (2.6) 3 (0.0) 162 (0.8) “” : latens recens 14 (0.2) 200 (3.4) 13 (0.1) 227 (1.1) “” : latens tarda 41 (0.7) 71 (1.2) 37 (0.4) 149 (0.7) “” : not specified 4 (0.1) 19 (0.3) 5 (0.1) 28 (0.1) HIV 43 (0.7) 320 (5.5) 30 (0.3) 393 (1.8) Genital warts 991 (15.8) 477 (8.1) 996 (10.8) 2464 (11.5) Genital herpes: prim.: HSV1 95 (1.5) 51 (0.9) 164 (1.8) 310 (1.5) “” : prim.: HSV2 138 (2.2) 88 (1.5) 125 (1.4) 351 (1.6) “” : prim.: HSV unknown 15 (0.2) 7 (0.1) 22 (0.2) 44 (0.2) “” : recurrent 20 (0.3) 5 (0.1) 9 (0.1) 34 (0.2) Hepatitis B: infectious 94 (1.5) 59 (1.0) 65 (0.7) 218 (1.0) Hepatitis B: recovered 638 (10.1) 985 (16.8) 626 (6.8) 2249 (10.5) Non specified urethritis 226 (3.6) 60 (1.0) 33 (0.4) 319 (1.5)
Candidiasis 187 (3.0) 36 (0.6) 941 (10.2) 1164 (5.4) Bacterial vaginosis 1 (0.0) 0 (0.0) 1106 (11.9) 1107 (5.2) Trichomoniasis 5 (0.1) 0 (0.0) 123 (1.3) 128 (0.6) Scabies 8 (0.1) 33 (0.6) 0 (0.0) 41 (0.2) Pubic Lice 2 (0.0) 7 (0.1) 0 (0.0) 9 (0.0) ulcus e.c.i. 34 (0.5) 77 (1.3) 36 (0.4) 147 (0.7) Lymphogranuloma 0 (0.0) 100 (1.7) 0 (0.0) 100 (0.5) Proctitis 2 (0.0) 295 (5.0) 8 (0.1) 305 (1.4) Total 6347 5902 9307 21556
cHLamydIa aNd LympHogRaNuLoma VeNeReum
3
key points
3.1
Chlamydia remained the most commonly diagnosed bacterial STI: 9,403 cases were •
diagnosed in the STI centres in 2008 (36% in heterosexual men, 17% in MSM, 52% in women).
The main burden of disease is carried by the young heterosexual population (52% •
under 25 years).
After a stabilisation in previous years, chlamydia positivity rates increased again in •
2008. Overall, the positivity rate for chlamydia was 10.8% and was highest in MSM (11.6%).
Highest positivity rates were observed in young heterosexual men and women (20-24 •
years) and adult MSM (30-39 years), as well as persons from Surinam or the Netherlands Antilles and those who reported a previous STI.
In GPs, reporting rates for chlamydia were 186 and 159 per 100,000 population for •
men and women, respectively, in 2007.
Nineteen percent of the MSM with chlamydia had a co-infection with gonorrhoea; in •
heterosexuals this was 4%.
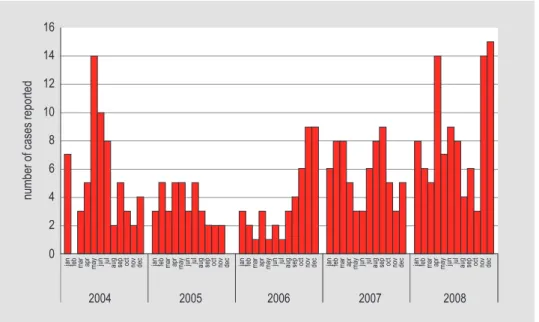
Hundred new LGV cases were diagnosed in the STI centres: all MSM, 71% known HIV •
positive.
characteristics, risk groups and trends
3.2
Figure 3.1: Positivity rates for chlamydia by STI centre, the Netherlands, 2008
9-10% 10-11% 11-11.5% 11.5-12% Positivity rate
Table 3.1: Location of chlamydia infection by gender and sexual preference
Location Heterosexual men N (%) mSm N (%) Women N (%)
urethral/cervical 3343 (99.6) 652 (36.2) 4385 (90.4)
Anorectal 2 (0.1) 1061 (58.9) 328 (6.8)
Oral 6 (0.2) 72 (4.0) 134 (2.8)
unknown 5 (0.1) 15 (0.8) 2 (0.0)
Total 3356 1800 4849
Table 3.2: Number and percentage of positive tests of chlamydia by age, gender and sexual prefe-rence
age (years) Heterosexual men mSm Women
pos. tests % pos. pos. tests % pos. pos. tests % pos.
0-14 0 0 0 0 2 2.5 15-19 198 14.6 35 9.9 902 17.0 20-24 1350 14.5 169 11.3 2275 12.9 25-29 926 12.2 198 11.6 819 9.2 30-34 398 9.2 257 13.2 240 6.1 35-39 198 6.6 273 13.2 104 4.2 40-44 135 5.7 250 11.5 75 4.1 45-49 78 4.8 189 11.3 47 3.6 50-54 39 4.3 94 9.7 29 4.4 >55 28 2.6 114 9.3 11 2.7 Total 3350 10.6 1579 11.6 4504 10.6 2008 2006 2007 2005 40000 45000 15000 20000 2004 5000 10000 25000 30000 35000 0 12 14 2 4 0 6 8 10
Table 3.3: Number and percentage of positive tests of chlamydia by demographics, gender and sexual preference
Heterosexual men
(N=3350) (N=1579)mSm (N=4504)Women
pos. tests % pos. pos. tests % pos. pos. tests % pos. Ethnicity
The Netherlands 2460 9.9 1217 11.0 3631 10.4
Turkey 49 10.1 8 11.3 20 13.4
N.Africa/ Morocco 103 14.9 9 10.0 41 14.2
Sur./ Ant./ Aruba 429 18.4 74 19.0 333 15.1
Sub-Sah. Africa 88 11.0 12 16.0 75 11.3 Eastern Europe 27 10.1 33 13.3 111 10.1 Latin America 32 11.2 54 15.2 66 9.1 Asia 50 9.7 45 15.2 71 11.7 Europe other 40 7.6 19 7.2 113 8.9 Else 69 9.7 106 14.2 38 6.1 unknown 3 10.0 2 20.0 5 10.0 Client of CSW, men No 3163 11.2 1556 11.7
yes, in past 6 months 180 5.6 20 8.2
unknown 7 6.9 3 6.4
CSW, women
No 4231 11.0
yes, in past 6 months 259 6.8
unknown 14 8.2
Previous HIV test
No 1962 11.5 245 9.9 2574 12.2
yes, positive 3 8.3 426 20.1 4 12.5
yes, negative 1335 9.6 893 10.1 1843 9.0
yes, result unknown 3 3.7 3 5.6 10 9.1
unknown 47 11.7 12 9.4 73 9.1
Previous GO/ CT/syphilis in anamnesis
yes 402 17.7 510 17.9 549 14.3
No 2862 10.0 1042 9.9 3834 10.2
Don’t know 82 13.1 16 12.6 64 10.5
unknown 40 10.1 11 9.2 57 8.4
Table 3.4: Concurrent STI by gender and sexual preference
concurrent StI Heterosexual men
(N=3350) (%) (N=1579) (%)mSm (N=4504) (%)Women
Gonorrhoea 145 (4.3) 293 (18.6) 149 (3.3)
Infectious syphilis 2 (0.1) 123 (7.8) 1 (0.0)
HIV newly diagnosed 4 (0.1) 78 (4.9) 2 (0.0)
Genital herpes 18 (0.5) 27 (1.7) 18 (0.4)
Table 3.5: Behavioural indicators of chlamydia cases compared to STI negatives by gender and sexual preference (NA GGD Amsterdam)
Heterosexual men N (%) mSm N (%) Women N (%)
Median no. partners past 6 months (median (IQR))
Chlamydia positives 2 (1-4) 4 (2-8) 2 (1-3)
STI negatives* 2 (1-3) 3 (2-7) 2 (1-3)
Condom use last sexual contact**
Chlamydia positives 320 (19.2) 177 (34.9) 445 (19.2)
STI negatives* 4043 (30.1) 1642 (41.4) 4790 (26.4)
Sexual contact abroad**
Chlamydia positives 123 (7.8) 47 (9.2) 130 (5.8)
STI negatives* 1219 (9.4) 341 (8.8) 1133 (6.5)
Swinger**
Chlamydia positives 47 (2.7) 30 (5.2) 88 (3.6)
STI negatives* 1109 (7.6) 465 (10.5) 1557 (7.9)
* Negative for chlamydia, gonorrhoea, infectious syphilis, HIV, hepatitis B, herpes genitalis and genital warts ** Voluntary question
Figure 3.3: Reporting rate (number of episodes per 100,000 population) for chlamydia at GPs in the Netherlands, 2002-2007 (Source: LINH)
2007 2006 2005 2004 2003 250 100 2002 50 150 200 0 300 men women
Lymphogranuloma venereum
3.3
Table 3.6: Characteristics of LGV cases, 2008
mSm (N=100)
Median age (range) 41.6 (26-63)
Dutch ethnicity 74 (74%)
Known HIV positive 71 (71%)
Anorectal infection 96 (96%)
Inguinal infection 3 (3%)
Anorectal and inguinal infection 1 (1%)
Concurrent gonorrhoea 26 (26%)
Concurrent syphilis 11 (11%)
Concurrent new HIV diagnosis 2 (2%)
Figure 3.4: Number of positive test results for Chlamydia Trachomatis from 17 hospital- and regional laboratories, 2000-2008 (Source: weekly virological reports, 2000-2008)
2008 14000 16000 6000 2000 2001 2002 2003 2004 2005 2006 2007 2000 4000 8000 10000 12000 0
Figure 3.5: Number of cases of Lymphogranuloma venereum diagnosed per month in the STI centres, the Netherlands, 2004-2008
2008
2006 2007
2005 14
16
number of cases reported
6 8
2004
jan feb mar apr may jun jul aug sep oct nov dec jan feb mar apr may jun jul aug sep oct nov dec jan feb mar apr may jun jul aug sep oct nov dec jan feb mar apr may jun jul aug sep oct nov dec jan feb mar apr may jun jul aug sep oct nov dec
2 4 10 12
goNoRRHoea
4
key points
4.1
In 2008, 1,964 diagnoses of gonorrhoea were made in the national surveillance of STI •
centres in the Netherlands (21% in heterosexual men, 56% in MSM, 23% in women). In women, halve of the cases were among attendees younger than 25 years. •
Positivity rates for gonorrhoea have decreased since 2004. Overall, positivity rate was •
2.2% in 2008.
Positivity rates were highest among MSM (8.0%), heterosexual men and women from •
Surinam (4.7%) and swingers (4.5%).
Thirty percent of the gonorrhoea cases had a chlamydia co-infection. •
Five percent of the gonorrhoea cases had a new HIV infection, 15% was already known •
with their HIV positivity.
In GPs, reporting rates for gonorrhoea were 48.5 and 8.3 per 100,000 population for •
men and women, respectively, in 2007.
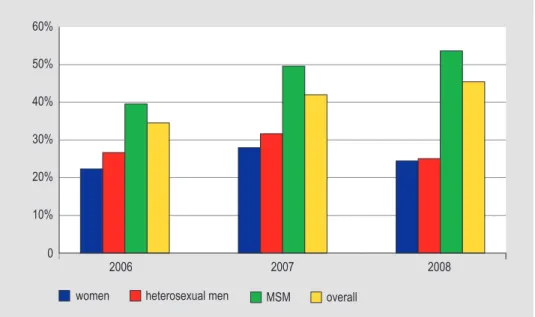
Ciprofloxacin resistance increased up to 45% in the STI centres and 39% in a laboratory •
survey; increase was highest in MSM (40% in 2006 to 54% in 2008). Resistance to third generation cephalosporins was not found, although an upward shift in MIC values was observed.
Figure 4.1: Positivity rates of gonorrhoea by STI centre, the Netherlands, 2008
0.0-1.0% 1.0-2.0% 2.0-2.5% 2.5-3.0% Positivity rate
characteristics, risk groups and trends
4.2
Table 4.1: Location of gonorrhoea infection by gender and sexual preference
Location Heterosexual men N (%) mSm N (%) Women N (%)
urethral/cervical 401 (95.7) 453 (32.8) 362 (64.2)
Anorectal 0 (0.0) 577 (41.7) 81 (14.4)
Oral 17 (4.1) 353 (25.5) 121 (21.5)
unknown 1 (0.2) 0 (0.0) 0 (0.0)
Total 419 1383 564
Table 4.2: Number and percentage of positive tests of gonorrhoea by age, gender and sexual preference
age (years) Heterosexual men mSm Women
pos. tests % pos. pos. tests % pos. pos. tests % pos.
0-14 0 0.0 0 0.0 0 0.0 15-19 30 2.2 23 6.5 91 1.7 20-24 125 1.3 120 8.1 138 0.8 25-29 79 1.0 163 9.6 75 0.8 30-34 53 1.2 175 9.0 38 1.0 35-39 38 1.3 209 10.1 32 1.3 40-44 36 1.5 174 8.0 38 2.1 45-49 24 1.5 125 7.5 20 1.5 50-54 17 1.9 53 5.5 15 2.3 >55 13 1.2 53 4.3 7 1.7 Total 415 1.3 1059 8.0 454 1.1 40000 45000 15000 20000 5000 10000 25000 30000 35000 12 2 4 6 8 10
Table 4.3: Number and percentage of positive tests of gonorrhoea by demographics, gender and sexual preference
Heterosexual men
(N=415) (N=1095)mSm Women (N=454)
pos. tests % pos. pos. tests % pos. pos. tests % pos. Ethnicity
The Netherlands 225 0.9 846 7.6 297 0.9
Turkey 7 1.4 8 11.3 3 2.0
N.Africa/ Morocco 21 3.0 3 3.3 3 1.0
Sur./ Ant./ Aruba 110 4.7 52 13.3 6 2.8
Sub-Sah. Africa 18 2.3 8 10.7 15 2.2 Eastern Europe 7 2.6 25 10.1 23 2.7 Latin America 2 0.7 41 11.5 9 1.2 Asia 7 1.4 33 11.1 4 0.7 Europe other 9 1.7 17 6.5 35 2.7 Else 8 1.1 62 8.3 3 0.5 unknown 1 3.3 0 0.0 1 2.0 Client of CSW, men No 357 1.3 1082 8.1
yes, in past 6 months 55 1.7 7 2.9
unknown 3 2.9 6 13.0
CSW, women
No 368 1.0
yes, in past 6 months 82 2.2
unknown 4 2.3
Previous HIV test
No 215 1.3 149 6.0 186 0.9
yes, positive 1 2.8 286 13.5 1 3.1
yes, negative 193 1.4 652 7.4 258 1.3
yes, result unknown 1 1.2 4 7.4 2 1.8
unknown 5 1.2 4 3.1 7 0.9
Previous GO/ CT/syphilis in anamnesis
yes 69 3.0 376 13.2 84 2.2
No 338 1.2 709 6.7 361 1.0
Don’t know 2 0.3 3 2.4 3 0.5
unknown 6 1.5 7 5.8 6 0.9
Table 4.4: Concurrent STI by gender and sexual preference
concurrent StI Heterosexual men
(N=415) N (%) (N=1095) N (%) mSm (N=454) N (%) Women
Chlamydia 145 (34.9) 293 (26.8) 149 (32.8)
Infectious syphilis 0 (0.0) 63 (5.8) 0 (0.0)
HIV newly diagnosed 5 (1.2) 62 (5.7) 0 (0.0)
Genital herpes 2 (0.5) 13 (1.2) 4 (0.9)
Table 4.5: Behavioural indicators of gonorrhoea cases compared to STI negatives by gender and sexual preference (NA GGD Amsterdam)
Heterosexual men N (%) mSm N (%) Women N (%)
Median no. partners past 6 months (median (IQR))
Gonorrhoea positives 3 (2-5) 4 (2-10) 3 (2-6)
STI negatives* 2 (1-3) 3 (2-7) 2 (1-3)
Condom use last sexual contact**
Gonorrhoea positives 52 (24.7) 136 (39.9) 81 (32.2)
STI negatives* 4043 (30.1) 1642 (41.4) 4790 (26.4)
Sexual contact abroad**
Gonorrhoea positives 28 (13.2) 43 (12.7) 12 (4.9)
STI negatives* 1219 (9.4) 341 (8.8) 1133 (6.5)
Swinger**
Gonorrhoea positives 31 (13.3) 30 (7.6) 96 (32.5)
STI negatives* 1109 (7.6) 465 (10.5) 1557 (7.9)
* Negative for chlamydia, gonorrhoea, infectious syphilis, HIV, hepatitis B, herpes genitalis and genital warts **Voluntary question
Figure 4.3: Reporting rate (number of episodes per 100,000 population) for gonorrhoea at GPs in the Netherlands, 2002-2007 (Source: LINH)
2007 2006 2005 2004 2003 70 30 2002 10 20 40 50 60 0 80 men women
antimicrobial resistance of
4.3
gonococci in the Netherlands
Figure 4.4: Gonococcal resistance in the Netherlands, proportion of resistant cases as reported by 22 public health laboratories, 2002-2007
2006 2004 2005 2003 40% 45% Betalactamase 15% 20% 2002 2007 5% 10% 25% 30% 35% 0 Quinolones Cephalosporines Tetracyclines
Figure 4.5: Prevalence of ciprofloxacine resistance by sexual preference and gender (Source: GRAS, STI centres, July 2006- December 2008)
2008 2007 50% 60% women 20% 2006 10% 30% 40% 0 MSM overall heterosexual men
SypHILIS
5
key points
5.1
In 2008, 599 diagnoses of infectious syphilis were made in the STI centres in the •
Netherlands (6% in heterosexual men, 90% in MSM, 4% in women).
As in previous years, the positivity rates among MSM decreased further from 4.3% •
(2007) to 3.9% (2008) and was highest among MSM aged over 35 years. The positivity rates among heterosexual men and women remained low.
Forty percent of infectious syphilis cases were diagnosed in HIV positive MSM who •
were aware of their HIV positive status, 6% in newly diagnosed HIV cases.
The positivity rate of infectious syphilis was much higher in HIV positive MSM (10.1%) •
compared to MSM who were previously tested HIV negative (2.5%).
Preliminary data from screening of pregnant women showed a prevalence of 0.07-•
0.12% of syphilis in 2006-2007.
Of all MSM with syphilis, 23% had a co-infection with chlamydia and 12% had a •
co-infection with gonorrhoea.
Figure 5.1: Positivity rates for infectious syphilis by STI centre, the Netherlands, 2008
0.0-0.25% 0.25-0.50% 0.50-0.75% 0.75-1.0% Positivity rate
characteristics, risk groups and trends
5.2
Table 5.1: Number and percentage of positive tests of infectious syphilis by age, gender and sexual preference
age (years) Heterosexual men mSm Women
pos. tests % pos. pos. tests % pos. pos. tests % pos.
0-14 0 0.0 0 0.0 0 0.0 15-19 2 0.2 7 1.9 1 0.02 20-24 3 0.03 31 2.0 5 0.03 25-29 5 0.1 48 2.8 1 0.01 30-34 5 0.1 69 3.5 7 0.2 35-39 7 0.2 116 5.6 2 0.1 40-44 5 0.2 100 4.5 5 0.3 45-49 3 0.2 80 4.7 1 0.1 50-54 4 0.4 39 4.0 0 0.0 >55 4 0.4 48 3.9 1 0.2 Total 38 0.1 538 3.9 23 0.05
Figure 5.2: Total number and positivity rate of diagnoses of infectious syphilis by gender and sexual preference, STI centres, the Netherlands, 2004-2008
2008 2006 2007 2005 40000 45000 nr of tests women 15000 20000 2004 5000 10000 25000 30000 35000 0 nr of tests MSM nr of tests heterosexual men
women % pos heterosexual men % pos MSM % pos
6 7 1 2 0 3 4 5
Table 5.2: Number and percentage of positive tests of infectious syphilis by demographics, gender and sexual preference
Heterosexual men
(N=38) (N=538)mSm Women (N=23)
pos. tests % pos. pos. tests % pos. pos. tests % pos. Ethnicity
The Netherlands 24 0.1 420 3.8 10 0.03
Turkey 1 0.2 3 4.2 0 0.0
N.Africa/ Morocco 4 0.6 0 0.0 3 1.0
Sur./ Ant./ Aruba 3 0.1 29 7.4 1 0.05
Sub-Sah. Africa 1 0.1 5 6.7 0 0.0 Eastern Europe 1 0.4 6 2.4 4 0.4 Latin America 2 0.7 18 5.1 1 0.1 Asia 2 0.4 17 5.7 0 0.0 Europe other 0 0.0 8 3.0 4 0.3 Else 0 0.0 31 4.2 0 0.0 unknown 0 0.0 1 10.0 0 0.0 Client of CSW, men No 30 0.1 528 3.9
yes, in past 6 months 8 0.2 5 2.0
unknown 0 0.0 5 9.6
CSW, women
No 14 0.04
yes, in past 6 months 9 0.2
unknown 0 0.0
Previous HIV test
No 18 0.1 85 3.4 10 0.1
yes, positive 0 0.0 214 10.1 0 0.0
yes, negative 15 0.1 225 2.5 10 0.1
yes, result unknown 0 0.0 2 3.6 0 0.0
unknown 5 1.2 12 9.0 3 0.4
Previous GO/ CT/syphilis in anamnesis
yes 3 0.1 370 3.5 14 0.1
No 35 0.1 160 5.6 18 0.1
Don’t know 0 0.0 2 1.5 1 0.2
unknown 0 0.0 6 4.8 0 0.0
Table 5.3: Concurrent STI by gender and sexual preference
concurrent StI Heterosexual men
(N=38) N (%) (N=538) N (%) mSm (N=23) N (%) Women
Chlamydia 2 (5.3) 123 (22.9) 1 (4.4)
Gonorrhoea 0 (0.0) 63 (11.7) 0 (0.0)
HIV newly diagnosed 1 (2.6) 32 (6.0) 1 (4.4)
Genital herpes 0 (0.0) 9 (1.7) 0 (0.0)
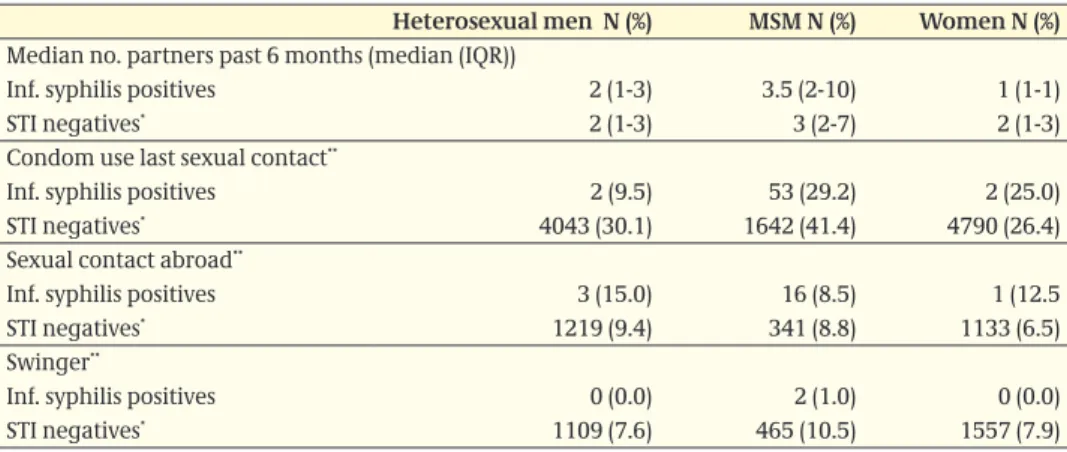
Table 5.4: Behavioural indicators of infectious syphilis cases compared to STI negatives by gender and sexual preference (NA GGD Amsterdam)
Heterosexual men N (%) mSm N (%) Women N (%)
Median no. partners past 6 months (median (IQR))
Inf. syphilis positives 2 (1-3) 3.5 (2-10) 1 (1-1)
STI negatives* 2 (1-3) 3 (2-7) 2 (1-3)
Condom use last sexual contact**
Inf. syphilis positives 2 (9.5) 53 (29.2) 2 (25.0)
STI negatives* 4043 (30.1) 1642 (41.4) 4790 (26.4)
Sexual contact abroad**
Inf. syphilis positives 3 (15.0) 16 (8.5) 1 (12.5
STI negatives* 1219 (9.4) 341 (8.8) 1133 (6.5)
Swinger**
Inf. syphilis positives 0 (0.0) 2 (1.0) 0 (0.0)
STI negatives* 1109 (7.6) 465 (10.5) 1557 (7.9)
* Negative for chlamydia, gonorrhoea, infectious syphilis, HIV, hepatitis B, herpes genitalis and genital warts ** Voluntary question
Screening pregnant women
5.3
Table 5.5: Syphilis prevalence estimates pregnant women (based on test results of first blood test and confirmation test)
Nr with first positive blood test Nr and % with con-firmation test Nr and % with a positive confirma-tion test prevalence estimate (%)* Nr with first posi-tive blood test Nr and % with con-firmation test Nr and % with a positive confirma-tion test prevalence estimate (%)* 2006/7 2005/6 312 225 (72.1) 138 (61.3) 0.07# 343 226 (65.9) 142 (62.8) 0.07# 0.10# 0.11# 0.12# 0.14#
* Prevalence estimated as: 1) minimal prevalence: number of confirmed positive test results divided by the total number of registered pregnant women; 2) under the assumption that pregnant women with a first positive test result without a confirmation test would be as often positive as those with a confirmation test; 3) under the assumption that all pregnant women with a first positive test result without a confirmation test would also have a positive confirmation test.
# In this estimate the indeterminate test results are interpreted as negative. This could lead to a small underestimation of the prevalence.
congenital syphilis
5.4
Figure 5.3: Number of tests of neonates and young infants (<1 year) suspected of being infected with congenital syphilis and the number of IgM positives, 1997-2008 (Source: CIb/LIS)
2008 100 70 80 90 30 1997 0 75 2 85 0 94 1 68 1 79 4 89 1 89 3 90 2 67 0 64 3 86 1 70 1998 1999 2000 2001 2002 2003 2004 2005 2006 2007 10 20 40 50 60 0 number of patients nr of tests nr of positives
HIV aNd aIdS
6
key points - StI centres
6.1
In 2008, 393 individuals were newly diagnosed with HIV at the STI clinics in the •
Netherlands, 320 HIV infections were diagnosed in MSM (81%), 43 HIV diagnoses among heterosexual men (11%) and 30 among women (8%).
Among MSM the positivity rate was 3.0% (in 2007 2.8%), among heterosexual men 0.2% •
(in 2007 0.1%) and among women 0.1% (in 2007 0.1%)
HIV test uptake has increased from 56% in 2004 to 90% in 2008 in STI clinic attendees •
who were not previously diagnosed with HIV.
Among heterosexual STI clinic attendees HIV positivity rate was highest among those •
from Sub Sahara African origin (men 2.0%, women 2.3%).
Among MSM, HIV positivity rate was highest among MSM aged 35-39 years (4.8%) •
Among newly diagnosed HIV positive MSM, 24% was concurrently diagnosed with •
chlamydia and 19% with gonorrhoea.
In total 2,194 were STI clinic attendees who were known HIV positive at entry in the •
clinic (97% MSM). Of those, 20% were diagnosed with chlamydia and 13% with gonor-rhoea.
key points - HIV treatment centres (Source: SHm)
6.2
A cumulative total of 15,538 HIV patients in care were reported to December 2008. •
For 313 cases the year of diagnosis was unknown (excluded from the analysis). In 2008, 1,329 new HIV patients were reported in care. Of these, 851 patients were •
newly diagnosed in 2008 (incomplete due to reporting delay).
The proportion of MSM accounting for new HIV patients in care increased the last four •
years, up to 68% in 2008. The proportion of heterosexuals decreased (2008: 26%). The proportion of new diagnoses among persons of 50+ years increased between 2000 •
and 2006, mainly due to new diagnosis among MSM.
A cumulative total of 7,777 AIDS cases and 4,794 deaths among HIV patients in care •
StI centres
6.3
Table 6.1: Number and percentage of positive tests of new HIV diagnoses at the STI centres by age, gender and sexual preference
age (years) Heterosexual men mSm Women
pos. tests % pos. pos. tests % pos. pos. tests % pos.
0-14 0 0.0 0 0.0 0 0.0 15-19 0 0.0 4 1.2 1 0.02 20-24 9 0.1 24 1.7 4 0.03 25-29 7 0.1 57 3.7 3 0.04 30-34 8 0.2 60 3.8 8 0.2 35-39 8 0.3 73 4.8 9 0.4 40-44 4 0.2 49 3.3 2 0.1 45-49 2 0.1 32 2.9 2 0.2 50-54 3 0.4 12 1.7 1 0.2 >55 2 0.2 9 1.0 0 0.0 Total 43 0.2 320 3.0 30 0.1
Figure 6.1: Total number and positivity rate of new HIV diagnoses by gender and sexual preference, STI centres, the Netherlands, 2004-2008
2008 2006 2007 2005 40000 45000 nr of tests women 15000 20000 2004 5000 10000 25000 30000 35000 0 4.5 5 0.5 1.5 0 2 2.5 3.5 nr of tests MSM nr of tests heterosexual men
women % pos heterosexual men % pos MSM % pos
4 3
Table 6.2: Number and percentage of positive tests of new HIV diagnoses at the STI centres by demographics, gender and sexual preference
Heterosexual
men (N=43) (N=320)mSm Women (N=30)
pos. tests % pos. pos. tests % pos. pos. tests % pos. Ethnicity
The Netherlands 15 0.1 231 2.7 7 0.02
Turkey 0 0.0 1 1.6 1 0.7
N.Africa/ Morocco 1 0.2 1 1.2 1 0.4
Sur./ Ant./ Aruba 7 0.3 14 5.1 5 0.2
Sub-Sah. Africa 15 2.0 3 5.0 14 2.3 Eastern Europe 2 0.8 11 5.3 0 0.0 Latin America 2 0.7 17 7.4 2 0.3 Asia 0 0.0 13 5.4 0 0.0 Europe other 1 0.2 8 3.5 0 0.0 Else 0 0.0 21 3.9 0 0.0 unknown 0 0.0 0 0.0 0 0.0 Client of CSW, men No 36 0.1 317 3.1
yes, in past 6 months 7 0.2 2 9.9
unknown 0 0.0 1 2.9
CSW, women
No 28 0.1
yes, in past 6 months 1 0.03
unknown 1 0.8
Previous HIV test
No 22 0.1 58 2.6 17 0.1
yes, positive 0 0.0 0 0.0 0 0.0
yes, negative 19 0.2 249 3.0 10 0.1
yes, result unknown 0 0.0 7 14.9 1 1.0
unknown 2 0.6 6 5.2 2 0.3
Previous GO/ CT/syphilis in anamnesis
yes 4 0.2 70 4.4 1 0.03
No 39 0.2 244 2.8 28 0.1
Don’t know 0 0.0 1 0.8 1 0.2
unknown 0 0.0 5 5.0 0 0.0
Table 6.3: STI diagnosed concurrently with a new HIV infection by gender and sexual preference at the STI centres
concurrent StI Heterosexual men
(N=43) N (%) (N=320) N (%) mSm (N=30) N (%) Women Chlamydia 4 (9.3) 78 (24.4) 2 (6.7) Gonorrhoea 5 (11.6) 62 (19.4) 0 (0.0) Infectious syphilis 1 (2.3) 32 (10.0) 1 (3.3) Genital herpes 1 (2.3) 4 (1.3) 0 (0.0) Genital warts 2 (4.6) 19 (5.9) 2 (6.7)
Table 6.4: Behavioural indicators of HIV cases compared to STI negatives by gender and sexual preference, (NA GGD Amsterdam)
Median no. partners past 6 months (median ±SD)
HIV positives 1 (1-2) 4 (2-7) 1 (1-1)
STI negatives* 2 (1-3) 3 (2-7) 2 (1-3)
Condom use last sexual contact**
HIV positives 5 (29.4) 48 (40.0) 3 (21.4)
STI negatives* 4043 (30.1) 1642 (41.4) 4790 (26.4)
Sexual contact abroad**
HIV positives 2 (11.1) 15 (12.8) 1 (8.3)
STI negatives* 1219 (9.4) 341 (8.8) 1133 (6.5)
Swinger**
HIV positives 1 (5.0) 1 (0.8) 1 (6.3)
STI negatives* 1109 (7.6) 465 (10.5) 1557 (7.9)
* Negative for chlamydia, gonorrhoea, infectious syphilis, HIV, hepatitis B, herpes genitalis and genital warts
** Voluntary question
Table 6.5: HIV positivity rates among STI clinic attendees and other test sites
Region and source 2000 2001 2002 2003 2004 2005 2006 2007 2008
mSm
STI clinic Amsterdam - Regular
- Anonymous* 5.7 % 4.7 % 3.8 % 4.2 % 5.7 % 6.0 % 4.0 % 3.5 % 3.5 % - Anonymous** 16.9 % 14.6 % 20.3 % 20.1 % 18.8 %# 19.4 % 21.5 % 21.9 % 29.3 %
STI clinic Rotterdam 5.1 % 1.9 % 3.5 %
- Regular 1.6 % 2.9 % 6.2 % 1.7 % 4.5 % 6.3 % 3.6 % 3.0 % 3.1 % - Anonymous* 10.8 % 12.0 % 13.4 % 22.4 % 32.1 % 25.7 % 38.5 % 58.4 % 60.7 %
- Anonymous** 3.6 % 12.5 % 13.0 %
STI (sentinel)
surveillance network - - - 3.3 % 4.2 % 5.0 % 3.1 % 2.8 % 3.0 %
Heterosexual risk groups
STI clinic Amsterdam - Regular, men - Anonymous, men* 0.3 % 0.6 % 0.5 % 0.3 % 0.2 % 0.3 % 0.3 % 0.2 % 0.2 % - Anonymous, men** 0.9 % 0.4 % 0.4 % 1.0 % 0.5 %# 0.0 % 0.4 % 0.4 % 0.3 % - Regular, women 0.1 % 0.4 % 0.1 % - Anonymous, women* 0.2 % 0.3 % 0.4 % 0.3 % 0.3 % 0.4 % 0.2 % 0.3 % 0.1 % - Anonymous, women** 0.6 % 0.3 % 0.8 % 0.5 % 0.2 %# 0.4 % 0.4 % 0.0 % 0.0 %
STI clinic Rotterdam 0.2 % 0.0 % 0.0 %
- Regular, men 0.7 % 0.4 % 0.3 % 0.5 % 1.0 % 0.3 % 0.2 % 0.1 % 0.2 % - Anonymous, men* 0.2 % 0.8 % 0.5 % 1.0 % 0.9 % 0.4 % 0.5 % 0.6 % 10.0 %
- Anonymous, men** 0.0 % 0.0 % 0.0 %
- Regular, women 0.2 % 0.4 % 0.3 % 0.3 % 0.3 % 0.2 % 0.2 % 0.1 % 0.2 % - Anonymous, women* 0.3 % 0.8 % 0.9 % 1.0 % 0.7 % 0.5 % 0.2 % 2.8 % 0.0 %
HIV treatment centres
6.4
all registered HIV cases
6.4.1
Table 6.6: Cumulative number of HIV cases by transmission risk group and gender
transmission risk group men (%) Women (%) total (%)
MSM 8276 (70%) - 8276 (54%)
Heterosexual contact 2092 (18%) 2812 (85%) 4904 (32%)
IDu 483 (4%) 182 (5%) 665 (4%)
Blood (products) 127 (1%) 71 (2%) 198 (1%)
Mother to child 91 (0.8%) 79 (2%) 170 (1%)
Needle stick injury 23 (0.2%) 6 (0.2%) 29 (0.2%)
Other/NK* 814 (7%) 169 (5%) 983 (6%)
Total 11906 3319 15225
* NK: not known
Footnote: only HIV patients with a known date of diagnosis are included (ATHENA: 1996-2001, national registration from 2002 to date (database March 2009, SHM)
Figure 6.2: Number of HIV cases (right axis: cumulative) by year of HIV diagnosis (blue bars) and year of registration (red bars)
1400 1600 1800 600 <1985 1986 1988 1990 1992 1994 1996 1998 2000 2002 2004 2006 2008 200 400 800 1000 1200 0 14000 16000 18000 6000 2000 4000 8000 10000 12000 0
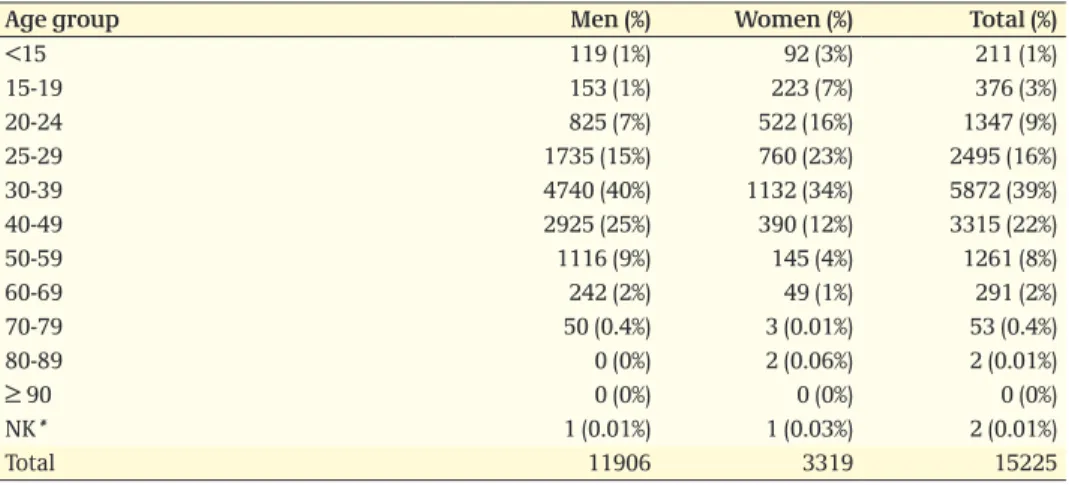
Table 6.7: Cumulative number of HIV cases by age group (year of diagnosis) and gender
age group men (%) Women (%) total (%)
<15 119 (1%) 92 (3%) 211 (1%) 15-19 153 (1%) 223 (7%) 376 (3%) 20-24 825 (7%) 522 (16%) 1347 (9%) 25-29 1735 (15%) 760 (23%) 2495 (16%) 30-39 4740 (40%) 1132 (34%) 5872 (39%) 40-49 2925 (25%) 390 (12%) 3315 (22%) 50-59 1116 (9%) 145 (4%) 1261 (8%) 60-69 242 (2%) 49 (1%) 291 (2%) 70-79 50 (0.4%) 3 (0.01%) 53 (0.4%) 80-89 0 (0%) 2 (0.06%) 2 (0.01%) ≥ 90 0 (0%) 0 (0%) 0 (0%) NK* 1 (0.01%) 1 (0.03%) 2 (0.01%) Total 11906 3319 15225 * NK: not known
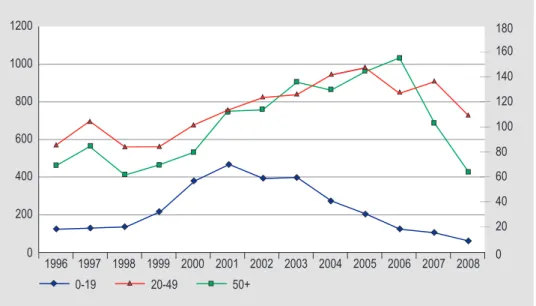
Figure 6.3: Proportion of annual HIV cases in care by transmission risk group and year of diagnosis (Source: SHM, 2008 incomplete)
70 10 30 20 40 50 60 80 0 MSM 1996 1997 1998 1999 2000 2001 2002 2003 2004 2005 2006 2007 2008 hetero (M) hetero (F) other/unknown
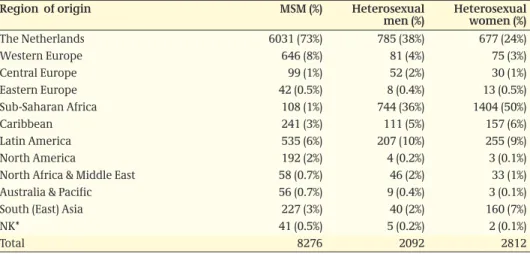
Table 6.8: Cumulative number of HIV cases by transmission risk group and region of origin
Region of origin mSm (%) Heterosexual
men (%) Heterosexual women (%)
The Netherlands 6031 (73%) 785 (38%) 677 (24%) Western Europe 646 (8%) 81 (4%) 75 (3%) Central Europe 99 (1%) 52 (2%) 30 (1%) Eastern Europe 42 (0.5%) 8 (0.4%) 13 (0.5%) Sub-Saharan Africa 108 (1%) 744 (36%) 1404 (50%) Caribbean 241 (3%) 111 (5%) 157 (6%) Latin America 535 (6%) 207 (10%) 255 (9%) North America 192 (2%) 4 (0.2%) 3 (0.1%)
North Africa & Middle East 58 (0.7%) 46 (2%) 33 (1%)
Australia & Pacific 56 (0.7%) 9 (0.4%) 3 (0.1%)
South (East) Asia 227 (3%) 40 (2%) 160 (7%)
NK* 41 (0.5%) 5 (0.2%) 2 (0.1%)
Total 8276 2092 2812
* NK: not known
Table 6.9: Cumulative number of HIV cases by transmission risk group (sexual) and age group
age group mSm (%) Heterosexual
men (%) Heterosexual women (%)
<15 1 (0.01%) 0 (0%) 5 (0.2%) 15-19 70 (0.9%) 42 (2%) 199 (7%) 20-24 562 (7%) 140 (7%) 453 (16%) 25-29 1262 (15%) 263 (13%) 660 (13%) 30-39 3355 (41%) 831 (40%) 992 (36%) 40-49 2095 (25%) 509 (24%) 330 (12%) 50-59 765 (9%) 227 (11%) 128 (5%) 60-69 144 (2%) 65 (3%) 41 (2%) 70-79 22 (0.3%) 15 (0.7%) 2 (0.1%) 80-89 0 (0%) 0 (0%) 2 (0.1%) ≥ 90 0 (0%) 0 (0%) 0 (0%) NK* 0 (0%) 0 (0%) 0 (0%) Total 8276 2092 2812 * NK: not known
Table 6.10: Cumulative number of HIV cases by transmission risk group (other) and age group
age group Idu blood
(prod.) mother to child Needle stick injury other/Nk*
<15 0 (0%) 24 (12%) 167 (98%) 0 (0%) 14 (1%) 15-19 17 (3%) 14 (7%) 1 (0.6%) 0 (0%) 33 (3%) 20-24 90 (14%) 21 (11%) 0 (0%) 2 (7%) 79 (8%) 25-29 130 (20%) 32 (16%) 0 (0%) 2 (7%) 146 (15%) 30-39 281 (42%) 62 (31%) 0 (0%) 7 (24%) 344 (35%) 40-49 132 (20%) 19 (10%) 0 (0%) 9 (31%) 221 (22%) 50-59 14 (2%) 17 (9%) 0 (0%) 5 (17%) 105 (11%) 60-69 1 (0.2%) 7 (4%) 0 (0%) 3 (10%) 30 (3%) 70-79 0 (0%) 2 (1%) 0 (0%) 1 (3%) 11 (1%) 80-89 0 (0%) 0 (0%) 0 (0%) 0 (0%) 0 (0%) ≥ 90 0 (0%) 0 (0%) 0 (0%) 0 (0%) 0 (0%) NK* 0 (0%) 0 (0%) 2 (1%) 0 (0%) 0 (0%)