Process evaluation of the Chlamydia
Screening Implementation in the
Netherlands: phase 1
Report 210261006/2009
RIVM Report 210261006/2009
Process evaluation of the Chlamydia Screening
Implementation in the Netherlands: phase 1
Challenges and opportunities during preparation and first operational phase
E.L.M. Op de Coul T.C. Weenen
M.A.B. van der Sande I.V.F. van den Broek
In collaboration with: J. E.A.M. van Bergen E.E.H.G. Brouwers E.M. de Feijter J.S.A. Fennema H.M. Götz C.J.P.A. Hoebe R.H. Koekenbier S.M. van Ravesteijn Contact: E.L.M. Op de Coul
Epidemiology and Surveillance, Centre for Infectious Disease Control
eline.op.de.coul@rivm.nl
This investigation has been performed by order and for the account of Ministry of Health, Welfare and Sport within V/210261/01/IE ‘Interventie en Evaluatieonderzoek’
© RIVM 2009
Parts of this publication may be reproduced, provided acknowledgement is given to the National Institute for Public Health and the Environment along with the title and year of publication.
Abstract
Process evaluation of the Chlamydia Screening Implementation in the Netherlands: phase 1
The Chlamydia Screening Implementation (CSI) for 16 to 29 year-old residents in Amsterdam, Rotterdam and South Limburg started in April 2008. The Public Health Services (PHSs)
implemented the screening, and STI AIDS Netherlands is coordinating the programme. The Centre for Infectious Disease Control RIVM in collaboration with the PHSs and STI AIDS Netherlands, is responsible for the process- and effect evaluation. The results will be crucial for deciding whether and how a national roll-out of Chlamydia trachomatis screening in the Netherlands will take place in the future.
The process evaluation of the preparatory phase and first operational phase examines the extent to which the programme is operating as intended and determines whether the target population has been reached. Overall, the results demonstrated that well-structured, comprehensive Chlamydia screening - with information technology (IT), logistic and laboratory components – has been developed and is operating efficiently. The project group itself, the commitment of all parties involved, and the successful outsourcing of IT and logistics were key factors of success. The complex programme management, underestimation of the workload, and postponement of the programme challenged the programme staff.
The participation rate in the first 2 months (15%) was lower than anticipated (30%).
Reminders contributed significantly to response - and participation rates. The participation rates were higher for women than for men. They were also higher for people more than 20 years old than for teenagers. Overall, 4.3% of the participants were positive for C. trachomatis.
The preliminary results from a survey among nurses and general practitioners (GPs) working with sexually transmitted infections (STIs) showed that participants, whether positive or negative for C. trachomatis, seek consultation, but there was no evidence for severe extra workload at these facilities. Most nurses and GPs referred and treated partners, but proceeded in various ways. Key words: Process evaluation, Screening, Chlamydia trachomatis
Rapport in het kort
Procesevaluatie van de Chlamydia Screening Implementatie in Nederland: de eerste fase
De Chlamydia Screening in Amsterdam, Rotterdam en Zuid-Limburg onder jongeren van 16 tot en met 29 jaar is in april 2008 succesvol van start gegaan. De technische uitvoering is goed verlopen, maar de participatiegraad valt wat tegen. Dit blijkt uit een eerste evaluatie van de voorbereiding en de eerste twee maanden van de uitvoering. De toekomstige besluitvorming over een landelijke screening op chlamydia in Nederland is afhankelijk van dit evaluatieonderzoek. Soa Aids Nederland coördineert de screening, die wordt uitgevoerd door de GGD’en van de drie regio’s. Het Centrum voor Infectieziektenbestrijding (CIb) van het RIVM evalueert het programma in samenwerking met bovengenoemde partijen.
De screening is bedoeld om seksueel actieve jongeren in twee rondes te screenen op Chlamydia. Onder hen komt deze geslachtsziekte het meest voor. De jongeren kunnen na een schriftelijke oproep via een website een testpakket aanvragen. De combinatie van IT, logistiek en
laboratoriumwerk maakte de screening een complexe aangelegenheid. Factoren die de uitvoering bevorderden waren de expertise van de projectgroep zelf, de grote inzet van alle betrokkenen en de geslaagde uitbesteding van IT en logistieke zaken. Belemmerende factoren waren de veelheid aan betrokken partijen, de onderschatting van de werkbelasting en tijdsinvestering en daarmee het uitstel van het programma.
Eerste resultaten screening
De participatiegraad in de eerste twee maanden was 15%, lager dan vooraf geschat was geschat (30%). Herinneringsbrieven en e-mails droegen in belangrijke mate bij aan de deelname. Vrouwen deden vaker mee dan mannen. Personen tussen de 20 en 29 jaar deden vaker mee dan 16 tot 19 jarigen, bij wie vaker chlamydia is geconstateerd.
Uit de eerste cijfers blijkt dat 4,3% van de deelnemers de geslachtsziekte had. De screening leidde niet tot een ernstig verhoogde werkdruk bij soa-centra of huisartspraktijken. De meeste
verpleegkundigen en huisartsen benoemden het belang om partners te waarschuwen; de wijze waarop zij zijn benaderd verschilde.
Contents
Summary 9
1 Background 11
1.1 Epidemiology 11
1.2 Historical perspective 12
1.3 Implementation of Chlamydia Screening 13
2 Aims and objectives 15
2.1 First process evaluation 15
2.2 Main research questions 15
3 Organisation of the Chlamydia Screening 17
4 Process evaluation: technical design 19
4.1 Framework 19
4.2 Data collection 19
4.2.1 Quantitative data collection 20
4.2.2 Qualitative data collection 20
5 Interview results: preparation phase 23
5.1 Project group 23 5.2 Working groups 23 5.3 Advisory committee 24 5.4 Project planning 24 5.5 Logistics 25 5.6 Communication 25 5.7 Information technology 26 5.8 Laboratories 27 5.9 Finances 27
6 Interview results: first operational phase 29
6.1 Project group 29
6.2 Logistics 29
6.3 Information Technology 29
6.4 Laboratories 30
6.5 Other issues 30
7 Monitoring: first months of screening 31
7.1 Performance monitoring 31
7.1.1 Invitations for screening 31
7.1.2 Undeliverable letters 32
7.1.3 Time process of reminder invitations 32
7.1.4 Time from invitation to requesting test package 32 7.1.5 Time needed to handle the test package 33 7.1.6 Time from posting the package to the return of the sample 34
7.1.7 Laboratory processes 35
7.1.8 Re-testing results 35
7.1.10 Time between availability and checking of test result 37
7.1.11 Overall process time 38
7.2 Participation monitoring 38
7.2.1 Participation rate and informed consent 38 7.2.2 Women’s specimen choice: urine versus swab 42
7.2.3 Completed questionnaires 43
8 Functioning of the risk score: first evaluation 45
9 Helpdesk questions 49
9.1 Aids STI info line 49
9.2 Public Health Service telephone lines 49
9.3 Information technology helpdesk 50
10 Healthcare providers’ experiences 51
10.1 Preliminary results 51
11 CSI participants visiting the STI centres 55
12 Conclusions and future considerations 57
12.1 Program management and collaborations 57
12.2 Process-, performance- and participation monitoring 58
12.3 Health care providers’ experiences 60
12.4 General points and conclusions 60
References 63
Appendix 1 - List of screening organizers 65
Appendix 2 – (Interview) questionnaires 67
Appendix 3 – Description of Block A 75
Appendix 4 – Flowchart technical processes 77
Appendix 5 – Outline process monitoring 79
Appendix 6 – Outline performance monitoring 80
Appendix 7 – Promotional Poster 83
Appendix 8 – The website 85
Appendix 9 – Website visitors 87
Appendix 10 – Media publicity 88
Summary
Chlamydia trachomatis (Ct) is the most prevalent bacterial sexually transmitted infection (STI) in the Netherlands; an estimated 60,000 cases occur annually. About half of the infections are detected and treated. The Ministry of Health, Welfare and Sport decided to start a screening programme in three regions.
The Chlamydia Screening Implementation (CSI) is a first large-scale intervention, piloting a sustainable, selective, systematic and internet-based Chlamydia Screening during the period 2008-2010. A total of 315,000 16 to 29-year-old residents of Amsterdam, Rotterdam and South Limburg are being invited to two screening rounds. In the high-prevalence urban areas, all sexually active people are encouraged to participate, while in the lower-prevalence area of South Limburg only those who match a certain risk-profile are invited. The Public Health Services (PHSs) have implemented the screening, and STI AIDS Netherlands is coordinating the programme.
The Centre for Infectious Disease Control, RIVM, in collaboration with the PHSs and STI AIDS Netherlands, will provide a process and effect evaluation. The results will be crucial for deciding whether and how a national roll-out of Chlamydia trachomatis screening in the Netherlands will take place in the future. Here, we describe the results of the first process evaluation of the preparatory and first operational phase. The evaluation includes observing daily processes, interviews with screening organizers, document review and analysis of the screening database. Overall, the results show that well-structured, comprehensive Chlamydia screening - with Internet technology (IT), logistic, and laboratory components – has been developed and is operating efficiently. The project group itself, the commitment of all parties involved, and the successful outsourcing of IT and logistics were key factors in the success. Complex programme management, underestimation of the workload and postponement of the program challenged the programme staff. The thorough preparation, however, clearly contributed to the good functioning of IT, logistic and laboratory processes. Delays in processing samples, the website being out of order during one weekend, and some wrongly delivered invitation letters and test packages were minor obstacles. In the period of April to June 2008, 57,000 invitations were sent. The overall response rate (requested packages) was 21%. The overall participation rate (returned samples) was 15%, which was lower than the anticipated 30%. Reminders contributed significantly to response and
participation rates. Participation rates among women were higher than among men. They were also higher among people aged 20 years or more than among teenagers. Specific recommendations to enhance participation rates should be considered. An extra reminder was sent to encourage the return of samples. Of the returned samples, 4.3% were positive for C. trachomatis (women: 4.3%, men: 4.2%).
Preliminary results from a survey among nurses and general practitioners working with STIs showed that both C. trachomatis-positive and - negative screening participants seek consultation, but there was no evidence for severe extra workload at these facilities. Most nurses and general practitioners referred and treated partners, but proceeded in various ways. The acceptability and non response results are not included in this first evaluation, but will be described when more results are available.
1
Background
1.1
Epidemiology
Chlamydia trachomatis (Ct) is the most prevalent bacterial sexually transmitted infection (STI) in the Netherlands, an estimated 60,000 cases occur annually [Van Bergen et al., 2006, 2007]. About half of the infections are detected and treated; STI centres see approximately 8,000 cases annually and general practitioners see an estimated 28,000 cases.
The Chlamydia pilot study [Pilot Ct, Van Bergen et al., 2005] shows an overall prevalence of 2% among participants in four areas. The prevalence of C. trachomatis was higher (3.2%) in the large cities.
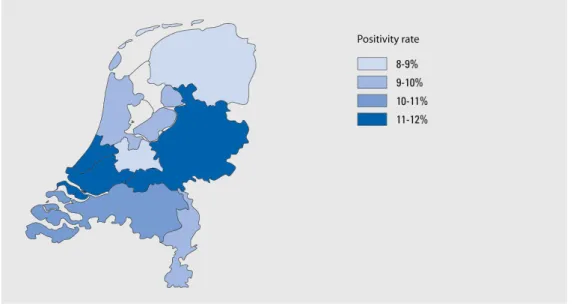
The overall Ct-positivity rate in the national registry of the STI centres was 10.1% in 2007 (Figure 1). The highest rates of infection occurred among young people, especially in the group aged 15-25 years [Van den Broek et al., 2008]. Of the three regions participating in the screening, Ct-positivity rates at the STI centres are highest in Rotterdam (2007: 13.4%), especially in the group aged 16-19 years (20.6%). In Amsterdam and South Limburg, the positivity rates were 11.0% and 10.6%, respectively (Figure 2).
Figure 1: Positivity rates for genital Chlamydia infection at the STI centres, by region, 2007
C. trachomatis is largely asymptomatic and the disease burden is determined by (late) complications in women: pelvic inflammatory disease (PID), tubal factor infertility (TFI), ectopic pregnancy and neonatal infections. C. trachomatis has also been associated with preterm delivery [Rours et al., 2008]. Early detection and treatment of Ct-infections are a strategy to reduce complications in infected individuals and to limit the spread of the infection in the population.
0 5 10 15 20 25 %
Chlamydia positivity rate
Amsterdam 16,5 11,4 8,9 7,4 11 Rotterdam 20,6 13,7 10,5 6,6 13,4 Zuid-Limburg 14,1 10,1 9,7 6,8 10,6 16t/m19 20t/m24 25t/m29 >29 Totaal
Figure 2: Positivity rates for genital Chlamydia infection at STI centres, by screening region, 2007
1.2
Historical perspective
Dutch national Chlamydia screening has been subject of debate for many years. The Dutch Health Council was reluctant to agree to national screening for C. trachomatis, partly because population- based data were not available, which seems a prerequisite before embarking on screening at the national level [GR, 2004].
During 2002 and 2003, a pilot study was carried out in four regions in which 21,000 adolescents were invited to participate in a home screening programme (Pilot Ct). The study showed that Chlamydia infections were particularly prevalent in the major cities and amongst specific risk groups [Van Bergen, 2005]. The evaluation of the pilot study showed that the Public Health Services (PHSs) are well equipped to conduct the screening, and the low-threshold approach was much appreciated by the participants.
In view of the outcomes of the pilot study, STI Aids Netherlands recommended starting selective screening in a few regions. The minister endorsed this advice and asked for a pilot implementation [Dutch Organisation for Health Research and Development (ZONMw)]. During an expert meeting in January 2006, the experts decided to start this pilot implementation in two major cities and in one less urbanized area.
The aims of the Chlamydia Screening Implementation (CSI) are to seriously start Chlamydia screening in the Netherlands and to determine its feasibility, effectiveness and cost-effectiveness. The results of this implementation programme will provide data for a decision regarding a national Chlamydia screening programme.
1.3
Implementation of Chlamydia Screening
The Chlamydia Screening Implementation started in three regions in the Netherlands in April 2008. In total, approximately 315,000 young adults (16-29 years old) are eligible to participate. In view of the statutory regulations, those younger than 16 years have been excluded from the programme. The decision to include people aged 25 to 29 years relates to the relatively high prevalence found in this group in the Ct pilot study (2.1% of the male participants and 2.9% of the female participants) [Van Bergen et al., 2005].
The selection criterion for participation in the major cities is sexual activity (i.e. experience with sexual intercourse). On the basis of this criterion, the expected prevalence is more than 3% (4% among the sexually active in the Pilot Ct). Information in brochures and on the website particularly encourages the participation of members of the high-prevalence target groups (e.g. individuals with more than one sexual partner, individuals with new sexual partner(s), people originating from Surinam or the Netherlands Antilles, and those with a lower social-economic status.
For South Limburg, where we expect the Ct-prevalence to be lower, we use a risk score that selects people at higher risk. This risk score, adopted from the Pilot Ct [Götz et al., 2005], includes the place of residence, age, education, Ct-related symptoms, condom use, ethnic group, number of sexual partners, and new partner(s) in the last year.
The providers of the screening are the PHSs in Rotterdam, Amsterdam and South Limburg. STI AIDS Netherlands is coordinating the programme.
2
Aims and objectives
A process evaluation examines the extent to which a programme is operating as intended by assessing ongoing programme operations and determining whether the target population is being served [WHO, 2000; Bliss et al., 2002].
Here, we describe the results of the first process evaluation of the Chlamydia Screening
Implementation which started in April 2008. Outcome measurements such as uptake of invitations are described only briefly, since participation rates, numbers of detected and treated Chlamydia infections, nonresponse, and acceptability of the screening will be described in detail elsewhere.
2.1
First process evaluation
As a new programme moves from planning to the operational phase, the organizers often discover obstacles in the programme delivery. Therefore, this first process evaluation focuses on the preparatory and first operational phase. It includes both quantitative and qualitative research methods that are complementary and that were used simultaneously.
We used interviews and questionnaires among key stakeholders and health care providers (e.g. nurses, general practitioners (GPs), and helpdesk employees), to obtain insights into the bottlenecks and successes during the early stage of the programme (qualitative research). We studied documents from project group meetings and analysed data from the screening database (quantitative research) to monitor the process, performance, and participation.
2.2
Main research questions
• What were the main bottlenecks and successes in the preparation and first operational phase of the CSI programme in the views of the screening organizers and health care providers? • How did the screening proceed in the first months (process and performance monitoring)?
Is the implementation consistent with quality standards?
• What adjustments to the programme were needed to reach an optimum way of operating? • What proportion of the eligible invitees participated? And what are their main
3
Organisation of the Chlamydia Screening
To evaluate ongoing processes, an assessment of all logistic - and technical steps in that process was made (Figure 3 and Appendix 4). In the three regions, the PHSs send invitations to addresses taken from the municipal population registers. In Amsterdam, GPs send part of the invitations (6%) to addresses in the patient information system. In total, approximately 315,000 invitation letters will be sent in the first screening round (Amsterdam: 150,000; Rotterdam: 125,000, South-Limburg: 40,000).
The invitation letter contains a personal log-in code that enables the invitee to request a test package via the website (www.chlamydiatest.nl). The website provides information about Chlamydia infections, consent issues, sample taking and optional questionnaires. People who do not respond to the invitation receive a reminder letter 1 month later (Figure 3).
Respondents receive the test package at their home address or another address if they prefer. The test package includes a sample kit (men: urine; women: vaginal swab or urine) that can be sent in an envelope for biological material (Polymed) to the regional certified laboratory (Figure 4).
Figure 4: Polymed (left) and blister (right)
Individuals who have not returned the sample to the laboratory receive a reminder e-mail 2 weeks later. Nucleic amplification techniques (NAAT) are used to test the samples for C. trachomatis. Participants receive an e-mail stating when the test result will be available. Participants who have not provided an e-mail address have to track their own test results. The test result can be obtained via Internet with a username and password. Participants, who have not checked their results, receive a reminder e-mail message. Ct-positive participants also receive an SMS message (if a mobile phone number is provided). Individuals with a Ct-positive result receive an online letter (*pdf) which can be printed. The letter includes the test result and information for healthcare providers (GPs and STI centres) about medical treatment, treatment during pregnancy and information about partner notification and treatment. Treatment is to be provided primarily through the GP or, if preferred, at the STI centre. Ct-positive participants who have not checked the result on-line receive a letter with the result at the address provided.
The target population will be invited in phases (district by district, in random order) in two
screening rounds with separated by 1 year. Ct-positive participants automatically receive a new test package 6 months after diagnosis.
4
Process evaluation: technical design
4.1
Framework
The process has been evaluated according to the Centres for Disease Control (CDC) guideline and other guidelines for health programme evaluation [CDC, 1999/2007; WHO, 2000]. First, we approached various screening organizers to find out what they expected from the evaluation. Then, we described the programme beginning to end and determined the objectives of evaluation. Although informal evaluation is ongoing in routine practice, having evaluation standards helped us determine whether the evaluated activities were well designed. Important standards such as utility, feasibility, propriety, and accuracy were applied in this evaluation. The standards were intended to ensure that the evaluation served the information needs of the users (utility). Feasibility standards were intended to ensure that the evaluation is realistic and procedures are practical. Furthermore, the evaluation should be legally and ethically correct (propriety) and should reveal technically adequate information (accuracy).
4.2
Data collection
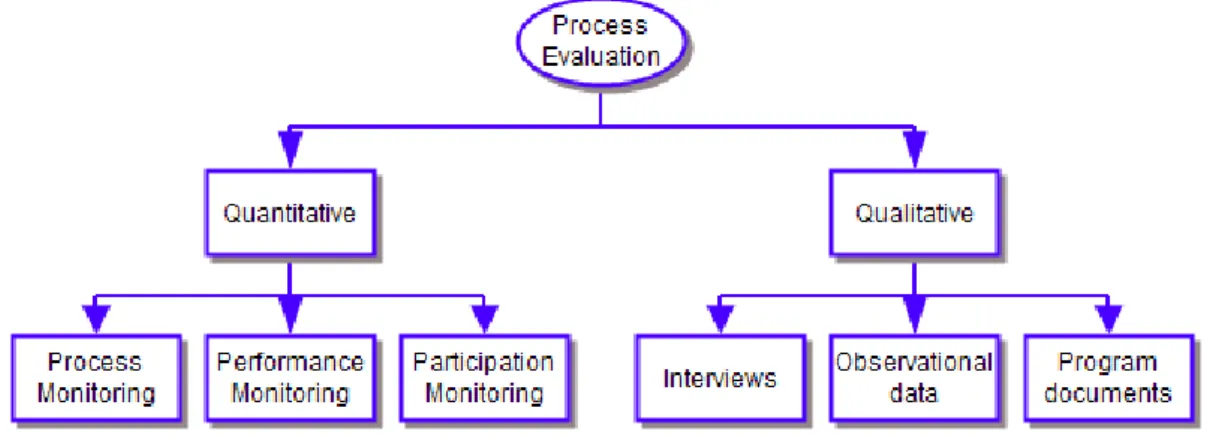
We used a mix of qualitative and quantitative data sources for the process evaluation (Figure 5). This mix included interview data (programme staff and external partners), electronic questionnaires (healthcare providers), programme documents (meeting reports, memos, protocols et cetera), observational data, and information from the screening database.
Figure 5: Data collection for process evaluation
We analysed the screening database to determine the performance and uptake of the screening. This ‘live’ database is automatically generated from IT processes during the screening. It contains regularly updated databases from the municipal administrations (monthly updates), laboratory results, and website outputs of track records of each individual responding to the invitation, received test package, test results, completed questionnaires et cetera, including dates when these events took place. An anonymised database was extracted every week for the evaluation. For technical details see Appendix 4.
4.2.1 Quantitative data collection
To guarantee optimal screening, different types of monitoring were used: process, performance, and participation monitoring.
Process monitoring is conducted on a daily and weekly basis to obtain information about daily errors in the regional setting (Appendix 5). Feedback from participants contacting the helpdesk is passed on to the regional coordinators. This allows the coordinators to quickly respond to errors and to optimize procedures in the programme from the beginning. The programme coordinators from the three PHSs collected quantitative data and did the analyses regionally.
Performance monitoring is conducted to obtain information about key aspects of how the programme is operating; whether and to what extent prespecified programme objectives are attained. We developed quality indicators to guarantee optimal execution of the programme
(Appendix 6). The screening database was analysed monthly to provide coordinators with feedback, allowing them to take timely action and to determine whether actions had positive effects on the programme. See Appendix 6 for the performance checklist.
The purpose of participation monitoring is to study (region-specific) use of the screening, participation rates, and characteristics (i.e. gender, age, country of origin) of the participants in relation to the target population. We describe the participation rates briefly (chapter 7); details of nonresponse will be published elsewhere.
4.2.2
Qualitative data collection
Observational dataMeetings were scheduled at different locations, including the laboratories and companies (IT and logistics) directly involved in the screening programme. The aim was to obtain insight into the daily procedures at these locations. The observational information collected from these meetings was used to prepare interview questionnaires for the screening organizers.
Interviews
Interviews were scheduled with the various parties involved (Appendix 1). Project coordinators (from PHSs and STI AIDS Netherlands) were interviewed about their key roles in the programme and in the working groups. The four working groups coordinated the IT processes, logistics (mailings of invitation letters and test packages), communication (development of screening materials, advertising, and website), and laboratory processes.
The interview topics included the functioning of the project group and working groups, as well as bottlenecks and successes within the four sections mentioned above. One or two people from each external company (logistics, communication, and IT), were interviewed, including contacts for the project group. Everybody agreed to be interviewed face to face.
The interviews, based on semi-standardized questionnaires (Appendix 2), included expected and experienced bottlenecks and successes in the programme preparation and first operational phase. The questionnaires were based on the process evaluation of the Pilot Ct and were adjusted as necessary on the basis of the information gathered in observational meetings (chapters 5 and 6). A checklist for validating evaluation questions was used for further revision of the questionnaires [Bliss et al., 2002].
On-line questionnaires
Healthcare providers (STI centres and GPs) were approached with an on-line questionnaire (Questback programme, Appendix 2). The questionnaire included topics that provided information about the screening, treatment of participants, partner notification and treatment, and STI testing (chapter 10).
Data analysis
All interviews were recorded and transcribed. Text fragments were labelled with names or descriptions. Rough labels were created before the interviews took place; more detail was added during the analysis of the interview texts. Labels referred to people, products, situations, and processes. The interview subjects were: the functioning of the project group and the working groups (logistics, communication, IT, and laboratories). Other labels, such as project coordination, schedule and finances, were included during the interviews, and an inventory of the program successes was made.
During the analysis, problems, causes, (possible) solutions and successes were grouped by question. Labels were assigned to sentences or parts of them, and placed in analysis tables. These tables were classed by (1) phase of the programme (preparation versus operational) and (2) problems versus successes. To identify underlying root causes of the problems, we used the causal tree method to analyse the data (not shown).
We used descriptive statistics in SAS (version 9.1) and SPSS (version 16.0) to analyse data from the screening database. We designed a performance and participation monitoring list to measure frequency tables and time processes efficiently.
5
Interview results: preparation phase
Project group members were interviewed about the functioning of the project group and four working groups. Commercial partners were interviewed about collaboration with project group members and their tasks within the screening programme. In total, 14 interviews took place.5.1
Project group
Members: 10 (2 per organisation)
Interviewed: 8 (two people responsible for the evaluation were excepted)
Successes. All interviewees stated that the project group had been effective and that it consisted of the right combination of different people. Most people had experience with Chlamydia research and three of them had participated in the Pilot Ct; their experience was well used in the screening programme. Another positive aspect mentioned was that each coordinator assigned a colleague to assist him/her in the programme. This was a good decision since all coordinators were working on other projects as well. The project group much appreciated the flexibility of the organization financing the program (ZonMW), who provided the programme with an adequate budget and were lenient when postponement of the programme was needed.
Communication. Communication within the project group is done by e-mail, telephone and monthly meetings. The monthly meetings aim to keep everyone informed about programme proceedings, having discussions and making decisions. All interviewees mentioned that communication within the group had been challenging at times during the preparations. On the one hand, a great many programme documents were sent by e-mail (often too much to read in preparation for meetings), but on the other hand, project group members sometimes felt they were not well enough informed. One of the underlying causes of miscommunication was the great pressure of time and its corresponding stress. Despite some misunderstandings, the overall atmosphere in the group was good.
Decision-making. Another challenge was the size of the project group. The group of ten people made it difficult to make decisions. People had opposite opinions, which resulted in time-consuming discussions. To solve this, the project coordinator, who was also chairman of the meetings, set up stricter rules for discussion time and agenda items. Smaller working groups that included at least one member of the project group were formed. These working groups worked on specific subjects and were only to discuss the more important subjects with the project group.
5.2
Working groups
Communication: 4 members (PHS: 3, STI AIDS Netherlands:1) Laboratory: 5 members (PHS: 2, laboratories:3)
IT: 4 members (PHS: 4)
Logistics: 2 members (PHS: 2)
Efficiency. Four working groups (IT, logistics, communication, and laboratories) were formed to facilitate the decision-making process and to delegate the workload by assigning specific tasks. The project leaders of the PHSs were responsible for the working groups. Although the working groups were formed to speed up decisions, sometimes they caused delays (for external partners as well). The project group, who only met once a month, still had to make important decisions. Furthermore, the structure of the various groups was inefficient at times, because processes - such as IT and logistics - were closely linked, which resulted in items being discussed twice. In general, the interviewees were positive about the working group structure that resulted in a thorough preparation of the screening programme.
5.3
Advisory committee
Members: 10 (external advisors and project group members (auditors)) Interviewed: 4 (project group members)
The main tasks of the programme advisory committee are (1) to advise the project group about the development of the screening programme, communication and diagnostic issues, and outcomes of the screening; and (2) to assist in the programme evaluation. The project group invited experts on Chlamydia testing, population screening, gynaecology, public health epidemiology, and family practice to be part of the advisory committee.
Meetings with the committee were planned to take place every 6 months for obtain their advice on various topics. At the time of this evaluation, three meetings with this committee had taken place. The project group members appreciated the feedback and advice from the committee. The committee filled in gaps in the expertise of the project group members, and since committee members were less directly involved, they could reflect on the programme from a certain distance.
5.4
Project planning
Coordination: 2 (STI AIDS Netherlands)
Interviewed: 8 (coordinator and seven project group members)
Coordination. Due to the size and comprehensiveness of the programme, coordination was tough. The project coordinator had to deal with complex financial contracts and tendering, but encountered no major obstacles. The overall opinion of the project group members was that STI AIDS
Netherlands was the right partner for the job. Coordination was more difficult at the beginning of the preparations. Over time, the coordinator applied a stricter management style that was needed to adhere to schedules and planned goals.
Timing. The planned preparation time for the screening was 6 months, but the actual time needed was more than a year. The main cause of the delay was underestimation of the size and complexity of the programme. All local project leaders emphasized the fact that, before preparations had started, they had assumed that many organizational aspects from the Pilot Ct could be used. However, many issues needed to be reconsidered, and the Internet set-up was completely new. Furthermore, the handling of legal requirements, which were obligatory due to the size of the programme, were time consuming.
The interviewees mentioned other reasons for the delay:
• The selection of external, commercial partners took more time; • Some external partners had little experience with large-scale projects;
• The delivery of the databases from municipalities was time consuming due to incompatible data formats and restraints in providing data about ethnic background in one municipality. Although the postponement of the program was regarded as a bottleneck, it also resulted in a thorough preparation of the screening. ‘Quality first’ was very important for all project group members.
5.5
Logistics
Logistic working group: 2 members (2 interviewed) Logistic company: 2 people interviewed
Logistic processes were to be coordinated regionally during the preparatory phase. To improve efficiency, it was later decided to organize logistics centrally. Therefore, logistics needed to be put out to tender. The main tasks of the logistics company were printing of the invitation letters, assembling test packages, and planning the delivery of letters and packages. Members of the working group were asked about logistic processes and collaboration with the logistics company. Conversely, the logistics company was interviewed about their experiences and collaboration with project group members.
Contract negotiations. Two companies were selected from various companies that were invited to provide financial proposals. The negotiator was the project leader of the IT working group, who was assisted by an experienced negotiator from the Amsterdam PHS. The company with the most experience in medical and re-closable packaging was chosen.
Preparation phase. Several project group members visited the logistics company. In the beginning, project members had some doubts about the capacity of the company to handle large-scale
distributions of region-specific packages. However, the company had advantages as an experienced partner in medical packaging material, although printing and posting was not their main area OF expertise. The worry proved to be unnecessary, as from the start of the screening the logistic processes matched the requirements. Interviewees from this company mentioned that they felt pressured to finish the preparation on time, even though processes were delayed.
Collaboration. Overall, collaboration between the various parties was successful. At first,
communication was difficult for the logistics company due to the large number of contact persons. This situation was altered so that there was one contact person in order to achieve more structure in communication. The project members mentioned that their collaborating partner was indeed available, and solved problems quickly when asked.
5.6
Communication
Communication working group: 4 members (2 interviewed) Communication consultancy: 1 person interviewed
Contract negotiations. Pre-negotiations were conducted with various parties in communication, and one was appointed as the preferred partner. Although there was only a small budget for
communication, this company was able to provide an adequate communication plan. They designed the lay-out of the brochures, advertisements, and website. Students from the St. Lucas College in Boxtel made the videos for the website. All communication materials were pre-tested among a panel of 18 people aged 16 to 29 years, men and women from various ethnic groups.
Collaboration. The communication working group collaborated with this company during these preparations. One obstacle in the collaboration was the different expectations of these two parties. The working group expected a more editorial role from the communication company. The communication experts, stated that this had not been made clear to them, and that it would be difficult since they had little know-how about Chlamydia infections or screening programmes. The company also regretted that the portrayal of the screening did not have a more ‘national’ feeling (‘that everyone is invited’) instead of the regional approach.
Communication. Communication was slightly inflexible and too formal at times, according to one project group member. Furthermore, the development of the website took longer than planned since the processes also involved the IT group. However, the fast production of promotional brochures and posters speeded things up, and there were no serious delays. The company was easily reached and customer friendly. They quickly grasped what the project group wanted. The project group was satisfied with the final products (Appendices 7 and 8).
5.7
Information technology
IT working group: 3 members (2 interviewed) IT company: 1 person interviewed
Contract negotiations. Three contract proposals were received from various IT companies. The company with experience in building large database applications in the public health field was chosen as the partner.
Tasks. The development of the website was challenging, since the company was experienced in databases, but less so in designing websites. The graphic representation of the website took more time than expected, but ultimately the website functioned well. According to the interviewees, having the company build both the website and the database saved time.
Collaboration. Members of the IT working group described the testing of the application as labour intensive. They said that better agreements about testing any future application after new releases are essential. The contact person from the IT working group said that the communication with the IT company was always very structured.
Overall, the IT processes went well. One problem was that an externally built conversion
application was needed for reading the format of the population register data. A great advantage of the current CSI application is that it can be used in future screening projects involving laboratory tests. We note that maintenance costs are relatively low compared to development costs.
5.8
Laboratories
Laboratory working group: 5 members (4 interviewed).
Contract negotiations. The PHS in each region appointed one laboratory to test the samples. Negotiations with laboratories were hampered by requirements for test procedures. Prices were fixed and based on the pooling of samples. Project group members had assumed that each laboratory would pool samples for C. trachomatis testing. This was described as standard methodology in the programme proposal on the basis of experience in the Pilot Ct. Due to the sampling methods and the handling of samples, this was not the choice for two laboratories.
An important issue to be negotiated was the project group’s request to re-test all Ct-positive samples, if the samples were not pooled. This condition was set to confirm positive cases and minimize false-positive results, although this is not regular practice at these laboratories. The laboratories agreed that false-positive results should be minimized, but they regretted the project group’s late communication. The re-testing also resulted in higher costs than anticipated for the laboratories.
Procedures. The head of one laboratory mentioned that he expected that the whole logistic process would be tested with real samples rather than with electronic ‘virtual’ records. This could have prevented some of the problems described in section 6.3.
Quality control. A topic repeatedly discussed at meetings of the project group and the laboratory working group was the different testing methods used in each laboratory. Although sensitivity and specificity of all three Chlamydia tests are high (> 98% and > 99%, respectively), various
discussions about the potential differences in test results took place. Finally, it was decided that each laboratory could perform its own tests with their own routine quality control procedures, as this would be the situation if Ct-screening were implemented nationally. Exchanging samples between laboratories was not considered necessary: in any case, it was difficult to test samples from other laboratories due to different collection devices (dry versus wet) and buffers (GenProbe Aptima, Probetec buffer, and Roche Cobas CT/NG).
Timing. All three laboratories found the postponements of the programme unpleasant. They were ready for testing before the initial launch of the programme, and the delay affected staff planning.
5.9
Finances
The STI AIDS Netherlands’s budget control proceeded smoothly according to the interviewees. Costs for laboratories were met the price agreements, but were based on pooling instead of single testing. This made laboratory costs higher due to re-testing of all Ct-positive samples. Coordination costs were higher and due to numerous adaptations outside the contract, and IT-costs were also higher. However, money was saved by centralizing the logistics. Communication funds were spent on the website and folders. The budget for communication was relatively small, and large media campaigns were not an option. However, free media publicity was good when the screening started and large campaigns were not planned due to the systematic character of the screening (not
6
Interview results: first operational phase
The same screening organizers (chapter 5) were interviewed about their experiences during the first 2 months of the operational phase of the Chlamydia Screening programme. Here, we summarize the main achievements and constraints that the interviewees mentioned.6.1
Project group
The main success, as most project group members mentioned, is that they had managed to set up well-organized Chlamydia Screening with each component (IT, logistics, laboratories, and communication) functioning well. Although some issues described below happened in the first weeks, the chain of processes functioned adequately.
6.2
Logistics
The logistics company expressed concern about personnel planning if screening responses were lower than expected. They would have too many employees and not enough packages to assemble, which would cause a financial loss. This problem did not occur in the course of the programme. In June 2008, the company reported a 1-day delay for a batch of invitation letters due to printing problems. This meant a 4-day delay for the target population since the letters were delivered only twice a week. Second-line print facilities were arranged after this event occurred.
Overall, postal handling of the invitation letters went well, with the exception of a few instances of delivery problems (stacks of letters delivered to a single address). The postal company started an internal investigation among their employees, and the issue was solved.
6.3
Information Technology
Various project group members mentioned that, although they trusted the IT component, they feared a breakdown of the web application, which would immediately affect the programme. In the fourth weekend of May, a website problem occurred. Various participants notified the IT helpdesk that they were unable to log in. The problem was caused by an improperly tuned database parameter and was solved the next day.
Software problems occurred in one laboratory. Samples that had to be re-tested were assigned the same participation number as the initially tested samples. The software was not designed for this, and laboratory staff had to carry out operations manually.
6.4
Laboratories
One person from the laboratory working group and two regional project leaders mentioned the issue of sample storage. If many participants gave informed consent for saving their samples, this would lead to storage problems, especially in the large cities.
In the 3rd week of June, test results were not passed to the database application in another
laboratory, resulting in a stack of test results. The problem was quickly solved, but caused a delay of several days in the transfer of test results to participants.
In one large laboratory, the testing machine broke down twice, in weeks 25 and 26, which caused a delay in sample testing. A back-up machine was used during that period.
Samples were rejected more often than anticipated in one of the laboratories. Reasons for rejection: too much urine in the test tube or a participant had handled a test tube incorrectly.
Pooling was difficult in the first few weeks due to the small number of samples that arrived at the laboratory. This caused failure to meet set time limits in one laboratory.
6.5
Other issues
Although reallocation of finances was needed, overall costs in the first phase of the programme did not exceed the planned budget.
Almost all project group members mentioned that they feared a low response rate to the screening, which could affect effectiveness and cost-effectiveness. They also mentioned that, due to the risk score in South Limburg, some people were excluded from participation. The helpdesk received some protests from people who were excluded, but wanted to participate. The first evaluation of the risk score is described in chapter 8.
7
Monitoring: first months of screening
The Chlamydia Screening Implementation (CSI) started in April 2008. Performance andparticipation were monitored so that we could follow the proceedings in the early operational phase (1st 2 months of invitations), and to determine whether the programme was reaching the targeted population. Data from the screening database were analysed to determine screening outcomes such as time processes and uptake of invitations. Regular process monitoring using a fixed set of indicators is an integral part of the management information system.
Here, we limit the analyses to the data from Block A, the first group of invitees selected for effect evaluation purposes (details described elsewhere). Block A covers one-sixth of the population to be screened in Amsterdam and Rotterdam and one-third of the population in South Limburg
(Appendix 3). Invitations to this group were sent from the start (mid-April) until the first week of June 2008.
7.1
Performance monitoring
Success (or quality) indicators and a performance monitoring checklist were developed to monitor the logistic processes. Variables that were analysed are described in Appendices 4 and 6.
7.1.1
Invitations for screening
Cluster sequenceThe mailing of invitation letters is divided into three blocks (A, B and C) of selected
neighbourhoods (or clusters). In Amsterdam, 83 clusters were defined; in Rotterdam 62, and in South-Limburg 47.
Block A covered the first 2 months of screening and included 13 clusters in Amsterdam, 10 in Rotterdam and 16 in South Limburg (Appendix 3). The population sizes of the clusters varied from 1083 and 3846 inhabitants for Amsterdam, 384 to 4127 for Rotterdam and 472 to 1771 for South Limburg.
Data analysis showed that people in 37 of the 39 clusters were invited according to the planned sequence for the outcome evaluation (stepped wedge design, not shown). Two consecutive clusters in Amsterdam were switched with 1 day in between, which is no problem for the outcome
evaluation.
Delivery of invitation letters was finished within 3 days for most (67%) of the clusters. Due to a planned stop week between mailings, the distribution of the invitations took longer (13-14 days) in two clusters in Amsterdam and Rotterdam.
Invited population
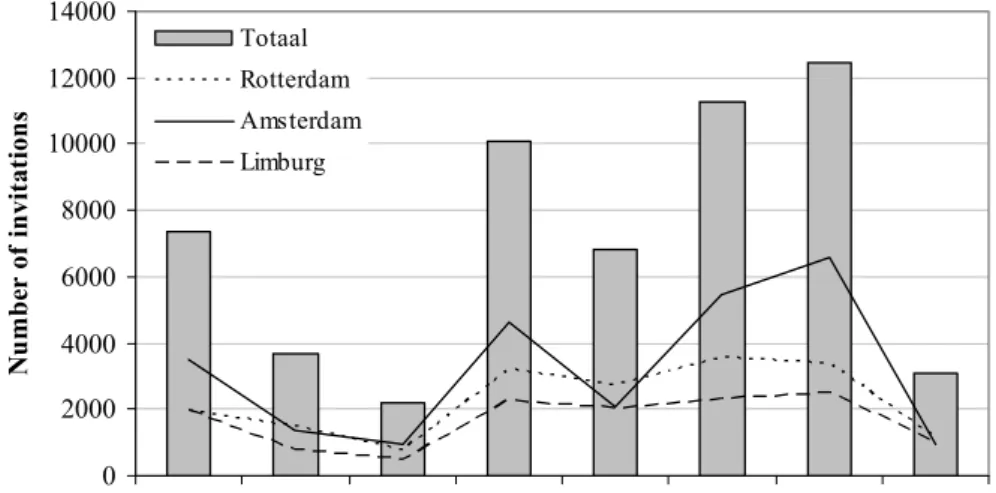
In block A, 57,000 invitation letters were sent during weeks 16 to 23 (Figure 6). Of these, 25,519 (45%) were sent in Amsterdam, 18,188 (32%) in Rotterdam, and 13,293 (23%) in South Limburg. Of the invitees, 51.6% were women and 48.4% were men.
Altogether, 3776 persons (6.6%) were categorized as ‘not to invite again’. Of these, 2660 people (70.4%) had reached the age of 30 years. 1066 persons (28.2%) had moved to another
area and 9 people had died (0.2%). Forty-one people (1%) had reached the maximum age and also moved to another area.
0 2000 4000 6000 8000 10000 12000 14000
Week 16 Week 17 Week 18 Week 19 Week 20 Week 21 Week 22 Week 23
N u m b er of i n vi tat ion s Totaal Rotterdam Amsterdam Limburg
Figure 6: Number of invitations sent per week (Block A)
7.1.2
Undeliverable letters
A special post office box was opened for returned invitation letters. Given that not everyone will return mail addressed to another person, the minimum of undeliverable letters can be described. In Amsterdam, 1.7% of the invitations were returned, in Rotterdam 1.3%, and in South Limburg 1.0%. In addition, the postal company returned a small number of undeliverable letters.
7.1.3
Time process of reminder invitations
A reminder letter is sent in a computerized process 1 month after the initial invitation if the invitee has not responded. 99.5% of the reminders were sent on day 28 or 29. A total of 225 reminders (0.5%) were delayed (≥ 30 days). Reasons for the delay were likely mutations in population registers (people moving away).
NB: The calculations are based on the date of preparation of the invitation list, which can take 1-4 days before the
invitee receives the letter (Appendix 6).
7.1.4
Time from invitation to requesting test package
The time people took to order the test package varied from 2 to 196 days (median: 16 days) at the time of analysis.
0 100 200 300 400 500 600 700 800 2 6 10 14 18 22 26 30 34 38 42 46 50 54 58 62 66 70 74 78 82 86 90 94 98 102 106 110 115 119 125 129 133 137 >140 Time (days) Fr eq u en c reminder y
Figure 7: Time (days) from invitation to test package request
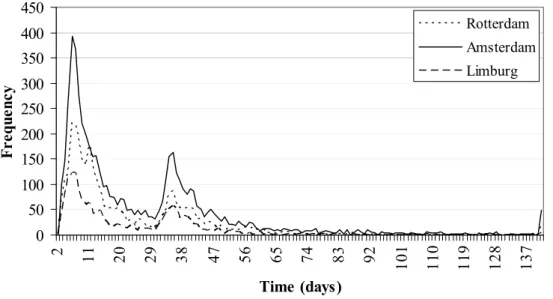
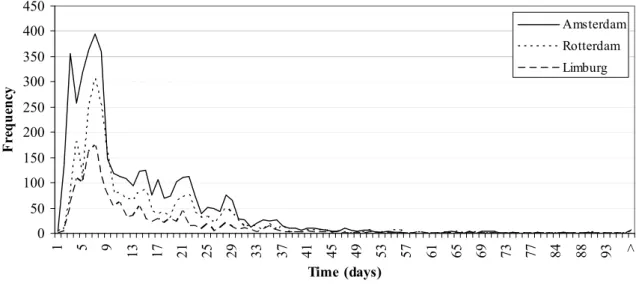
Of the 10,822 people ordering the test package (19%), 48% ordered it within 2 weeks, 64% within 1 month, and 94% within 2 months (1 month after the reminder). A group of 6% responded late: i.e. between 2 to 6.5 months after the initial invitation (Figure 7). Trends were similar for the three regions (Figure 8). 0 50 100 150 200 250 300 350 400 450 2 11 20 29 38 47 56 65 74 83 92 10 1 11 0 11 9 12 8 13 7 Time (days) Fr eq ue nc y Rotterdam Amsterdam Limburg
Figure 8: Time (days) from invitation to test package request, by region
7.1.5
Time needed to handle the test package
The time between the package request and the logistic company’s posting the package is shown in Figure 9. Most packages (99.8%) were sent within 4 days, of which 70.9% were sent within 1 day. Twenty-six packages took 5 to 22 days to distribute.
0 1000 2000 3000 4000 5000 6000 7000 8000 0 1 2 3 4 5 6 7 8 10 11 12 13 14 16 22 Time (days) F re q ue nc y
Figure 9: Time (days) from test package request to posting of the package by the logistic company
7.1.6 Time from posting the package to the return of the sample
0 100 200 300 400 500 600 700 800 900 1000 1 5 9 13 17 21 25 29 33 37 41 45 49 53 57 61 65 69 73 78 85 90 99 103 109 117 Time (days) F re que n cy Reminder 1 Reminder 2
Figure 10: Time (days) from package sending and the returning sample to the laboratory
Altogether, 8533 of 10,822 samples (79%) were returned to the laboratories. A total of 205 people (1.9%) requested a second package (e.g. package was not received, lost, or sampling failed). The time from the logistics company posting the package to the participant’s returning the sample, varied from 1 to 161 days (median: 9 days). Forty percent of the participants return the sample within 1 week, 66% within 2 weeks and 92% within 1 month. Eight percent return the sample 1 to 5.5 months after the package is sent (calculated at the time of analysis). A clear effect in the return of samples was seen after the two reminders (2 and 3 weeks after ordering the package: Figures 10 and 11).
0 50 100 150 200 250 300 350 400 450 1 5 9 13 17 21 25 29 33 37 41 45 49 53 57 61 65 69 73 77 84 88 93 > Time (days) F re que nc y Amsterdam Rotterdam Limburg
Figure 11: Time (days) from package sending to returning the sample to the laboratory, per region
In total, 2289 test packages (21.2%) were not returned to the laboratories (Amsterdam: 21.5%, Rotterdam: 21.7%, South Limburg: 19.8%). For more information: see section 7.2.
7.1.7
Laboratory processes
Laboratory processes that were monitored included the time between receipt of the sample and the availability of the Chlamydia test result, time from the laboratory knowing the test result and its availability on the website, and the proportion of re-tested samples. One of the programme targets set for laboratories was a maximum of 10 working days to inform participants of their test results.
7.1.8
Re-testing results
Test results were available for 8548 people, while arrival of the samples was registered for 8533. Presumably, 19 samples arrived at the laboratory without documentation of the arrival. Furthermore, arrival of 4 samples was registered, but no test result was available. It is likely that these four were incorrectly documented.
8533. Presumably, 19 samples arrived at the laboratory without documentation of the arrival. Furthermore, arrival of 4 samples was registered, but no test result was available. It is likely that these four were incorrectly documented.
Of the 8548 test results, 8134 were Ct-negative (95.2%), 369 were Ct-positive (4.3%) and 45 failed (MIS result, 0.5%). The 45 people were asked to send a second sample, and 31 people did (68.9%). Of these 31, 18 people were Ct-negative (58.1%), 12 (38.7%) failed the second time and one test result was not registered. People with a test result that failed twice were advised to go to the GP or STI clinic for a new Chlamydia test. Two hundred and five people requested a new package on their own initiative, of whom 170 returned a sample to the laboratory (83.0%). Of these, 160 were Ct-negative (94.2%) and 10 were Ct-positive (5.9%).
Of the 8548 test results, 8134 were Ct-negative (95.2%), 369 were Ct-positive (4.3%) and 45 failed (MIS result, 0.5%). The 45 people were asked to send a second sample, and 31 people did (68.9%). Of these 31, 18 people were Ct-negative (58.1%), 12 (38.7%) failed the second time and one test result was not registered. People with a test result that failed twice were advised to go to the GP or STI clinic for a new Chlamydia test. Two hundred and five people requested a new package on their own initiative, of whom 170 returned a sample to the laboratory (83.0%). Of these, 160 were Ct-negative (94.2%) and 10 were Ct-positive (5.9%).
7.1.9
Time needed for processing samples
7.1.9
Time needed for processing samples
Figure 12 shows the overall time between the arrival of the sample and the availability of the test result on the website. For 96%, test results were available within 14 days. These samples fulfilled the agreed target of 10 working days (+ weekends). In laboratory 2, fewer test results were available after 15 days or more (0.2%) than in laboratories 1 and 3 (both 5.3%). Reasons for the delays were: Figure 12 shows the overall time between the arrival of the sample and the availability of the test result on the website. For 96%, test results were available within 14 days. These samples fulfilled the agreed target of 10 working days (+ weekends). In laboratory 2, fewer test results were available after 15 days or more (0.2%) than in laboratories 1 and 3 (both 5.3%). Reasons for the delays were:
not enough samples to run the machine, failure of the test machinery, and technical malfunction in the application for sending the result to the database (chapter 6).
0 500 1000 1500 2000 2500 3000 3 5 7 9 11 13 15 17 19 21 23 25 27 29 37 46 53 Time (days) F re que nc y
Figure 12: Time from receiving the sample and the availability of the test result
The proportion of test results available within the agreed period was more than 90% in all weeks at all laboratories (Figure 13).
50 60 70 80 90 100 110 Lab 2 100 100 98,9 99,8 99,6 100 100 100 Lab 1 98,2 96 96,4 94,2 93,5 94,2 93,2 93,6 Lab 3 98,2 96,2 91,7 96,6 94,4 93,8 92,2 95,7
Week 16 Week 17 Week 18 Week 19 Week 20 Week 21 Week 22 Week 23
0 2 4 6 8 10
Total NEG MIS POS
Type of result M ean t ime ( d ay 12 14 16 s) Lab 1 Lab 2 Lab 3
Figure 14: Mean time from sample arrival at the laboratory and availability of the test result on the website, by result
Processing Ct-positive test results took longer than negative results due to the re-testing of positive samples. In laboratory 2, no failures (MIS results) were reported. In laboratory 1, processing times were longer in the first weeks than in the other labs due to the use of a new testing machine.
7.1.10
Time between availability and checking of test result
In total, 8540 people received a message that their test result was available on-line, and 7951 people (93.1%) checked their results on the website. Time between availability and checking the result varied from 0 to 197 days. Most participants (76.3%) checked their results within 2 days (54.3% the same day, Figure 15); 88.2% checked their results within 1 week and 92.8% within two weeks. The results were similar for the three regions.
0 500 1000 1500 2000 2500 3000 3500 4000 4500 5000 3 7 11 15 19 23 27 31 35 39 43 47 51 55 59 63 67 71 75 Time (days) F re que nc
y Letter with test result (only for
Ct-positives who didn’t check their result)
Of the 8540 people who received a message that their test results were available on-line, 589 did not check (6.9%). Of these people, 560 were Ct-negative (95.1%), 8 failed the test (1.3%) and 21 were Ct-positive (3.6%). These 21 people (12 women and 9 men) each received a letter with the result 7 weeks after availability at the addresses they provided.
7.1.11
Overall process time
The overall time between the invitation and the date of checking the test result was monitored in order to determine truncation dates for data analysis on participation rates in the upcoming months.
0 50 100 150 200 250 11 17 23 29 35 41 47 53 59 65 71 77 83 89 95 101 107 113 119 125 131 139 145 >150 Time (days) Fr eq u en cy
Figure 16: Overall process time; from date of invitation to checking the test result by the participant
The time between the invitation and getting the test result varied from 11 to 233 days (Figure 16). Half of the participants finished the process within 45 days. In 110 days, 95% had finished the whole procedure. The results were similar for the three regions (not shown).
7.2
Participation monitoring
The participation rate for the Chlamydia Screening is continuously monitored. We monitor characteristics such as age, gender, and country of origin to be able to study the representativeness of the participants compared to the invited population.
7.2.1
Participation rate and informed consent
Uptake of invitationsOf the 57,000 invitees in Block A, 10,822 requested the Chlamydia test package (19.0%); 7267 women (67.2%) and 3555 men (32.8%). In Amsterdam, 5667 people requested the test package (22.2% of all invitations) and in Rotterdam 3358 (18.5%, Figure 17). In South Limburg, 2955 people (22.2%) intended to order the package and filled in the risk score questionnaire. Taken together, the overall response rate is 21%. In South Limburg, 63% were able to participate, and
most (96.3%) requested the test package. This constitutes 13.5% of the invitees in South Limburg (Figure 18).
Invitations Amsterdam (n=25.519)
Persons requesting package
(n=5.667, 22.2%) package (n=19.852, 77.8%)Persons not requesting test
Persons returning sample (n=4.458, 78.7%)
Persons not returning sample (n=1.209, 21.3%) Invitations Rotterdam
(n=18.188)
Persons requesting package (n=3.358, 18.5%)
Persons not requesting test package (n=14.830, 81.5%)
Persons returning sample (n=2.633, 78.4%)
Persons not returning sample (n=725, 21.6%)
Figure 17: Response rates (package request) and participation rates (sample return) in Rotterdam and Amsterdam
Invitations South-Limburg (n=13.293)
Persons filling in questionnaire on risk profile (n=2.955, 22.2%)
Persons not filling in questionnaire (n=10.337, 77.8%) Persons able to participate
(n=1.866, 63.2%)
Persons not able to participate (n=1.089, 36.8%) Persons requesting test package
(n=1.797, 96.3%)
Persons not requesting test package (n=69, 3.7%) Persons returning sample
(n=1.441, 80.2%)
Persons not returning sample (n=356, 19.8%)
Figure 18: Response rate (filling in risk score questionnaire) and participation rate (sample return) in South Limburg
Of the 10,822 people who requested the test package, 8533 (78.8%) returned a sample and thus became participants. Women more often returned a sample (81.3%) than men did (73.8%; chi-square test p < 0.001). The proportions of returned samples were regionally comparable: South Limburg 80.2%, Rotterdam 78.4% and Amsterdam 78.7%.
0% 20% 40% 60% 80% 100% 16 (n=892) 17 (n=3067) 18 (n=3144) 19 (n=3267) 20 (n=3614) 21 (n=3834) 22 (n=4165) 23 (n=4426) > 23 (n=26178) Age Participation No participation
Figure 19: Participation rates by age
The participation rates increased with age, to the age of 22 years. Presumably, younger age groups (16-19 years) participate less often since fewer of them have become sexually active.
0%
20%
40%
60%
80%
100%
Netherlands (n=30351) N. Antilles & Aruba (n=1122) Surinam (n=3184) Turkey (n=4173) M orocco (n=4973) Ghana (n=90) Cape verdian Islands (n=665) Other (n=12442)
Participation No participation
Figure 20: Participation rates by country of origin
People originating from Turkey and Morocco participate less often than other groups (p < 0.001).
Unreturned samples
In total, 2290 samples (21.2%) were not returned after two reminders were sent. One hundred and twenty-eight people answered the on-line question why they did not return a sample. The three main reasons were: I didn’t have time to sent it back (24.2%), I never received the package (16.4%) and I
forgot to return the sample (14.1%) (Table 1). The question was answered by 52 people who did return a sample. Their most common answer was: I didn’t have time to send it back (42.3%). Presumably, after filling in the questionnaire, they decided to return a sample after all. Strangely, 13% stated that they never received the package although they did return a sample. The mean time between requesting the package and returning the sample was 48 days in this group, which differs significantly (Student’s t-test, p < 0.0001) from the time for the general participants (14 days). The 76 persons who never returned a sample, reported other main reasons (Table 1).
Table 1: Reasons for not returning the sample for a Chlamydia test
Most important reason for not returning sample N=76 (people not returning the sample) N=52 (people returning the sample) N=128 (total group)
I never received a test package 14 (18.4%) 7 (13.5%) 21 (16.4%) I didn’t have time to sent it back 9 (11.8%) 22 (42.3%) 31 (24.2%)
I forgot 13 (17.1%) 5 (9.6%) 18 (14.1%)
I lost the test package 7 (9.2%) 1 (1.9%) 8 (6.3%) I changed my mind about participation 10 (13.2%) 0 (0%) 10 (7.8%) Someone discouraged me to participate 0 (0%) 0 (0%) 0 (0%) I didn’t understand how to take the sample 0 (0%) 0 (0%) 0 (0%) I am already treated for Chlamydia in the
meantime
5 (6.6%) 4 (7.7%) 9 (7.0%) I am already tested for Chlamydia in the meantime 3 (4.0%) 0 (0%) 3 (2.3%) I am afraid that the test will show that I have
Chlamydia and I’d rather not know
1 (1.3%) 0 (0%) 1 (0.8%) I don’t know if the test result will remain private 0 (0%) 0 (0%) 0 (0%) I took the sample the wrong way 1 (1.3%) 0 (0%) 1 (0.8%) Other reasons 13 (17.1%) 13 (25.0%) 26 (20.3%) Note: due to small numbers results may not be representative for all people not returning a sample
Reasons for not participating in the screening
People who decided not to participate in the screening can sign themselves out on the website and give their main reason. Altogether, 293 people (0.5%) reported that they were not interested in participating, and 103 of them gave a reason. A total of 36.9% reported that they had not yet had sexual intercourse, 12.6% believed that they were not at risk of Chlamydia, 12.6% did not
participate because they had no symptoms of Chlamydia infection, 9.7% had already been tested for Chlamydia in the last 6 months, 7.8% were not interested in participating, and 5.8% had no time to participate. The remaining 14.8% mentioned other or not specified reasons.
Note: due to small numbers results may not be representative for all nonparticipants. Results from the large-scale nonresponse study will be published elsewhere.
Informed consent
When invitees log in on the website, they can fill in three informed consent forms. With the first form, they agree to participate in the screening; with the second one, they consent to storage of a sample, and with the third one, they agree that they can be approached for future STI related research. Of the participants, 4851 people (57.1%) consented to sample storage and 4394 (51.7%) for future approach. In total, 4007 people consented to sample storage and future approach.
7.2.2
Women’s specimen choice: urine versus swab
The default option on the website for women requesting a test package is a vaginal swab. However, 7.3% of the women requested the urine package. The choice for a swab or urine sample differed among ethnic and age groups (p < 0.0001, Figures 21 and 22). Moroccan and Turkish women chose the urine package (28.1% and 31.1%, respectively) more often than Dutch women (4.9%) and women from other ethnic groups. Women aged 18 or 19 years also chose the urine package more often. 0% 20% 40% 60% 80% 100% 16 (n=27) 17 (n=145) 18 (n=197) 19 (n=265) 20 (n=327) 21 (n=361) 22 (n=470) 23 (n=476) > 23 (n=3543) Age Urine Swab
Figure 21: Proportion of women choosing the swab or the urine test, by age
0% 20% 40% 60% 80% 100%
Netherlands (n=3999) N. Antilles & Aruba (n=121) Surinam (n=354) Turkey (n=122) Morocco (n=121) Ghana (n=6) Cape verdian Islands (n=78)
Other (n=1108) Swab Urine