Sofie Schellinck
Promotor:
Prof. Dr. José C. Martins
Co-promotor:
Prof. Dr. Annemieke Madder
Academic year 2019-2020
A dissertation submitted to Ghent University in partial fulfilment
of the requirements for the degree of Master of Science in
Chemistry
A COMBINED NMR AND
IN SILICO
INVESTIGATION OF DOX6,
Acknowledgements
First and foremost, I am extremely grateful to Prof. Dr. José C. Martins for his valuable expertise and feedback throughout the evolution of this thesis. His contagious enthusiasm about the subject, used methodologies and obtained results motivated me to give the best of myself.
I would also like to extend my deepest gratitude to my supervisor, Anne-Mare, for the unwavering guidance, valuable advice and enthusiasm upon seeing interesting results. This accomplishment would not have been possible without her encouragement.
My special thanks are also extended to the members of the NMRSTR for helping me when needed and for the interesting and funny conversations during lunch breaks and in between all the work.
I also had the great pleasure of sharing this experience with my fellow students. I am especially grateful to Eline and Stéphanie for the awesome five years full of laughter, shared moments of stress, well-needed lunchbreaks, uplifting words and most importantly the friendship.
Last but not least, I also would like to acknowledge the unfailing support and patience of my family throughout my study. As cliché as it sounds, I could not have done this without them.
Table of Contents
ACKNOWLEDGEMENTS ... I TABLE OF CONTENTS ... II ABBREVIATIONS ... IV CHAPTER 1: INTRODUCTION ...1 1.1.AN INTRODUCTION TO DNA... 11.2.DNA BASED APTAMERS... 3
1.3.APTAMERS FOR ANTIBIOTIC DETECTION ... 6
1.4.THE PROBLEM WITH APTAMERS ...7
1.5.THE DOX6 APTAMER AND ITS DOXYCYCLINE TARGET ... 8
CHAPTER 2: AIMS, SCOPE AND OBJECTIVE ... 11
CHAPTER 3: METHODS ...14
3.1.NUCLEAR MAGNETIC RESONANCE (NMR) SPECTROSCOPY ... 14
3.1.1. Assigning a DNA duplex ... 14
3.1.2. Titrations of DOX6 with doxycycline ... 23
3.2.MOLECULAR DYNAMICS (MD) ... 24
3.2.1. Dihedral angles in DNA and analyses methods used ... 25
CHAPTER 4: RESULTS AND DISCUSSION ... 28
4.1.WHAT IS THE INFLUENCE OF THE BULGE ON THE DUPLEX PART? ... 28
4.1.1. Binding studies with doxycycline ... 33
4.2.SOLUBILITY AND STABILITY OF DOXYCYCLINE ... 35
4.3.THE INFLUENCE OF THE LOOP ON THE DUPLEX PART. ... 39
4.3.1. Duplex part without bulge: comparison of stemDOX6 and DOX6_ZB ... 40
4.3.1.1. NMR spectroscopy ... 41
4.3.1.2. MD simulations ... 42
4.3.2. Duplex part with bulge: comparison of bulgeDOX6 and DOX6_MB ... 43
4.4.THE INFLUENCE OF THE BULGE ON THE APTAMER STRUCTURE ... 45
4.5.CONCLUSION... 49
CHAPTER 5: CONCLUSION AND FUTURE PROSPECTS ... 50
CHAPTER 6: PRODUCTS, PROCEDURES AND PROTOCOLS ...54
6.1.SAMPLE PREPARATION OF THE SUBSYSTEMS ... 54
6.1.1. Desalting of oligonucleotides ... 54
6.1.4. Dialysis ... 55
6.2.NMR MEASUREMENTS/STUDIES... 55
6.2.1. Titrations of stem- and bulgeDOX6 with doxycycline ... 56
6.3.DETERMINATION OF THE MELTING TEMPERATURE TM ... 57
6.4.PRODUCTS... 58
6.5.SAFETY ... 59
CHAPTER 7: ADDENDA ... 60
7.1.NMR SPECTRA & ASSIGNMENT ... 60
7.1.1. stemDOX6 ... 60
7.1.2. bulgeDOX6 ... 62
7.1.3. loopDOX6 ... 63
7.1.4. DOX6_ZB ... 64
7.1.5. Doxycycline ... 65
7.2.MELTING TEMPERATURE CURVES ...68
Abbreviations
AMR Anti-Microbial Resistance DNA Deoxyribose Nucleic Acid RNA Ribose Nucleic Acid EML Essential Medicines List
ITC Isothermal Titration Calorimetry
nESI MS nano-Electrospray Ionization Mass spectrometry NMR Nuclear Magnetic Resonance
NOESY Nuclear Overhauser Effect Spectroscopy MD Molecular Dynamics
PCR Polymerase Chain Reaction RNA Ribose Nucleic Acid
SELEX Systematic Evolution of Ligands by Exponential enrichment WHO World Health Organisation
Chapter 1: Introduction
1.1. An introduction to DNA
Ever since its discovery, deoxyribose nucleic acid (DNA) has been a topic of intense research. Multiple scientists such as Pauling, Corey, Gosling, Wilkins, Franklin and many others proposed structures for the macromolecule constituting the genetic information of all living things including viruses. But it was not until 1953 that the double stranded helical structure of DNA was proposed by J. D. Watson and F. H. C. Crick, two scientists, American and English respectively, doing research at the Cavendish laboratory in Cambridge. They were the first to propose a structure made up of two instead of three chains coiled around the same axis. Together with M. H. F. Wilkins, they received the Nobel Prize in Physiology or Medicine in 1962 for ‘their discoveries concerning the molecular structure of nucleic acids and its significance for information transfer in living material’ [1].
From there on, research on DNA and the closely related RNA increased tremendously, as has its societal impact. Just looking at the Nobel Prizes awarded to DNA related research, one can see the vast role it has played in obtaining knowledge about genes and cellular mechanisms. DNA related discoveries rewarded by a Nobel Prize in Physiology or Medicine include the interpretation and function of the genetic code in protein synthesis, the polymerase chain reaction (PCR) method and oligonucleotide-based, site-directed mutagenesis for protein studies [1, 2].
Because of the large amount of research and publications, DNA is nowadays one of the best known molecular structures and easily recognized by the general public. Going into detail, one sees that the double stranded DNA (dsDNA) forms a helical structure made up of two complementary single strands of DNA (ssDNA) kept together by hydrogen bonds and base stacking. Each ssDNA is made up of nucleotides linked together by a 3’-5’ phosphodiester bond. More specifically, a DNA-nucleotide consists of a phosphate group, a deoxyribose sugar and an aromatic base (the last two forming a nucleoside). Depending on the base linked to the sugar by the glycosidic bond, different nucleotides can be formed.
For DNA, there are four different bases: adenine (A), guanine (G), thymine (T) and cytosine (C). The first two constitute the purines and the last two the pyrimidines (figure 1.1).
Figure 1.1: Structures of a DNA nucleotide and the bases ; numbering will be used during the assignment of the spectra according to [3] (chapter 3).
Two nucleobases can hybridize to form base pairs stabilized by specific hydrogen bond interactions (figure 1.2). In the DNA double helix, the purines A and G form so called Watson-Crick base pairs by hydrogen bonding with their complementary pyrimidine bases T and C respectively. The AT Watson-Crick base pair involves formation of two hydrogen bonds while the GC Watson-Crick base pair features three hydrogen bonds resulting in a stronger hydrogen-bonded base pair compared to the AT one. The combination of a purine and pyrimidine allows the constant inter-strand distance required to form the regular double helical structure while introducing hydrogen bond arrangements that contribute to duplex stability.
Figure 1.2: Watson-Crick base pairs (i) Adenine-Thymine; (ii) Guanine-Cytosine.
and can be found in/between molecules containing N-H, C-F or O-H bonds. This loss in strength is due to the geometric constraints within the double helix. However, because the bases are planar, they can be stacked upon each other thereby providing extra stability due to Van der Waals interactions.
Depending on the characteristics of the sugars (puckering C2’ endo vs C3’ endo), the solution conditions and the particular base sequence, different forms of double stranded DNA can occur. The best-known structure is B-DNA, a traditional right-handed double helix with a diameter of 2.0 nm and a nucleotide repeating unit described by Watson and Crick. Two other forms are A-DNA (a right-handed double helix with a diameter of 2.3 nm, a nucleotide repeating unit and a hollow cylinder as the centre) and Z-DNA (a left-handed double helix with a diameter of 1.8 nm and a dinucleotide repeating unit) which however, are only mentioned for completeness and will be of no further concern here .
Figure 1.3: From left to right: A-DNA, B-DNA, Z-DNA. 1.2. DNA based Aptamers
Further research into the structure and characteristics of DNA and nucleic acids in general, contributed to the discovery and development of new nucleic acid based techniques and applications in biotechnology, (bio)medical, analytical and environmental sciences.
One of those recent applications are aptamers. This new class of so called ‘affinity ligands’ are short single stranded oligonucleotides generated for the first time in 1990 by two separate research groups that were developing an in vitro selection and amplification procedure (SELEX) to isolate RNA sequences that could potentially bind certain predefined targets with high specificity [5, 6].
In the early stages of this research topic, mostly RNA sequences were used in the belief that they could be folded into more functional motifs and form binders with higher affinity. However, studies proved that one could equally use DNA sequences to yield aptamers [7]. On top of that, these DNA-aptamers show some advantages. Their selection and application is easier due to the higher chemical and biological stability of DNA. They are also more robust and easier to synthesise, and the corresponding SELEX procedure is more time and cost effective [8]. It is generally accepted that the high affinity of aptamers (with equilibrium dissociation constants KD situating in
the pM to mM range for their designated target(s)) originates from a folding process of the oligonucleotide chain induced by the target. The interactions between target and aptamer are so specific that a small change in target or aptamer can result in a less effective binding. Therefore, the structure of both target and aptamer and the capability of the aptamer to fold upon binding and to incorporate small molecules or integrate in larger structures itself, is essential for the correct functioning of these systems [9, 10].
In literature, 2D schemes or cartoons are typically used to illustrate the aptamer and its interaction with the target. However, one should approach these representations with caution as they suffer from a variety of issues. Indeed, here aptamers are visualised as planar, ‘flat’ structures. But, one must take into account that they are three-dimensional structures with certain secondary/tertiary structural elements. The structure of aptamers is mostly determined by the sequence of the single stranded oligonucleotide and the possibility to form base pairs. The presence of complementary parts makes it possible to form stem-loop structures (also called hairpins), internal loops, bulges etc. [9]. These structural motifs stabilise the aptamer and create possible binding sites for the target molecules. For example a hairpin consists of a helical structure for the stem while the loop can adopt different conformations creating in some cases a characteristic binding pocket for the target molecule.
Since aptamers bind and interact with their targets through a structural recognition process akin to that of an antibody-antigen reaction, aptamers are often compared to natural protein-based antibodies. However, there are some fundamental differences/advantages [10-13]:
▪ Compared to these natural antibodies, there is no in vivo production needed for aptamers. Once the sequence of the aptamer is known, it can be synthesized in the lab.
▪ Whereas antibodies are pre-folded proteins featuring a ligand binding site characterized by high affinity and specificity, aptamers are generally proposed to behave as flexible chains that become folded around its target through some folding process resulting from the interaction. Because the structure of the aptamer changes upon binding with the target molecule, it is easier and more effective to detect this binding process. (see explanation about biosensors p 5)
▪ Aptamers are thermally stable. They have the possibility to regain their three-dimensional conformation when cooled down after denaturation. Antibodies lose their structure and activity permanently.
▪ They are nonimmunogenic, creating no response of the immune system compared to antibodies that are often attacked by the immune system.
▪ There is the possibility to modify aptamers to improve the specificity or binding affinity leading to better functioning applications.
▪ Aptamers are chemically stable and easier to synthesise with high reproducibility and purity.
▪ Compared to natural antibodies, aptamers penetrate tissues more easily because of their lower molecular weight making it possible to reach the target molecule faster and more efficiently.
Many analytical and pharmaceutical techniques are based on the (structural) recognition of certain targets to detect and quantify them. In most of those techniques, antibodies are used. However, because of the advantages mentioned above, aptamers sound like a promising alternative for antibodies and their applications. A lot of research concerning these aptamers was and is still done to eventually lead to useable aptamers for applications based on the structural recognition process. A typical example of those applications are biosensors [10, 13, 14]. With these sensors, the binding process between an aptamer and its predefined target can be detected.
Typically, biosensors are made up of two parts [9, 10, 14, 15]: • A target recognition element (bioreceptor)
This is an immobilized biological element that is sensitive to the target for which the sensor is being developed. Types of biological elements are enzymes, DNA probes like aptamers, antibodies …
• A signal transduction element (transducer)
Interaction between the bioreceptor and the target induces a (bio)chemical signal, which can be converted by this transducer into an electronic signal measurable by several devices. This is called sensing: inducing a sort of detective to ‘sense’ the binding that is happening. Depending on the type of transduction element, different formats of sensing can be distinguished: electrochemical, optical, mass-sensitive, …
The principle of electrochemical, aptamer-based biosensors starts with an aptamer immobilized on an electrode surface (figure 1.4). To facilitate detection, the aptamer can be labelled with a redox probe which will be brought closer to or further away from the electrode surface by a conformational change in the aptamer upon target binding [14]. When the redox probe is near the electrode surface, electron transfer can happen leading to an electrochemical readout (“signal on” mode, see figure 1.4). If however, the probe moves further away from the electrode surface, electron transfer and electrochemical readout is no longer possible (“signal off” mode). Based on both modes, one can distinguish binding from no binding.
Figure 1.4: Illustration of aptamer based electrochemical “signal on” biosensors, figure adapted from [14]. The majority of those aptamer-based sensors, also called aptasensors, can exist in two types depending on whether single-site or dual-site binding is used. Which type is used, mostly depends on the size of the molecular target. Small target ligands (< 1500 Da) tend to be buried in the binding pocket of an aptamer. This way, there is little to no access left, so here a single-site binding sensor is most useful. Other target ligands, such as protein targets, are structurally more complicated but also allow more interactions/contacts. For these, both single-sited as dual-sited binding sensors can be used [10].
1.3. Aptamers for antibiotic detection
One application where a need exists for the development of sensors is the detection and monitoring of antibiotics in the environment [9].
Antibiotics are commonly used medicines against diseases caused by bacteria. Their specific working mechanisms make it possible to kill (bactericidal) or stop the growth (bacteriostatic) of bacteria without damaging the (healthy) cells of the patient. The origin of this selective toxicity can be found in the difference between prokaryotic (bacteria) and eukaryotic cells (human, animals): the presence/absence of a cell wall, the type of ribosomes, metabolism, etc. Depending on the type of antibiotic, different processes can be expected. In short, inhibition of cell wall, protein or nucleic acid synthesis is possible. A respective example of each is penicillin, doxycycline and nalidixic acid. Other processes are damaging the outer cell membrane (for gram negative bacteria) or interfering with the metabolism (for example with the production of folate).
Related to the use of antibiotics is the growing anti-microbial resistance (AMR), also called antibiotic resistance, against them. As mentioned on the site of the World Health Organization (WHO) ‘Antibiotic resistance is one of the biggest threats to global health, food security, and development today’ [16]. It is a phenomenon that occurs
naturally but increased prescription, incorrect use and release of antibiotics into the environment gives rise to extra mutation, conjugation and transduction processes creating a larger amount of antibiotic resistant microorganisms in a shorter time span than would naturally occur. The resulting ineffectiveness of antibiotics makes treating bacterial infections harder, leading to longer stays in the hospital, higher costs and continuously necessitates the search for new antibiotics [17, 18].
In order to limit these costs and needs, lower the impact of antibiotics on the environment and health system where bacterial infections can be treated efficiently, one must try to counteract or limit this AMR. To do this, an idea of the spread of antibiotics in the environment is necessary. In order to have this information, one must be able to detect antibiotics in a qualitative and (semi-)quantitative way. Detecting antibiotics from samples taken in the environment can be done by techniques like HPLC, GC-MS, LC-MS/MS and ELISA [14, 19]. However, these analyses are time consuming, require expensive instrumentations, pre-treatment of samples, etc. So a search for faster techniques that could be used on-site led to the development of biosensors for antibiotics. As mentioned above, one of the key elements of a biosensor is the bioreceptor: an immobilized biological element that is sensitive to the target for which the sensor is being developed. Aptamers have the potential to fulfil this role. However, to do this, one must be sure that the aptamer does indeed bind selectively to its predefined target.
1.4. The problem with aptamers
Aptamers aimed at a specific target are typically obtained with SELEX (Systematic Evolution of Ligands by Exponential enrichment), a procedure that is used to raise oligonucleotide sequences that specifically bind to this predefined target. Over the years, different approaches of this procedure have been described and intensive research and use of those led to a large amount of aptamers in a short time span. Despite the supposed success of this class of biomolecules in a controlled environment (on laboratory scale), only very few made it to the application market. One of the reasons for this may be the fact that their equilibrium dissociation constants KD
cannot be reproduced by other scientists, a result which is rarely communicated.
Within Flanders, the AXES research group (Prof. K. De Wael) is interested in developing antibiotic sensing approaches using an electrochemical detection methodology. One approach involves detection through aptamer binding, using an electrochemical signal that arises following a binding induced conformational change. Faced by negative results in generating a signal, the question was raised as to whether this indicated a failure in sensing or in binding. To establish this, a research collaboration was established with the OBCR (prof. A. Madder) and NMRSTR (prof. J.C. Martins) group, whom combine chemical synthesis and NMR structural investigations to study the aptamer binding process in molecular detail.
Within this collaboration, a combination of complementary analytical methodologies is considered to investigate the binding capacity of aptamers with affinity constants ranging from low pM to high mM values. Using native nano-Electrospray Ionization Mass spectrometry (native nESI-MS) and Isothermal Titration Calorimetry (ITC), detection up to µM affinity constants can be established. 1H-Nuclear Magnetic Resonance (1H-NMR) allows to extend
this range into even low mM affinity values. From these techniques, one can get information about the dissociation constant (KD), thermodynamics, stoichiometry, behaviour on molecular level and the location of intermolecular
interaction surfaces involved in the interactions between ligand and aptamer. Therefore, the combination of these techniques allows to confirm or disprove the capability of aptamers to bind their proposed targets under specific conditions.
An antibiotic aptamer system investigated within this collaboration consists of the ampicillin binding AMP17 aptamer. While described in literature to provide a KD of 13.4 nM [20] as reported using a colorimetric assay
involving gold nanoparticle aggregation, no binding could be detected within the pM to mM range. Thus, the effective binding of the aptamer for ampicillin could not be demonstrated, while a repeat of the colorimetric assay failed to provide a clear positive result within the concentration range where it would be expected based on the reported KD values.
Because of the issues of reproducibility and the lack of knowledge regarding the mechanisms during the binding process, hardly any aptamer is successfully used in an application. Knowing more about the precise mechanisms that cause selective binding and from there on being able to create better aptamers with higher affinities and KD
values is essential in the search of good working, useful aptamers for applications.
Therefore for the AXES group to be able to develop antibiotic sensing approaches using an electrochemical detection methodology, a new, working aptamer with a relevant target and KD value in the range of the techniques
being used, had to be found. In search of a new aptamer with the prementioned characteristics, an article by Zeng and Lee came into the picture [21].
1.5. The DOX6 aptamer and its doxycycline target
In this recent article, published in 2017, a new general selection strategy called double-library SELEX (DL-SELEX) is described as a means to discover aptamers with binding affinities in the nanomolar range towards small (< 1500 Da) and large unmodified targets. One of the targets discussed in the article is unmodified doxycycline, an antibiotic from the tetracycline family used against bacterial infections.
Doxycycline, brand name Vibramycin®, is a small molecule antibiotic, synthetically derived from oxytetracycline and part of the tetracycline family. As a bacteriostatic, it stops the growth of bacteria by keeping it in a stationary phase
of growth. More specifically doxycycline inhibits protein synthesis by binding to the 16S RNA subunit of the ribosome of prokaryotes, in this case bacteria. In this way, binding of tRNA to the 60S ribosome subunit, on which the 16S RNA subunit can be found and which is necessary for the delivery of amino acids for protein synthesis, is prevented. All this blocks the initiation of protein synthesis and thus the replication of the bacteria [22].
Figure 1.5: Structure of doxycycline.
As an antibiotic it is used against bacterial infections and some parasites. It is used to treat early Lyme disease, cholera, acne, typhus, bacterial pneumonia and E. coli infections to name a few. It can also prevent malaria and in combination with quinine even allows treatment. Because of its safeness and effectiveness as a medicine, it can be found on the World Health Organization’s List of Essential Medicines (EML) under the category anti-infective medicines – antibiotics [23].
Using several methods such as fluorescence titration and electrophoretic mobility shift assays as well as computational tools (Mfold software), Zeng and Lee pointed out that the best binder to doxycycline issued from the DL-SELEX procedure is DOX6 with a KD of 150 ± 25 nM.
DOX6 is a single stranded DNA aptamer made up of 39 nucleotides with the following sequence (from 5’ to 3’): 5’ GGG CGA GAA CAG TGT CCC AGT CGC TAG TTT TCT CTG CCC 3’
Figure 1.6, adapted from the proposed secondary structure mentioned in the article by Zeng and Lee, suggests a hairpin like structure made up of a 9 base-pair stem formed by hybridisation of the complementary DNA chain ends and including a bulge at position 35. The stem closes a 19-nucleotide loop which supposedly forms the binding site for doxycycline. As mentioned above, although based on its representation on paper it would seem planar, the aptamer does have a three dimensional structure.
DOX6 and its target ligand doxycycline measure up to all the characteristics mentioned above (so called working aptamer with a relevant target and a KD value in the range of the techniques). Next to that it is a new, relative
simple (one loop and one stem) and rather uncharacterized system making it a good test object for studying the binding mechanism in molecular detail and fine tuning a working method for testing binding between aptamers
and their supposed target ligands. And if, after studying the system, the aptamer shows effective binding, it could be used to start the development of an electrochemical aptasensor for antibiotics, in this case doxycycline.
Chapter 2: Aims, scope and objective
The DOX6 aptamer raised against doxycycline as a target, as described in the recent article by Zeng and Lee [21], is a new (2019), relatively simple (39 nucleotides) system with a reported KD value in the nano molar range. Combined
with the fact that no information with respect to its conformation in the free and bound state is currently available, the DOX6 aptamer appears a priori to constitute a good model system to investigate how a combination of NMR spectroscopy and molecular modelling can be used and fine-tuned to reveal and understand the underlying molecular mechanisms involved in the aptamer-target interaction.
Prior NMR tests by Anne-Mare de Vries in the NMRSTR research group established that addition of an excess of doxycycline to a 0.4 mM solution of DOX6 induced changes in its 1H NMR spectrum indicative of a binding process,
thereby providing the experimental basis to engage into a more in-depth research project that is the subject of this master thesis project.
DOX6 consists of a single oligonucleotide chain that folds into a hairpin like structure with a duplex ‘stem’ comprised of 9 base-pairs and a 20-nucleotide loop supposedly forming the binding site (figure 2.1). As it is the only loop present, one would indeed propose it is involved in the binding process because of its expected flexibility and conformational adaptability when compared to a standard base-paired DNA duplex that is compact, stable and generally lacks such conformational freedom. However, for DOX6, a bulge is present in the duplex part which may very well influence the duplex structure and flexibility, possibly creating a binding site or at least enough ’room’ for a secondary interaction with doxycycline. Also, while separated by at least 5 base-pairs, the behaviour of the bulge may well impact on that of the loop, raising the question as to its importance for the aptamer-target interaction. Is it an accidental feature or does it result from the SELEX selection process?
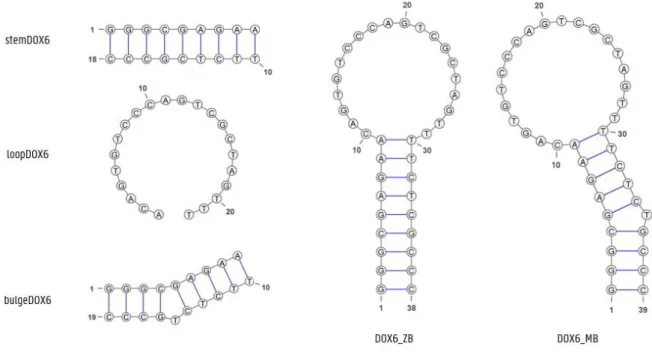
This thesis reports on the investigation of these questions. To this end, the following DOX6 subsystems as shown in figure 2.1 will be studied with both Nuclear Magnetic Resonance (NMR) spectroscopy and Molecular Dynamics (MD, in silico investigations):
• StemDOX6: The ‘stem’ region of DOX6 without the bulge, consisting of 18 nucleotides organized as a 9 base-pair duplex
• BulgeDOX6: The ‘stem’ region of DOX6 with the bulged thymine nucleotide at position 15
• LoopDOX6: The non-complementary part of DOX6 consisting of 20 nucleotides with the last base pair of the ‘stem’ region
• DOX6_ZB: The complete DOX6 aptamer without the bulge comprising 38 nucleotides • DOX6_MB: The original DOX6 aptamer including the bulge, consisting of 39 nucleotides
Figure 2.1: Subsystems stemDOX6, bulgeDOX6, loopDOX6, DOX6_ZB and DOX6_MB = DOX6.
By studying each of these DOX6 subsystems separately, one can obtain information about the importance of the individual elements in the overall behaviour of the DOX6 aptamer and their possible contribution to the binding mechanism with doxycycline. The following specific questions will be addressed:
Using stemDOX6, we will establish the behaviour of the duplex without the loop part and establish the ‘interaction baseline’ with doxycycline. Also, having the assignment of this duplex may assist in assigning the NMR spectrum of the DOX6_ZB subsystem, which has twice as many nucleotides
Next, using bulgeDOX6, the influence of the bulge on the duplex structure and flexibility will be addressed and its impact on the doxycycline binding will be investigated.
Both DOX6_ZB and DOX6_MB (i.e. the original DOX6) will next be investigated to establish to which extent NMR can provide information on the aptamer structure and behaviour. Comparative analysis should also demonstrate the importance of the bulge for the interaction of DOX6 with doxycycline.
To obtain a complete picture, the loop sequence by itself, loopDOX6, will be studied to establish the interaction baseline with doxycycline in the absence of the stabilizing duplex stem.
The methodology that will be used consists mainly of NMR spectroscopy. To see whether binding or interaction with doxycycline occurs, changes in the 1H NMR spectrum in the presence versus the absence of the target can be
changes onto the oligonucleotide structure. Therefore the signals in the 1H spectrum of the different subsystems
need to be assigned to their respective hydrogen atoms in the structure. This formed a major part of the experimental activities in the first and second semester.
Within NMRSTR, considerable experience also exists to combine NMR investigations of duplex structures with MD simulations to assist in the interpretation of the results and the generation of a detailed picture of molecular behaviour [24, 25]. Therefore, we engaged into MD investigations of the duplex subsystems, stemDOX6 and bulgeDOX6, to assist in the interpretation of their spectra and the way signals change upon interaction with doxycycline in the absence of the loop.
As it turns out, doxycycline proved to be chemically unstable under the pH conditions planned for the titration experiments, causing some delay in planning at the start of the 2nd semester. Soon afterwards however, the
COVID-19 pandemic and the measures imposed at Ghent University and within the department as of March 12th 2020 ended
the planned experimental activities, forcing a switch from experimental work in the lab to 100 % work at home. As a result, many of the titration studies planned in the 2nd semester could not be performed. To remain productive, I
engaged into a literature study of the pH sensitivity of the doxycycline structure. However, the lockdown situation also provided an opportunity to shift the focus towards in silico studies and extend the MD approach to full DNA aptamer structures, thereby breaking new ground in NMRSTR research of DNA based aptamers. The main challenge here was that while duplex structures are easily generated due to their predictable and well-known properties, no such information is available a priori for the loop structure, raising the question as how to generate a three-dimensional structure to be used for an MD study and no standard procedure was available to easily generate such aptamers. During the 2nd term therefore, a method to generate a suitable starting aptamer structure was devised
and exploratory MD simulations were performed and analysed and where possible compared to the NMR data. What can be found in this thesis:
In chapter 3, information about the two main methodologies used during this thesis (NMR spectroscopy and MD) will be given. The results obtained will be reviewed and discussed in chapter 4. Conclusions and future prospects will be formulated in chapter 5. Chapter 6 goes about the products, procedures and protocols used. Chapter 7 contains some extra data not shown in the previous chapters. References can be found in chapter 8.
Chapter 3: Methods
In this chapter, the two main methodologies used during this research are discussed: Nuclear Magnetic Resonance (NMR) spectroscopy and Molecular Dynamics (MD). More specifically, the assignment of DNA duplexes and information obtained from titrations, by means of NMR spectroscopy will be presented. Further, a short introduction to MD and the information available from those studies, focussing on the dihedral angles, is given.
3.1. Nuclear Magnetic Resonance (NMR) spectroscopy
Nuclear Magnetic Resonance (NMR) spectroscopy is a technique which can be used for a large variety of applications. By looking at one or multiple types of nuclei, one can identify molecular structures, get information about their behaviour, intermolecular interactions and so much more.
To get such information about the structure, dynamic behaviour and possible interactions of the DOX6 aptamer with doxycycline, 1H NMR spectroscopy was used, as each individual 1H can be used to report on the local molecular
environment. In particular, the presence of a base pair reveals itself by the occurrence of an imino proton resonance in the 12 to 15 ppm area of the spectrum. Therefore, changes in base-pairing can be derived by monitoring these (and other) signals. However, this requires the individual 1H resonances to be assigned first to their particular
hydrogen atom in the molecule This assignment process is detailed hereafter.
3.1.1. Assigning a DNA duplex
Considering the DOX6 aptamer contains no less than 439 hydrogens, the process of assigning the different signals to their respective 1H in the structure appears as a complicated process.
δ (ppm) Comments Su gar 2’, 2’’ 1.8 - 3.0 H2’ and H2’’ 4’, 5’, 5’’ 3.7 - 4.5 H4’, H5’ and H5’’ 3’ 4.4 – 5.2 H3’ 1’ 5.3 – 6.3 H1’ Ba se CH3 1.2 – 1.6 Thymine methyl 5 5.3 – 6.0 H5 of cytosine 6 7.1 – 7.6 H6 of thymine or cytosine
2, 8 7.3 – 8.4 H8 of guanine or adenosine, H2 of adenosine NH2 6.6 – 9.0 Amine proton of adenosine, cytosine or guanine
NH 10.0 – 15.0 Imino protons of guanine or thymine Adapted from [3], numbering according to figure 1.1.
In a DNA nucleotide, the 1H signals of both sugar and base moieties can be found in a certain region, defined by a
chemical shift interval in ppm as shown in table 3.1, which makes it possible to distinguish these for one nucleotide. Each of these regions can be also be seen in spectrum 3.1.
Methyl groups can be found at lowest ppm values and are only present for thymine’s, thereby clearly indicating their presence. Next, moving to the left (in spectrum 3.1) the 1H of the sugar are present in the order H2’/H2’’, H5’/H5’’
and H4’, H3’ and finally H1’. The water signal, typically found around 4.5 ppm often overlaps with one or more H3’ resonances. Also the region of the anomeric H1’ overlaps with the region of the H5 of cytosines.
Beyond 6.3 ppm, only hydrogen atoms from the different bases are found. Although, the distinction between the base resonances is less clear, the H8 of an adenine has a typical higher chemical shift value than the H8 and H6 of guanine and cytosine/thymine respectively. The amine resonance of adenine, cytosine and guanine bases can be found in an area from 6.6 till 9.0 ppm, totally enclosing the area of the H6 and H8 of pyrimidines and purines. The final ppm region, from 10 – 15 ppm, houses the imino signals of guanine and thymine.
Figure 3.1: 1D 1H spectrum of stemDOX6 with regions from table 3.1; (700 MHz, H
Some of the hydrogen atoms in table 3.1, more specifically the amine protons of adenine, cytosine and guanine together with the imino protons of guanine and thymine, can be classified as exchangeable protons. This means that when their parent nucleotides or nucleic acids are studied in protic solvents, such as water used here, these exchangeable protons can be chemically exchanged with those of the solvent molecules. Depending on the kinetics of the chemical exchange process, the exchangeable protons from the molecule of interest may be visible (slow exchange) or collapse with the solvent signal (fast exchange), thus becoming indistinguishable. This means that by recording spectra in D2O rather than H2O, all resonances from exchangeable groups disappear, allowing to
distinguish them from the non-exchangeable ones which remain. In certain cases however, the exchangeable protons are protected from such exchange either because they are buried inside the structure (making them inaccessible to water molecules) or because they are involved in hydrogen bonds which need to be broken before chemical exchange with water can occur. This is the case in a DNA duplex. Because of the double helix structure, the exchangeable protons are directed away from the solvent molecules towards the inside of the helix where they are involved in Watson Crick or other type of hydrogen bond formation.
For chemical exchange of imino hydrogens to take place two distinct chemical steps are therefore required, each with their own kinetics: breaking of the hydrogen bond and exchange of hydrogens with the solvent. Here, the lifetime of the hydrogen bond, for instance the one involving the imino hydrogen in DNA base pairs, becomes the determining factor in defining whether slow or fast exchange conditions apply. When an imino signal is visible in the spectrum, the associated base pair is long-lived, indicating a stable local conformation. However with increasing temperatures a process called base pair breathing occurs more frequently. A base can then flip out of the helix towards the solvent where it can exchange its imino hydrogenwith water, leading the signal to shift towards the water signal and broaden. Ultimately, hydrogen bond lifetime is insufficient and fast exchange conditions are introduced, collapsing the imino signal with the water resonance.
Thus the increased rates of both exchange with the solvent and base pair breathing at higher temperatures requires considerable attention to be given to the choice of sample temperature when setting up NMR measurements and analysing and interpreting the spectra of a DNA duplex, especially when the exchangeable resonances carry the information one is looking for.
Based purely on the knowledge mentioned above, one can roughly identify the different types of protons of one nucleotide in a spectrum. But what if there are multiple nucleotides? Each nucleotide roughly shows the same overall structure and thus signals in the spectrum. However based on the type of base and the adjacent nucleotides in the strand, their signals will be shifted slightly to higher or lower chemical shift values. This way, several signals
closely together will be present in each of the regions shown in table 3.1, complicating the assignment and interpretation. This kind of complexity in spectra is typical for biomacromolecules such as DNA, RNA or proteins. To solve the problem of assigning those hundreds of peaks in spectra of biomacromolecules, K. Wüthrich developed a sequence specific resonance assignment procedure using a ‘sequential walk’ through NMR spectra, which contributed to him getting the Nobel Prize in Chemistry in 2002 [3, 26]. By following through-space dipolar or ‘nOe’ correlations between the hydrogen atoms within and between nucleotides in a duplex, the sequence of the bases in a duplex can be confirmed. For this, a 2D 1H NOESY spectrum is measured and analysed. Because these nOe’s
depend on the spatial proximity of the protons involved, information about the structure and relative in-space orientation of certain parts of the molecule can also be obtained [27]. Because the DNA duplex is a regular structure, the nOe contacts within and between adjacent nucleotides in the same strand or on opposing strands also creates a regular pattern that can be picked up in the 2D NOESY spectra and used to assign the individual nucleotides to their position in the spectrum, provided the DNA sequence is known.
Keeping in mind the r–6 dependency (with r the inter-nuclear distance), only nOe contacts till 5 Å are visible.
Subsequently, for a DNA duplex, the following intra- and inter-nucleotide nOe contacts can be observed: Intra-nucleotide nOe contacts:
• Within the base
For the pyrimidines, NOE’s can be seen between H5 and H6. More specifically, in a cytosine a nOe between the two CH protons. In a thymine, a nOe between CH at position 6 and the CH3 protons at position 5 is
present.
• Between base and sugar
Each base can show through-space contacts to the sugar of its own nucleotide. H6 and H8 have a nOe with each of the hydrogen atoms in the sugar. However, the nOe’s with the H1’ and H2’/H2’’ protons are both more intense and better resolved than those to the H3’, H4’and H5’/H5’’ of the sugar.
Sequential inter-nucleotide nOe contacts within the same strand: • Between base and sugar of adjacent nucleotide
Each base can also show through-space contacts to the sugar of the adjacent nucleotide in the 5’ direction. Again the H6/H8 will couple to the H1’ and H2’/H2’’ protons of the sugar.
• Between two adjacent bases
Next to nOe’s to the sugar of the adjacent nucleotide in 5’ direction, the H6/H8 of a pyrimidine and purine can also couple to the CH3 of a thymine and the H5 of a cytosine in the 3’ direction.
As said before, by following these intra- and inter-nucleotide nOe contacts, one can walk through a DNA strand and assign most hydrogen peaks in the spectrum. The direction in which this DNA strand is assigned (from 5’ to 3’ or the other way around) mostly depends on the researcher, since all nOe contacts can be followed in both directions. During this thesis, nOe contacts were followed in both directions, depending on the nucleotide that was started from and the ease with which a pattern could be recognised.
For one of the systems studied in this thesis, more specifically the stemDOX6 (figure 3.2), assignment via a sequential walk was executed as described hereafter.
Figure 3.2: StemDOX6.
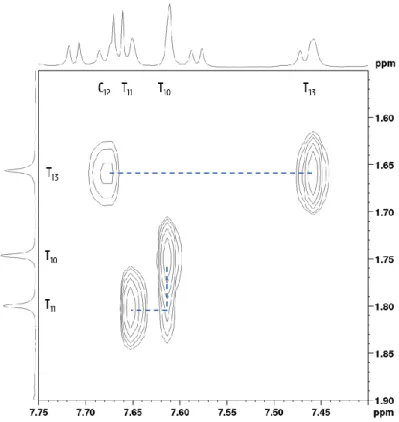
The first step is to look for a unique pattern in the sequence, where one can start its sequential walk. This unique pattern is a (combination of) signal(s) that is easily recognized and assigned to a nucleotide in the sequence. For the system stemDOX6, this is the case with the three thymine’s on position 10, 11 and 13. Each of them will show an easily detected singlet signal in the region around 1.2 – 1.6 ppm which corresponds to the respective methyl group. Based on the nOe’s mentioned above, one would expect a nOe cross-peak from each of those methyl protons to the H6 of their own base. Next to that, the H6 of a thymine and cytosine will also connect to the CH3 protons of an
adjacent thymine in 3’ direction, so from T10 to T11 and from C12 to T13. With all this information, one is able to assign
Figure 3.3: Detail of the 2D NOESY showing correlations between thymine methyls (y-axis) and the H6/H8 (x-axis) resonances, including assignments; the blue dashed lines indicate the pattern that was followed to go from one nucleotide to the other.
Once the chemical shifts of the H6 of these four nucleotides are known, one can start assigning their corresponding sugar H1’ in the region between 5.3 – 6.3 ppm. Going from that H1’ one can use a sequential nOe from H1’ to H6/H8 to walk to the next base in the strand. (figure 3.4 and 3.5) Cytosines can be recognised in the H1’ region by their H5, which shows a prominent nOe cross peak to their own H6 when compared to the other nOe contacts in this region. A way to independently check the H6/H8 assignment in the H1’ region, is by involving the H2’/H2’’ region between 1.8 – 3.0 ppm. For each H6/H8, four cross peaks are visible. Two to the H2’/H2’’ of their own sugar, the other two to the H2’/H2’’ of the adjacent nucleotide in 5’ direction. Looking at both the H1’ and H2’/H2’’, one usually has enough information to fully assign all the H6/H8 protons of a DNA duplex.
As H6/H8 also display nOe contacts to the H3’ of their own nucleotide, the respective H3’ resonances can be identified, once the H6/H8 have been assigned.
Since the stemDOX6 system consists of two separate strands forming a duplex, one cannot walk uninterrupted through the entire duplex system using this set of nOe contacts, but only through each of the two strands separately. So once the first strand of the duplex is assigned, one can analyse the remaining peaks to assign the second one. A way to find the beginning of the second strand is by starting with the H3’ region. Typically, nucleotides
at the 5’ edges of the strand show H6/H8 to H3’ nOe’s at distinct (lower) chemical shift values than the other nucleotides in the strand. This is also a possible way to start your assignment if no unique pattern can be found.
Figure 3.4: Walk through stemDOX6_a using the H6/H8 (x-axis) – H1’ (y-axis) region (700 MHz, H2O:D2O 90:10, 25°C,
pH 6.0).
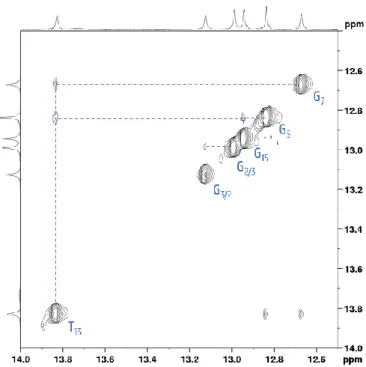
By following the working method as described above, one can assign a complete sequence but no information about the formed base pairs is obtained. For this, a different working method is used. In the imino region (10-15 ppm), nOe contacts between the imino protons (NH) of neighbouring T and/or G bases in sufficiently stable base pairs are visible. The short distances between the imino’s create a pattern of nOe’s in the spectrum making it possible to walk from base pair to base pair through the entire duplex. Based on the sequence structure, one would expect as many imino signals as there are base pairs, i.e. nine in total. However, looking at figure 3.6, there are only six clearly defined signals present, with some indication of at least one additional but broadened signal around 13.75 ppm.
Figure 3.6: Imino region of stemDOX6 (H2O:D2O 90:10, 25 °C, pH 6.0, 700 MHz).
This is not unexpected as the base-pairs at both ends typically have less persistent base-pair hydrogen bonds, leading to loss of the imino signals due to fast exchange with the solvent. To be able to confirm this, one must first assign all visible imino signals. For this one must again go to the 2D 1H NOESY spectrum. In this imino region, signals
from thymine are typically at a higher chemical shift value than those of guanine. So one can assume that there are 5 guanines and 1 thymine present in the imino region in figure 3.7. The signal around 13.8 thus most likely originates from a thymine and shows contacts to two other peaks in the region of the guanines. Based on the sequence of the system, this could only be T13. This imino has contacts to G7 and G5. From G7, there should be signals
present to T11. However, since there was only one signal in the thymine region, the walk to this side stops here. From
G5, there is also a contact to G15. Two more signals are present that show a clear contact to one another. However,
Figure 3.7: Imino region of stemDOX6 in the 2D NOESY spectrum with assignment; the blue lines show the pattern followed for assignment (700 MHz, H2O:D2O 90:10, 25°C, pH 6.0).
Looking at the assignment (figure 3.8), most base pairs show imino’s except for the outer base pairs. This can be explained by the shorter lifetime of those outer base pairs due to fraying (transient opening events) [28]. These bases will flip out of the helix towards the solvent where the imino hydrogen can exchange with water. As said before, this insufficient hydrogen bond persistence leads to fast exchange conditions causing the imino signal to collapse with the water resonance. This is proposed to be the reason why no imino signals are present in the spectrum for T11 and T10. Now taking this into account, one can also assume that it is more likely that G1 will not
show an imino signal than G3. So the two imino signals around 13.0 to 13.2 ppm can be assigned to G2 - G3 rather
At this point, all regions are analysed and the ppm values of each peak can be summarised in table 3.2. Analogous to the working method above, the other systems bulgeDOX6, loopDOX6 and DOX6_ZB were assigned (see addenda).
H1' H2'/'' H3' H1 H3 H5 H6 H7* H8 1 Gua 5.65 2.48,2.64 4.81 - - - 7.85 2 Gua 5.68 2.78,2.71 5.00 - - - 7.82 3 Gua 5.93 2.74,2.58 5.00 - - - 7.78 4 Cyt 5.66 1.90,2.32 4.84 - - 5.31 7.26 - - 5 Gua 5.44 2.74,2.66 4.99 12.84 - - - - 7.87 6 Ade 5.97 2.58,2.80 5.04 - - - 8.05 7 Gua 5.30 2.53,2.42 4.94 12.67 - - - - 7.62 8 Ade 5.99 2.75,2.50 4.97 - - - 8.00 9 Ade 6.22 2.57,2.37 4.68 - - - 8.08 10 Thy 6.07 2.22, - 4.75 - - - 7.62 1.75 - 11 Thy 6.20 2.61,2.37 4.93 - - - 7.66 1.80 - 12 Cyt 6.04 2.19,2.56 4.79 - - 5.76 7.68 - - 13 Thy 6.02 2.50,2.17 4.88 - 13.83 - 7.46 1.66 - 14 Cyt 5.59 2.38,2.07 4.84 - - 5.67 7.47 - - 15 Gua 5.86 2.67,2.71 4.98 12.95 - - - - 7.90 16 Cyt 5.95 2.47,2.15 4.79 - - 5.38 7.38 - - 17 Cyt 6.01 2.22,2.46 4.82 - - 5.69 7.59 - - 18 Cyt 6.27 2.27,2.29 4.56 - - 5.86 7.72 - -
Assignment of stemDOX6 in H2O:D2O 90:10
3.1.2. Titrations of DOX6 with doxycycline
As described above, by means of a sequential walk, the complicated 1H NMR spectra of biomacromolecules with
lots of signals, like that of stemDOX6, can be assigned. This way, an interpretation of the respective 1D spectrum is possible. However, is it always necessary to do a complete assignment when looking at several spectra of the same molecule under different conditions? Or is there a possibility to just look at the relative differences in the 1D spectra?
For DNA, certain regions (like the methyl and imino region) are present in which the signals are sufficiently resolved from the others signals to be distinguishable in a 1D spectrum. This way, one can measure and assign a 2D NOESY once and then use this to identify the signals in those regions. After that, just following those signals in de 1D spectra allows to analyse and interpret without having to assign a 2D NOESY for each measured 1D spectrum. It is this method that will be used to analyse the spectra during the titrations of DOX6 with doxycycline.
For these titrations, a first sample of solely DOX6 in a certain concentration (400 µM) will be measured. Afterwards, a certain amount of doxycycline is added to this sample, making sure that the concentration of DOX6 remains
constant. Again, the sample is measured and the same steps are repeated until several spectra of different DOX6:doxycycline ratios are obtained.
By analysing possible changes in chemical shift values in the imino and/or methyl region of these measured 1D spectra, information about a possible interaction between DOX6 and doxycycline with increasing concentration can be obtained.
3.2. Molecular dynamics (MD)
Molecular dynamics (MD) is a method that uses computer simulations to study molecules and their behaviour as a function of time. In short, the potential and kinetic energy of the molecule are simulated and allowed to fluctuate while keeping the total energy of the molecule constant. The potential energy is defined by the force field, an equation that describes the energy of a molecule as a function of the position of the atoms, taking into account bond lengths, valence and dihedral angles associated with the covalent structure, while including terms that describe electrostatic and van der Waals interactions. The force field thus generates an approximation for the potential energy landscape of the molecule, characterised by energy minima and maxima. The kinetic energy injected into the simulation is used to travel this landscape. It is used to attribute a random distribution of velocities and directions of motion to the individual atoms. By converting kinetic energy into potential energy and back in femtosecond steps, the molecule is allowed to overcome barriers between energy minima. In doing so, a molecular trajectory is generated from which low-energy conformations that should be accessible to the molecule under study can be obtained while also providing information on how the structure changes (dynamics) over time. During this thesis specifically, the AMBER software will be used to set up and run these simulations. First, initial models of the systems are constructed using Discovery Studio (v20.1.0.19295). Next, initial coordinate and topology files are prepared in xleap. For this, the negative charges of the phosphodiester bonds are neutralised with Na+
ions, followed by solvation in a ‘water box’ with sizes that allows to encompass the DNA model including a 12 angstrom buffer of TIP3P water molecules in each direction. Thirdly, the energy of the system is minimised for energy optimisation. In a first stage, the positions of both water molecules and ions are optimized for minimal energy while holding the coordinates of DNA fixed. In a second stage, the force field (potential) energy of the entire system is minimised. Depending on the complexity of the system that is being studied, the second stage can be repeated several times with gradually less restraints. Next, kinetic energy is injected in the entire system by heating it up from 0 to 300 K while using weak restraints to avoid strong fluctuations. After this heating step, the total energy is allowed to stabilize (relax) during 2 ps. Finally, a simulation of suitable length, mostly in the order of tens to a few hundred ns, is run.
The Visual Molecular Dynamics (VMD) software is used to visualize the trajectories and perform hydrogen bond analysis [29]. Pytraj [30, 31] and an in-house written python code in the Jupyter notebook environment (Buyst, unpublished) were used to study the dihedral angles of the DNA in the calculated trajectories.
3.2.1. Dihedral angles in DNA and analyses methods used
The current knowledge of traditional DNA duplexes is well-established, so information about the dihedral angles and their ‘traditional’ values can be easily found in literature [32-34]. Their individual analysis during a MD simulation allows to investigate local conformational effects notable in the trajectory. Also, the comparison of the same angles in simulations of different constructs (e.g. with or without bulged nucleotide) allows to derive the impact of certain features. Figure 3.9 shows the different dihedral angles, also called torsion angles, in a nucleotide when it is part of an oligonucleotide chain.
Figure 3.9: Dihedral angles in DNA (figure reprinted with permission [35]).
The angle chi (χ) gives information about the syn or anti conformation of the base relative to the sugar ring. In a DNA duplex, nucleotides prefer to have the anti conformation with values between 180 and 270 degrees where the base is rotated 180 degrees away from the sugar plane. Figure 3.10 shows an example of a graph where the distribution of values for the chi angle is plotted for the G3 nucleotide during the simulation of the stemDOX6
subsystem. Most values are situated between 230 and 270 degrees, conform to the range of an anti conformation, as expected for a traditional DNA duplex.
Figure 3.10: Dihedral angle chi for the G3 nucleotide in stemDOX6, the y-axis provides information about the fraction
of conformations at this particular angle (values from 0 to 1).
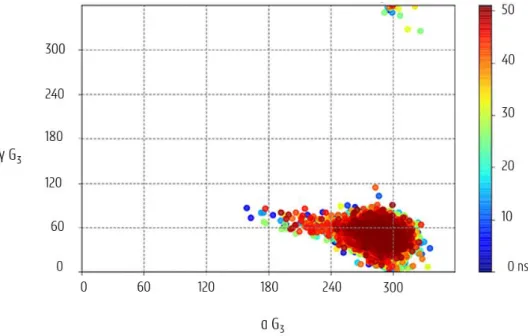
Angles alpha (α) and gamma (γ) both give information about the phosphodiester backbone of the nucleotide before the deoxyribose ring in the 5’-3’ direction (figure 3.9). Typically, a canonical duplex has a gauche-, gauche+ combination for α and γ, adopting angles of 300 ± 40 degrees and 60 ± 40 degrees respectively. Figure 3.11 shows an example of a typical representation of those alpha-gamma combinations in an α–γ plot. Again, the G3 nucleotide
of the stemDOX6 subsystem is considered and clearly shows the typical gauche- gauche+ conformation.
Figure 3.11: α-γ graph for 50 ns trajectory of the G3 nucleotide in stemDOX6 (colours following the order of the
rainbow, from blue to red, indicate the progression with time).
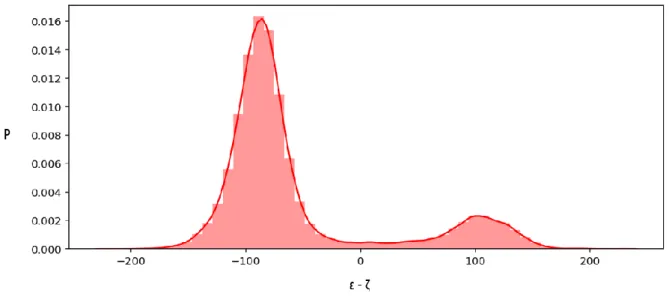
Angles epsilon (ε) and zeta (ζ) also give information about the backbone. However, compared to alpha and gamma, they are situated beyond the nucleotide sugar in 3’ direction. It turns out that for ε-ζ, one normally gets either -90 or +90, which correspond to B1 and B2 DNA respectively. Both are B-DNA, but the B1 DNA is overall energetically
Figure 3.12: ε-ζ for the G3 nucleotide in stemDOX6; the y-axis provides information about the fraction of
conformations at this particular value for ε-ζ (values from 0 to 1).
By analysing the different dihedral angles mentioned above, information about the backbone and different conformations can be obtained at the level of separate nucleotides. Also the difference in flexibility between structures can be studied and the impact of a structural change at a specific position (e.g. introduction of a bulge) throughout the structure can be analysed
Chapter 4: Results and discussion
As said in chapter 2, binding studies for the DOX6 system with doxycycline are the subject of this research project. However, assignment of the spectra and information on conformational behaviour of DOX6 is necessary first to make the correct interpretations concerning the binding studies. For this, the stemDOX6, bulgeDOX6, loopDOX6, DOX6_ZB and DOX6_MB subsystems (figure 2.1 in chapter 2) were studied during this thesis to address several questions concerning the structure of the full aptamer DOX6. What is the influence of the bulge on the duplex part? What is the influence of the loop? And does the influence of bulge and loop change when they are both present in the same structure? In this chapter, these questions will be discussed and an answer will be formulated through analysis of the information obtained from NMR, MD, temperature studies and titrations with doxycycline.
4.1. What is the influence of the bulge on the duplex part?
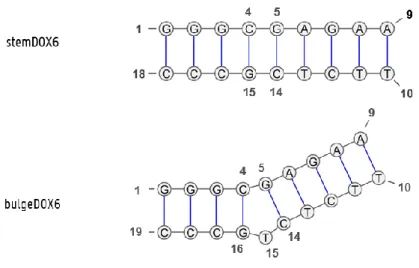
Figure 4.1: Subsystems stemDOX6 and bulgeDOX6; numbering from 5’ to 3’ as indicated. Visualized using Varna 3.9. The subsystems stemDOX6 and bulgeDOX6 consist of 18 and 19 nucleotides respectively. Based on the structure in figure 4.1, both should form a DNA duplex with nine base pairs. To ‘confirm’ this, each system was measured with
1H NMR. For both systems, most of the unexchangeable protons were assigned (see section 3.1.1 for stemDOX6 and
addenda for bulgeDOX6). For stemDOX6, all imino signals could be assigned (see section 3.1.1). For bulgeDOX6, this was not the case due to a more complex spectrum and the lack of certain NOE’s between the imino resonances in the 2D NOESY spectrum. However, even without full assignment in the imino region, an overall interpretation could be done.
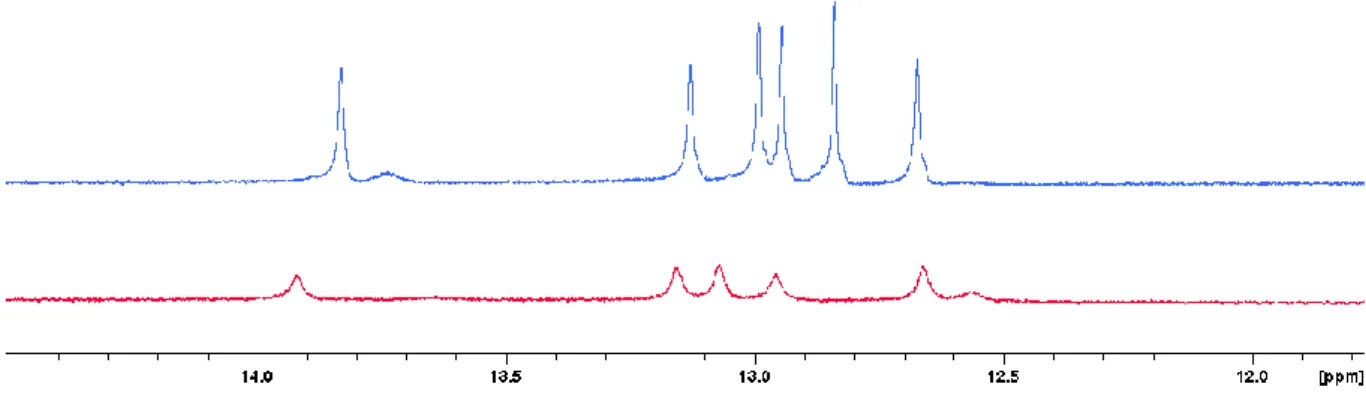
Figure 4.2: Overlay of imino region stemDOX6 (blue) and bulgeDOX6 (red) at 25 °C. (700 MHz, H2O:D2O 90:10, pH 6.1
and 6.0).
An overlay of the imino region in the 1D spectra of stemDOX6 (blue) and bulgeDOX6 (red) at 25 °C can be seen above (figure 4.2). For both systems, several imino signals are present, indicating that base pairs are indeed formed. However, both systems show less than the nine expected imino’s. Measuring at lower temperatures minimizes the influence of fraying, base-pair breathing and exchange with water (explained in chapter 3.1.1), leading to spectra with more and better defined signals. As a result, in figure 4.3 for the stemDOX6 subsystems, there are clearly more imino signals present when measuring at 5 °C, together with a mostly uniform shift to higher chemical shift value, allowing to transfer assignments from the 25 °C spectra. The 2 extra signals most likely correspond to the outer base pairs who did not generate a signal at higher temperatures due to fraying and base pair breathing.
Figure 4.3: Overlay of stemDOX6 at 25 °C (blue) and 5 °C (green). (700 MHz, H2O:D2O 90:10, pH 6.1).
The same applies for the subsystem bulgeDOX6 as visible from the overlay of 1D spectra at temperatures ranging from 5 °C to 30 °C shown in figure 4.4. Here also, new signals gradually appear at lower temperatures. Again, a shift of the signals to higher ppm values can be observed, as expected.
Going to lower temperatures, differences in the imino region between both systems are clearly observed. Counting the number of signals, there is one less signal for the bulgeDOX6 subsystem compared to stemDOX6. Also, the
expected extra imino signal of the bulge (T15) at lower ppm values is not observed. These observation, together
with the difference in chemical shift value for most imino’s, clearly indicates an impact of the bulge on the duplex part.
Figure 4.4: Overlay of 1D 1H spectra of bulgeDOX6 in a temperature range from 5 °C till 30 °C (imino region); signals
could not be assigned. (700 MHz, H2O:D2O 90:10, pH 6.1).
The presence and absence of imino signals as a function of the temperature relates to the stability of the duplex and thus base pair formation. Knowing that the melting temperature (Tm) is defined as the temperature at which
a 50:50 ratio of folded and unfolded duplex is present, one could make a thoughtful guess based on figure 4.4 and predict that the melting temperature of bulgDOX6 is around 25 °C. (Since the signals start to visibly decrease in intensity at 20 °C, leading to almost no signals at 30 °C.) A similar temperature study for stemDOX6 is not available. To look at the difference in thermal stability between stemDOX6 and bulgeDOX6, melting temperatures (Tm) of
both systems were derived from the first derivative of the measured UV thermal denaturation curves (see addenda) and are collected in table 4.1. As it turns out, stemDOX6 has a much higher Tm, thus a higher stability against thermal
denaturation compared to bulgeDOX6. The Tm for bulgeDOX6 is an estimation based on the curve of the first
derivative where the run-up to a maximum value can be seen (figure 7.11 in addenda). However, in order to get a more accurate value for the Tm, new measurements are needed going to lower temperatures to fully see the
Experimental Tm
stemDOX6 38.3 ± 1.0 °C
bulgeDOX6 ~20 °C
Experimental melting temperatures of stemDOX6 and bulgeDOX6.
So the bulge clearly decreases the stability of the duplex part. In order to find an explanation for this large decrease, the region around the bulge was analysed in more detail. Since its imino signals could not be assigned, a different method had to be used for bulgeDOX6. In silico studies, more specifically MD simulations, made it possible to investigate the interactions involving the bulged residue within the duplex, and its general impact on the base-pairing network, by monitoring hydrogen bonds between the nucleotides. In order to get an idea of the impact of the bulge compared to a regular DNA duplex, in silico studies for stemDOX6 were also done and results from both subsystems were compared. Both subsystems showed hydrogen bond formation for all nine base pairs. However, outer base pairs showed a lower percentage of occupancy during the calculated trajectories, indicating a lower persistence, which is consistent with the previous mentioned NMR results. The average occupancy of the hydrogen bonds during the simulation, excluding the outer base pairs, is 69 % and 65 % for stemDOX6 and bulgeDOX6 respectively. Purely based on these values, a difference of merely 4 % between both subsystems can be regarded as not significant. However, the occupancy percentage does not tell the full story. Indeed, a hydrogen bond may be present during the first 50 % of the simulation and then disappear, or continuously flip in and out of the hydrogen bond, each being present 50 % of the time on average. Both thus generate the same occupancy but clearly have different lifetimes. Therefore, we introduce the use of an alternative representation to analyse hydrogen bond occurrence during molecular simulations, as shown in figure 4.5. It shows the evolution of H-bonds as a function of time for the base pairs next to the bulge using a bar code graph. A yellow line means that at a time point in the simulation a particular hydrogen bond between the donor and acceptor atoms, given on the left of the figure, is formed. A hydrogen bond is stated as being present at the moment the distance between donor and acceptor is ≤ 3.0 Å and the angle between the acceptor, donor and the hydrogen on the donor is 180 ± 30 degrees. This affords a better appraisal of hydrogen bond behaviour than calculating an occupancy.
At the bottom, the canonical ‘Watson-Crick’ hydrogen bonds can be seen for base pair C4-G15 and G5-C14 in stemDOX6.
During the entire simulation, all six expected hydrogen bonds are formed and present for more than 67 % up to 83 % during the entire simulation. For bulgeDOX6, some black zones can be seen for the G5-C14 base pair, next to the
bulged residue, indicating that the bulge disturbs the neighbouring hydrogen bonds in 5’-direction relative to T15.
However, the three possible hydrogen bonds for G5-C14 are rarely simultaneously disrupted and each is present for
at least 55 % of the entire simulation time. Studying the acceptor atoms of the bulge showed that hydrogen bonds are formed between the bulge (T15) and G5 at the time points where black zones were observed for the G5-C14 base
pair (top of figure 4.5). Thus the bulge alternates between not interacting and interacting with G5, a finding which
reveals another clear advantage of the use of bar code graphs as (anti-) correlated events can now be visualized.
Figure 4.5: Hydrogen bonds of the C4-G15/16 and G5-C14 base pairs in stemDOX6 and bulgeDOX6.
The in silico study also made it possible to get a visualisation of the local conformation. Figure 4.6 depicts a single conformation for stemDOX6 (blue) and bulgeDOX6 (red) at 42 ns in the simulation from a similar viewpoint. This time point was chosen to represent a black area in the hydrogen bond bar code for bulgeDOX6. The bulge (in yellow) disturbs the duplex by creating a kink in the backbone curve, clearly affecting the relative positions of the nucleotides in the G5-C14 base pair, disrupting its base-pairing hydrogen bonds. The C4-G16 base pair appears to be
unchanged. Both these observations could also be seen from figure 4.5. Thus, the in silico studies provide clear evidence for the occurrence of a soft spot in the conformation introduced by the bulge, which likely relates to its decreased thermal stability.
Figure 4.6: StemDOX6 (blue) and bulgeDOX6 (red), influence of the T15 bulge (yellow). Visualized using DS Visualizer.
4.1.1. Binding studies with doxycycline
With a general view on the structure now available, the first step of the binding studies with doxycycline could be performed. For this, 1H NMR spectra of doxycycline were (partly) assigned (see table 7.5 in addenda) and titrations
of both stemDOX6 and bulgeDOX6 with doxycycline were done. Different ratios of stemDOX6/bulgeDOX6 to doxycycline were measured at 5 and 25 °C. An overlay of the different 1D spectra in the imino region at 25 °C can be seen in figure 4.7. For both systems, shifts in signal positions occur with increasing concentration of doxycycline, indicating that certain interactions between doxycycline and the subsystem occur. While all signals shift to the right for stemDOX6, not every signal shifts in the same direction for bulgeDOX6. This can be seen when looking at the overlay of the subsystem bulgeDOX6 (figure 4.7b) where signal I shifts to the left with increasing concentration of doxycycline, while the signals II, III and IV shift to the right. Although additional measurements and studies could not be performed due to COVID-19, certain conclusion can be made from these observations. Firstly, while many signals shift with increasing concentrations of doxycycline, some signals show significantly larger shifts than others. This may indicate that a localised interaction of doxycycline with certain nucleotides is present in both subsystems. Secondly, the difference in behaviour of the shifting signals (direction) clearly suggest that observed interaction is different for both systems.
Figure 4.7: Overlay of the imino region of mixtures of stemDOX6 (a) and bulgeDOX6 (b) at ratio’s to doxycycline as indicated at the left. No assignment of this region was obtained for bulgeDOX6. (700 MHz, H2O:D2O 90:10, 25 °C, pH
5.9 (a) and 6.1 (b), 0.4 mM strand concentration).
Since assignment of the imino region was accomplished for stemDOX6, a closer look at the changes in chemical shift value throughout the titration might give some more information about these possible localised interactions with doxycycline. In figure 4.8, changes in absolute chemical shift values between stemDOX6:doxycycline 1:0 and 1:16 ratios for each imino signal are displayed by means of a colour code. The shift of imino signals belonging to base pairs G2-C17, G3-C16 and C4-G15 are more pronounced, indicating a localised interaction of doxycycline towards
the end of the duplex part. Although, no assignment was possible for the thymine’s T10 and T11, similar observations
are expected there based on the increased change for G7-C12.
One would expect a similar observation for bulgeDOX6, with some additional interactions happening around the bulge. However, assignment of the imino region is first needed in order to do further interpretation.
![Figure 1.1: Structures of a DNA nucleotide and the bases ; numbering will be used during the assignment of the spectra according to [3] (chapter 3)](https://thumb-eu.123doks.com/thumbv2/5doknet/3273020.21349/7.892.128.769.122.487/figure-structures-nucleotide-numbering-assignment-spectra-according-chapter.webp)
![Figure 1.4: Illustration of aptamer based electrochemical “signal on” biosensors, figure adapted from [14]](https://thumb-eu.123doks.com/thumbv2/5doknet/3273020.21349/11.892.375.561.106.386/figure-illustration-aptamer-electrochemical-signal-biosensors-figure-adapted.webp)