deliveries
cost-efficient alternative for e-commerce home
Academic year 2019-2020
Master of Science in Industrial Engineering and Operations Research Master's dissertation submitted in order to obtain the academic degree of
Supervisors: Prof. dr. El-Houssaine Aghezzaf, Prof. dr. ir. Sidharta Gautama
Student number: 01508811deliveries
cost-efficient alternative for e-commerce home
Academic year 2019-2020
Master of Science in Industrial Engineering and Operations Research Master's dissertation submitted in order to obtain the academic degree of
Supervisors: Prof. dr. El-Houssaine Aghezzaf, Prof. dr. ir. Sidharta Gautama
Student number: 01508811Preface
Everlasting challenges for a dynamic society are fascinating to delve into. It was therefore with great pleasure that I immersed myself in the field of city logistics. A hot topic about which I could gain more insights relating to the challenges and the different stakeholders.
This dissertation was often a bumpy road, with ups and downs, with fun moments and tougher ones, with moments of relief and even despair. Nevertheless, it yielded high satisfaction and taught me both theo-retical and practical knowledge, hard and soft skills. Of course, all of this would not have been possible without the supporting people around me.
First, I would like to express my gratitude towards my promotors, prof. dr. El-Houssaine Aghezzaf and prof. dr. ir. Sidharta Gautama. Their support and expert knowledge were crucial for my progress, and their insights and feedback were educational and constructive. It was with great pleasure that I attended every meeting to absorb new information.
Further, a word of thanks and appreciation is well-deserved for Delphine Lucq and dr. Samuel Van Ackere. Delphine for being an always available point of contact and for providing me with useful in-sights based on her own experience in the topic. Samuel for his guidance on the GIS programming part of this master’s dissertation.
A special mention also goes to my close friends Sander, Wout, Lise and Lieve, who made the last 5 years an extraordinary experience in pursue of our engineering degree. It was a pleasure to finish the uncountable group assignments together and share the memorable extra-curricular activities. Also the support of my girlfriend Lauren is greatly appreciated.
Finally, my deepest gratitude is expressed towards my parents. Their unconditional support is limitless and no words can describe how grateful I am for that. They gave me the opportunity to study at the university and provided me with everything I needed, day after day, year after year. None of this would have been possible without them.
The author gives permission to make this master dissertation available for consultation and to copy parts of this master dissertation for personal use. In all cases of other use, the copyright terms have to be respected, in particular with regard to the obligation to state explicitly the source when quoting results from this master dissertation. (31/05/2020)
Over the years, e-commerce has grown enormously. Especially the delivery of parcels, which is currently on an unseen high level. It goes without saying that such a growth also results in several challenges. In-creased congestion in the city centers due to the many delivery vans, the high rate of failed first deliveries due to the recipient not being home, and environmental aspects are a few of them. Moreover, urban ac-cess regulation schemes do not make it easier for the delivery companies.
The aim of this master’s dissertation is to analyze the use of an alternative delivery method next to home delivery: the delivery to collection points. A collection point can be either in an existing shop, or it can be an unmanned parcel locker. The main idea is that a delivery to those collection points is cheaper because of the consolidation of deliveries and the (virtual) elimination of failed first deliveries.
With the aid of a mathematical model, the collection points that should be used are selected from a given list such that the total cost – consisting of the delivery cost and the cost of operating the collection points – is minimized. A non-linearity in the model imposes the use of a heuristic to solve the problem sub-optimal within the current computational limits. A tabu search heuristic will serve this purpose. The convergence aspects of the heuristic algorithm are extensively tested and validated.
The application of the model on real-life datasets covering parts of the city of Ghent shows that signifi-cant cost reductions can be obtained, but that a lot depends on the chosen values for the parameters. An important parameter is the coverage radius R, which determines the population that could possibly make use of the collection point. A second important parameter is the fraction of the covered population that effectively would use the collection points (fcp). At last, the operational cost c plays a huge roll as well. Various scenarios are conducted to evaluate the impact of those and other parameters on the end solution.
Finally, it could be concluded that collection point delivery serves as a cost-efficient alternative for home delivery. However, the solution highly depends on the chosen values for the parameters, such that a careful analysis of fcpfor various R-values is required, as well as a thorough study of the value of c. The model enables the courier companies to analyze various scenarios, and to evaluate and compare several delivery policies. In particular, the policy where everyone who lives within a predefined range from a used collection point is obligated to use that collection point, is interesting. A cheaper delivery cost could act as an incentive to make use of them.
Keywords: City logistics, E-Commerce, Collection Point Delivery, Tabu Search
iii
City logistics: the use of collection points as a
cost-efficient alternative for e-commerce home deliveries
Dries Lioen
Supervisors: Prof. dr. El-Houssaine Aghezzaf, Prof. dr. ir. Sidharta Gautama
Abstract –– Over the years, e-commerce has grown
enormously. Especially the delivery of parcels, which is currently on an unseen high level. It goes without saying that such a growth also results in several challenges. Increased congestion and the high rate of failed first deliveries are important ones. This paper analyzes the use of an alternative delivery method next to home delivery: the delivery to collection points. The main idea is that a delivery to those collection points is cheaper because of the consolidation of deliveries and the (virtual) elimination of failed first deliveries. With the aid of a mathematical model, the collection points that should be used are selected, such that the total cost is minimized. A non-linearity in the model imposes the use of a heuristic to solve the problem suboptimal within the current computational limits. A tabu search heuristic will serve this purpose. An important parameter is the coverage radius R, which determines the population that could possibly make use of the collection point. A second important parameter is the fraction of the covered population (fcp) that effectively would use the collection
points. At last, the operational cost c of a collection point is important as well. It could be concluded that collection point delivery serves as a cost-efficient alternative for home delivery. However, the solution highly depends on the chosen values for the parameters, such that a careful analysis of fcp for various R-values is required, as well as
a thorough study of the value of c. The model enables the courier companies to analyze various scenarios, and to evaluate and compare several delivery policies.
Keywords –– City Logistics, E-Commerce, Collection
Point Delivery, Tabu Search
I. INTRODUCTION
The demand for urban freight transportation has increased considerably owing to urbanization and demographic growth, along with the increased diffusion of e-commerce, management principles (e.g. just-in-time) and pervasive technologies, ensuring the economic dynamics of urban areas. At the same time, freight transportation is affected by various issues, inefficiencies, and externalities, which become more evident in the last mile segment. [1]
Over the years, delivery companies have tried to more efficiently organize their logistics schemes, especially in that costly last mile segment. This has led to various research in the field of Operations Research. Furthermore, several regulations imposed by the city governments, such as Low Emission Zones and ‘het Circulatieplan’ in Ghent, complicate the access to inner city. Although with the aim of improving the quality of life in the city while still ensuring accessibility, it inevitably forces delivery companies to adjust their delivery structure.
Nowadays, the standard for parcel delivery is home delivery. As it faces specific problems, this paper will discuss an alternative delivery method, being the use of collection points. At these points, customers can pick up their parcels themselves at a convenient time. These collection points can either be in-store or an unmanned parcel locker. The main idea is that cheaper delivery is possible at these collection points due to the consolidation of deliveries and the absence of the high rate of failed first deliveries, specific to home delivery. This paper will investigate which collection points to use and what the implied cost savings would be, considering a variety of parameters.
The remainder of this paper is structured as follows. Section II will formulate the mathematical model used to address the problem. In section III, a tabu search heuristic is presented, that is used when an exact solver (e.g. Gurobi) becomes infeasible. The performance of the tabu search heuristic will be validated in section IV: the convergence towards the optimal solution is extensively examined. Further, section V mentions several scenarios and gives an interpretation of the results. Some concluding remarks are reported in section VI.
II. MODEL FORMULATION
A. Problem statement
The goal is to determine the collection points that should be used as a delivery point and which ones not, in order to minimize the total cost of delivery. For each collection point, this will be a trade-off between the customers it could serve with a cheaper delivery method and the operational cost of using a collection point. The customers that it could serve is dependent on the willingness of the population living nearby that collection point to effectively use it.
B. Notation and parameters
Given a set of possible collection point locations V, the model needs to specify which collection points j to use. There is a total of n collection points. In order to do so, it is assumed that a fixed coverage radius R is assigned to each collection point such that it could only serve the population inside its coverage circle.
From that population, only a fraction shops online, and from that fraction, only a fraction is willing to use the collection points instead of the more convenient home delivery. This is represented by the parameters fonline and fcp respectively. Further, an online shopping
iv Further, 3 important cost parameters need to be estimated: the per unit cost of home delivery, the per unit cost of collection point delivery and the operational cost of a collection point. These are referred to by respectively chome, ccp and c. A good
estimate for the first two is obtained from a study performed by Gevaers et al. [2] in 2014. They have calculated the per unit cost of home delivery in dense areas at €2.75, while the collection point delivery appears to be much cheaper with a cost of €1.35.
Another important part concerns the geographical and demographical data needed. The area of interest is subdivided into several zones indexed with i, from which the population (popi) and area (areai) is known
or calculated beforehand. The area of interest has a total of m zones.
Finally, one must be able to calculate the coverage in a certain zone i by a set of used collection points. This is referred to as COVi.
C. Model formulation
The decision variables listed below will be implemented in the model.
Hi : the number of parcels delivered at
home in zone i (integer)
Si : the number of parcels delivered at a
collection point in zone i (integer) yj : binary decision variable, 1 if collection
point j is used; 0 if not
With the given information, the following mathematical model can be constructed. The cost parameters can be further generalized to a different value for each zone i and/or collection point j.
Min ∑ 𝑐ℎ𝑜𝑚𝑒𝑖𝐻𝑖 𝑚 𝑖=1 + ∑ 𝑐𝑐𝑝𝑖𝑆𝑖 𝑚 𝑖=1 + ∑ 𝑐𝑗𝑦𝑗 𝑛 𝑗=1 (1) Subject to 𝑝𝑜𝑝𝑖𝑓𝑜𝑛𝑙𝑖𝑛𝑒𝑓𝑜𝑟𝑑𝑒𝑟 ≤ 𝐻𝑖+ 𝑆𝑖 ∀𝑖 = 1 … 𝑚 (2) 𝐶𝑂𝑉𝑖 𝑎𝑟𝑒𝑎𝑖 𝑓𝑐𝑝𝑝𝑜𝑝𝑖𝑓𝑜𝑛𝑙𝑖𝑛𝑒𝑓𝑜𝑟𝑑𝑒𝑟 ≥ 𝑆𝑖 ∀𝑖 = 1 … 𝑚 (3)
𝐻𝑖 and 𝑆𝑖≥ 0 and integer ∀𝑖 = 1 … 𝑚 (4)
𝑦𝑗∈ {0,1} ∀𝑗 = 1 … 𝑛 (5)
The objective function (1) minimizes the total cost, consisting of a delivery cost and an operational cost for the used collection points. The delivery cost is divided into two parts: a cost for the home deliveries and a cost for the collection point deliveries. The first set of constraints (2) makes sure that the total demand for parcel delivery in zone i, being 𝑝𝑜𝑝𝑖𝑓𝑜𝑛𝑙𝑖𝑛𝑒𝑓𝑜𝑟𝑑𝑒𝑟, is
covered by either home or collection point delivery.
the demand in zone i only a fraction 𝐶𝑂𝑉𝑖/𝑎𝑟𝑒𝑎𝑖 is
covered and only a fraction fcp will use the collection
points. Finally, the last sets of constraints (4) and (5) specify respectively the integrality and binary restrictions on the decision variables.
In order to be able to solve the model, COVi must be
calculated. This value is a function of the collection points, their locations and the coverage radius: COVi =
f(y1, y2,… , yn, R, spatial distribution collection points).
The spatial distribution and R are given and thus fixed. With Figure 1 as a clarification, the following formula for COVi can be derived, assuming that no area can be
within a coverage circle of 4 or more collection points: 𝐶𝑂𝑉𝑖 = ∑ 𝑐𝑜𝑣𝑗𝑖𝑦𝑗 𝑛 𝑗=1 − ∑ ∑ 𝑑𝑢𝑜𝑘𝑗𝑖 𝑦𝑘𝑦𝑗 𝑛 𝑘=𝑗+1 𝑛 𝑗=1 + ∑ ∑ ∑ 𝑡𝑟𝑖𝑜𝑙𝑘𝑗𝑖 𝑦𝑙𝑦𝑘𝑦𝑗 𝑛 𝑙=𝑘+1 𝑛 𝑘=𝑗+1 𝑛 𝑗=1 (6)
Figure 1: Visual aid in the determination of formula (6). The coefficients 𝑐𝑜𝑣𝑗𝑖, 𝑑𝑢𝑜𝑘𝑗𝑖 and 𝑡𝑟𝑖𝑜𝑙𝑘𝑗𝑖 are not
easy to determine analytically as zones can have an arbitrary shape. The use of GIS is recommended. Note that constraint (3) becomes highly non-linear.
D. Special case
In this subsection, a special case of the model will be discussed. It is assumed that the spatial distribution of the collection points and the coverage radius are chosen in such a way that no overlap between coverage circles is possible. As a result, the second and third term in formula (6) disappear and the function for COVi becomes a simple linear function in yj.
Consequently, the model also becomes linear and is now easily solved. The only thing that changes is constraint (3), which can be replaced with:
∑ (𝑐𝑜𝑣𝑗 𝑖 𝑎𝑟𝑒𝑎𝑖 𝑦𝑗) 𝑛 𝑗=1 𝑓𝑐𝑝𝑝𝑜𝑝𝑖𝑓𝑜𝑛𝑙𝑖𝑛𝑒𝑓𝑜𝑟𝑑𝑒𝑟 ≤ 𝑆𝑖 ∀𝑖 = 1 … 𝑚 (7) E. GIS reformulation
The linear model which was valid when overlap was not possible, can be reformulated. Previously, it was assumed that each zone had a uniform population density. One could also work with real population numbers, instead of averaging out in each zone. In fact, the model will become less of an approximation.
v The idea is to make use of GIS such that the approximation is not needed anymore. The zoning will not apply now and consequently the index i in the mathematical model can be disregarded. As a result, there is only looked at the number of parcel deliveries at home or at a collection point for the whole area of interest, not for each specific zone separately as was done before.
Based on a network graph loaded from OpenStreetMap's API and a .shp-file containing the population of Ghent, the covered population within the coverage circle of each collection point can be determined separately. Basically for each collection point j, one has calculated the following part of the set of constraints (7): ∑ 𝑐𝑜𝑣𝑗
𝑖
𝑎𝑟𝑒𝑎𝑖𝑝𝑜𝑝𝑖 𝑚
𝑖=1 . Stated differently,
the population inside the coverage circle of each collection point is determined exactly and a zoning is not considered anymore. This allows you to work with real-life exact population data, without averaging out the population density in a zone.
If one defines the newly calculated part as 𝑝𝑜𝑝𝑐𝑜𝑣 𝑗
for collection point j, and 𝑝𝑜𝑝𝑡𝑜𝑡 as the total population
within the area of interest, the following model results. Min 𝑐ℎ𝑜𝑚𝑒𝐻 + 𝑐𝑐𝑝𝑆 + 𝑐 ∑ 𝑦𝑗 𝑛 𝑗=1 (8) Subject to 𝑝𝑜𝑝𝑡𝑜𝑡𝑓𝑜𝑛𝑙𝑖𝑛𝑒𝑓𝑜𝑟𝑑𝑒𝑟 ≤ 𝐻 + 𝑆 (9) ∑ 𝑝𝑜𝑝𝑐𝑜𝑣 𝑗 𝑛 𝑗=1 𝑦𝑗𝑓𝑜𝑛𝑙𝑖𝑛𝑒𝑓𝑜𝑟𝑑𝑒𝑟𝑓𝑐𝑝≥ 𝑆 (10)
𝐻 and 𝑆 ≥ 0 and integer (11) 𝑦𝑗∈ {0,1} ∀𝑗 = 1 … 𝑛 (12)
S and H now represent the total parcels delivered at a collection point and at home respectively per time unit. Be aware that the model is only valid when no overlap between any pair of coverage circles is possible.
III. SOLUTION METHODS
A. Gurobi solver
The linear formulation and its reformulation can be easily solved with the Gurobi solver. The only drawback – and it is a huge one – is that the model only returns the optimal solution if overlap between the coverage circles of any pair of collection points is avoided. This is an important restriction. When overlap is present, the model overestimates the covered population and consequently returns a lower bound on the optimal total cost. Another approach is needed to solve the model if overlap is present, which in general cannot be avoided.
B. Tabu search heuristic
As the developed mathematical model is highly non-linear, it becomes hard to solve with the known methods in Operations Research. That is why often heuristics are applied in order to solve the model much easier and faster, however without the guarantee of optimality. Nevertheless, a good designed heuristic gives a good suboptimal solution in most cases. A greedy approach is presented, together with a slight update towards a tabu search heuristic.
In order to explain this efficiently, some terminology should first be introduced. A collection point is referred to as a CP. The status of a CP can be used or not used, which can be represented binary as 1 and 0 respectively, and is thus equal to the value of yj. A list
consisting of the statuses of the collection points is called a configuration. As an example, when there are 5 CPs, [0 1 0 1 0] means that only the second and fourth CP are used.
With this terminology in mind, the flow diagram in Figure 2 resembles the logical flow of the designed greedy heuristic procedure.
Figure 2: Flow diagram heuristic.
It starts with an initial configuration, which in general can be randomly chosen. Given the configuration, the covered area and the population underneath it can be calculated. Consequently, the total cost can be calculated. This is because within the covered area, everyone who wants to use the CPs (fonlinefcp) will also make use of it due to the cheaper
delivery. The zones are also not relevant anymore. Then the algorithm adopts a greedy approach as it looks in the direct neighborhood of the current best configuration (i.e. changing one status) and stores the best after all CPs have been encountered. If a lower cost than the current best is found, the solution is updated, and the process is repeated. If not, the current best is returned as the solution.
The determination of the covered area, the population underneath it and the resulting total cost will now be explained in greater detail. First, the area of interest is specified as well as the total population inside that area poptot. The osmnx-package in Python
lets you download spatial geometries and model, project, visualize, and analyze street networks and other spatial data from OpenStreetMap's APIs. [3] A network graph of the city of Ghent is loaded.
vi coverage radius R of these used CPs. Polygons are then wrapped around the colored parts to specify the boundaries of the covered area. Afterwards, based on a .shp-file containing the population of Ghent, the population underneath the covered area popcov can be
determined.
Next, the calculation of the total cost becomes straightforward. The number of parcels per time unit that are delivered to a collection point in the area of interest is S and is determined by the fraction inside the covered area that is willing to use the collection points: S = 𝑝𝑜𝑝𝑐𝑜𝑣𝑓𝑜𝑛𝑙𝑖𝑛𝑒𝑓𝑜𝑟𝑑𝑒𝑟𝑓𝑐𝑝 (13)
Similarly, H represents the number of parcels per time unit delivered at home in the area of interest and consists of 2 parts. On the one hand there is a contribution of the non-covered population, secondly there is a contribution of the covered population that still prefers home delivery:
𝐻 = 𝑝𝑜𝑝𝑐𝑜𝑣𝑓𝑜𝑛𝑙𝑖𝑛𝑒𝑓𝑜𝑟𝑑𝑒𝑟(1 − 𝑓𝑐𝑝)
+(𝑝𝑜𝑝𝑡𝑜𝑡− 𝑝𝑜𝑝𝑐𝑜𝑣)𝑓𝑜𝑛𝑙𝑖𝑛𝑒𝑓𝑜𝑟𝑑𝑒𝑟
(14) The total cost is then:
Total cost = 𝑐𝑐𝑝𝑆 + 𝑐ℎ𝑜𝑚𝑒𝐻 + 𝑐 ∑ 𝑦𝑗 𝑛
𝑗=1
(15) This greedy approached can be improved by adding a tabu-list, a list of moves that it should not consider in a certain iteration. The heuristic can then be referred to as a tabu search heuristic, a well-known and frequently used metaheuristic. A metaheuristic can be defined as a higher-level heuristic procedure designed to guide other methods or processes towards achieving reasonable solutions to difficult combinatorial mathematical optimization problems. [4]
In order to speed up the algorithm, not all neighbors need to be checked in each iteration as you will inevitably encounter configurations that were already analyzed. A tabu-list is kept and this list is updated in each iteration. It appears the list should be of length L=2, holding the position of the last 2 changed statuses in the configuration. Figure 3 clarifies this. The 2 last changed statuses do not need to be changed again in iteration k as it would result in a configuration already encountered before: they both appear in the list of neighbors 2 iterations earlier, i.e. iteration k-2. One of them is the green one, which outperforms the other one, while the green one itself is outperformed by the best neighbor one iteration later, i.e. in iteration k-1.
Figure 3: A possible iteration scheme of the heuristic.
In this section, the convergence of the tabu search heuristic, and the influence of the starting configuration, will be analyzed by setting up an experiment. A relatively small dataset is used to quickly run the experiments and gather the results. Runtimes are also analyzed.
A dataset consisting of 12 collection points is used, which are situated close to each other. The 2 farthest CPs are only 1.15 km away. The total population poptot
in the area of interest is 27675. Exhaustive enumeration to determine the optimal configuration is still feasible. The time horizon is daily and the parameters fcp, fonline, forder and c are set at 20%, 70%,
13/365 orders per day and €5 per day respectively. A. Convergence
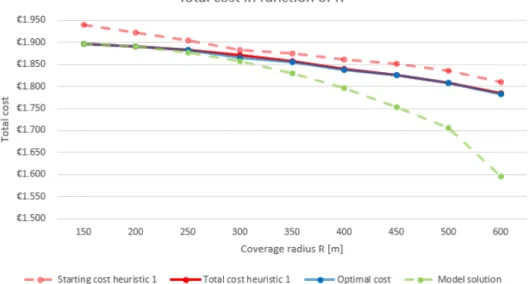
Figure 4 shows the total cost of the start and end configuration obtained by the heuristic starting from no CPs used (red), the optimal cost (blue) and the lower bound obtained via the model (green).
Figure 4: Total cost heuristic versus optimal. It can be derived that the heuristic procedure evolves quite well to the optimal solution, even reaching optimality in half of the cases. When it does not reach optimality, it is remarkably close to the optimum (within 0.2%). It can be concluded that the tabu search heuristic is quite stable and converges well. The lower bound worsens for higher R.
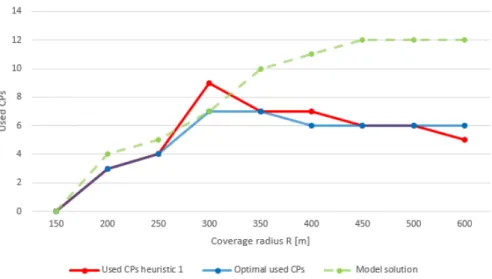
The graph of the used CPs in the end configuration is shown on Figure 5. The shape can be intuitively explained.
Figure 5: Used CPs heuristic versus optimal. For low values of R, only a few shops will be able to cover a large enough part of the population to overcome the operational cost. With increasing R, more and more CPs will be able to join, until eventually it declines for large R. For large R, the overlap becomes greater and greater such that some
vii CPs will not be worthwhile anymore because that additional CP would only result in a small additional covered population, not sufficient to cover the operational cost. In this case however, the decline is limited because there are only a few ‘internal’ CPs. For a larger dataset, the share of internal CPs will be higher, and the decline will be more pronounced: a more parabolic curve should be noticed. The downward trend is not present for the model solution (green dotted line) because overlap is not corrected but simply counted multiple times.
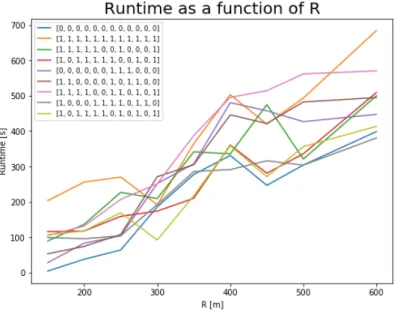
B. Starting configuration
In order to analyze the influence of the starting configuration on the end solution, the heuristic will be run several times for different starting configurations. In total, 10 starting configurations are used as input to the heuristic. The experiment is repeated for several R-values, ranging from 150m to 600m. Among the 10 starting configurations, there is the ‘no CPs used’, the ‘all CPs used’ and 8 randomly generated configurations. Figure 6 shows the evolution of the heuristic when R = 350m. Similar graphs can be obtained for the other R-values as well. It can be concluded that the starting configuration has limited impact on the convergence.
Figure 6: Evolution heuristic for R = 350m.
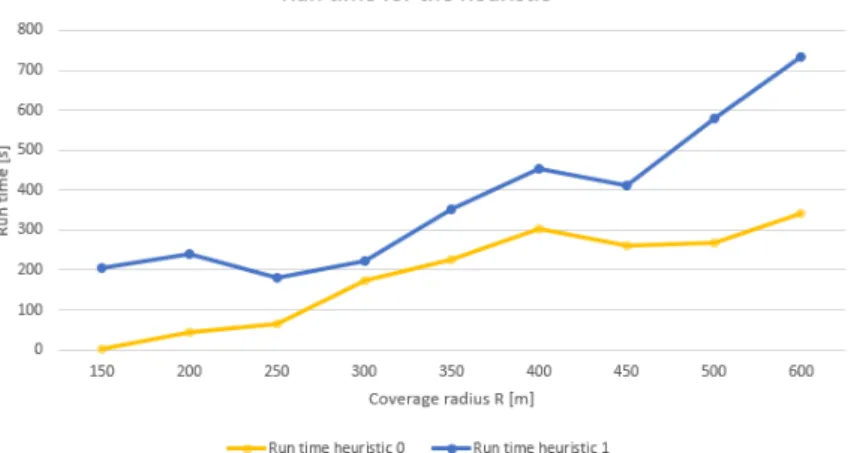
C. Running time
In the previous experiment, the runtime was also recorded for each starting configuration. Figure 7 summarizes the result. The experiments are run on an Intel® CoreTM i5-5200U CPU @ 2.2GHz 2.5GHz
processor. Based on the running time, starting with no CPs used would be a good choice. A random choice is unpredictable in terms of running time, while starting with all CPs used has a high running time due to the costly first iterations. A more advanced heuristic is not necessary because convergence is already satisfiable.
Figure 7: Runtime heuristic.
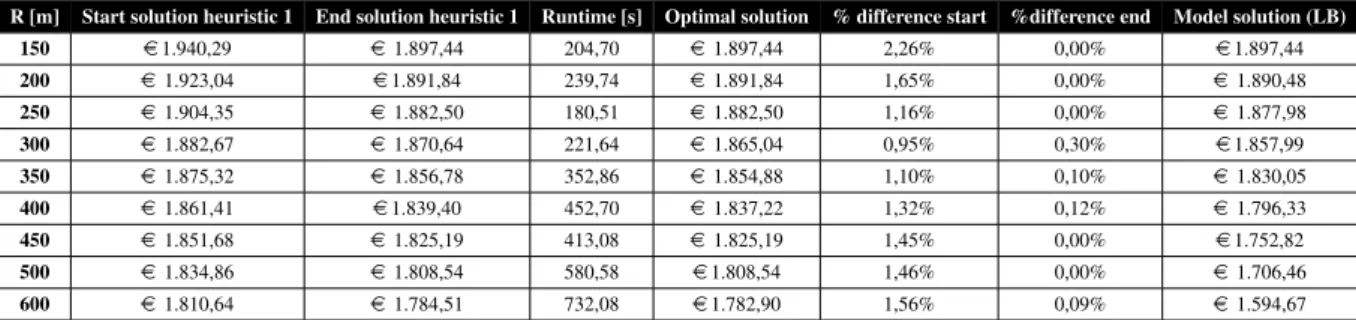
When a larger dataset of 50 CPs is used, similar graphs can be obtained. It is important to see how the running time scales. Table 1 compares the runtime for the dataset with 12 CPs and the one with 50 CPs when there is started from no CPs used.
Compared to the small dataset, the runtimes have increased on average with a factor of 33. Because the number of collection points has increased approximately by a factor of 4, it can be concluded that runtime scales more than quadratically, but less than cubically with the number of collection points. In this case, the exponent at the number of collection points in the formula for the runtime of the heuristic is approximately 2.46.
Table 1: Runtimes for the small and large dataset.
R [m] Runtime small [s] Runtime large [s] 150 3.77 17.94 200 45.31 556.09 250 64.45 3342.99 300 174.66 11184.25 350 224.41 14559.18 400 301.68 6420.96 450 262.56 6293.52 500 269.65 7053.06 600 341.56 10530.00 V. SCENARIO ANALYSIS A. Detailed analysis
The configurations behind the graphs shown before are visualized on a city map of Ghent in Figure 8.
Figure 8: Graphical representation optimal configurations. A red dot is an unused CP while a green disk represents the coverage circle of a used CP. The visualization clearly confirms why for large R (e.g. R=500m or 600m) the number of used CPs decreases again: using the red dots would result in no or only a small additional covered population, not sufficient to cover the operational cost.
To analyze the configurations more into detail, the underlying numbers are plotted. More specifically, there is looked at the value of S and H, and the delivery cost and total cost separately. Consider Figure 9. When all CPs are used (the orange curve), S is maximal because the largest possible area is covered. The other extreme is no CPs used, and of course S is simply 0 then. Any other configuration will be positioned between those 2 extremes. S also increases with
viii 689.98 minus S.
Figure 9: Daily CP deliveries (S).
The daily delivery cost curves shown on Figure 10 – without the operational cost – also have typical shapes. Without the use of CPs, the delivery cost is at its maximal value of €1.897,44. The lowest delivery cost is always obtained when all CPs are used, again with the simple explanation that the largest part of the population can be covered. Any other configuration finds itself between those two extremes. A larger R also results in a decrease of the delivery cost.
Figure 10: Daily delivery cost.
B. Relationship R-fcp
An important assumption made was that fcp remained
the same regardless of the value of R. In the real world, this assumption will probably not be the most accurate one. Intuitively, one can argue that the further a person lives from a collection point, the less likely he or she will be inclined to make use of the CP.
For a given R, the value fcp represents some sort of
average value. The larger R is, the lower that average will be. The exact relationship is not known, but only that there exists a negative correlation between the two. Therefore, several relationships will be analyzed: 2 linear, 2 quadratic and 1 exponential one. It was chosen to let the different functions coincide at a value of 20% for R = 400m. The 5 functions are displayed on Figure 11.
Figure 11: The 5 fcp - R relationships.
changed to 0.05, otherwise it would be 0. Figure 12 displays the total cost of the end configurations.
First, the minimum cost was reached at a coverage radius R = 300m for all but one relationship. Only the lin1-relationship had a minimum at 450m. Second, the difference between the 5 relationships was never more than €58 daily. That might not be extremely high, but it will quickly accumulate on a yearly basis, and is of course dependent of the chosen parameter values. It is noted that the total cost curves now increase again for larger R due to the small values for fcp.
Figure 12: Total cost for the different relationships. Besides that, the effect of varying fcp can also be read
from the graph. Except for R = 400m, each radius is evaluated for 6 different values of fcp. The sequence in
which the curves appear on the graphs is ordered in terms of increasing fcp-value for a given R: the larger
fcp, the lower the cost will be, and the more CPs will be
used. For example, all cost curves lie below the gray dotted line (fcp constant and equal to 20%) for R<400m,
while they lie above it for R > 400m. VI. CONCLUSIONS
The model presents which collection points to use by minimizing the total cost. A mathematical model, that was highly non-linear, was solved by means of a tabu search heuristic which had good convergence. 2 parameters require an accurate estimate as they greatly influence the solution: c and fcp. Also, it is important to
grasp the relationship between R and fcp. Playing with
these parameters and evaluating different scenarios can give great insights to the courier companies.
REFERENCES
[1] G. Perboli and M. Rosano, “Parcel delivery in urban areas: Opportunities and threats for the mix of traditional and green business models,” Transp. Res. Part C Emerg. Technol., vol. 99, pp. 19–36, Feb. 2019. Helmut Kopka, LaTeX, eine einführung, Addison-Wesley, 1989.
[2] R. Gevaers, E. Van de Voorde, and T. Vanelslander, “Cost Modelling and Simulation of Last-mile Characteristics in an Innovative B2C Supply Chain Environment with Implications on Urban Areas and Cities,” Procedia - Soc. Behav. Sci., vol. 125, pp. 398–411, Mar. 2014.
[3] G. Boeing, “OSMnx documentation — OSMnx 0.11.4 documentation,” 2020. [Online]. Available: https://osmnx.readthedocs.io/en/stable/. [Accessed: 08-Apr-2020].
[4] E. A. Silver, “An overview of heuristic solution methods,” Journal of the Operational Research Society, vol. 55, no. 9. Nature Publishing Group, pp. 936–956, 2004.
Contents
List of Figures xiii
List of Tables xvii
1 Introduction 1
1.1 E-commerce and parcel delivery . . . 2
1.2 Problem definition . . . 3
1.3 Goal of the Master’s Dissertation . . . 4
2 Literature review 5 2.1 City Logistics . . . 6
2.2 The logistics last mile problem . . . 6
2.3 Parcel delivery strategies . . . 7
2.3.1 Urban Consolidation Center . . . 8
2.3.2 Pick-up points . . . 10
2.3.3 Parcel lockers . . . 11
2.3.4 Neutral logistics provider for the last mile . . . 12
2.3.5 Overview . . . 13 ix
2.4 Logistic challenges city of Ghent . . . 13
2.4.1 Circulatieplanand Low Emission Zone . . . 14
2.4.2 Parcel delivery in Ghent . . . 16
2.5 Hub Location Problem . . . 17
2.5.1 Types of models . . . 18
2.5.2 Basic mathematical formulation . . . 20
2.5.3 Solution techniques . . . 21
2.5.4 Tabu search heuristic . . . 21
2.6 Parcel locker models . . . 23
3 Mathematical model 24 3.1 Model formulation . . . 25
3.2 Model non-linearity . . . 27
3.3 Special case . . . 29
3.4 GIS reformulation . . . 29
4 Data collection and preprocessing 31 4.1 Availability of data . . . 32
4.2 Data sources . . . 32
4.2.1 Geographical and demographical data . . . 32
4.2.2 Cost data . . . 33
4.3 Nominal values parameters . . . 35
4.4 Data preprocessing . . . 35
4.5 Overview datasets . . . 36
5 Heuristic solution method 37 5.1 The greedy approach . . . 38
5.2 Tabu search approach . . . 40
5.3 Convergence aspects . . . 41
CONTENTS xi
6 Performance analysis 44
6.1 Mathematical model testing . . . 45
6.1.1 Artificial city . . . 45
6.1.2 Real-life case of Ghent . . . 48
6.2 Tabu search heuristic testing . . . 49
6.2.1 Convergence tabu search heuristic . . . 50
6.2.2 Influence starting configuration . . . 54
6.2.3 Conclusion . . . 58
6.3 Solving a small problem . . . 58
6.4 Solving a larger problem: scalability . . . 61
7 Scenario analysis 66 7.1 Impact coverage radius R . . . 67
7.2 Detailed analysis configurations . . . 69
7.3 Sensitivity to value of fcp . . . 74
7.3.1 Artificial city - no overlap . . . 74
7.3.2 Real-life city - overlap . . . 75
7.4 Relationship R − fcp . . . 77
7.5 Impact other parameters . . . 82
7.5.1 Changing e-commerce parcel demand . . . 82
7.5.2 Changing the delivery costs . . . 84
8 Conclusion and future research 86 8.1 Conclusion . . . 87
8.2 Future research . . . 88
Bibliography 89 Appendices 93 A Analytical approach to determine covij . . . 94
C Neighborhoods Ghent . . . 98
D Small dataset . . . 98
E Small dataset - increased spatiality . . . 99
List of Figures
2.1 Schematic visualization of the UCC concept. . . 9
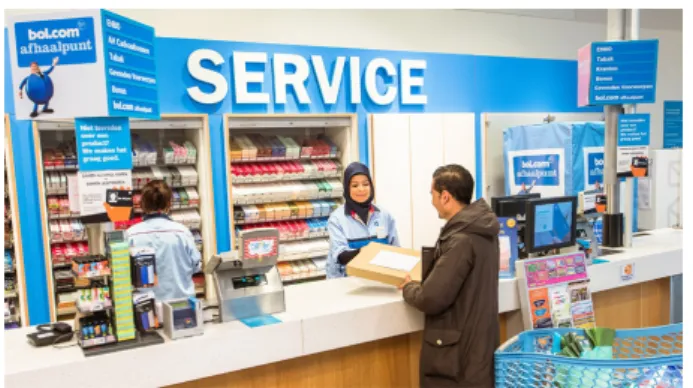
2.2 A bol.com pick-up point in a Albert Heijn supermarket. . . 10
2.3 Cubee, the parcel lockers of bpost. . . 11
2.4 Overview of the 7 sectors created by het Circulatieplan in Ghent. . . 14
2.5 Schematic visualization of the different traffic flows and their share of the total traffic in the inner city of Ghent. . . 15
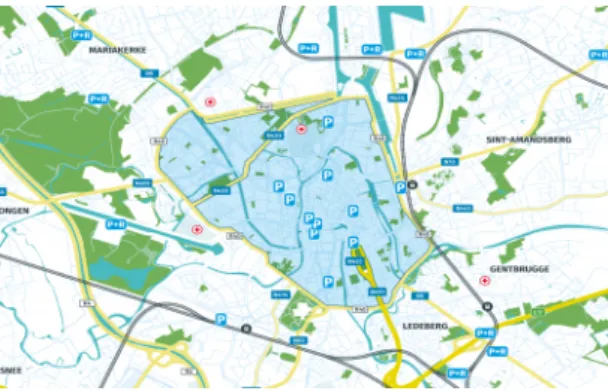
2.6 The blue shaded area corresponds to the low emission zone. . . 16
2.7 A cubicycle, able to transport up to 125 kg. . . 16
2.8 A bicycle courier of CargoVelo. . . 17
2.9 Initial configuration of the HLP, where customers need to be assigned to hubs. . . 18
2.10 Possible solution for the HLP in Figure 2.9. . . 18
3.1 Overlap of 2 circles. . . 28
3.2 Overlap of 3 circles. . . 28
3.3 Overview set-up model. . . 28
4.1 Division of Ghent into 28 statistical sectors. . . 33
5.1 Flow diagram explaining the steps in the heuristic. . . 38
5.2 A possible iteration scheme of the heuristic. The best configuration in each iteration is indicated in green. Red configurations can be skipped because they were already encountered in previous iterations. . . 40
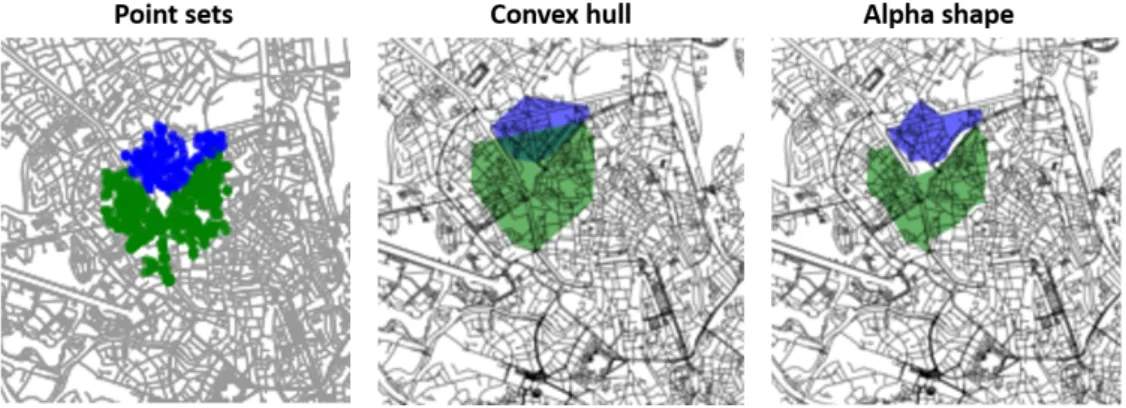
5.3 Convex hull versus alpha shape. . . 43
5.4 Convex hull versus alpha shape on a specific example. . . 43
6.1 Graphical representation of the artificial city set-up. . . 45
6.2 The weekly total cost as a function of c (artificial city). . . 46
6.3 Number of CP and home deliveries in a week as a function of c (artificial city). . . 46
6.4 Used CPs in the solution as a function of c (artificial city). . . 47
6.5 Evolution solution for varying c. . . 47
6.6 13 CPs, each located in a neighborhood. . . 48
6.7 The weekly total cost as a function of c (real city). . . 49
6.8 Number of CP and home deliveries in a week as a function of c (real city). . . 49
6.9 Used CPs in the solution as a function of c (real city). . . 49
6.10 Location of the 12 collection points in the small dataset (appendix D). . . 50
6.11 Total cost end solution for the heuristic (0) as a function of R. . . 51
6.12 Total cost end solution for the heuristic (1) as a function of R. . . 51
6.13 Used CPs end solution for the heuristic (0) as a function of R. . . 53
6.14 Used CPs in end solution for the heuristic (1) as a function of R. . . 53
6.15 Runtime for the heuristic as a function of R. . . 54
6.16 Evolution heuristic R = 150m. . . 55 6.17 Evolution heuristic R = 200m. . . 55 6.18 Evolution heuristic R = 250m. . . 55 6.19 Evolution heuristic R = 300m. . . 55 6.20 Evolution heuristic R = 350m. . . 55 6.21 Evolution heuristic R = 400m. . . 55 6.22 Evolution heuristic R = 450m. . . 55 6.23 Evolution heuristic R = 500m. . . 55
LIST OF FIGURES xv
6.24 Evolution heuristic R = 600m. . . 56
6.25 Runtime heuristic for different starting configurations. . . 57
6.26 Location of the 12 CPs in the small dataset with increased spatiality (appendix E). . . 59
6.27 Total cost small dataset with increased spatiality. . . 59
6.28 Used CPs small dataset with increased spatiality. . . 60
6.29 Runtime for the heuristic as a function of R. . . 61
6.30 The 50 CPs of the large dataset on a map of Ghent. . . 62
6.31 Total cost end solution for the heuristic (0) as a function of R. . . 62
6.32 Evolution of the tabu search heuristic (large dataset, R = 350m). . . 63
6.33 Used CPs in end solution for the heuristic (0) as a function of R. . . 63
6.34 Runtime for the heuristic as a function of R. . . 64
7.1 Location of the 12 collection points on the map of Ghent. . . 67
7.2 Graphical representation of the optimal configuration. . . 68
7.3 Daily CP deliveries S. . . 72
7.4 Daily home deliveries H. . . 72
7.5 Daily delivery cost. . . 72
7.6 Daily total cost. . . 72
7.7 Total weekly cost for varying fcp(artificial city). . . 74
7.8 CP and home deliveries for varying fcp(artificial city). . . 75
7.9 Used CPs for varying fcp(artificial city). . . 75
7.10 Total daily cost for varying fcp(real city). . . 76
7.11 CP and home deliveries for varying fcp(real city). . . 76
7.12 Used CPs for varying fcp(real city). . . 77
7.13 The 5 relationships between R and fcp. . . 78
7.14 Impact on the total cost for the various relationships. . . 79
7.15 Impact on the used CPs for the various relationships. . . 80
7.16 Runtime for the various relationships. . . 81
7.17 Impact of fonlineand forderon the total cost. . . 82
7.19 Impact of fonlineand forderon the amount of home deliveries. . . 83
7.20 Impact of fonlineand forderon the total used CPs. . . 83
7.21 Impact of chomeand ccpon the total cost. . . 84
7.22 Impact of chomeand ccpon the amount of CP deliveries. . . 84
7.23 Impact of chomeand ccpon the amount of home deliveries. . . 84
7.24 Impact of chomeand ccpon the total used CPs. . . 85
A1 9 possible cases of how a coverage radius can be positioned relative to a zone. . . 94
A2 Visual aid in the derivation of formula (A). . . 94
List of Tables
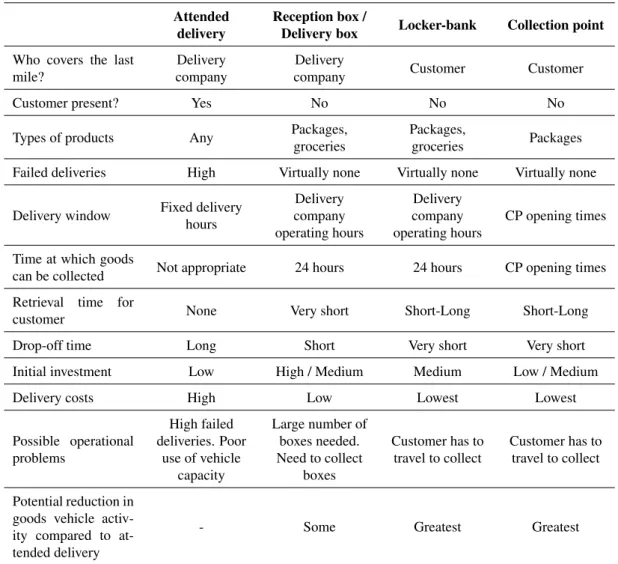
2.1 A comparison of last mile delivery systems. . . 13
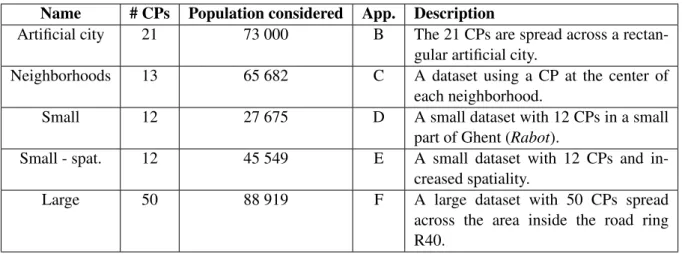
4.1 Overview of the used datasets as input in the model and/or heuristic. . . 36
6.1 Results tabu search heuristic starting from no CPs used on the small dataset. . . 52
6.2 Results tabu search heuristic starting from all CPs used on the small dataset. . . 52
6.3 Minimum, maximum and mean cost obtained over the different starting configurations. . 56
6.4 Minimum, maximum and mean runtime for the 10 starting configurations. . . 58
6.5 Results for the second small dataset with increased spatiality. . . 60
6.6 Results tabu search heuristic starting from no CPs used on the large dataset. . . 65
7.1 Optimal configurations small dataset. . . 67
7.2 Covered population of each CP for a coverage radius of 200m. . . 68
7.3 Detailed analysis of several configurations for the different coverage radii. . . 71
7.4 Lost coverage when used CP becomes unused in optimal configuration (R = 350m). . . . 73
7.5 Additional coverage when unused CP becomes used in optimal configuration (R = 350m). 73 7.6 Values of fcpfor the 5 different relationships. . . 79
7.7 Total cost of the end solution for the different relationships. . . 79
7.8 CPs used in the end solution for the different relationships. . . 80
7.9 Runtime heuristic ([s]) for the different relationships. . . 81
B1 List of the 20 zones in the artificial city. . . 96
B2 List of the 21 collection points in the artificial city. . . 97
C1 Latitude and longitude coordinates of the 13 collection points, one in each neighborhood. 98 D1 Latitude and longitude coordinates of the 12 collection points in the small dataset. . . 98
E1 Latitude and longitude coordinates of the 12 collection points in the second small dataset with increased spatiality. . . 99
“If you’re competitor-focused, you have to wait until there is a com-petitor doing something. Being customer-focused allows you to be more pioneering.”
~Jeff Bezos, CEO of Amazon
CHAPTER
1
Introduction
The demand for urban freight transportation has increased considerably owing to urbanization and de-mographic growth, along with the increased diffusion of e-commerce, management principles (e.g. just-in-time) and pervasive technologies, ensuring the economic dynamics of urban areas. At the same time, freight transportation is affected by various issues, inefficiencies, and externalities, which become more evident in the last mile segment. [1]
Over the years, delivery companies have tried to organize their logistics schemes more efficiently, es-pecially in that costly last mile segment. This has led to various research in the field of Operations Research. Furthermore, several regulations imposed by the city governments, such as Low Emission Zones and het Circulatieplan in Ghent, complicate the access to inner city. Although with the aim of improving the quality of life in the city while at the same time ensuring accessibility, it inevitably forces delivery companies to adjust their delivery structure.
Nowadays, the standard for parcel delivery is home delivery. As it faces specific problems (see later), this master’s dissertation will discuss an alternative delivery method, being the use of collection points. At these points, customers can pick up their parcels themselves at a convenient time. The collection points can either be in-store or an unmanned parcel locker.
However, due to a variety of reasons, not everything can be delivered at these collection points. Think of products that are too large or too heavy, products that require a fast delivery, people who have difficulties
with physically moving themselves, etc. That is why these collection points will never be a complete substitute for home delivery. Nevertheless, a shift towards more collection point deliveries will certainly be economically and environmentally beneficial.
The remainder of this chapter will give a brief – but complete – definition of e-commerce and parcel delivery. Moreover, the problem definition and goal of this master’s dissertation will be more extensively defined to clearly specify the scope.
1.1
E-commerce and parcel delivery
E-commerce, also known as electronic commerce or Internet commerce, refers to the buying and selling of goods or services using the Internet, and the transfer of money and data to execute these transactions. E-commerce is often used to refer to the sale of physical products online, but it can also describe any kind of commercial transaction that is facilitated through the Internet. [2] It is a fast-growing market: a study by the Belgian consultancy company KPMG in 2017, commissioned by the Belgian Institute for Postal Services and Telecommunications (BIPT), revealed that in 2014 and 2015 a growth rate of 9.80% and 3.57% in turnover from standard parcels and express parcels respectively was observed. In terms of volume, a growth of 11.78% and 6.26% respectively was observed. [3] Revenue in the e-commerce market amounts to 4.7 million euros in 2019 in Belgium and is expected to grow annually with 7%. [4]
The main stakeholders involved in e-commerce are the retailers selling the goods, the manufacturers producing the goods, the distributors or carriers delivering the goods and of course the customers, the people at home, ordering and requesting the delivery of the goods. As already mentioned, city govern-ment regulations can greatly impact the environgovern-ment in which the distributors need to operate.
The growth of e-commerce can be explained by the numerous benefits it provides to different actors in the supply chain. According to Chen and Dubinsky [5], the consumer gains the convenience, simplicity, information and time efficiency of online shopping, while Zott et al. [6] state that the businesses benefit from the absence of geographical boundaries, optimized flow of information and goods, and lower deliv-ery, transaction and advertising costs.
An immediate consequence of the increased urbanization and this new shopping trend is the increase in the amount of light goods vehicles (LGVs) on the road in order to deliver the customer’s order at the desired location, mostly at his or her home. The resulting congestion of roads and highways is a well-known problem of today’s society. This poses great pressure on efficient and well-organized logistics as accessibility and quality of life are two important, but often conflicting objectives in cities.
Furthermore, the last mile of a supply chain is currently seen as one of the most expensive, least efficient and most polluting parts of the total chain as it lacks economies of scale. Goodman (2005) [7] notes
1.2. PROBLEM DEFINITION 3 that up to 28% of all transportation costs are incurred in last mile delivery. It experiences some typical problems that have an extensive impact on the cost, the efficiency and the environment, such as a high degree of failed home deliveries due to the ‘not-at-home phenomenon’. [8]
As a way of overcoming these inefficiencies, logistics hubs could be promising. They can be of any size fulfilling different functions, but the main goal should be efficiency gain and more sustainable last mile delivery. For example, an urban consolidation center collecting the parcels at a depot nearby – but outside – the city center, from where the parcels will be delivered in the city center by more efficient routes and a more sustainable vehicle fleet.
Another possibility is a customer pick-up at a parcel locker, allowing people to collect their packages when it fits their schedule, overcoming the ‘not-at-home phenomenon’. Customer pick-up experiences a lot of benefits, such as improved delivery efficiency, reduced delivery costs and carbon emissions, and minimized failed deliveries. [9] However, there is a loss of convenience for the customer.
The decision of which hubs to open and which zones of demand to assign to each hub has already been the subject of many academical research and is known as the Hub Location Problem. It is a well-known problem in Operations Research and literature already lists ample mathematical formulations for different variants of this problem, as well as the usual solution methods.
1.2
Problem definition
The last mile is a polluting and cost inefficient part of the delivery of parcels. Many alternatives, such as hubs where parcels can be consolidated, have already been investigated. Another alternative suggests the use of collection points. These collection points, either in a shop or in the form of unmanned parcel lockers at a public facility, already exist and are in use at several places. However, a large-scale use of them is limited because of the aforementioned loss of convenience.
This master’s dissertation will investigate the use of collection points for delivering parcels inside the city center. More formally, it will try to answer the following 2 questions. The first asks:
How should parcel delivery in a certain region be organized, i.e. which collection points should be used, and what are the implied cost savings compared to home delivery?
To answer this formally, a mathematical model will be developed that minimizes the total cost. Some re-stricting assumptions will be made and the solution will be dependent on the estimates of the parameters used. Therefore, the second question is:
1.3
Goal of the Master’s Dissertation
The goal of this master’s dissertation is to develop a model that returns the optimal organization of parcel delivery within a certain region (e.g. city center of Ghent). It does so by making the trade-off between the operational cost of opening a collection point and the cost savings that can be achieved through cheaper delivery at these collection points. Various parameters affect this trade-off and their sensitivity will be analyzed.
The remainder of this dissertation is structured as follows. In chapter 2, a literature review is conducted in order to gain a better understanding of the concepts of city logistics, parcel delivery and related operations research models. Chapter 3 is devoted to the developed mathematical model that must determine which collection points to use such that the total delivery cost is minimized. In chapter 4, the data requirements will be discussed. It will elaborate on the data collection process and the preprocessing needed to fit the model. Because the model is highly non-linear it becomes hard to solve exactly, such that chapter 5 will discuss a developed heuristic procedure solving the problem sub-optimally within a reasonable amount of computation time. Chapter 6 will then analyze the performance of the designed heuristic in terms of convergence towards the optimal solution and the running time. Furthermore, chapter 7 gives an analysis of different scenarios, supplemented with a discussion and interpretation of the results. Finally, chapter 8 will end this master’s dissertation with a conclusion and suggestions for further research.
CHAPTER
2
Literature review
This chapter gives an extensive overview of the different concepts and research fields related to this mas-ter’s dissertation. It shapes the whole context in which parcel delivery are situated in order to gain a better understanding of the characteristics of parcel delivery, the impact of different delivery options on the different stakeholders and the benefits that can be obtained in order to cope with environmental issues and governmental regulations.
First, the general field of city logistics is clarified and a formal definition is given, after which there will be zoomed in on the logistics last mile problem. Next, different parcel delivery methods and strategies will be compared with each other, looking at how they perform along several attributes. In a fourth sec-tion, logistic challenges specifically for Ghent will be discussed, as well an overview of several measures that have been taken to improve the city logistics. The fifth section will cover the Hub Location Problem, with an overview of the many variants and various solution methods and techniques. One technique, the tabu search heuristic, is discussed in greater detail. This chapter will end with a brief summary of two interesting models in literature regarding the location decision for parcel lockers.
2.1
City Logistics
The burdening of the urban environment is highlighted by the fact that over 50% of the world population lives in cities – in Europe it is more than 75% –, with this percentage expected to reach 70% worldwide by 2050. [10] This growth is accompanied by many problems such as traffic congestion, increased pollution, safety risks, etc. which has resulted in the rise of the field of city logistics. City logistics is defined as follows by Taniguchi et al. [11]:
"City logistics is the process for totally optimizing the logistics and transport activities by private companies with support of advanced information systems in urban areas considering the traffic environment, the traffic congestion, the traffic safety and the energy savings within the framework of a
market economy."
On top of the increased urbanization, the rapid growth of e-commerce further poses great challenges for the design of efficient and sustainable logistics schemes. Furthermore, measures are taken by local authorities and governments to reduce the greenhouse gas emissions and to improve the quality of life of the city’s inhabitants. Specifically in Ghent, measures as het Circulatieplan and the Low Emission Zone (LEZ) are introduced in order to obtain these goals. The emerging field of logistics has already led to (research into) new logistic schemes in order to improve the accessibility and quality of life in the cities. City logistics measures
According to Russo and Comi (2011) [12], city logistics measures can be classified into 4 categories: material or physical measures, such as roads reserved to freight vehicles only, loading/unloading areas, distribution centers, etc.; immaterial measures, such as research and education, Intelligent Transport Sys-tems; equipment measures, relevant to loading units (new standards) or transport units (i.e. Fully Electric Vehicles - FEVs); governance measures, such as regulations to delivery and pick up, time windows, road pricing, etc. An urban consolidation center is one of the city logistics measures belonging to the category of physical infrastructures. It requires also immaterial, equipment and governance measures, connected with the infrastructure characteristics.
2.2
The logistics last mile problem
According to literature, the last mile can be defined as ‘the final leg in a business-to-consumer delivery service whereby the consignment is delivered to the recipient, either at the recipient’s home or at a collec-tion point’. [13] The last mile is the costliest link in the supply chain. The Capgemini Research Institute calculated in 2018 that the cost of providing last mile services accounts for 41% of the overall supply chain costs, more than twice the percentage of any other category of spend (like parceling, warehousing, etc.). [14]
2.3. PARCEL DELIVERY STRATEGIES 7 The main reasons of why the last mile is so costly and ineffective is listed by Deutsch and Golany [15]. First of all, they lack economies of scale as B2C deliveries often involve one parcel per stop. Secondly, there can be some difficulty experienced by the driver in finding the correct address where the parcel should be delivered. To illustrate, imagine finding the right place in a large apartment block in the city. Thirdly, logistics schemes are introduced by city authorities that restrict the possibilities of entering certain parts of the city. Het Circulatieplan in Ghent and Low Emission Zones are examples of these reg-ulations. Finally, and probably the most important reason, there is the high rate of failed deliveries due to the ‘not-at-home phenomenon’, especially when the customer needs to sign a receipt confirming delivery. Actual first-time delivery failure rates differ significantly among carriers. Song et al. (2009) [16] mention that research has reported failed first-time deliveries between 12% and 60%. The reasons for this high failure rate have been largely due to lifestyle changes: the growth in single-person households, flexible working patterns and higher female employment levels.
According to a study in 2018 of PCA Predict (currently Loqate) concerning e-commerce in the UK, the average cost per failed delivery was £12.89. [17] Moreover, it was noted that failed deliveries not only carry cost implications, but can also cause significant damage to the retailer’s brand reputation. Loss of repeat custom and failure to attract new customers can result.
2.3
Parcel delivery strategies
The rapid growth of the parcel delivery service is creating various problems: [18, 19]
1. The high costs associated with last mile logistics incentivize parcel delivery companies, or providers, to implement efficient delivery operations
2. Customers are becoming increasingly more demanding regarding delivery services (e.g. next- or even same-day delivery, delivery to alternative locations and collection points)
3. Increasing anxiety of customers who receive parcels, because violent crimes involving imperson-ation of delivery personnel have rapidly increased.
4. There have been an increasing number of consumer complaints of lost or damaged parcels, or inap-propriate responses when receivers are absent, which resulted in more disputes between consumers and the delivery companies.
Furthermore, the main operational problem for shippers is the failed delivery mentioned before. In order to overcome this problem, one of the most successful solutions implemented are the Collection-and-Delivery Points (CPDs), in which parcels are not delivered directly to the customer’s home, but instead are carried to another address chosen by the client among those available. The most common methods of CDPs are pick-up points and parcel lockers. [20] It should be noted however, that only about 1 out of
2 consumers chooses an alternative location to their homes as delivery address. [20]
Instead of each van or truck entering the city center itself to fulfill delivery at the customer, hubs could provide a new logistics scheme in order to increase efficiency and organize sustainable transport for the last mile. These hubs come in different flavors:
• Urban Consolidation Centers: collecting (a part of) the parcels at the outskirts of the city for combined transport within the city, possibly with LEVs (light electric vehicles)
• Microhubs for each sector of the city, each serving that sector • Parcel lockers and other pick-up points (e.g. in stores)
From those (micro-)hubs, the parcels can be brought to the customer by a more sustainable transport mode, such as LEVs or bikes. This can be operated by either an independent logistics party or each sender can organize his own transport. Besides that, the customer himself can also travel to the hub to collect his parcel(s). In that case, the hubs are more often referred to as parcel lockers, collection points or locker banks. The next subsections will dive into more detail in the several delivery options.
2.3.1 Urban Consolidation Center
Gogas and Nathanail [10] define an Urban Consolidation Center or UCC as follows:
"A logistics facility situated in relatively close proximity to the urban area that it serves, be that a city center, an entire town or a specific site (e.g. shopping center), from which consolidated deliveries are carried out within that area, often in smaller vehicles such as minivans, electric vans and cargo bikes." The definition contains 3 important parts. First, the hubs are located in the close proximity of an urban area. Second, from the hub onwards, deliveries are consolidated to increase efficiency. Third, the last mile delivery is performed by smaller vehicles or even bikes, which are more environmentally friendly.
The concept is schematically shown in Figure 2.1. A range of other value-added logistics and retail services can also be provided at the UCC. In general, it is located within the suburban area of big cities: shippers bring their goods destined for the urban area to this UCC, from where the last mile delivery can happen in a more efficient and sustainable way.
The use of an UCC has some important advantages. First, less vans will enter the city, thereby reduc-ing congestion and improvreduc-ing the quality of life. Second, the load factor of delivery trucks and vans can be increased such that less kilometers need to be driven. This results in a positive impact on the CO2-emissions, congestion and noise levels. Further, the last mile delivery can make use of more eco-nomically friendly vehicles. This can be crucial because of the increased measures taken by cities and governments to regulate vehicular access to urban infrastructure in order to decrease road congestion and
2.3. PARCEL DELIVERY STRATEGIES 9 greenhouse gas emissions.
Figure 2.1: Schematic visualization of the UCC concept.
In particular for the logistics companies dropping off their loads at the UCC, they avoid the need of en-tering the congested urban areas, thereby saving time and costs. Whereas for those receiving goods from the UCC, a higher delivery reliability can be achieved.
The big disadvantage of the UCC is the operational cost. Many real-life cases have shown that almost no UCC is financially sustainable without sufficient subsidies. Consequently, two factors are critical to the success of the UCC scheme [21]:
1. The level of demand: a sufficient UCC user and product delivery volume is required to drive down the costs per unit handled, thereby making the UCC competitive with traditional urban distribution systems.
2. Fair cost and benefit sharing: UCC costs and benefits need to be shared between the various supply chain parties involved in the scheme.
So despite the fact that the use of Urban Consolidation Centers certainly makes sense from the environ-mental point of view, the key challenge is to find schemes that are also financially attractive. Often, UCC initiatives did not survive without some subsidies or incentives of local authorities. Ndhaief et al. [22] suggest reverse logistics can be a solution to improve the financial viability of a UCC, by also letting it act as a collector of returned goods by the customers and recyclable waste, and sell those to manufactur-ing and waste sortmanufactur-ing centers.
A strong tendency that could be observed in most urban areas during the last decades was to limit the presence of logistics platforms in urban areas, as mentioned by Guyon et al. [23]. The reasons for this phenomenon are not far-fetched. First, inhabitants do not appreciate living around these platforms as they might cause an increase of traffic (and especially traffic of large vehicles), generate noise and pollu-tion, or have some unpleasant visual impact. Also, available surfaces in cities for these platforms are rare and expensive. From a pure economical point of view, carriers used to prefer less expensive locations, at
some larger distance of the city, although experiencing the inconvenience of being distant from their final customers. Moreover, local authorities gave priority to more noble activities for these available surfaces: commercial centers, apartments, public services such as libraries or concert halls. [23]
Due to many recent developments in cities (think about the implementation of Low Emission Zones and access fees), the benefits of this policy, both for local authorities and carriers (and eventually inhabi-tants), can be questioned. Environmental issues became increasingly important. The rapid growth of e-commerce modifies the profiles of carrier customers and implies different organizations and services. Urban platforms can then offer several possibilities such as using electric vehicles (whose limited au-tonomy prevents from traveling long distances) or scheduling several successive deliveries or collection routes (which is not tractable with distant platforms). [23]
There are also certain decisions that can be optimized regarding the implementation of urban consolida-tion centers. Among them is the locaconsolida-tion, size and number of centers that are needed to cover the area of interest. This problem can be mathematically formulated and is known as the Hub Location Problem. This will be further elaborated in section 2.5.
2.3.2 Pick-up points
Pickup points are located at local small businesses (e.g. shops, bars, petrol stations, post offices), care-fully selected by the couriers. Figure 2.2 shows a bol.com pick-up point located in an Albert Heijn supermarket. The carrier can make use of the network of Albert Heijn for delivering their parcels. Morganti et al. [24] note that this solution is advantageous for both carriers and local businesses. The carriers do not need to visit each customer individually anymore, while the businesses are benefiting from this partnership in terms of advertising and the potential increase in the number of customers. The only limitation of the service for customers and distributors are the shops’ opening hours. [20]. Another drawback is the possible loss of convenience for the shoppers, who now need to make a trip for collecting their parcels.
2.3. PARCEL DELIVERY STRATEGIES 11 A special variant of the pick-up points are the parcel lockers and will be discussed in the next section. They can be considered unmanned pick-up points.
2.3.3 Parcel lockers
A parcel locker is a secure container situated nearby common places where shippers can easily deliver a package, instead of at the customer’s home. There it will be retained for a limited amount of time to allow the recipient to self-collect it at a centralized station at the convenient time and location. Examples of places where you might see parcel lockers are office reception areas, apartment complex lobbies, and sidewalks. Other names referring to the same principle are parcel kiosks, locker boxes, automated parcel station (APS), self-service delivery lockers, and intelligent lockers.
The big advantage over pick-up points is the 24/7 opening hours and that the customer does not have to wait in a queue. Figure 2.3 shows the parcel lockers Cubee from bpost, the largest Belgian postal service provider. These are unmanned but often have camera surveillance. The parcel can be collected with a received pin- or QR-code.
Figure 2.3: Cubee, the parcel lockers of bpost.
The distribution of unmanned parcel lockers is projected to proliferate nationwide significantly as it is promoted by the government for its potential to increase public safety and convenience. [19] Important requirements are that they are easily accessible and able to effectively fulfill the different requirements. Morganti et al. (2014) [25] mention that consolidated deliveries to parcel lockers and pick-up points ben-efit transport operators by increasing the number of successful first-time deliveries, optimizing delivery rounds and lowering the operational costs.
The goal of these lockers is to reduce the operational cost of the carriers and to reduce greenhouse gas emissions. It should be avoided that this strategy just results in a customer performing an extra trip from his/her house to the locker location by car. Consequently, customers should be able to visit these lockers on foot or by bike. It is noted that the distance to the closest parcel locker station for a customer is a crucial parameter that needs to be taken into account.