EFFECT OF POLITICAL CONNECTIONS
ON FIRM PERFORMANCE
EVIDENCE FOR BELGIAN LISTED FIRMS
Word count: 17 951
Emile Buyse
Student number : 01610536
Supervisor: Prof. dr. Bruno Merlevede
Commissioner: drs. Bram De Lange
Master’s Dissertation submitted to obtain the degree of: Master of Science in Business Economics
Main subject: Corporate Finance
Deze pagina is niet beschikbaar omdat ze persoonsgegevens bevat.
Universiteitsbibliotheek Gent, 2021.
This page is not available because it contains personal information.
Ghent University, Library, 2021.
II. Foreword
The Master’s Dissertation ‘Effect of political connections on firm performance’ studies the impact that the presence of politicians on the board of directors of Belgian listed firms may have on a variety of factors, concerning a firm’s behaviour and performance. We did this for the eleven-year period 2008-2018. The research paper has been submitted to obtain the degree of ‘Master of Science in Business Economics’ at Ghent University. The continuous process of reviewing literature, gathering, processing and analysing data, and bringing all this together in this paper, was conducted throughout the period of November 2019 to May 2020.
In the decision process of a subject for my Master’s Dissertation, I was immediately attracted to the combination of the two research fields: corporate finance and politics. Therefore, I want to thank my supervisor Prof. Dr. Bruno Merlevede for granting me the opportunity to work on this topic. Despite the fact that my knowledge on conducting academic research was sometimes limited, with the help of my commissioner drs. Bram De Lange, I am proud to be able to formulate an answer to my research question: ‘How do political connections impact firm performance in Belgian listed firms over the period 2008-2018?’
To conclude this foreword, I wish to express my sincere thanks for the help I received during the research process. I appreciate the helpful comments and suggestions offered by commissioner drs. Bram De Lange, who was available at all times to answer any questions or concerns that arose. Furthermore, I would like to thank my family and friends for their support during these mentally challenging times. My special thanks go out to my sister Eloïse Buyse for proofreading this paper, and to my brother Alec Buyse for his helpful observations and tips.
Emile Buyse
III. Preamble – Impact of COVID-19 crisis
In relation to the recent developments and adaptations in the structure and organisation of the academic year, resulting from the governmental measures installed to fight the further outbreak of the COVID-19 virus, this preamble reveals the impact the health crisis has had on the
development of this Master’s Dissertation.
A part of the data, needed for the completion of this study, relies on the database BEL-FIRST. In a normal situation, this database can only be accessed via certain computers at the library of the faculty of Economics and Business Administration. When the Belgian government decided to close all educational institutions, no students were allowed to enter the university buildings. Hence, for a short moment in time, the access to the financial data source was blocked, which could have caused delays in the data-collecting process. However, thanks to the absence of an overlap in the data collection period for this research paper and the period in which BEL-FIRST was not accessible, for this master’s dissertation, no delays nor inconveniences were caused by the restricted access to the campus and its facilities.
For this reason, I would like to thank the employees of the faculty of Economics and Business Administration, who quickly responded to the drastic measures with solutions that made it possible to proceed with the development of the Master’s Dissertations in the best possible circumstances.
IV. Table of contents
I. Confidentiality agreement – Permission ... I II. Foreword ... II III. Preamble – Impact of COVID-19 crisis ... III IV. Table of contents ... IV V. List of tables... VI VI. List of abbreviations ... VII
1. Introduction... 1
2. Literature study & Hypotheses ... 4
2.1. Prevalence & Importance ... 4
2.2. Information asymmetry ... 5
2.3. Contingency factors ... 6
2.4. Costs & Benefits of political connections ... 7
2.5. Effect on firm value & firm performance ... 11
2.6. Development of hypotheses ... 14
3. Methodology ... 16
3.1. Research question & Sample frame ... 16
3.2. Variables ... 16
3.2.1. Defining political connections ... 16
3.2.2. Defining leverage, employees & cash holdings ... 18
3.2.3. Defining firm performance... 18
3.2.4. Control variables ... 19
3.3. Data-gathering process ... 21
3.3.1. Politicians in Belgium ... 21
3.3.2. Belgian listed firms’ board composition ... 22
3.3.3. Belgian listed firms’ financial data ... 23
3.4. Initial data-processing ... 24
4.1. Data sample for statistical analysis ... 31
4.2. Model specifications ... 31
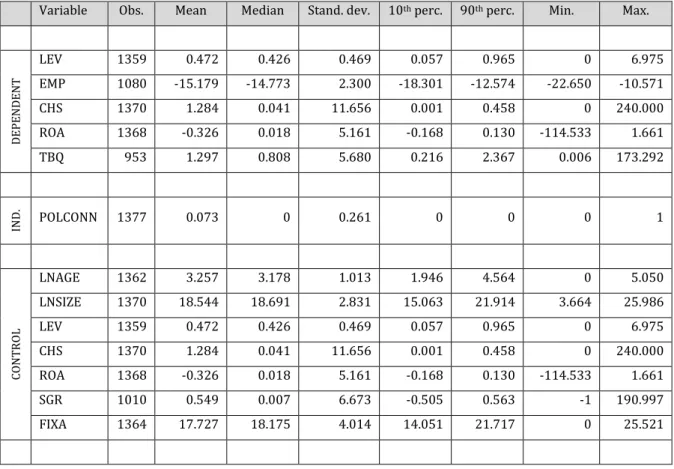
4.3. Summarising statistics... 33
4.4. Multivariate analysis ... 36
4.4.1. Political connections and firm indebtedness ... 36
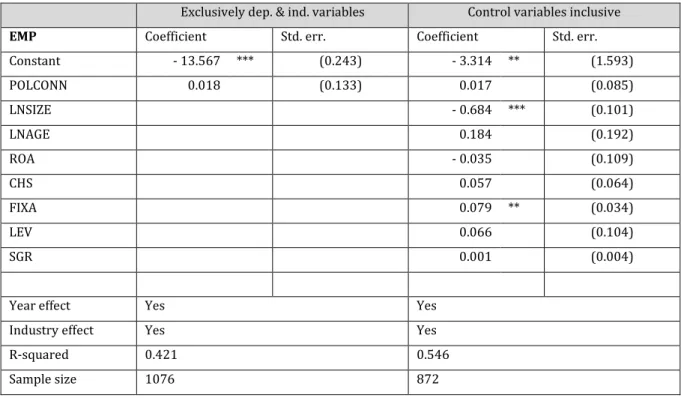
4.4.2. Political connections and employment ... 37
4.4.3. Political connections and cash holdings ... 38
4.4.4. Political connections and firm performance ... 39
4.5. Post hoc analyses ... 41
5. Limitations & Further research ... 45
6. Conclusion ... 46
7. Reflection & Managerial implications ... 48 VII. Reference list ... VIII VIII. Appendices ... XV Appendix I – Overview connections ... XV Appendix II – Post hoc analysis: Industry differences ...XVII Appendix III – Post hoc analysis: Strength of political connection ... XVIII
V. List of tables
Table 1 - Overview variables ... 20
Table 2 - BEL-FIRST raw data variables ... 23
Table 3 - Descriptive I – Number of political connections ... 25
Table 4 - Descriptive II - Policy Level ... 26
Table 5 - Descriptive III - Political Party... 26
Table 6 - Descriptive IV - Industries ... 28
Table 7 - Descriptive V - Yearly overview ... 29
Table 8 - Summarising statistics ... 34
Table 9 - Pearson correlation matrix ... 35
Table 10 - Multivariate regression result - Firm indebtedness ... 37
Table 11 - Multivariate regression result - Employment ... 38
Table 12 - Multivariate regression result - Cash holdings ... 39
Table 13 - Multivariate regression result - Firm performance (1/2) ... 40
Table 14 - Multivariate regression result - Firm performance (2/2) ... 40
Table 15 - Post Hoc Analysis - Interaction effect FINPOLCONN ... 42 Table 16 - Overview connections ... XV Table 17 - Post Hoc Analysis – Tobin’s Q of financial firms ...XVII Table 18 - Post Hoc Analysis – Tobin’s Q of non-financial firms ...XVII Table 19 - Post Hoc Analysis – Leverage and Strength ... XVIII Table 20 - Post Hoc Analysis – Return on Assets and Strength ... XVIII
VI. List of abbreviations
BSE = Brussels stock exchange CEO = Chief executive officer CHS = Cash holdings variable EMP = Employees variable EPS = Earnings per share EUR = Euro
FINPOLCONN = Interaction effect between political connection and NACE industry K FIXA = Fixed assets variable
FTE = Full-time equivalents GDP = Gross domestic product GLS = Generalised least squares IND = Industry variable
LEV = Leverage ratio variable LNAGE = Firm age variable LNSIZE = Firm size variable MCap = Market capitalisation MtB = Market-to-book ratio
NACE = Nomenclature générale des Activités économiques dans les Communautés Européennes
PCY = Politically connected years
POLCONN = Political connection dummy variable
RISS = Ratio of income from sales to sales
ROA = Return on assets / Return on assets variable ROE = Return on equity
ROS = Return on sales SGR = Sales growth variable
STRENGTH = Variable indicating the number of political connections found for a given firm-year observation
TBQ = Tobin’s Q / Tobin’s Q variable YEAR = Year variable
1. Introduction
Political interference in the corporate world is a phenomenon that has had a considerable impact on the corporate world in our recent history. Ghita, Cuyvers, and Deloof (2009) find evidence for such conflicts of interests in the Belgian history from 1858 throughout the Belle Epoque, while Ferguson and Voth (2008) look into corporate connections with government members of Nazi Germany in 1933. Academic literature on the subject of political connections in the corporate environment still shows an widespread occurrence (Faccio, 2006). Despite their frequent presence in companies, political connections often raise uncertainty amongst people on the concept of integrity of their elected representatives or government members (Whitton, Bertók & Organisation for Economic Co-operation and Development, 2005). Additionally, a recent research of the news service of VRT (Flemish Radio and Television Broadcasting Organisation) that focusses on the presence of the so called ‘Draaideurconstructies’ (literal translation: ‘Revolving doors constructions’), in which staff of governmental cabinets swap their institutional position for a private position in the same or in a similar sector, also warns for a risk of conflict of interest, in the Belgian context, resulting from these position switches (Lefevere, 2019).
Next to the risk of the occurrence of conflicts of interest, a wide range of impacts political influence in a firm’s board of directors can have in the corporate environment, have been studied in a multitude of academic research papers. A recurring result found by scholars is the way in which political connections can open a lot of new doors, of which a company can merit (e.g. easier access to finance, preferential treatment by government, etc.) (Bliss & Gul, 2012; Krammer & Jiménez, 2020). However, the presence of connections is also a source of
inefficiency. It may cause information asymmetries between shareholders and directors, which in turn could lead to agency problems between those two parties (Chen, Ding, & Kim, 2010; Rusmin, Evans, & Hossain, 2012). Furthermore, various sources prove the existence of a connected director’s ability to extract corporate funds to support political (mainly social-economic) objectives (Boubakri, Ghoul, & Saffar, 2013; O’Connor Keefe, 2019). In general, it is not clear if the benefits outweigh the costs, since a range of contingency factors influences the net outcome of political connections. While most studies find a significant higher leverage ratio and higher cash holdings for politically connected firms vis-à-vis their peers, the effect on cost of capital is less clear (amongst others: (Bliss & Gul, 2012; Boubakri et al., 2013; O’Connor Keefe, 2019)). As a result, the net effect of political connections on overall firm performance remains an empirical issue.
This research paper looks further into the studied impact of political connections on firm performance and adds to the evolving empirical literature on the impact of politically connected board membership by describing results for Belgium. Hence, the research question of this academic paper states: ‘How do political connections impact firm performance in Belgian listed firms over the period 2008-2018?’
Since the effects of being politically connected on firm performance vary between countries (Wong & Hooy 2018), the study of a Western European country with a low corruption
background – Belgium – extends the existing literature, which is mainly focussed on emerging and/or more corrupt economies (Transparency International, 2019). The limitation to the Belgian listed companies provides the advantage of including multiple policy levels and makes conclusions at population level possible. To our knowledge, research on recent political connections specifically concerning the Belgian environment does not exist. However, next to the presence of Belgian data in multinational research studies, Ghita et al. (2010) studied, as mentioned earlier on, the impact of political connections in the pre-World War I period (1858-1909).
In order to formulate an answer to the research question, politicians of the six policy levels of the Belgian institutional system during the legislation periods covering the period 2008-2018 are checked for board membership of companies listed on Euronext Brussels. Subsequently, a multivariate analysis compares the BEL-FIRST financial data and additional data from the annual reports of Belgian politically connected listed firms to the information published by Belgian non-politically connected listed companies by using random effects generalised least squares (GLS) regressions. The four hypotheses, concerning the impact of political
connectiveness in listed firms on leverage, employment, cash position, and financial
performance are tested while controlling for a variety of variables, which differ amongst the hypotheses.
This study finds that politically connected Belgian listed firms do not differ from their non-connected peers regarding leverage, employment, cash position and financial performance, when observing the firms as a homogenous group. Nevertheless, when making a distinction between the financial sector and the non-financial sector, significant and opposite relationships are found, for the two groups, between the presence of politicians on a firm’s board of directors and the market-based performance measure Tobin’s Q. While companies with financial service activities merit from political connections vis-à-vis their peers, non-financial politically
connected companies report a lower Q-value then their connected peers. Furthermore, results of analyses, dedicated to firm-year observations of politically connected years, suggest that
stronger political connections (in the form of more politicians simultaneously active on the board of directors) lowers a firm’s leverage ratio and results in a lower return on assets. The remainder of this research paper is structured as follows. The following section studies the international business literature on the various implications of political connections.
Furthermore, the second section builds upon the gathered literature to generate the hypotheses. The third section proceeds with the discussion on the used methodology and variables. The fourth section presents the statistical analysis of the hypotheses and the post hoc analyses. The fifth section shows limitations of the research paper and possible avenues for further research. The sixth and final section summarises this paper by formulating a conclusion.
2. Literature study & Hypotheses
This section provides an overview of the existing literature, relevant to the study of the effect of political connections on firm performance. Subsequently, this literature study covers the
prevalence and importance of political connections, the information asymmetry that comes with those, the factors that influence the impact of the connectiveness, its possible benefits and costs, and the overall effect of political connection on firm performance. Finally, a section on the creation of the hypotheses, that will be tested in this study, is included at the end of the literature section.
2.1. Prevalence & Importance
The existence of political connections in corporations is a worldwide spread phenomenon that is the subject of various research designs in recent literature. Wong and Hooy (2018) find that the meaning of the term ‘political connections’ differs between papers. They find that four categories of political connections can be defined, out of which one category or a combination of categories are chosen by academic scholars to base their definition of political connectiveness on. Those four groups are: political connection through government-linked companies, political connection through the board of directors, political connection through business owners, and political connection through family members of government leaders (Wong & Hooy, 2018, p. 299-301). Despite those differences in the definition of political connections, most studies depart from Faccio’s 2006 paper to define the concept ‘political connection’.
“A company is identified as being connected with a politician if at least one of its shareholders (anyone controlling at least 10 per cent of voting shares) or one of its top officers (CEO, president, vice-president, chairman or secretary) is a member of
parliament, a minister or is closely related to a top politician or party.” (Faccio, 2006, p. 369)
This definition implies that both direct government or parliament membership and indirect connection (via close relationships) of shareholders or top officers are seen as political
connections. The occurrence of companies having political connections is estimated at 2.68 per cent of all worldwide listed corporations (Faccio, 2006, p. 372), however this varies across countries. According to the same study, such connections are more prevailing in countries characterised as being corrupt or being less open to foreign financial investments. Additional
proof on the latter idea was provided by Leuz and Oberholzer-Gee (2006). In the research paper of Fisman (2001), he mentions the importance of political connections on the major world leading economies. Elaborating on his study, Faccio (2006, p. 372) finds that the political connected firms represent on average 7.72 per cent of the world’s listed firms’ market
capitalisation. This rather high percentage is supported by the findings of Faccio, Masulis and Mc Connel (2006), which claim that connected firms are significantly larger, and, in addition, have a higher market share (Faccio, 2010) than their peers. Again, international differences can be found from a sizeable 86.75 per cent for Russia to a percentage below 0.50 per cent for Australia, Austria, Finland, Greece, The Netherlands and Turkey (Faccio, 2006, p. 374). To put this in perspective to the Belgian case: Belgian connected firms represent 18.77 per cent of the total Belgian market capitalisation (Faccio, 2006, p. 374).
2.2. Information asymmetry
Across research papers, political connections were found to have a diverse set of effects on internal and external firm behaviour and performance. A first important implication of being politically connected as a firm can be found in the amplification of information asymmetry between managers and investors (Chen et al., 2010; Rusmin et al., 2012). A lower quality of accounting earnings information lies at the basis of this agency problem (Chaney, Faccio, & Parsley, 2011). Connected firms intentionally try to hide or delay the traces of the benefits they receive from politicians, while at the same time they do not value disclosing qualitative
information, because – thanks to their connections – they are somewhat shielded against the penalisation of market-monitoring mechanisms (Chen et al., 2010) (Chaney et al., 2011). Next to the lower information quality, a second implication of being politically connected lies in the fact that political decisions increase the errors in connected firms’ earnings forecasts, because of the unexpected benefits that may arise from the connection (Faccio, 2006). Those reasons make it harder for analysts to provide potential investors with accurate corporate forecasts, which in turn leads to information asymmetry.
Companies are aware of the fact that investors know that political connections have this side effect and that they have two possible ways of reacting to the existence of this agency problem (Guedhmani, Pittman, & Saffar, 2013). They can either try to improve accounting transparency by appointing a Big 4 auditor bureau (i.e. PwC, EY, Deloitte or KPMG) to convince investors that only legal actions are taken (Chen et al., 2010), or they could hire a less renowned audit bureau to possibly help conceal the benefits of being politically connected. This theory departs from the
fact that well-known audit bureaus provide stricter monitoring to prevent any reputational damage, while smaller firms focus more on the monitoring expectations of the customer, which will be lower in case of illegal activities (Bliss, Gul, & Majid, 2011; De Angelo, 1981). The choice between the two possible reactions depends on whether the connected board member’s aim is to benefit himself/herself or not (Guedhmani et al. 2013). Next to non-compliance with
accounting information, Bourveau, Coulom and Sangnier (2016) discover in their research paper on the effect of political connections on the occurrence of insider trading, that connected
companies often do not comply with trading disclosure requirements. In turn, this non-compliance facilitates white-collar crimes in financial markets (Bourveau et al., 2016).
2.3. Contingency factors
While a general consensus amongst scholars exists about the reduced information disclosure, the outcome of the presence of a connection is not uniformly agreed upon. Various papers suggest that this outcome depends on different contingencies. Those can be found on both the country’s institutional level as on firm level (Boubakri, Guedhami, Mishra, & Saffar, 2012b). A first external factor of influence is a country’s legal system. Most academics claim that the role of connections seems to be more relevant in countries with weaker institutions, often
characterised by higher corruption and poor law enforcement (Ang, Ding, & Thong, 2013; Bertrand, Kramarz, Schoar, & Thesmar, 2018; Boubakri et al., 2012b; Faccio, 2006; Li, Meng, Wang, & Zhou, 2008). However, Wang, Yao, & Kang (2019) find that the mere absence of
corruption is a main driver of a strong impact of political connections and thus that the presence of corruption is not a conditio sine qua non for political connections to have effect (Wang et al., 2019). A second contingency factor is the nature of the political connection. Stronger political links seem to benefit the connected company more than weaker associations (Faccio, 2010; Jackowicz, Kozłowski, & Mielcarz, 2014; O’Connor Keefe, 2019). Additionally, direct connections affect performance harder than indirect connections resulting from close relationships, thanks to a higher certainty on a long term bond (Boubakri, Cosset, & Saffar, 2012a; Wong & Hooy, 2018). The same proportion holds for government ownership over connections through
management (Ding, Jia, Wu, & Zhang, 2014). Regulated industries are a third decisive factor that impact the outcome of the connections. However this forms a point of contention amongst scholars. Hillman (2005) claims that effects are more impactful in heavily regulated industries, and she gets support for her point of view of Chen, Luo, and Li (2014), while Polish evidence does not find a significant correlation (Jackowicz et al., 2014). A fourth external factor
a family-owned firm is not only found to be an influential characteristic for more cases of
political connectivity (Morck & Yeung, 2004), additionally, family firms perform better than non-family firms when politically connected (Muttakin, Monem, Khan, & Subramaniam, 2015). A fifth set of factors – again at firm level - that affects the outcome of connectiveness is the size and age of a company (Boubakri et al., 2012b). A sixth and last contingency factor is identified by Unsal, Hassan and Zirek (2016) who find that the political orientation of top managers and CEOs affects the effect of political connections in American firms.
2.4. Costs & Benefits of political connections
The effect of these contingencies is not the only point of contention when it comes to political connections. Ang et al. (2013) describe the impact of political connections using the metaphor of a double-edged sword. It implies that the existence of such connections not only brings benefits to a firm, but also comes with a certain cost. The earlier defined contingencies may be decisive in determining whether the advantages outweigh the costs or vice versa (Bertrand et al., 2018). The fact that the contingencies are out of reach of the firms, makes the outcome of connections ambiguous (Jackowicz et al., 2014).
At the cost effect side, politicians on the board of a well-performing company often use their influence to redirect a part of the firm’s resources to support their personal political objectives in order to gain popularity amongst the employees and their environment and thus increase their chances on re-election (Boubakri et al., 2013; O’Connor Keefe, 2019). Some recurring observations involve excessive job creation or the making of inefficient investment decisions. The cost of overemployment and opportunity costs that comes with these inefficiencies, are not only detrimental for the firm’s performance, but also affect the national economy since those take away cash that otherwise could be attributed to economic growth-enhancing projects (Bertrand et al., 2018; Boubakri et al., 2012a; Boubakri et al., 2013; Shleifer & Vishny, 1994). In addition, Amore and Bennedsen (2013) state that even in environments with the lowest levels of corruption – such as Denmark – political connections shift financial resources from the most productive to the least productive firms. That cost should not be underestimated. Khwaja and Mian (2005) found that the cost of political connections on the Pakistani economy reached a level between 0.3 per cent to 1.9 per cent of the nation’s gross domestic product (GDP). The contribution to social goals of politicians can be seen as a cost that needs to be borne to merit from the advantages of political connections (Jackowicz et al., 2014).
Opposite to the costs of political connections, are its benefits. Departing from the resource dependence theory, introduced by Pfeffer and Salancik (1978), firms are seen as being
dependent on external institutions or organisations. To partially overcome the factors that are out of reach of the firms, connections can be established with those third parties. They do not only protect against sudden changes in the firm’s environment, additionally, they may produce a range of benefits. Academic literature provides proof that the beneficial treatment also occurs in the case of linkages with governmental institutions (Hillman, 2005; Jackowicz et al., 2014). The defined benefits cover the impact on the financing structure, the impact on the cost of capital, direct governmental benefits, and the impact on a firm’s cash holdings.
A first benefit that politically connected firms enjoy is the impact on the organisations’ financing structure. Hassan, Hassan, Mohamad and Chen (2012) find, in their case study for Malaysia, that political connected firms pay out more dividends than their annual result. That implies that those companies do not use retained earnings to finance their activities, hinting that other funding sources are available and preferred over retained earnings. Empirical evidence shows that connected firms have a significant higher leverage ratio than their unconnected peers (Bliss & Gul, 2012; Boubakri et al., 2012a; Faccio, 2010; Hassan et al., 2012; Kwaja & Mian, 2005). That impact found for the leverage ratio can be seen as a proxy for preferential access to debt (Faccio 2010). Fu, Shimamoto and Todo (2017) claim that that access can be granted via two paths. On the one hand, connected board members may have closer relationships with state-owned bank officers and, as such, can pass through additional information on their firm’s trustworthiness. On the other hand, bribery may play a role in securing more attractive loans. The role of the political connections in this scenario then lies in the better protection against law suits regarding
corruption. The main difference between the two paths to preferential access to debt is that the former still leads to an efficient allocation of capital, while that does not hold true for the latter (Fu et al., 2017; Li et al., 2008). Additionally, lenders of connected companies rely upon their political connections to make sure the firm is bailed out when encountering difficulties (Faccio et al., 2006). It reduces the risk lenders take when providing a loan to politically connected firms and thus allows a firm to be higher levered with a longer average maturity than their peers at an equal risk (Boubakri et al., 2012a).
In contrast, Amore and Bennedsen (2013) do not find a significant effect on leverage in their study on the value of local political connections in Denmark. Presumably, that lack of support for the preferential access to finance theory is rather due to their focus on the municipal policy level, of which its politicians may have little influence on bank credit, than due to the focus on a low corruption environment. Their theory is supported by the findings of Boubakri et al. (2012a)
and Faccio (2010), who do find an effect of connectedness on leverage in their international studies.
Next to the increased access to finance found in politically connected firms, board membership of politicians also has a different effect on the financing structure of a firm. Leuz and Oberholzer-Gee (2006) find that political connections are substitutes for global financing. Their theory can be explained by the fact that politically connected firms have a lower need for global financing, since – as previously stated – they have preferential access to finance. Moreover, the need for additional information that comes with raising international financing, may come as a burden on the board members seeking personal benefits. Furthermore, in their research they state that, when their connections lose their political power, they seem to be replaced by foreign financing sources.
A second beneficial outcome that comes with the presence of active politicians in a firm’s top management or board of directors is its influence on the cost of capital. One would expect that the combination of the lower reporting quality, the higher leverage ratio and the inefficiencies that arise in political connected companies would mean that those companies on average had to face a higher cost of debt than their unconnected peers (Bliss & Gul, 2012; Francis, LaFond, Olsson, & Schipper, 2005). Nevertheless, different impacts have been registered. While Bliss and Gul (2012) find the expected higher cost of debt for politically connected firms, Faccio (2010) does not find a significant effect for that factor. In his study O’Connor Keefe (2019) warns for an unclear effect on the cost of debt financing. Following O’Connor Keefe’s study, the effects depend on the probability of enforcement of the loan, the influence of politicians over a lender’s
compensation for granting the loan and the loss that is made by directing corporate resources to social objectives. While a higher influence on compensation decreases the interest rate, a
decreased enforcement and a more inefficient use of resources increases the cost of debt. Since the enforcement factor is quite strong in Malaysia, interest rates are negatively affected and thus on average higher for connected companies than their peers. At the same time, a decrease in cost of debt is shown for countries where the enforcement factor plays a much weaker role (such as the United Stated of America and Italy). The lower cost of debt found supports the statement that political connections reward firms through granting access to bank finance (Claessens, Feijen, & Laeven, 2008). Additionally, the fact that connected firms have a higher chance of getting bailed out, reduces the risk the lender bears, and thus the corresponding cost of debt (Boubakri et al., 2012a; Faccio et al., 2006).
Boubakri et al. (2012b) found a similar ambiguous relationship for the cost of equity, about which they state that it can be a better indicator of political influence since it is not affected by
tax policies. The increased risk and agency problems may make a firm more sensitive to market risks and, by consequence, may increase the cost of equity vis-à-vis non-connected peers. However, an alternative view exists, where the relatively easier access to credit and the implicit guarantee of bailouts, lowers a firm’s sensitivity to economic downturns to market risks and thus decreases their cost of equity. No straightforward impact of political connectiveness on cost of capital can be found, as the weights of the two possible effects varies across countries. On average, Boubakri et al. (2012b) found in their multinational sample that the latter effect – the benefits of easier access to finance and political guarantees – outweigh the former effect – the increased risk and agency problems. That results in a view in which connected firms are on average seen as less risky and thus have a lower cost of equity in relation to their matched peers. A third event that may arise in case of political connections are direct benefits received from governmental institutions via the connected individuals. As board membership of people active in politics may give rise to benefits that are difficult to imitate by competitors in the short run, it can alternatively be seen as a source of sustained competitive advantage (Krammer & Jiménez, 2020; Sun, Mellahi, & Wright, 2012). Recent literature showed that political connections have a positive effect on the probability of radical innovation within a company (Krammer & Jiménez, 2020). The stronger the connection, the more the firms innovate. That is made possible thanks to governmental support in the form of subsidies and intellectual capital (Tsai, Zhang & Zhao, 2019). Other ways in which members of governmental institutions can directly aid firms include increasing a firm’s probability of obtaining institutional projects (Goldman, Rocholl, & So, 2013) or the support can come in the form of governmental subsidies, which could be primarily directed to connected firms (Wu & Liu Cheng, 2011). Furthermore, lower taxation rules can be imposed on connected firms (Faccio, 2010; Hassan et al., 2012; Li, et al., 2008).
Because of that advantageous taxation policy in combination with the favourable terms for raising funds, politically connected firms enjoy a better credit position, which can be seen as a fourth advantage of political connectiveness. Having easy access to financial resources, the implicit guarantee of bailout in economic distress and the better tax policy position normally should result in a lower need for holding cash. However, in contrast to the expectations,
Boubakri et al. (2013) find that connected firms hold larger reserves of cash & cash equivalents than non-connected firms. Unlike the latter, firms with political connections maintain higher amounts of cash out of different motives than the traditional transaction cost and precautionary motive. Instead, the motivation comes from the politicians on the board of directors who are triggered to use the excess liquidity for their political purposes (e.g. the financing of election campaigns, supporting social objectives to gain popularity etc.). This personal use of corporate resources conflicts, of course, with the point of view of shareholders who want to see their
resources being used as efficient as possible. This is why they rather limit the amount of excess liquidity to prevent inefficiencies to occur. This difference in opinion contributes to the
predefined agency problem that arises when political connections occur in listed companies. The arguments and results of the study of Boubakri et al. (2013), covering 31 countries, are
furthermore supported by Amore and Bennedsen (2013) in their empirical study on the low-corruption environment of Denmark.
Next to the inefficient use of corporate resources, the excess liquidity furthermore increases the current ratio (Boubakri et al., 2012a). The high amount of cash and cash equivalents increases the value of the numerator (i.e. Current assets), while the favourable conditions for institutional loans make companies prefer long-term debt over short-term debt and thus lowers the
denominator of the current ratio (i.e. Current liabilities) (Boubakri et al., 2012a). As such, the higher liquidity ratio reduces the observed risk of the politically connected companies.
2.5. Effect on firm value & firm performance
The combination of weight of costs, weight of benefits and contingencies results in an overall impact of political connections on a firm’s performance and value. As stated earlier, the effect of politicians on the board of directors is not unambiguous. The question whether they add value is an empirical issue that differs across countries, industries and firms (Zhang & Truong, 2019). These varying results can also be found in the academic literature concerning this topic. Faccio (2010) claims that for her international study covering 47 countries, on average, the benefits outweigh the costs of being politically connected. However, others see a spectrum of different effects for firm value and firm performance. Zhang & Truong (2019) find that political
connections can increase firm value in China, when the government is an import business partner. Nevertheless, in the same study evidence shows that, when a new Chinese national regulation in 2013 commanded all politically connected independent directors to resign from the board of the listed companies, a positive price response could be observed. An underlying reason that may explain the revival of the share value is that the politicians involved often only held a pro forma membership at a companies’ board (i.e. superficial presence) and thus did not attract a lot of benefits. In addition, Shi, Xu, and Zhang (2018) also find a negative effect of political connections on firm value and identify ineffective monitoring of managers and
shareholders as the main reason for their outcome. Different stock price fluctuations are found in Goldman, Rocholl, and So’s study (2008). In their US-based study, the stock price is studied around the announcement of the nomination of a politically connected individual to the board of
directors. A positive stock return is registered following the announcement. Furthermore, the study looks into the effect of election results. When a company was linked to the winning party (here: the Republicans), a positive stock return could be analysed, while the companies
connected to the losing party (here: the Democrats) had to cope with a decrease in value. Once again, the effect of political connections on a firm’s performance is a bone of contention. In a general study on board composition – executed in the Spanish corporate environment – Martín and Herrero (2018) surprisingly found a negative relationship between the independence of the board and a firm’s performance, defining independent board members as: “directors (external or outsiders) appointed for their personal and professional qualities” (Martín & Herrero, 2018, p. 1016). They find that this effect may be caused by the intensive monitoring to which
companies with mainly independent board members are subject to or by the fact that those independent directors do not have the company- or industry-fitting knowledge or experience to contribute to an elevated firm performance. Additionally, the costs of information asymmetry, that independent board members often cope with, attribute to the decrease of firm performance (Martín & Herrero, 2018).
Replacing the subject of the study from the general independent directors to politically connected directors results in various outcomes for firm performance amongst different academic studies. Due to the possibility of measuring firm performance with different ratios or calculations, the following findings are each time accompanied by their corresponding way of measurement in order to generate a complete and objective image of the literature’s
conclusions. The measurements used (with their corresponding abbreviations) are: Return on Assets (ROA), Tobin’s Q, Market-to-Book ratio (MtB), Earnings per share (EPS), Ratio of Income from Sales to Sales (RISS), Return on Sales (ROS), Market Capitalisation (MCap), and Return on Equity (ROE).
The international studies of Boubakri et al. (2012a) and Faccio (2010) show largely contradictory impacts of political connectiveness on firm performance. While the former registrates, on average, an increase in performance (ROA), claiming that the benefits outreach the cost of political extraction, the latter finds that the redirecting of corporate resources towards political objectives has, on average, a detrimental impact on the performance (ROA & MtB) of connected firms, and thus results in a lower level of firm performance relative to their peers. Directing the focus to empirical national studies could answer the differences that erupt from the research papers that cover multiple countries. In the Asian-Pacific region political connections seem to have a positive impact on firm performance. Li et al. (2008) find that the performance (ROA, ROE) of Chinese private firms with political connections is higher than for
their non-connected peers. Additionally, it partially overcomes the negative effect of the governmental discrimination against the private sector on firm performance. Furthermore, Indonesian, South Korean and Hong Kong politically linked companies outperform (resp. EPS; EPS & MtB; Tobin’s Q & ROA) their non-linked peers (Rusmin et al., 2012; Shin et al., 2017; Wong, 2010). For Malaysia, ambiguous results are found. Wong and Hooy (2018) state that Malaysian firms with a more direct and thus stable political connection experience a positive effect on firm performance (ROA & Tobin’s Q), while the Malaysian evidence published by Hassan et al. (2012) shows a negative relationship between being politically connected and performance (ROA & Tobin’s Q), due to mediocre internal monitoring systems. Next to the mixed results found for Malaysia, Singapore seems to be a misfit in the Asian-Pacific region. No
significant impact of political connectiveness on firm performance (Tobin’s Q) is registered in the study provided by Ang et al. (2013). The authors claim that their findings are a result of the absence of corruption in the island state.
However, the Danish study of Amore and Bennedsen (2013) that focusses on the value of political connections at the Danish municipality policy level shows that political connections can increase performance (ROA), even in low-corruption environments. It implies that the presence of corruption is not a precondition for political connections to be valuable. Moreover, their study stresses the importance of the direct benefits a firm might receive from governmental
institutions, such as the preferential allocation of institutional projects. Despite the positive relationship of the Danish Case, other European studies like the Polish study of Jackowicz et al. (2014) and the French study of Bertrand et al. (2018) show that the presence of politically connected board members lowers firm profitability (resp. RISS; ROA). Jackowicz et al. (2014) claim that the negative relationship is primarily due to the combination of the instability of the Polish political scene and the sole use of political connections as an implicit guarantee against macroeconomic shocks and not as a source of easy access to finance. In contrast, in the French case, the cost that comes from redirecting corporate funds to political objectives, especially the cost of overemployment, is seen as the main contributor of the registered effect. The study of Hillman (2005), which focusses on the situation in the United States of America, reports that political connections have a positive effect on firm performance when performance is measured via market-based tools (Tobin’s Q & MCap). However, no significant connection is found when using accounting-based performance indicators (ROA & ROS).
2.6. Development of hypotheses
The overview of the existing literature illustrates that no unambiguous conclusion can be made on the effect of political connections on firm performance. As a result of which, the majority of the academic literature is focussed on empirical studies, studying the effect of board
membership of politicians on performance in a well-defined context. Therefore, this study will further elaborate on the environment of the Belgian listed firms.
Based on the overview of the academic literature, four key hypotheses are developed around the impact of political connections on a firm’s leverage ratio, number of employees, liquidity ratio, and on its overall firm performance. The hypotheses will be tested vis-à-vis non-connected Belgian listed companies.
The combination of the beneficial treatment of connected firms through political connections working at financial or legal institutions (Fu et al., 2017), the at times lower cost of debt (Boubakri et al., 2012a; Faccio et al., 2006), and the higher chance of bailout in case of financial distress (Faccio et al., 2006) makes debt financing more attractive. Various scholars provide proof for the increased ease by which companies can access external finance. It can be found in the comparison of the leverage ratio of politically connected firms and the leverage ratio of their peers (Bliss & Gul, 2012; Boubakri et al., 2012a; Faccio, 2010; Hassan et al., 2012; Kwaja & Mian, 2005). Considering their proof and the underlying pathways through which it occurs, we expect a similar result for the Belgian listed firm environment. Consequently, the first hypothesis states the following:
Hypothesis 1: Politically connected firms are more indebted than their non-connected peers.
Next to the benefit side, the literature also warns for the cost side of political influence in a firm’s board of directors. The extraction of corporate resources for political objectives is known to be a burden on a firm’s profitability (Boubakri et al., 2013; Shleifer & Vishny, 1994). Since a large amount of the extracted resources is directed towards excessive job creation (Bertrand et al., 2018; Boubakri et al., 2012a; O’Connor Keefe, 2019), our second hypothesis expects a higher number of employees in politically connected firms in relation to their non-connected peers: Hypothesis 2: Politically connected firms show a higher employment than their
To be able to bear these expenses for social objectives, cash is needed. Higher cash holdings in politically connected firms are found by Boubakri et al. (2013). It is expected that, when the redirecting of resources towards social objective occurs, politically connected firms are ought to have higher cash holdings than their non-connected peers. Hence, the third hypothesis states:
Hypothesis 3: Politically connected firms have higher cash holdings, and thus higher liquidity ratios than their non-connected peers.
As stated, the overall impact of political connections is a point of contention. Across countries, empirical research has found contradicting outcomes on return on assets and Tobin’s Q (Ang et al., 2013; Jackowicz, et al., 2014; Martín & Herrero, 2018; Wong & Hooy, 2018; Zhang & Truong, 2019). Since the studied European case studies mainly report a negative effect of political
connectiveness on firm performance, Belgian listed firms with political connections are expected to underperform relative to their non-connected peers, due to an expected European overlap in the contingency factors. Accordingly, the fourth hypothesis states the following.
Hypothesis 4: Belgian listed companies’ performance is negatively influenced by the presence of politically connected board members.
Despite the fact that for ‘Hypothesis 4’ a negative relationship is expected, it cannot be stressed enough that throughout the academic literature differences were found. Those differences could not be traced back to a single factor nor to a set of explaining factors. Therefore, uncertainty arises over the effect of political connections on firm performance. It is important to notice that the relationship could as well be inverted.
3. Methodology
This methodology section further elaborates on the research question , defines the variables used in the study, and illustrates the data-gathering process together with the initial data
treatment. Furthermore, some initial descriptive statistics are given on the full data sample. This section thoroughly describes the research process in order to make sure the research can be reproduced following the same procedure in a different geographical context or time frame.
3.1. Research question & Sample frame
The literature provides different aspects and approaches to research political connections and its impact on firms. This study formulates an answer to the following research question: ‘How do political connections impact firm performance in Belgian listed firms over the period 2008-2018?’
As the research question states, this research will be conducted by performing a Belgian case study, involving only listed companies. The advantage of the Belgian case study lies in the fact that research on population level is possible. No sample is taken. This research includes all Belgian listed companies on the Euronext Brussels during the 2008-2018 time frame. 2018 is taken as an ending point since it is the latest available information in the used database BEL-FIRST at the moment of writing. At the other side of potential political connections, all relevant Belgian politicians (cf. Variables) are taken up in the data.
3.2. Variables
3.2.1.
Defining political connections
While some researchers redefine the concept of political connections (Jackowicz et al., 2014) or use empirical ways to ensure their existence (Wang et al., 2019), in this paper, the definition for political connections is derived from Faccio’s definition.
“A company is identified as being connected with a politician if at least one of its shareholders (anyone controlling at least 10 per cent of voting shares) or one of its top
officers (CEO, president, vice-president, chairman or secretary) is a member of
parliament, a minister or is closely related to a top politician or party.”(Faccio, 2006, p. 369)
This definition differs from the one that will be used throughout this paper. Only direct objective relationships are studied. The choice of omitting the non-objective close relationship perspective can be justified by the argument that in her research Faccio (2006) warns for an incomplete picture of the situation, having to rely on publicly available sources and requiring subjective judgement. Moreover, of the six Belgian political connections found in her research, none were through close relationships (Faccio, 2006, p. 374). Those results of the more objective and less objective methods were found to be qualitatively the same (Faccio, 2006, p. 371). Furthermore, a second difference with Faccio’s definition of political connections is that the focus of this
research will lie on connections through directorship (i.e. membership of board of directors) instead of on connections through ownership (i.e. shareholdership).
A third difference concerns the policy level of the studied politicians. Even though Faccio (2006) only studied federal governments and parliaments, this research studies politicians of the different Belgian policy levels. The Belgian institutional system has six policy levels: The
European level, the federal level, the regional level, the community level, the provincial level, and the municipal level. The regional level consists of the Flemish Region, the Walloon Region, and the Brussels-Capital Region. The Flemish Community, the French Community, and the German-speaking Community are the three parts the community policy level consists of. In practice,the Flemish Region and the Flemish community are led by one government, and thus one
parliament. This brings the total number of governments, and thus parliaments, to five for the combination of the region and community policy levels. The provincial policy level consists of the provincial councils of each of the ten Belgian provinces.
Since there were 589 Belgian municipalities during the research period, the scope of the municipal policy level was limited to the city of Brussels, the thirteen so-called Flemish ‘Centrumsteden’ (Alost, Antwerp, Bruges, Courtrai, Genk, Ghent, Hasselt, Louvain, Malines, Ostend, Roeselare, Sint-Niklaas & Turnhout) and the eight Walloon ‘Grandes Villes’ (Charleroi, La Louvière, Liège, Mons, Mouscron, Namur, Tournai & Verviers) (Statistiek Vlaanderen, n.d.; Mobilité Wallonie, 2018). This brings the number of researched authority entities to 39.
3.2.2.
Defining leverage, employement & cash holdings
The first hypothesis (Hypothesis 1) investigates the effect of political connections on a firm’s usage of debt financing. Therefore, the leverage ratio is introduced. This ratio measures the percentage of total assets financed with short- and long-term debt and can thus be calculated as follows:
𝐿𝑒𝑣𝑒𝑟𝑎𝑔𝑒 𝑟𝑎𝑡𝑖𝑜 = 𝑆ℎ𝑜𝑟𝑡 𝑡𝑒𝑟𝑚 𝑑𝑒𝑏𝑡 + 𝐶𝑢𝑟𝑟𝑒𝑛𝑡 𝑝𝑜𝑟𝑡𝑖𝑜𝑛 𝑜𝑓 𝐿𝑜𝑛𝑔 𝑡𝑒𝑟𝑚 𝑑𝑒𝑏𝑡 + 𝐿𝑜𝑛𝑔 𝑡𝑒𝑟𝑚 𝑑𝑒𝑏𝑡 𝑇𝑜𝑡𝑎𝑙 𝐴𝑠𝑠𝑒𝑡𝑠
‘Hypothesis 2’ elaborates on the overemployment issue that may arise due to political extraction of corporate resources. Therefore, a relative measurement tool for employment needs to be developed. The average number of employees in full-time equivalents (FTE) is divided by total assets. The natural logarithm is taken to reduce the variety in outcome.
𝐸𝑚𝑝𝑙𝑜𝑦𝑚𝑒𝑛𝑡 = 𝐿𝑛 (𝑁𝑢𝑚𝑏𝑒𝑟 𝑜𝑓 𝐸𝑚𝑝𝑙𝑜𝑦𝑒𝑒𝑠 (𝑖𝑛 𝐹𝑇𝐸) 𝑇𝑜𝑡𝑎𝑙 𝐴𝑠𝑠𝑒𝑡𝑠 )
As the third hypothesis (Hypothesis 3) looks into the effect of political connections on a company’s cash holdings – first studied by Boubakri et al. (2013), we use their measure as the dependent variable to study the validity of ‘Hypothesis 3’. In their measurement tool, the denominator ‘Net Assets’ is the value of total assets with the exception of the cash & cash equivalents.
𝐶𝑎𝑠ℎ 𝐻𝑜𝑙𝑑𝑖𝑛𝑔𝑠 = 𝐶𝑎𝑠ℎ & 𝐶𝑎𝑠ℎ 𝑒𝑞𝑢𝑖𝑣𝑎𝑙𝑒𝑛𝑡𝑠 𝑁𝑒𝑡 𝐴𝑠𝑠𝑒𝑡𝑠
3.2.3.
Defining firm performance
For ‘Hypothesis 4’, an indicator of firm performance needs to be defined. The academic literature provides various ways for measuring firm performance (e.g. Earnings per Share, Market
Capitalisation, Return on Sales, Return on Equity, Return on Assets, Operational Return on Assets, Market-to-book ratio & Tobin’s Q). For this study, the most commonly reported measures will be used. This is a combination of the market-based measure ‘Tobin’s Q ratio’1,
which represents the future expectation of a firm’s success, and the accounting-based measure
1 (Ang et al., 2013; Ding et al., 2014; Hassan et al., 2012; Martín & Herrero, 2018; Muttakin et al., 2015;
‘Return on Assets’2, which looks at historical firm performance (Hillman, 2005). Furthermore,
Hillman states that the accounting-based measures may encounter more difficulties in capturing the value of political relationships than the market-based measures, since the latter are more effective in capturing the value of intangible assets. Nevertheless, both ways of measuring seem to have a widespread use in the academic literature, and therefore both will be used to measure firm performance. The return on assets ratio measures the efficiency by which a company uses its assets to generate earnings, while the Tobin’s Q ratio indicates if a company is overvalued (score above 1) or undervalued (score between 0 and 1) relative to the replacement value of the assets. These measures can be calculated with the following formula:
𝑅𝑒𝑡𝑢𝑟𝑛 𝑜𝑛 𝐴𝑠𝑠𝑒𝑡𝑠 = 𝑃𝑟𝑜𝑓𝑖𝑡 𝑜𝑟 𝑙𝑜𝑠𝑠 𝑇𝑜𝑡𝑎𝑙 𝐴𝑠𝑠𝑒𝑡𝑠 𝑇𝑜𝑏𝑖𝑛′𝑠 𝑄 = 𝑀𝑎𝑟𝑘𝑒𝑡 𝑉𝑎𝑙𝑢𝑒 𝑜𝑓 𝐴𝑠𝑠𝑒𝑡𝑠
𝑅𝑒𝑝𝑙𝑎𝑐𝑒𝑚𝑒𝑛𝑡 𝑉𝑎𝑙𝑢𝑒 𝑜𝑓 𝐴𝑠𝑠𝑒𝑡𝑠
A difficulty that arises when calculating the Tobin’s Q ratio is finding the right value of the denominator ‘Replacement Value of Assets’. Since this is hard to estimate correctly, a widely used simplification of the ratio, replaces the numerator by the book value of assets. This change actually results in the market-to-book value ratio, which is also a common measurement of firm performance3. However, Hillman (2005) warns for the use of this simplification because of the
possibility of an inflated q-value when assets have already been the subject of multiple depreciations.
3.2.4.
Control variables
In all regressions, we control for firm age and firm size. For firm age, the natural logarithm of the years since the date of incorporation [Ln(Age)] is used (Bliss & Gul, 2012; Boubakri et al., 2012b; Fu et al., 2017; Muttakin et al., 2015; Shin et al., 2017). To avoid that companies that are yet to surpass their one-year existence receive no value for the natural logarithm of their age, we add one year to the age of the company. Despite the various ways in which firm size is measured in the academic literature (Employees, fixed assets, Market capitalisation, etc.), in this research paper the control variable firm size is defined as [Ln(Total Assets)] accordingly with the literature of various scholars (Bliss & Gul, 2012; Boubakri et al., 2013; Boubakri, et al., 2012b;
2 (Boubakri et al., 2012a; Chen et al., 2014; Ding et al., 2014; Faccio, 2010; Fisman, 2001; Hassan et al.,
2012; Hillman, 2005; Li et al., 2008; Muttakin, et al., 2015; Shin et al., 2017; Wong & Hooy, 2018)
Hassan et al., 2012; Muttakin et al., 2015; Rusmin et al., 2012; Shin et al., 2017). Furthermore, some control variables are added for specific hypotheses. Since the performance and the cash position of a company can have an influence on the financing decisions of a company and its employment decisions – and thus its overall firm performance, the introduction of control variables for these factors in the testing of ‘Hypothesis 1’, ‘Hypothesis 2’ and ‘Hypothesis 3’ is at place. For ‘Hypothesis 1’ and ‘Hypothesis 2’ an additional variable is added that controls for ‘fixed assets’. The reasoning for taking up the variable differs between the two hypotheses. Since fixed assets form the basis for collateral possibilities on a loan, the variable is taken up in
‘Hypothesis 1’. For ‘Hypothesis 2’, they are a mere indicator of growth of the firm, which may partially explain an increase in employment. The variable ‘leverage ratio’ is added as control variable for ‘Hypotheses 2’ and ‘Hypothesis 4’ (Ding et al., 2014). The same can be said about the variable ‘Sales growth’ (Shin et al., 2017). Additionally, variables check for year fixed effects and industry fixed effects. The control for industry is done by a variable IND which classifies the wide range of activities found for the Belgian listed firms according to the grand sections defined by the NACE BEL 2008 nomenclature (FOD Economie, 2011, p. 65) (cf. 3.4. Initial
data-processing). An overview of the variables used per hypothesis is provided in ‘Table 1’4.
Table 1 - Overview variables
H1 H2 H3 H4 Variable Description
Dependent X Leverage ratio (LEV) The ratio of debt financing to total capital. X Employees (EMP) The natural logarithm of the ratio of number of
employees, relative to the total assets.
X Cash Holdings (CHS) The ratio of cash & cash equivalents relative to total
assets minus the cash & cash equivalents.
X Return on Assets (ROA) The ratio of net result to total assets. Measures
efficiency of assets.
X Tobin’s Q (TBQ) The ratio of market value of assets to book value of
assets. Indicates over- or undervaluation. Independent
X X X X Political connection
dummy (POLCONN)
Dummy variable gets the value 1 when politically connected, and 0 when not.
Control X X X X Firm size (LNSIZE) Natural logarithm of total assets.
X X X X Firm Age (LNAGE) Natural logarithm of the sum of the number of
years since the date of incorporation and one.
X X Return on Assets (ROA) The ratio of net result to total assets. Measures
efficiency of assets.
X X Cash Holdings (CHS) The ratio of cash & cash equivalents relative to total
assets minus the cash & cash equivalents.
X X Fixed Assets (FIXA) Natural logarithm of fixed assets
X X Leverage ratio (LEV) The ratio of debt financing to total capital. X X Sales growth (SGR) The ratio of the YoY change in sales on the sales of
the previous year.
X X X X Year (YEAR) Variable which controls for year specific anomalies. X X X X Industry (IND) Variable which controls for industry specific
anomalies. (Per NACE BEL 2008 grand section)
3.3. Data-gathering process
The process of collecting data exists of three main aspects, i.e. the collection of the politicians active in the different Belgian political levels of government, the composition of the board of directors of Belgian listed companies and the financial data of those listed firms. The first two datasets are used to make a distinction between politically connected firms and non-connected firms, while the last dataset is used for the statistical processing of the financial ratios to eventually formulate a conclusion to the research question.
3.3.1.
Politicians in Belgium
Given the researched time span of eleven years (2008-2018), most policy levels had two to three elections during this period, which implies continuous changes in compositions of both
parliament or council and government or authority of the 39 researched authority entities. For each election the elected members of parliament or council members are retrieved from the official websites of the election results and the parliaments (kamer.be, senate.be, ibzdgip.fgov.be, electionslocales.wallonie.be, pfwb.be, parlement-wallonie.be, parlement.brussels,
Vlaanderenkiest.be5). Information from other sources is added to the list of politicians to reflect
as good as possible the change in positions happening after inauguration of a parliament or government. Consulting those sources results in a list of politicians with their corresponding policy level and tenure. In addition, information on the political party, the inauguration date and the end date of the function is included.
5 Respectively: (De Kamer van volksvertegenwoordigers, n.d.; De Senaat, n.d.; Federal Government
Belgium, n.d.; La Wallonie, n.d.-a; La Wallonie, n.d.-b; La Wallonie. n.d.-c; Le Parlement de Wallonie, n.d.; Parlement Bruxellois, n.d.; Vlaams Agentschap Binnenlands Bestuur, n.d.)
A total of 3 463 politicians are found, resulting in 6 005 combinations of politicians, party, policy level and tenure. This list of Belgian politicians is constructed with the purpose of comparing it to the list of board members of the Belgian Listed firms.
3.3.2.
Belgian listed firms’ board composition
Data of the members of the board of directors of the Belgian listed firms is retrieved from the database BEL-FIRST of the Bureau van Dijk, which contains information on both Belgian and Luxembourgish organisations. Since this research is restricted to companies active on the Brussels stock exchange between 2008 and 2018, filters need to be added to exclude non-listed firms and Luxembourgish organisations. Concerning the information on the composition of the board of directors, the database offers data from three different sources, i.e. ‘Effective
information’, ‘Legal information’, and ‘Belgian National Bank information’. After looking in on all options, the ‘Effective information’ proved to be the most complete of the three and is further used throughout this research paper. This resulted in a raw database output of 7 672 values. Information on the name, function, start date, and ending date are extracted from BEL-FIRST. An additional process that is essential in order to make the list of the board members and the list of Belgian politicians comparable is data cleansing. A first step in the data cleansing process is the removal of double or overlapping values in the BEL-FIRST output (i.e. in case of contract renewal or slight adaptation in function). This step drastically reduces the number of values from 7 672 to 4 721. A second step in the process is the elimination of any organisational members of the board of directors (i.e. organisations that have a stake in the company,
represented by a non-fixed natural person on the board). The exclusion of those values can be justified by the fact that this paper investigates only direct connections between fixed board members and politics. Due to this step, the number of values drops from 4 721 to 3 029. Admittedly, this list still contains double names, however this occurrence of double values can be linked to an interruption of an individual’s membership of the board of directors. A last step in data cleansing includes removing all honorary titles and middle names, and reorganising the name sequence in the list, which now solely consists of natural persons with board membership. The previous steps are needed to make the outlays of this list correspond to the list of Belgian politicians in order to facilitate further processing of the data.
3.3.3.
Belgian listed firms’ financial data
Again, the BEL-FIRST database is used to retrieve the financial information of the Belgian listed companies. The data found in the database offered by Bureau Van Dijk, incorporates amongst others the financial figures and additional information of the annual reports of the companies active on the Brussels Stock Exchange (BSE).
Most of the ratios - earlier defined in the segment on variables (3.2. Variables) - that are used to define firm characteristics are directly available in BEL-FIRST. These financial figures, however, will be calculated again using the basic building blocks of the formulas. It guarantees that the ratios are calculated following the same definitions, and thus a single calculation method. Since the database only stores financial data until 10 years past publication, a raw data set of the needed information can only be downloaded for the period covering 2010-2018. ‘Table 2’6
displays the list of consulted data categories, the period over which the data was obtained and a brief description of the content of the variable.
Table 2 - BEL-FIRST raw data variables
BEL-FIRST variable Data period Description
Name Latest data The latest legal name of a company
BvD ID number Invariable Unique number for identifying a company given by Bureau Van Dijk, consisting of a the land code of the company’s headquarter and the company’s enterprise number.
NACE BEL 2008, code principal Invariable European / Belgian code that categorises the economic activities of companies in various sections, divisions, groups and classes. Date of incorporation Invariable Exact date of the legal formation of a company.
Total Assets (EUR) 2010-2018 The total amount of corporate assets, expressed in monetary terms (EUR).
Fixed Assets (EUR) 2010-2018 The part of a company’s total assets that is expected to remain in the company in the long term to generate incomes, expressed in monetary terms (EUR).
Within cash and cash equivalent (EUR)
2010-2018 The part of a company’s total assets that consists out of cash or assets that can be converted to cash in the very short term, expressed in monetary terms (EUR).
Non-current Liabilities (EUR) 2010-2018 The company’s debts or obligations, payable over more than one year, expressed in monetary terms (EUR).
Current Liabilities (EUR) 2010-2018 The company’s debts or obligations, payable within one year, expressed in monetary terms (EUR).
Turnover (EUR) 2010-2018 The monetary value (EUR) of a company’s revenues originating from its business activities.
P/L for the period (EUR) 2010-2018 The net profit or loss after taxes, expressed in monetary terms (EUR), resulting from the subtraction of the total expenses from the total revenues.
Market Capitalisation (EUR) 2010-2018 The estimated monetary value (EUR) of a company, calculated by multiplying the market price of one share at a chosen time with the number of outstanding shares at that same moment in time. Average number of full-time
employees
2010-2018 The average number of employment in a company over an accounting year expressed in full-time equivalents (FTE).
This raw data set is completed with the information of the annual reports of the listed companies of 2009, as they report the values for both the financial years 2008 and 2009.
Furthermore, the lacking data for the connected firms is filled in to the highest extent possible, in order to be able to work with all currently available financial information in the statistical analysis.
3.4. Initial data-processing
The first step in the data processing is comparing the list of Belgian politicians with the list of members of the boards of the Belgian listed companies. Due to the incompleteness of the
effective information of the Bel-first database, additional information on the starting and ending date of the board participation is retrieved from various online sources (i.e. Cumuleo.be,
Linkedin, DeTijd.be, etc.) or by consulting the corresponding company’s web page on board composition.
An initial comparison of the two lists shows an overlap of 43 values, solely on name-basis. However, to make sure that the overlap is not merely due to coincidental name resemblance with non-political businessmen, each overlapping value is analysed individually via the above mentioned online sources to ensure that the resulting values involve politicians. A last
comparison takes into account the period of political activity and the period of membership of the board of directors. An overlap of these two time frames is essential to be able to characterise a connection as a political connection.
A total of 30 connected politicians are found. ‘Table 16’ of Appendix I – Overview connections (p. XV - XVI) provides an overview of the companies and politicians involved in these
connections. Out of the 154 listed companies of the initial sample, seventeen show at least one political connection over at least one year during the period 2008-2018. This corresponds with 11.04 per cent of the listed firms, which is higher than the 3.82 per cent of Faccio’s 2006 findings