R.van den Berg, E.R. Soczö and J,H.A.M.Verheul National Institute of Public Health
and Environmental Protection (RIVM), the Netherlands,
D.H.Eikelboom
Netherlands Organisation for Applied Scientific Research (TNO).
Mailinglist
1. M.Salkinoja-Salonen. University of Helsinki, Finland. Department of General Microbiology.
2. P.Werner. DVGW-Forschungsstelle am Engler-Bunte Institut der Universitat Karlsruhe, Deutschland.
3. L.Harbak. Grindsted Products A/S, Aarhus, Denmark.
4. S.Vedby. National Agency of Environmental Protection, Copenhagen, Denmark.
5. N.Battersby. Water Research Centre, Medmenham, England.
6. G.Milde. Institut für Wasser-, Boden-, und -Lufthygiene, des Bundesgesundheitsamtes, Berlin, Deutschland.
7. V.Vanek. Viak AB, Malmö, Sweden.
8. E.Arvin. Stanford University, Department of Civil Engineering, California, U.S.A..
9. R.Valo. Oy,.DN-Bioprocessing Ltd, Helsinki, Finland. "10. M.Vattulainen. Ekokera, Riihimaki, Finland.
11. B.Jensen. -Department .of Environmental Engineering, ..Technical. University of Denmark, Lyngby, Denmark.
12. R.J.Watkinson. Shell Research'Ltd., Sittingbourne Research Centre, England.
13. N.Nyholm. Water Quality Institute, H^rsholm, Denmark.
14. H.F.Bavinck. Directoraat-Generaal voor de Milieuhygiëne, Directie Bodem, Water, Stoffen Volksgezondheid vironment. Hoofdafdeling Bodem.
15 - 16. Het hoofd van de afdeling .Biologie van de Hoofdgroep Maatschappelijke Technologie van het TNO.
17. Sekretaris-Generaal van het Ministerie van Welzijn, Volksgezondheid en Cultuur.
18. Directeur-Generaal van het Ministerie van Volkshuisvesting, Ruimtelijke Ordening en Milieubeheer.
19. Plv. Directeur-Generaal van het Ministerie van Volkshuisvesting, Ruimtelijke Ordening en Milieubeheer.
20. Directie RIVM 21. dr.ir.T.Schneider 22. ir.Tj.Hofker 23. ir.N.D.van Egmond
CONTENTS page
Abstract 1
1. Introduction 2
2. Description of the site 3
3. Biodegradation research 5
4. Leaching experiments 7
5. Experiments in large stainless steel columns 8
6. Design for the clean-up operation 11
7. Summarizing conclusions 12
8. References 12
ABSTRACT
As part of a Research Programme on Biological Treatment of Contaminated Soil the feasibility (technical aspects as well as costs and time) of an in situ biorestoration is studied.
As experimental site a gasoline contaminated site, a-petrol station, has been-chosen. 'Besides the characterization of the soil, therspreading of-'the• contamination is described.
From laboratory studies into the possible stimulation of the biodegradation •rate in the soil of the site it has been concluded that by adjustment of-i-the abiotic conditions (nutrients, water saturation, pH) and possibly of-i-the biotic conditions (increase of autochtonous or addition of allochtonos biomass) the biodegradation rate, determined as carbon dioxide production, could be increased from 1 to 10 mg C.kg .d . I t was concluded that the biodegradation was limited by the availability of the gasoline components. Leaching experiments have shown the slow release by dissolution of the gasoline. After an initial high leaching a maximum rate of 5»mg C.kg .d was found, depending on the percolation rate.
Column experiments are in'progress. -The preliminary, results confirm the technical feasibility and show the use of hydrogen peroxide as alternative oxygen source and neglect-of nitrate as electron acceptor.
2
-1. INTRODUCTION
' The past ten years several thousand cases of soil contamination have been discovered in the Netherlands. It is expected that in about 1600 ^of these cases the soil has to be cleaned.
An important part of the costs of clean-up is involved with excavation. of 'the contaminated soil. These costs could be reduced considerably by an in-•' " situ treatment of-the-location, especially in ' case -of contamination in-•'at
greater depth or under buildings.
In the framework of the Research Program on Biological Soil Clean-Up Techniques the Ministry of Housing, •. Physical Planning.and Environment has • assigned a ,research project, to-the .RIVM,in co-operation with the Division
Technology for Society of TNO.
The aim of the research project is to study the feasibility of a biological in-situ treatment, including aspects of costs and time.
As contamination an oil-pollution has been chosen, because.a large number-'of sites are contaminated with.oil and-oil consists of-components whlch-*are ':-in'principal biodegradable. .Oil ^contamination of theisubsoil might threaten
eventually-the quality of drinking-water. .
The project includes three stages:
• "'1. A literature studyand the selection-of the experimental site; • ..; 2. Laboratory research and detailed (geohydrological and chemical)
•investigation of the site;
3. Design and execution of the clean-up.
• * -The ' literature, study summarizedrthe theoretical base .of in-situ treatment .'•'.-''and revealed'four--in-situ :biorestoration.experiments in :the subsoil.. ...Three.
'of 'these experiments* were carried out at sites, contaminated with oi-l.'The results of the treatments varied. In all cases the ground-water was clean after 0.5 to 2 years. However, in two cases the contaminant was still '"' present in-the soil at rather.high concentrations. Concerning/the-technical
aspects and the final results, it was concluded that biological in-situ treatment offered reasonable prospectives.
This paper describes the results of the site investigation, the laboratory . research (biodegradation and leaching experiments) and the preliminary
results of experiments in large stainless steel columns. A preliminary design of the clean-up is also given.
2. DESCRIPTION OF THE SITE
The site is situated at Asten, in the province of Noord-Brabant.- It is a petrol-station, where the soil is contaminated with gasoline and a small quantity of diesel oil.
The ""contamination has been caused by a leaking tank of the petrol station.-3 At. least 30,000 liters of normal gasoline has been lost, and about 1500 m of soil has been contaminated. The contaminated area is about 25x25 square meters. The horizontal spreading of the contamination is given by the dotted line in figure 1. This figure also shows the location of the monitoring wells, which have been placed to get a good impression of ^quantity -and «-thevcomposition-of .the .contamination.. In this.wells the.frees,
•product was measured up'to 150-cm. About 20,000 liters of free product has been recovered, by pumping off after'the'discovery of,:the contamination.
•At the location,* the soil-ds generally*sandy, nearly . without any organic material (< 0,05%). Until 15-20'meters below surface -level, some layers of clay and loam are present. At 20 meters,-there Is a thick layer of porous 'material. The ground-water level increased from 2.5 to 3.5 meter
below-surface level during the pumping off. Figure 2 shows the composition of the soil at the site.
Several samples of 'soil and ground-water have been analyzed. The concentrations of gasoline at different., depths in the soil are also -indicated in figure ••2.-Concentrations'varied.mainly .between 1,000 and 5,000.
mg/kg. The 'concentrations of -some"individual gasoline components in the ground-water are given in table 1.
4
-TABLE 1, Concentrations of some individual gasoline com-_ 1 ponents in ground-water at the site, (ug.l )
Filter, depth (cm) BZ Tol EB Napht
Bl CI DI El A2 B2 C2 D2 E2 E3 400 400 400 400 700 700 700 700 700 1500 550 145000 250 14000 260 10 2 4 110 15 405 200000 680 14000 80 40 11 8 190 40 1 18000 30 1490 20 10 4 4 14. 9 13 2000 18 338 5 4 1 2 4 3
Reference values according to the guidelines of the Dutch
government (Moen, 1986). ' A B C 0,2 1 5 0,5 15 50 0,5 20 60 0,2 7 30 BZ - Benzene Tol - Toluene EB - Ethylbenzene Napht - Naphthalene
V •'>
3. BIODEGRADATION RESEARCH
The aim of this research was to determine the biodegradation capacity of the contaminated soil and the possibilities for stimulation of the biodegradation activity by changing the (a)biotic conditions.
"'-The biodegradation .experiments, have been -performed , as-".batch -cexperiments with contaminated soil from the site. The degradation has-been determined by following the oxygen uptake (Sapromat test) or the carbon dioxide production. The parameters investigated with regard to the stimulation of "the biodegradationiwere:-C-N-P ratio,- nitrogen source, addition of
^-active-oil' degraders, addition of 'sodium acetate, moisture content, pH, and alternative oxygen sources (nitrate.and hydrogen peroxide).
Because of the very low organic carbon content (< 0,05%) of the soil itself, the blank carbon dioxide production was very low with a mean rate less than 1 mg C.kg' .d' .
Figure 3 showsthe results of research into the influence of the C-N-P ,- -ratio on .the-degradation .with KNO- as N source.-.Other N sources, as NH,NO-,
•• NH^Cl and '(NH • ) *'"SOv'were 'also investigated. iThe'-C-N-P ratio.-as: welL-as^the; kind of N source 'had -a relative small influence on the degradation. -'.,However, as figure 4 indicates,.at an increased phosphate dosage a higher
degradation "rate was found. This was due to the binding of phosphate to the soil. In spite of a good oxygen"* and nutrients supply,^ in all cases a relatively low microbial activity - was , observed .in the Asten..soil. Experiments with other types of soil confirmed this . observation, as indicated in figure 5.
On the basis of the above mentioned results further research was focussed on the determination of the biodegradation limiting factors. Figure 6 (.'summarizes the effect of different factors on the biodegradation rate. The -degradation- activity-was enhanced most-by the addition of seeding material
from a landfarm. In case of the addition of sodium acetate an initial increase of the oil degradation rate was observed, probably caused by an initial higher biomass due to growth on sodium acetate. An increased degradation rate was also found by the--saturation of soil with water and addition of phosphate and nitrate. A neutral pH and buffering also contributed t o favourable conditions. Under these stimulated conditions the
6
-«• . Sl 1 - V
degradation rate varied between 5 and 40 mg C.kg .d and the estimated average rate was about 10 mg C.kg .d
Oxygen diffusion was not the limiting factor.in the.laboratory tests. Under field conditions however, biodegradation is probably restricted by oxygen .--transfer. Therefore, hydrogen peroxide and nitrate -were investigated •'as alternative oxygen sources. The results, shown in figure 7 indicated that hydrogen peroxide could be a suitable oxygen source. Nitrate seemed to be
inefficient because a decrease - of the biodegradation rate was observed. Hydrogen peroxidehad no .toxic,., effect . on the.^microorganisms.^up . to .a -concentration of 200 mg H„0„.kg" .
The following conclusions were drawn:
The biodegradation activity of Asten soil was stimulated mainly by inoculation, working under saturated and neutral pH conditions and addition of nitrogen and ^especially phosphate. The biodegradation rate did" not V increase during -.the -.experiments ,..but;i.remained -constant in ..time. . rThis .^ may ;. •-•"imply- .that -an .lunknown- ^limiting""factor •consists 'which
—•restricts":^^'the"''-biodegradation.
•.--.'From mass., balance ^studies . it-i--appeared that the degradation rate of the ••-'•gasoline contamination in the Astenrsoil was'- probably determined by the rate at which the -loilcomponents became .? available. 'In the laboratory experiments the availability was determined predominantly by the • .-dissolution .cand volatilization processes, .but under field conditions^only-^,
the dissolution process.prevails.. This aspect was-dnvestigated further" by leaching experiments.
-4. LEACHING EXPERIMENTS
The key question in the clean-up of an oil contaminated'soil is the removal
of the immobile rest-saturation of oil.
The aim of the leaching experiments was to determine the 'availability of
the oil components for-the microbial degradation and to>try to. enhance', the availability.
The leaching test has been performed byi applying a-^continuous _flow-. of a
nutrient solution - through' a- 'soil '-column w h i c h ^ h a d an-gasoline-rest--'saturation-just above" the ground-water level. The bioavailability of
the--gasoline was .determined .by comparison of the, dissolved organic carbon
concentrations in the leachates of contaminated and clean columns. In the leaching experiments the effect of the percolation rate, the concentration
of the gasolinev contaminant in the soil and the addition of detergents was determined.
'• The. experiments ^have-r-shown'-'that „in' test- -^set-up : the -.^leaching - of-'.•the-', gasoline, which-was. present as a rest ^saturation in-the soil, is'-small and
. .hardly influenced by the .--tconcentration of -the ..-contaminant;. At - a., rest •saturation nof-.^gasoline "-of--5%-* pore-•-volume the-concentration of-leached
carbon is about 20-30.mg C.l after an initial high concentration v of ,,,20- •
200 mg C.l" •, (figure 9 ) . The leaching rate after the initital phase is •calculated for' 5'mg C.kg -.d- cat the highest percolation rate-='(0-,4 m:d -);''-.'
A linear relationship•• was determined for the total quantity of organic
carbon leached from-the column and^the flow rate (figure;.'10) . An- immediate, equilibrium was suggested for the partition of the oil components to the
aqueous phase.
'The mobility of the gasoline -components could not be promoted by the --.application, of detergents in the -nutrient solution because of clogging - of the soil. This clogging might be caused by biomass grown on the
biodegradable detergents or what seemed more probable, by an interaction between the oil, water,-detergent and solid phase. In contrast to what was •expected a-decreased leaching of.gasoline was found ."when detergents , were
applied (figure .11). Negative leaching in course of time is -explained by the leaching of more organic carbon from clean soil columns than---.from
. 8
-5. EXPERIMENTS IN LARGE STAINLESS'STEEL COLUMNS'
The combined leaching and .biodegradation-processes were studied in^large stainless steel columns to confirm the findings from the former experiments , I in continuous flow experiments and. to -investigate possible - oxygen
"^•T~ limitations and alternative oxygen'sources. The stainless 'steel columns had 'a 20 cm diameter and a length of 70 cm. Six colvimns were filled with
undisturbed profiles...at depths from 2,5 to 3,2 m below .surface .level. In
0
the laboratory they where build-up-in a climate room (10 C ) . All columns -'were percolated with aerated'-artif icialvrainwater in-.the up-flow-.-mode"*^-and'
all •-' • -'presented .different modes of 'action.-Column 1: has no other features and is used as a blank.
Column 2: addition of nitrate (12,5 mg N.l as NH.NO-) and phosphate (15 mg P.!"-*- as a buffer of KH2P0^ and Na-HPO, , pH 6,9 at 10 C) in
the rainwater.
tt ..Column-3,: .-as column.. 2 with, H«0« as. an. additional oxygen source-.(cone, up to 200 mg.l )
.V.-' Column-4: as-.,column« 2 with an ^initial...addition ''of^hsodium. acetate .to stimulate the biomass
'-'Column 5: as column. 2-'with potassium nitrate as an additional oxygen source (cone, up to 100 mg N.l )
Column 6: as column 2 but the effluent is recirculated after a treatment step.
' The column experiments were, started at the first of July.
To follow the processes in the columns the following parameters were measured: nitrate, nitrite, ammonium, phosphate,-oxygen," dissolved organic carbon, gasoline and its -individual components (GC-analysis) and colony count.
The percolation rate through the columns was reasonably constant and was increased after 100 days from 0,4 m.d' to 0,8 m.d." for the necessary input of dissolved oxygen to meet the mean degradation rate of 10 mg C.kg'^.d"^.
Although no final results can be given, the following preliminary results are reported.
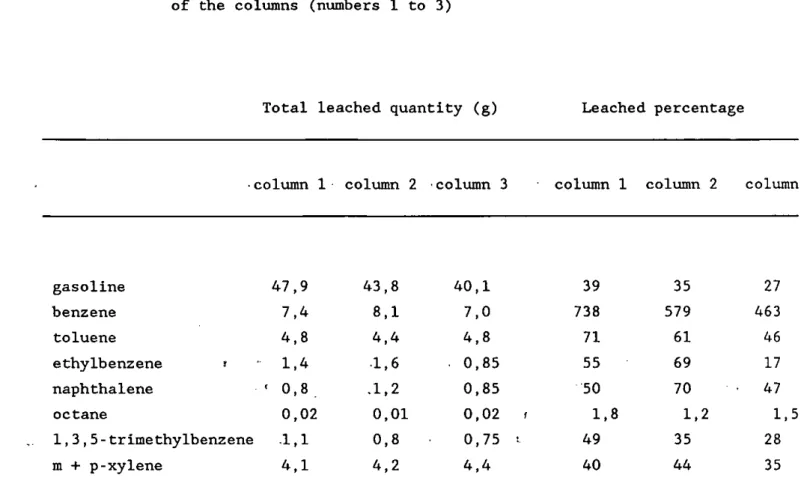
In all columns, except the recirculated one, about 20% of the gasoline present (GC-analysis) was leached in the first week (figure 12) at concentrations upto 400 mg gasoline.1 . Table 2 shows the total quantities and the percentages leached of three of the columns after 110 days. After 110 days 39% was leached in the blank column (no. 1) and 27% in column no. '3 (hydrogen peroxide). The behaviour, of the.various gasoline components could be different, considering percentages and time course. Toluene (figure 13) was leached for 70% in the blank column and 50% in the hydrogen peroxide column, but in both columns no longer after 40 days, while
1,3,5-trimethylbenzene (figure 14)' was still present in -the*leachate 'after 110 ••'days'with a-^ cumulative-leaching of 50% in column no. 1 and 30% . in column
.no. 3. Octane*was only leached for less than 2% in all columns.
As table 2 shows, generally lower leaching percentages were observed for column no. 3. However, the total leached quantities were comparable except for ethylbenzene. The leaching of the gasoline was calculated for about 100 mg C.kg" .d during the first week and 5 mg C.kg .d in the next period, during which no decrease in the -leaching was observed. These leaching. , results corresponded well-i . with- -.those .-of -y-the laboratory --leaching^
experiments.
'The oxygen, profiles measured over', the column att several-sampling,dates -..,(figure 15) showed oxygen to be consumed in the first few centimeters of
the column. The addition of hydrogen peroxide provided much more oxygen to the microbial population as shown in the oxygen profile. ' Nitrate was not used in ^ny of the columns as alternative oxygen source (figure 16).
Recirculation of the effluent after a deironization step over a sand and gravel filter, gave no technical problems and offers a possibility to reduce the necessary water-volume.
The experiments are *• continued until a considerable biodegradation of. the gasoline is calculated, based on oxygen input, or the oxygen profile indicates a decrease in the biodegradation. However, the actual .•biodegradation and clean-up of the soil has to be determined from analysis
10
-TABLE 2. Leaching of gasoline and individual components out of three of the columns (numbers 1 to 3)
Total leached quantity (g) Leached percentage
column 1 column 2 column 3 column 1 column 2 column
gasoline benzene toluene ethylbenzene r naphthalene octane 1,3,5-trimethylbenzene m + p-xylene 47,9 7,4 4.8 1.4 ' 0,8 0,02 •1.1 4.1 43,8 8,1 4.4 •1,6 -1.2 0,01 0,8 4.2 40,1 7,0 4,8 0,85 0,85 0,02 f 0,75 -. 4.4 39 738 71 55 50 1.8 49 40 35 579 61 69 70 1.2 35 44 27 463 46 17 • 47 1.5 28 35
Based on a degradation rate of 10 mg C.kg" .d' , a daily throughput of 3 2
about 1850 m water in .the area of "625 m has been calculated and used for the hydrological design of the clean-up operation.
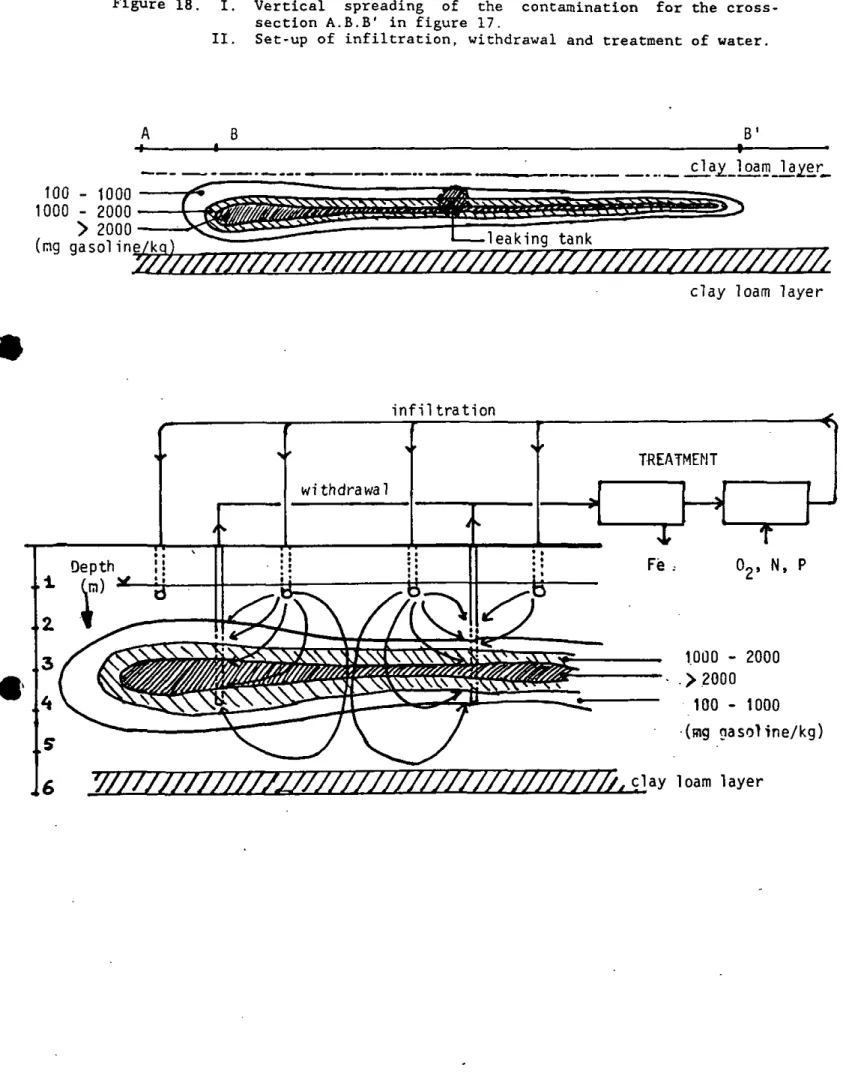
It has been decided to infiltrate the water by drains, which will be installed at a depth of about 1 meter below surface. Withdrawal of the infiltrated water will take place by pumping wells which are spread on the contaminated area. Thet-rate-^of-withdrawal will'be larger than the rate -of infiltration.
For.the optimal design of the drains and the pumping well the computer program CONTOUR is used. As a first non-optimal example a design has been made which is presented in figures 17 and 18.
Boundary conditions for the design are the hydrological isolation of the contamination in vertical and horizontal sense and the possible increases and'' decreases of the ground-water in the.area. Special attention ihas to be paid to'.the percolation, under the'buildings on the.;site. •- - -.^v. .-"
12
-7. SUMMARIZING CONCLUSIONS
From the laboratory experiments it was found that a stimulated biological treatment gives rise to a clean-up period of 1.5 years, based on a degradation rate of 10 mg C.kg .d , measured under laboratory conditions. The started column experiments show the oxygen limitation and possible use of hydrogen peroxide as alternative oxygen source. Nitrate seems no suitable oxygen source. Results of the residual gasoline components analysis are necessary to confirm all findings of the laboratory tests.
A preliminary hydrological design-' seems to- confirm the technical feasibility of this project.
It is expected to start the execution of the clean-up in the spring of next year. Our experiments until now have learned that in-situ biological treatment offers a good alternative with some advantages over excavation combined with physical, chemical or biological treatment.
8. REFERENCES
Berg, R.van den. Eikelboom, D.H., .en. Verheul, J.H.A.M., 1987. In situ biorestauratie van een>'fmet olie verontreinigde bodem.'Resultaten van het
laboratoriumonderzoek. RIVM rapport 728518002 (RIVM, Bilthoven).
Eikelboom, D.H., 1985." In situ biorestauratie van een met olieprodukten verontreinigde ondergrond. Een literatuurstudie. TNO rapport R85/320 (TNO, Delft).
Eikelboom, D.H., and Verheul, J.H.A.M., 1986. In situ biological treatment of a contaminated subsoil. Pp. 686-692. In: Contaminated Soil (J.W.Assink and W.J.van den Brink, Eds.). Martinus Nijhoff, Dordrecht.
Moen, J.E.T., Cornet, J.P., and Evers, C.W.A., 1986. Soil protection and remedial actions: Criteria for decision making and standardization of requirements. Pp. 441-448. In: Contaminated Soil (J.W.Assink and W.J.van den Brink, Eds.). Martinus Nijhoff, Dordrecht.
Verheul, J.H.A.M., Berg, R.van den, en Eikelboom, D.H., 1987. In situ biorestauratie van een met olie verontreinigde bodem. Nader onderzoek rapport. RIVM rapport 728518001 (RIVM. Bilthoven).
E© Monitoring wells PO Observation wells D 9 Pumping wells
14
-Figure 2. Soil profile and average concentrations of gasoline at the contaminated site (Asten), compared with the A-B-C reference values of the Dutch government.
gasoline cone, (g/kg d.w.) I 1 1 1 0 1 2 3
i
[ 0 . 0 2Li
0.8 Depth (m) t — 0 4 5 - 3 - 4 - 5 - 6 - 7 L - 81
clay-loam clay-loam clay-losii clay-loam500 400 -300 200 -100 CNP 100:10:1 A CNP 500:50:1 Time [d] CNP 500:500:1 X CNP 100:111 <^ CNP 100:10:1 V CNP 500:5:1
Figure 4. Influence of d i f f e r e n t C-P r a t i o ' s on the biodegradation of
g a s o l i n e , measured as CO--production (mg C/kg). C-N r a t i o :
100:10. Gasoline concentration 2600 mg C/kg.
800 o E t—J c o 700 600 500 •400 300 200 100 -a Blonc CNP 100:10:10 Time [ d ] CNP 100:10:1 ^ CNP 100:10:5016
-Figure 5. Biodegradation , measured as CO^-production (mg C/kg) of gasoline, diesel and gasoil (concentrations 1000 mg C/kg) in Asten soil and a topsoil (TNO).
400 350 300 250 -200 150 -lOD 50 -Astcn 9^9oline A "mo gasoline Time [d] -f Asten d i c s d X TNO d i e s d o Asten 9^90!! V TNO 9asoi!
Figure 6 Biodegradation of gasoline measured as C0„-production (mg C/kg). Gasoline concentrations: 3000-5700 mg C/kg. Effects of water saturation, nutrient addition (CNP ratio 100:10:1 and 100:10:5) and seeding with KONI soil: 50 g/kg.
\ Ü E *• -o tJ c 3 O
J
-c 0 L. O Ü D Bbnc -h Water soturation i C:P 100:5 Time [ d ] O Water, CNP 100:10:1 Seeding witti KONI(50 g/kg). Gasoline concentration: 800 mg C/kg. 900 < u E Blonc + 200 mg K N 0 3 / k g 2 0 m g H2Q2/kg, KONI Time [d] O 500 mg KN03/kg X 100 mg H20V«9>K0NI
Figure 8. Influence of hydrogen peroxide addition (25 - 200 mg H„0„Ag) 2-2' on the biodegradation of gasoline, measured as C0„-proauction (mg C/kg). Gasoline concentration: 2600 mg C/kg. " "
added at t-0 and at t-7 days. "2°2 was
CP JC
\
U C6 E c o 800 700 €00 fiOO 400 300 200 100 -25 m g H 2 0 2 / k g A t - 7 d , 1 0 0 mg H 2 0 2 / k g Time [ d ] 1 DO m g H 2 0 V » ^ * 200 m g H 2 0 V K ) X t-7d.20O m g H 2 0 2 / k g18
-Figure 9. Concentration of the leached organic carbon (mg C/1) from continuous flow through columns as a function of the percolation time (h). Gasoline concentration 5% pore volume.
?60
ua
r—I \ O t > F >_> c u 0 a u c a o TJ t l r u o u c u u ? 2 0 i Ü O leo 1 0 0 1 4 0 3 2 0 1 0 0 3 0 6 0 4 0 -— -20 - j / 0 -f D flow rate 2 m l / h 2 0 0 4 0 0 percolation tiff>e [h] + fiow rale 8 m ! / h 600Figure 10. Influence of the flow on the leached organic carbon (mg C) from continuous flow through columns with 5% or 15% pore volume gasoline concentration. 0 E c D u T) f) C u o o > o 3 E D u A D 2 130 120 110 100 9 0 8 0 7 0 6 0 5 0 4 0 3 0 2 0 10 -0 ^ 9 m l / h r . 5X m l / h r . 5Jt JD j ^ ^ ^ ^ ^ ^ ^ / " ' ' ^ ^ - ' ^ ^
/X^^---/y^x*-^ ^^""'''^^^
fj/y^ y ^
/ ^ ^ ^ : 2 ^ * * ^ * ^ *
i P f ! ^ ( X )[ » X M )< )( )( > e " X Vr- X X F « = = r 1 — - T 1 1 I ) 1 \ \ 1 ' 3 4 8 12 16 20 24 Time [deys] + 7 m l / h r . 5X 0 6 m l / h r . 5X X 2 m l / h r , Wane ^ 7 m l / h r , 15Kcarbon between a column with gasoline/detergent and a column with detergent only.
200 150 100 50 50 100 --150 a BLANC •*• BRkJ 3 5 time [d] O TWEEN 80 A SLS
Figure 12. Cumulative leaching of gasoline, measured by GC-analysis (mg gasoline), as a function of the percolation time for three of the coliamns (numbers 1 to 3).
• o c 3 O a. E o D O Tl O U O o 5 0 4 0 3 0 2 0 10 -120 • Column 1 Time [ d ] Column 2 4 Column 3
20
-Figure 13. Leaching of toluene (mg/1) as a function of the percolation time for column no. 2 (nutrients addition and buffered). The latter part of the curve is shown enlarged.
<—I «I
11
P =- 9
£ f
c o Ü 120 TolueneFigure 14. Leaching of 1,3,5-trimethylbenzene (mg/1) as a function of the percolation time for column no. 2 (nutrients addition and bufferd). 1—' « V «1 ? ^ 100 120 G 1,3,5-TWB Time [ d ]
E
2 ;aerated water
Depth In column [cm] 4 3 ;addition of H202
22
-Figure 16. Nitrate concentrations in the effluent (mg N/1) of column no. 5 (nitrate as alternative electronacceptor) as a function of the percolation time. o O 1.3
V\^°
D - ^ " ^ 20 —T" 40 60 I 80 100 120 140 Time [d]m /m drain/d with a total of 1850 m /d; withdrawal: 70 m /d per pumping well. c o n t o u r of t^ie B £j"©e»pj;^uc t f tR"e"T?oqJ:aminant c r o s s s e c t i o n T . l e a k i n g g a s o l i n e tank F . g a s o l i n e pumping s t a t i o n
24
-Figure 18. I. Vertical spreading of the contamination for the cross-section A.B.B' in figure 17.
II. Set-up of infiltration, withdrawal and treatment of water.
B'
-#
1-clay loam ]_a^e^r_
100 - 1000 1000 - 2000
> 2000
leaking tank
'"''"°' '''^^7h77777m/yw/w/////j////////////y///y////w///^
clay loam layer
i n f i l t r a t i o n 1000 - 2000 >.2000 100 - 1000 (mg nasoTine/kg)