Report 340370002/2010 I. Gosens et al.
Impact of agglomeration state of gold
particles on pulmonary toxicity
RIVM Letter Report 340370002/2010
Impact of agglomeration state of gold particles on
pulmonary toxicity
I. Gosens (Environmental Health Research (MGO)), RIVM
D.L.A.C. Leseman (Environmental Health Research (MGO)), RIVM
L.J.J. de la Fonteyne (Laboratory for Health Protection Research (GBO)), RIVM D.P.K. Lankveld (Laboratory for Health Protection Research (GBO)), RIVM J.W. Geus (Biomolecular Imaging, Faculty of Science), University Utrecht J.A. Post (Biomolecular Imaging, Faculty of Science), University Utrecht E.H.J.M. Jansen (Laboratory for Health Protection Research (GBO)), RIVM A.J.F. Boere (Environmental Health Research (MGO)), RIVM
F.R. Cassee (Environmental Health Research (MGO)), RIVM
W.H. de Jong (Laboratory for Health Protection Research (GBO)), RIVM
Contact: W.H. de Jong
Laboratory for Health Protection Research (GBO) Wim.de.Jong@rivm.nl
This investigation has been performed by order and for the account of the Dutch Food and Consumer product Safety Authority (VWA), within the framework of V/340370/09/AB
© RIVM 2009
Parts of this publication may be reproduced, provided acknowledgement is given to the 'National Institute for Public Health and the Environment', along with the title and year of publication.
Abstract
Impact of agglomeration state of gold particles on pulmonary toxicity
Nanoparticle (NP) toxicity testing comes with many challenges. One of them is agglomeration/aggregation of nanoparticles in physiological media. In this study, we address the effect of agglomerated versus single particle suspensions of nanosized and submicronsized gold on the inflammatory response in the lung. Single nanoparticles may pose a greater hazard to the human body compared to nanoparticles in larger aggregates or micronsized particles, possibly due to their ability to cross barriers and by-pass the pulmonary immune system. Colloidal gold was chosen as a model particle to study effects on lung inflammatory markers in broncho alveolar lavage fluid (BALF) after intratracheal instillation in the rat. A single dose of 1 mg of spherical gold particles (stock suspensions in citrate buffer) of 50 nanometer (nm) or 250 nm is diluted either by ultrapure water or by adding phosphate buffered saline (PBS). Particles diluted in ultrapure water are well dispersed, while the citrate coating is disturbed and agglomerates are formed when diluting in PBS. A single dose of 1 mg DQ12 quartz is used as a positive control for pulmonary inflammation. Extensive characterization of the particle suspensions has been performed. Cell differential count, cell damage and inflammation were determined in BALF after 3 and 24 hours post exposure.
The primary particle size, the gold concentration in the suspensions and particle purity are important features to verify, since they may deviate from the manufacturer’s description. The 250 nm particles were smaller in size and build up from multiple smaller units, the concentration of gold was less than described and some silicium residues were found in the suspension.
There are no major differences in how the lung deals with agglomerated versus single citrate stabilized gold particles of different sizes after intratracheal instillation. Our results indicate that a suspension of single 50 nm and 250 nm gold nanoparticles as well as agglomerated 50 nm and 250 nm gold nanoparticles resulted in a very mild inflammatory response. We conclude that single nanosized gold particles do not possess a greater hazard when using pulmonary inflammation as a marker for toxicity than agglomerated gold nanoparticles.
Trefwoorden / Key words:
Rapport in het kort
Effect van agglomeratie van gouddeeltjes op ontstekingsrespons in de long
Over de toxiciteit van nanodeeltjes is nog weinig bekend. Het is niet zeker of de manier waarop normaal gesproken de toxiciteit van stoffen wordt bepaald wel gebruikt kan worden bij onderzoek naar toxiciteit van nanodeeltjes. In deze studie wordt gekeken welke eigenschappen van nanodeeltjes van invloed zijn op het optreden van een biologische response. Deeltjes in aggregaten zouden andere effecten in de long kunnen geven dan losse deeltjes. Blootstelling aan nanodeeltjes in een "real-life" situatie zou kunnen bestaan uit losse ingeademde deeltjes, maar ook uit aggregaten. Omdat inhalatie op de werkplek mogelijk een belangrijke blootstellingsroute is bij de productie van nanodeeltjes, worden de deeltjes aan de long toegediend. Intratracheale instillatie in de rat is een goed en geaccepteerd model om de effecten van stoffen in de longen te bepalen. Een eenmalige dosering van 1 mg van 50 nanometer (nm) en 250 nm deeltjes in geagglomereerde toestand of als losse deeltjes zijn toegediend.
Uitgebreide deeltjeskarakterisatie laat zien dat de concentratie van de oplossing, de afmeting van de primaire deeltjes en de zuiverheid van de deeltjes kan verschillen met de informatie van de fabrikant. De goudconcentratie was de helft van de aangeven hoeveelheid, de 250 nm deeltjes zijn opgebouwd uit meerdere kleine deeltjes en hebben een afmeting van 210 nm. Beide deeltjessuspensies bevatten sporen silicium.
Er zijn geen verschillen in de ontstekingsrespons in de long na toediening van losse deeltjes of aggregaten. Zowel de losse 50 nm en 250 nm deeltjes, als de geagglomereerde 50 nm en 250 nm gouddeeltjes induceren een zeer geringe ontstekingsreactie in de long na intratracheale toediening. Het onderzoek geeft aan dat de kleinere nanogoud deeltjes in de long geen hoger risico vormen dan de grotere geagglomereerde (nano)deeltjes.
Trefwoorden / Key words:
Contents
1 INTRODUCTION 7
2 MATERIALS AND METHODS 9
2.1 Animals 9
2.2 Experimental set-up 9
2.3 Characterization of gold particles and quartz 10
2.3.1 Particle solutions 10
2.3.2 Concentration measurement gold stock solutions 10
2.3.3 Size distribution of gold particles 10
2.3.4 Transmission electron microscopy (TEM) analysis of gold particles 10
2.4 Biological effect markers 11
2.4.1 BALF 11
2.4.2 Lung pathology 11
2.4.3 Blood markers 11
2.4.4 Statistics 11
3 RESULTS 13
3.1 Characterization and quality control of particles 13
3.2 Biological response 15
3.2.1 Parameters in BALF 15
3.2.2 Parameters in blood 18
4 DISCUSSION 19
4.1 Particle preparation and characterization 19
4.2 Biological effects 19
5 SUMMARY 22
6 ACKNOWLEDGEMENTS 23
1
INTRODUCTION
The small size and subsequent relative increase in surface area-to-volume ratios of nanoparticles result in special and desired properties for which they are currently engineered. It is likely that this also renders nanoparticles to be more biologically active leading to unexpected and aberrant effects upon interaction with biological systems compared to sub-micronsized particles. In order to perform risk assessment of possible negative health effects of nanoparticles, the special characteristics of NPs, like size, shape, surface area, surface chemistry, surface charge, solubility, purity and agglomeration state and how this influences their toxicity need to be taken into account (Dhawan et al., 2008).
In this study, the focus is on agglomeration state of particles of two different sizes and whether this could influence the biological response in the lung. Agglomeration is a basic property of nanoparticles to reduce their surface free energy by increasing their size and decreasing their surface area. Agglomeration of nanoparticles is due to adhesion of particles to each by weak forces leading to (sub)micronsized entities. In contrast, nanoparticle aggregates are due to the formation of covalent or metallic bonds that cannot be easily disrupted. Both agglomeration and aggregation raise questions how to address the evaluation of safety of NPs when they are no longer in nano range, but are present in larger entities (Balbus et al., 2007). It is not known whether or not agglomerated particles could become single particles again when introduced in a biological system or if single particles have the ability to form agglomerates in a biological matrix. From a toxicological perspective, it is important to determine how the human body deals with single nanoparticles compared to agglomerates. Also the primary size of the particle (nanosized versus submicronsized) could result in different biological responses. It is currently thought that single nanoparticles could pose a greater hazard to the human body compared to larger particles due to their ability to translocate across barriers and possibly to by-pass the pulmonary immune system. The impact of agglomeration state of particles on these effects is not well known.
In the workplace, inhalation of engineered nanoparticles is a realistic exposure scenario. These nanoparticles could exist in the form of single particles as well as agglomerates. Therefore, in this study we determine how the agglomeration state of 50 nm and 250 nm particles influences pulmonary toxicity in the rat. The particles are administered to the lung via intratracheal instillation. This method of delivery was chosen over the physiological route of exposure via inhalation based on the possibility to administer particle solutions containing single particles versus agglomerates, more exact dosing, reduction of costs as well as less complexity in exposure of the animals. Intratracheal instillation is a widely accepted alternative for delivery of particles to the lung (Henderson et al., 1995;Donaldson and Borm, 2007).
Colloidal gold particles with a citrate coating of 50 nm and 250 nm were chosen as model particles to study effects on pulmonary toxicity, since they can be synthesized with a narrow size distribution as stable suspensions. Gold particles have also been used to determine the fate as a function of size after different exposure routes. How agglomeration state will influence this, is not known. In most studies, particles in agglomerated state or partly single/partly agglomerated particles have been administered via intravenous injection, intratracheal instillation and inhalation. After inhalation of nanogold particles (30-110 nm), particles translocate from the lung to other organs (Yu et al., 2007). After intravenous injection (de Jong et al., 2008) and intratracheal instillation (Semmler-Behnke et al., 2008), smaller sized particles (10 nm versus 250 nm and 1.4nm Au55 cluster versus 18 nm, respectively) have the ability to reach more distal regions of the body compared to their larger counterparts.
Here, a single dose of 1 mg of spherical gold particles of 50 nm or 250 nm are instilled in the lung after diluting either by ultrapure water or by adding 10x phosphate buffered saline (PBS). Particles diluted in ultrapure water are well dispersed and continue to exist as single particles, while diluting with 10x PBS disturbs the citrate shell and agglomerates have been formed. The effect of agglomeration state of 50 and 250 nm gold particles on the inflammatory response in the lung has been determined 3 and 24 hours post exposure.
2
MATERIALS AND METHODS
2.1
Animals
Male WU Wistar-derived rats, around 8 weeks of age and around 250 grams of body weight were obtained from Harlan, The Netherlands. Animals were bred under SPF conditions and kept barrier maintained during the experiment. Conventional feed (Special Diets Services) and tap water were provided ad libitum. Husbandry conditions were maintained according to all applicable provisions of the national law: Experiments on Animals Act. The experiment was approved by an independent ethical committee prior to the study.
2.2
Experimental set-up
A single dose of 1 mg per rat (4 mg/kg body weight) in 0.5 ml of 50 nm or 250 nm gold particles was set to be delivered in the rat lung by intratracheal instillation.
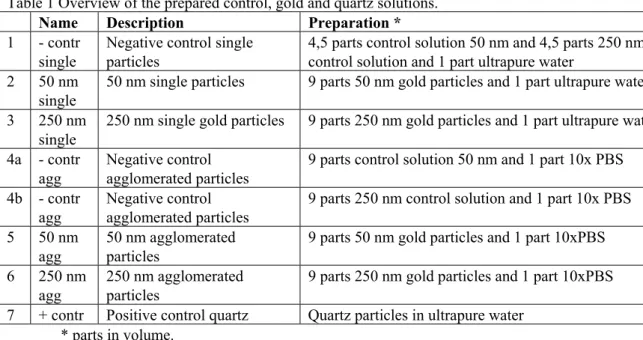
The 50 nm and 250 nm gold suspensions (BBI International, UK) were custom prepared at a supposed concentration of 2 mg/ml. Control solutions containing the same trace elements and reagents except the 50 and 250 nm gold particles were purchased as well from BBI International. Particle and control solutions were diluted according to the following table.
Table 1 Overview of the prepared control, gold and quartz solutions.
Name Description Preparation *
1 - contr
single
Negative control single particles
4,5 parts control solution 50 nm and 4,5 parts 250 nm control solution and 1 part ultrapure water
2 50 nm
single
50 nm single particles 9 parts 50 nm gold particles and 1 part ultrapure water
3 250 nm
single
250 nm single gold particles 9 parts 250 nm gold particles and 1 part ultrapure water
4a - contr agg
Negative control agglomerated particles
9 parts control solution 50 nm and 1 part 10x PBS
4b - contr agg
Negative control agglomerated particles
9 parts 250 nm control solution and 1 part 10x PBS
5 50 nm
agg
50 nm agglomerated particles
9 parts 50 nm gold particles and 1 part 10xPBS
6 250 nm
agg
250 nm agglomerated particles
9 parts 250 nm gold particles and 1 part 10xPBS
7 + contr Positive control quartz Quartz particles in ultrapure water * parts in volume.
The control solutions 4a and 4b were each given to three animals and gave similar results in the biological response assays. Therefore, for the remainder of the report, the average value of control 4a and b together is used.
Quartz (DQ12, cristalline silica) (gift from Dr. R. Schins, Institut für Umweltmedizinische Forschung, Düsseldorf, Germany) was used as a positive control and was dissolved in ultrapure water.
A single dose of 405 µg/rat was delivered. All solutions were sonicated for 5 minutes in an ultrasonic water bath prior to administration to the animals.
Animals were treated and sacrificed at 3 h or 24 h after administration of the particles, and bronchoalveolar lavage fluid (BALF), blood and lung tissue were collected. The number of animals investigated was per group was 6, except for the quartz group (n=3) and control 4a (n=3) and control 4b (n=3).
2.3
Characterization of gold particles and quartz
2.3.1 Particle solutions
Gold particles of 50 nm (batch# 12663) and 250 nm (batch# 12665) particles were purchased in sterile bottles and contained besides colloidal gold with a citrate shell, trace elements of substances used during synthesis. Control solutions for both the 50 nm (batch# 12664) and 250 nm (batch# 12666) solutions were prepared from the colloid solution minus the gold particles. Endotoxin levels of the gold solutions of 50 and 250 nm were determined in a LAL assay and there were no detectable levels (0 IU/ml). 10x PBS solution and ultrapure water were sterilized before preparing the gold particle and control solutions.
The pH of the 50 and 250 nm solutions and control solutions were measured using indicator strips in the range of pH 1-10 and 6.4-8.0 (Merck). The zetapotential (Zetasizer, Malvern Instruments, UK) was determined in a triplicate measurement of a 20 µg/ml sample diluted with 1 part ultrapure water of 10x PBS. The samples were first diluted with either ultrapure water or 10x PBS and then further diluted to the desired concentration using ultrapure water.
Prior to preparing the quartz solutions, DQ12 was baked at 220 °C for 3 hrs to inactivate possible endotoxin on the particle surface.
2.3.2 Concentration measurement gold stock solutions
The concentration of gold in the commercial available solutions was determined by Inductively Coupled Plasma-Mass Spectrometry (ICP-MS) by MiPlaza Materials Analysis, Philips, Eindhoven. Three independent samples were digested with aqua regia in a heating block system.
2.3.3 Size distribution of gold particles
The size distribution of the 50 nm and 250 nm gold particles directly after preparing the suspensions for intratracheal instillation were determined using laser light scattering with a NanoSight apparatus (NanoSight Ltd, UK).
2.3.4 Transmission electron microscopy (TEM) analysis of gold particles
A Tecnai 20F electron microscope equipped with a field-emission gun operated at 200 kV was employed to investigate the structure and the chemical composition of the gold particles with diameters of 50 and 250 nm. Samples were prepared by putting a drop of the suspension of the gold particles on a holey carbon film applied on a copper grid placed on filter paper. The gold particles were present well dispersed on the carbon film. Images were taken using conventional transmission electron microscopy (TEM) and scanning transmission electron microscopy (STEM) with a high-angle annular dark-field (HAADF) (Williams, 1996) and a secondary electron detector. STEM enabled us to execute elemental analysis by energy-dispersive X-ray (EDX) analysis at predefined spots. To assess the crystallographic structure of the gold particles, selected area electron diffraction and lattice imaging were performed.
2.4
Biological effect markers
At 3 and 24 hrs after intratracheal administration, rats were anesthetized via i.p. injection with a mixture of ketamine/Rompun and sacrificed by exsanguination via the abdominal aorta. The lungs were perfused with saline to remove all the blood in the tissue. After ligation of the left bronchus, the right lung was lavaged (three in-and-out lavages with the same fluid) with a volume of saline corresponding to 27 ml/kg of body weight at 37° to obtain bronchoalveolar lavage fluid (BALF). The left lung was quickly frozen in liquid nitrogen for RNA analysis if desired at a later stage.
2.4.1 BALF
BALF was analyzed for the following parameters: cell counts (Coulter counter), cell differential count, TEM analysis of particles in lung cells, monocyte chemotactic protein -1 (MCP-1, Invitrogen), tumor necrosis factor α (TNF-α, Arcus Biologicals), interleukin-6 (IL-6, Demeditec Diagnostics),
macrophage inflammatory protein -2 (MIP-2, Arcus Biologicals) and interleukin 1 beta (IL-1β). Lactate dehydrogenase (LDH), alkaline phosphatase (ALP), albumin and total protein were measured using an autoanalyser (LX20-Pro, Beckman-Coulter, Woerden, the Netherlands) using kits from the same manufacturer.
TEM analysis to visualize particle interactions with cells were performed at the Dept. Biomolecular Imaging, Science Faculty, Utrecht University.
Cell pellets of the bronchoalveolar lavage fluid (BALF) were pooled per exposure group and fixed in 2% glutaraldehyde in cacodylatebuffer (pH 7.2-7.2), supplemented with 0.025 mM CaCl2 and 0.05 mM MgCl2. The cells were embedded in gelatin, which was allowed to solidify to obtain “cell-tissue-blocks”. These blocks were fixed in 4% PFA, and postfixed with OsO4 and KFeCN, dehydrated with the use of ethanol and embedded in Epon. Ultra thin sections were made, post stained with leadcitrate and uranylacetate en examined in a FEI Tecnai 12.
2.4.2 Lung pathology
The left lungs are fixed in formaldehyde. If needed in a later stage, these lungs could be analyzed.
2.4.3 Blood markers
EDTA blood was used to determine the total number of cells and cell differential count. In citrate plasma, protein levels of van Willebrand factor (vWF, American Diagnostica), fibrinogen (Genway) and C-reactive protein (CRP, Helica Biosystems) were determined.
2.4.4 Statistics
The data were analyzed by analysis of variance (ANOVA single factor) and where appropriate by a Bonferroni post-hoc analysis (Graphpad Prism). Statistical significance is indicated with a * (P value < 0.05). In all graphs, error bars represent the standard deviation of the mean.
3
RESULTS
3.1
Characterization and quality control of particles
The 50 nm and 250 nm gold particles with a citrate shell for stabilization were custom prepared (figure 1A). Diluting the 50 nm particle solution using ultrapure water did not result in a color change, which indicates that the citrate shell that protects these particles from clumping together remains stabilized. However, diluting the 50 nm particles using 1 part 10x PBS did resulted in a color change from red (figure 1B) to blue (figure 1C) indicating the formation of agglomerates (de Jong et al., 2008). The 50 nm particles in this dilution remained in suspension for approximately 5 minutes. Then particles started to clump together and ended up as a large aggregate of gold at the bottom of the tube with a clearer solution on top (figure 1D). The clump of gold could no longer be brought back into a homogeneous suspension by sonication. This effect was not observed for any other particle dilution that has been prepared. Therefore, 50 nm and 250 nm particles were mixed with PBS just before instillation to avoid this aggregation effect.
Figure 1: Gold particle solution. A: 50 nm gold particles (left) and 250 nm gold particles (right) were purchased. B: 50 nm gold particle solution before diluting using 10x PBS. C: 9 parts 50 nm gold particle solution after diluting using 1 part 10x PBS. D: 50 nm gold aggregate formation, 5 minutes after diluting with 10xPBS.
Using laser light scattering (table 2) as well as TEM (figure 2), the particle size of the 50 nm particles was confirmed at 50 nm, while the 250 nm particles appear to be smaller (200 nm using laser light scattering and 210 nm using TEM) (table 2 and figure 2).
D
A
D
C
B
Figure 2: TEM A: 50 nm particle, B: 250 nm particles consisting of three smaller entities, C: 250 nm
The gold particles of 50 nm appeared to be monocrystalline; the diffraction maxima and the lattice images point to pure gold. The gold particles of 250 nm consisted of two or three smaller monocrystalline particles (data not shown). Accordingly the composite particles do not exhibit a monocrystalline diffraction pattern and a spherical or facetted shape as the 50 nm particles. Some groups of three particles not intimately connected were found as well as fractured particles that had no symmetrical shape (figure 2). The secondary electron images demonstrated the individual particles of a conglomerate to be well facetted (data not shown). The HAADF images of both the 50 and the 250 nm particles showed the presence of areas containing carbon and oxygen on which some silicon containing areas were present (data not shown). The carbon and oxygen may be due to the presence of citrates.
Table 2. Average particle size and mean size distribution (laser light scattering) and zetapotential
average particle size ± sd average mean size ± sd zetapotential (mV) ± sd
50 nm gold single 54 ± 3 61 ± 3 -56 ± 0,42
50 nm gold agg 114 ± 73 199 ± 88 -54 ± 1,01
250 nm gold single 197.5 ± 7 197 ± 12 -53 ± 0,53
250 nm gold agg 762 ± 762 766 ± 766 -61 ± 0,98
Diluting the 50 nm and 250 nm particles with ultrapure water ensured that the particles remained in solution as single particles, since the average particle size as measured using laser light scattering (Nanosight) is around 50 nm and 200 nm, respectively (table 2). The mean size of both 50 nm and 250 nm single particles are close to the average particle size which indicates that the particles are in a single distribution peak. For agglomerated 50 and 250 nm particles, the particle size distribution was determined within 5 minutes after diluting using 10x PBS. The particle size distribution could still be measured before aggregates were formed, but the high standard deviation of both parameters show that there are agglomerates present of different sizes (table 2).
All solutions are electrically stabilized based on zetapotentials (between ±40 and ±60) for single particles solutions as well as agglomerates (table 2). The 250 nm agglomerate even shows excellent stability, although agglomerates are formed based on laser light scattering measurements.
The pH measurement of the 50 nm and 250 nm gold particle solution as well as the control solutions indicate that they are in the physiological range (table 3).
Table 3. pH of gold and control solutions (without gold particles)
pH 50 nm gold 6.4 250 nm gold 6.4 50 nm control solution 6.7-7.0
B C
A
Gold particle characteristics such as concentration, intended dose, delivered dose and particle size are summarized in table 4.
Table 4. Gold particles characteristics
50 nm particles 250 nm particles
Concentration (provided by BBI International)
2 mg/ml 2 mg/ml
Concentration (measured at MiPlaza, Philips)
0.9 ± 0.02 mg/ml 1.1 ± 0.02 mg/ml
Intended dose 1 mg/rat, 4 mg/kg bw 1 mg/rat, 4 mg/kg bw
Administered dose 405 µg/rat, 1.6 mg/kg bw 405 µg/rat, 1.6 mg/kg bw
Particle size (provided by BBI International)
50.8 nm 252.3 nm
Particle size (TEM) +/- 50 nm +/- 210 nm
Surface area particle (nm2) 7850 214337
Administered number of particles 200 E+9 1.6 E+09
Administered surface area (cm2) 16 4.2
The administered dose was lower than the intended dose, since the gold concentration in the purchased gold solutions was lower than expected (table 4).
3.2
Biological response
3.2.1 Parameters in BALF
Three hours and 24 hours after instillation several parameters are determined in the BALF. In table 5, an increase or a decrease compared to the negative control are represented by an upward and downward arrow, respectively. The effect is compared to either the corresponding control (PBS for agglomerates) or to water as general control. All tables are a summary of the findings in the figures in the appendix.
Table 5. Total cell numbers and cell numbers of cell differential count in BALF
BAL Total cell Macroph. Neutroph. Eosinoph. Lymphoc. monocytes - contr single - - - 50 nm single - - 24 hrs - - - 250 nm single - - 24 hrs - - - - cont agg 3 hrs 3 hrs - - - 50 nm agg - - - 250 nm agg 24 hrs 24 hrs - quartz 3 hrs 24 hrs 3 hrs 24 hrs - - -
Grey arrows indicate a non significant trend towards an effect. Black arrows indicate a statistically significant effect.
Three hours after instillation of the negative control solution for agglomerates, a trend in cellular increase was observed accompanied with a significant increase in macrophages when compared to the negative control for single particles. This effect was not expected, since no particles are instilled and this effect is not seen with the same control solutions diluted in ultrapure water.
Single 50 nm and 250 nm particles give a trend towards an increase in neutrophils. If a non-parametric post-hoc test is applied, the effect is significant for the 250 nm particles. This is due to the fact that 50% of the animals give a response and the other half does not respond and shows similar cell numbers as the control. Agglomerated 250 nm particles give a trend towards an increase in total cell numbers and the number of macrophages. The positive control quartz gives a response as expected namely an increase in total cell numbers and macrophages at 3 hours and an increase in total cell numbers and neutrophils at 24 hours (Appendix, figure 1 and 2).
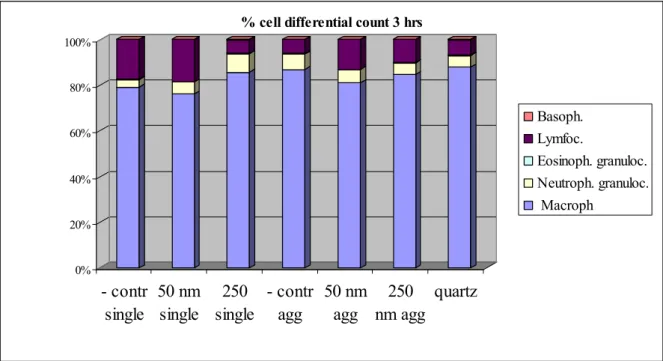
Differences in cell differential count in the BALF after instillation of the gold nanoparticles are compared to the control at 3 hours (Appendix, figure 3) and 24 hours (table 5 and Appendix figure 4) after instillation. There are no differences in the percentage of cell differential count 3 hrs after instillation. Instillation of single 50 nm, single 250 nm and agglomerated 50 nm gold particles showed a trend towards an increase of neutrophils and decrease of macrophages. After quartz instillation, there is a clear and significant influx of neutrophils, as expected.
In table 7, inflammatory markers in the BALF are summarized (Appendix, figure 5,6,7,8 and 9).
Table 7. Inflammation markers in BALF
BAL MCP-1 IL-1beta IL-6 TNF-α MIP-2
-contr single - - - 50 nm single - - - 250 nm single - - 24 hrs 3 hrs 24 hrs - - contr agg - - - 3 hrs 24 hrs 3 hrs 50 nm agg - - - 3 hrs 3 hrs 250 nm agg - - - - 3 hrs Quartz 24 hrs - - - 3 hrs 24 hrs
Grey arrows indicate a non significant trend towards an effect. Black arrows indicate a statistically significant effect.
No significant differences are found in IL-1beta and IL-6 levels after instillation of particles in BALF. TNF-alpha is elevated in control agglomerates versus control single, which is not expected. This effect is seen with other parameters like MIP-2 as well and has disappeared after 24 hrs. A trend towards an increase in TNF-alpha levels is seen after instillation of 250 nm single particles, but not with agglomerates of the same size after 3 and 24 hrs. This corresponds to the trend of neutrophils increase after 24 hours. There is a trend towards an increase in MCP-1 levels 24 hours after quartz instillation,
Damage markers like lactate dehydrogenase (LDH), alkaline phosphatase (ALP), albumin and total protein were determined in BALF (table 8 and Appendix figure 10, 11, 12 and 13).
Table 8. Damage markers in BALF
BAL LDH ALP albumine protein
- contr single - - - - 50 nm single - - - - 250 nm single - 3 hrs - - - cont agg - - - - 50 nm agg - 3 hrs - - 250 nm agg - - - - quartz 24 hrs 3 hrs 24hrs 24 hrs 24 hrs
Grey arrows indicate a non significant trend towards an effect. Black arrows indicate a statistically significant effect.
Increase ALP activity in BALF has been associated with type II epithelial cell damage (Cobben et al., 1999). Changes in ALP activity after gold instillations are found when compared with the corresponding control group (table 8 and Appendix figure 11). A significant decrease in ALP activity is seen 3 hours after instilling 250 nm single gold particles and quartz. The agglomerated 50 nm particles give an increase in ALP activity after 3 hours. Quartz at 1.6 mg/kg bw results in cellular damage as can be seen by an increase in LDH, ALP, albumine and protein after 24 hours.
Transmission electron microscopy images show that 50 nm whether in agglomerated state or as single particles are taken up by alveolar macrophages (figure 3). From a previous study we have seen uptake of 220 nm particles by macrophages as well (data not shown),
50 nm
A
A’
1 µm Figure 3. TEM images of inflammatory cells in BALF. A: 50 nm single particles, A’: inset
3.2.2 Parameters in blood
No significant differences have been detected in number of cells and differentiation of cells in blood samples from exposed and control exposed animals (data not shown). Furthermore, fibrinogen, von Willebrand factor, CRP and IL-6 are determined (table 9 and Appendix figure 14, 15, 16 and 17).
Table 9. Inflammatory markers in blood
Blood Fibrinogen vWF CRP IL-6
- contr single - - - - 50 nm single - - 3 hrs - 250 nm single 24 hrs - 3 hrs - - cont agg 3 hrs 24 hrs - 3 hrs - 50 nm agg 24 hrs - 3 hrs - 250 nm agg - - 3 hrs - quartz - - 3 hrs -
Grey arrows indicate a non significant trend towards an effect. Black arrows indicate a statistically significant effect.
Single 250 nm particles give an increase in fibrinogen as well as CRP compared to control. CRP levels are elevated after instillation of single 50 nm particles compared to control. Since fibrinogen and CRP levels are elevated in the negative control for agglomeration, there is no significant increase after administration of agglomerated particles when compared to – control agglomerated. However, if agglomerated particles are compared to the negative control of single particles, there is an increase.This is expressed in the table as a trend to an increase. Quartz particles induces a significant increase in CRP levels in the blood.
4
DISCUSSION
4.1
Particle preparation and characterization
Both the difference in size as well as the agglomeration state of citrate stabilized gold particles of 50 nm and 250 nm and the subsequent effect on the biological response in the lung has been determined. To obtain single particles and agglomerated particles, gold suspension have been diluted with either ultrapure water (suspension remains stable) or 10x PBS (agglomerates are formed). Agglomerates were indeed formed indicated by the color change of the 50 nm gold solution and the size distribution measurements of the 50 and 250 nm particles. Particle agglomerates are held together by weak forces such as van der Waals forces, electrostatic interactions or surface tension. After 5 minutes, agglomerated 50 nm particles formed a large aggregate that could not be brought into suspension using e.g. sonication indicating that the particles were held together with stronger covalent or metallic bonds. Due to a lower concentration of gold in the stock solutions as provided by the supplier, the instilled dose of gold particles turned out to be lower than the 4 mg/kg body weight that was intended and is 1.6 mg/kg bw. As a result, the total instilled surface area was also lower than initially calculated.
Extensive characterization of the particles revealed that the size of the 50 nm particles corresponds to the manufacturer’s description. The 250 nm particles turn out to be smaller and build up from smaller particles. The 50 nm particles were monocrystalline. In both suspensions there is a contamination with silicium, most likely in the form of SiO2.
4.2
Biological effects
Size is an important denominator in how the body responds to, distributes and eliminates material. Particle size determines the accessibility of target organs, the mode of cellular uptake, endocytosis and efficiency of particle processing in the endocytic pathway. For non-phagocytic cells it is known that particles <200nm are taken up via clathrin coated pits. Particles >200 nm, but <1 µm enter cells preferentially along the pathway of caveolae-mediated endocytosis (Rejman et al., 2004). Phagocytic cells, like alveolar macrophages, phagocytose spherical particles of 1-2 µm most effectively and uptake was seen up to 5 µm (Tabata and Ikada, 1988). Our previous unpublished study and these results here show that 50 nm as well as micronsized particles of +/- 200 nm are taken up by alveolar macrophages.
Agglomeration state of particles influences the size of the object that has to be cleared from the body. Here, we determined if the lung deals with agglomerated gold particles differently compared to single particles and if this results in different biological effects.
The control solution for agglomerated particles gives a biological response 3 hours after instillation that was not expected. Total number of cells, total number of macrophages and neutrophils, TNF-alpha and MIP-2 are elevated compared to the negative control for single particles, and this effect is subdued after 24 hours. This acute and transient effect seems to be caused by an interaction between the control solution in combination with PBS, since the control solution with ultrapure water as well as PBS alone (non published data from previous studies) do not yield this kind of effect. This mask effects of the agglomerated particles at 3 hrs, since they are compared to these unclear effects of the control. If the effects of agglomerated particles are compared with the negative control for single particles or PBS alone from previous studies, then there is a mild effect of agglomerated particles on TNF-α, acute phase proteins and cell damage (marked with a grey arrow in the tables).
The overall findings for the gold particles based on the BAL and blood markers are summarized in table 10.
Table 10. Overview significant changes and trends after gold instillation
Local pulmonary effects Systemic effects
Inflammatory cells Cytokines Cell
damage
Acute phase proteins
Cells Macro- phages
Neutrophils IL-6 TNF-α ALP Fibrinogen CRP
50 nm single - - - - - 250 nm single - - 50 nm agg - - - - 250 nm agg - - - - - quartz
Grey arrows indicate a non significant trend towards an effect. Black arrows indicate a statistically significant effect.
50 nm single versus 50 nm agglomerated:
- 50 nm single gold particles did not result a clear inflammatory response. Only a trend for an increase in neutrophils was seen. Instillation of agglomerated 50 nm particles result in increased TNF-alpha and ALP, and a trend for CRP and fibrinogen levels, while for the 50 nm particles only an increase for CRP was observed..
250 nm single versus 250 nm agglomerated
- Single 250 nm particles give a trend towards an increase in the number of neutrophils . This is accompanied by an increase in.TNF-alpha levels compared to agglomerated 250 nm particles 3 hrs after instillation TNF-α is mainly produced by macrophages and it has a number of actions on various organ systems, such as stimulation of phagocytosis by macrophages. It generally works together with IL-1 (no effect) and IL-6 (trend towards increase). It promotes the inflammatory response by attracting neutrophils. After systemic availability of TNF-α, the liver is stimulated to produce acute phase proteins like C-reactive protein and fibrinogen which are significantly increased after instillation of 250 nm particles. For agglomerated particles a trend towards an increase in number of macrophages and an increase in CRP, while 250 nm single particles induced a significant increase in CRP..
50 nm versus 250 nm particles
- A significant increase in CRP and fibrinogen is found for 250 nm single gold particles. For single 50 nm particles there is increase in CRP as well, although the effect is less compared to 250 nm particles.
- Single 50 and 250 nm particles give a trend to a mild inflammatory response as indicated by an increase in neutrophils, and a significant acute phase protein expression. For 250 nm particles also a trend was seen for the production of inflammatory cytokines in the BALF which was not observed for the 50 nm particles.
From the results presented here, the positive control quartz gives a significant inflammatory response characterized by an increase in total cell number accompanied by an influx of neutrophils, increased levels of pro-inflammatory cytokine MIP-2 and cell damage as expected (Duffin et al., 2001). Compared to the positive control quartz, single 50 nm and 250 nm citrate stabilized gold particles as well as agglomerated counterparts do not exert major toxic effects in the lung. However, it might be that higher dosages do induce a more overt inflammatory reaction.as in our study the dose administered was limited due to the concentration of gold in the suspensions used.
Our results do indicate that there are no major differences in how the lung deals with agglomerated citrate stabilized gold nanoparticles of different sizes after intratracheal instillation. There are indications that the 50 nm and 250 nm gold nano particles induce a minimal biological response based on inflammatory parameters. This is mainly indicated by a non significant increase in neutrophils in the BALF. In addition, for all types of nanogold particles an increase in systemic CRP was observed at three hours after intratracheal administration. Our results indicate that single nanosized gold particles do not pose a greater hazard after inhalation in the lung than agglomerated gold nanoparticles.
5
SUMMARY
Compared to the positive control quartz, the inflammatory response of gold particles is rather minimal. Whereas gold particles are taken up by macrophages, both single and agglomerated 50 nm and 250 nm particles generate a mild inflammatory reaction as indicated by a trend for an increase in inflammatory cells, cytokine production or acute phase protein expression.
Extensive particle characterization reveals that primary particle size, concentration of gold and particle purity are important features to check, since these characteristics may deviate from the manufacturer’s description. The hypothesis was that the lung might deal differently with agglomerated and single citrate stabilized gold nanoparticles of different sizes after intratracheal instillation, but there seem to be no major differences. Our results indicate that there are no major differences in how the lung deals with agglomerated versus single citrate stabilized gold particles of different sizes after intratracheal instillation. A suspension of single 50 nm and 250 nm gold nanoparticles as well as agglomerated 50 nm and 250 nm gold nanoparticles resulted in a very mild inflammatory response. We conclude that single nanosized gold particles do not possess a greater hazard when using pulmonary inflammation as a marker for toxicity than agglomerated gold nanoparticles.
6
ACKNOWLEDGEMENTS
We would like to thank J. Quik for excellent assistance on zetapotential measurements and P. Krystek for gold concentration measurements.
7
APPENDIX
total number of cells 3 hrs
0,000 0,200 0,400 0,600 0,800 1,000 1,200 1,400
cellconc. Macroph Neutroph. Eosinoph. Lymphoc. Basoph.
cel lc on cen tr at io n ( 10 E 6/ m l) - contr single 50 nm single 250 nm single - contr agg 50 nm agg 250 nm agg quartz
total number of cells 24 hrs
0,000 0,500 1,000 1,500 2,000 2,500 3,000 3,500 4,000 4,500 5,000
cellconc. Macro- Neutrof. Eosinof. Lymfoc. Basof.
cel co nc en tra ti on (1 0E 6/ m l - contr single 50 nm single 250 nm single - contr agg 50 nm agg 250 nm agg quartz * *
Figure 1: Total number of cells corrected for the recovery of the BALF 3 hrs after instillation. * P<0.05 compared to control.
Figure 2: Total number of cells corrected for the recovery of the BALF 24 hrs after instillation. **
* *
0% 20% 40% 60% 80% 100%
- contr
single
50 nm
single
250
single
- contr
agg
50 nm
agg
250
nm agg
quartz
% cell differential count 3 hrsBasoph. Lymfoc. Eosinoph. granuloc. Neutroph. granuloc. Macroph 0% 20% 40% 60% 80% 100% - contr single 50 nm single 250 nm single - contr agg 50 nm agg 250 nm agg quartz
% cell differential count 24 hrs
Basoph. Lymfoc.
Eosinoph. granuloc. Neutroph. granuloc. Macroph
Figure 3: Percentage of cell differential count in the BALF 3 hrs after instillation.
MCP-1 0 50 100 150 200 250
- contr
single
50 nm
single
250 nm
single
- contr
agg
50 nm
agg
250 nm
agg
quartz
M C P -1 ( pg/ m L ) 3hrs 24hrsFigure 5: MCP-1 in BALF, 3 and 24 hours after instillation. There are no significant differences.
IL-1beta
0 10 20 30 40 50 60 70 80 90 100- contr
single
50nm
single
250nm
single
- contr
agg
50nm
agg.
250nm
agg.
quartz
IL -1 b et a (p g/ ml ) 3 hrs 24 hrs IL-6 BALF 0 200 400 600 800 1000 1200 1400 1600 1800 2000- contr
single
50nm
single
250nm
single
- contr
agg
50nm
agg
250nm
agg
quartz
IL-6 (p g/ m L ) 3hrs 24hrsFigure 6: IL-1beta in BALF, 3 and 24 hours after instillation. There are no significant differences.
TNF-alpha
0 5 10 15 20 25 30 35- contr
single
50 nm
single
250 nm
single
- contr
agg
50nm
agg
250nm
agg
quartz
T N F -al ph a ( p g/ m l) 3 hrs 24 hrsMIP-2
0 500 1000 1500 2000 2500 3000- contr
single
50nm
single
250nm
single
- contr
agg
50nm
agg
250nm
agg
quartz
MI P -2 ( p g/ m l) 3 hrs 24 hrs * * * * *Figure 8: TNF-alpha in BALF 3 and 24 hrs after instillation. * P< 0.05 compared to control single.
LDH 0 100 200 300 400 500 600 700 800 900 - contr single 50 nm single 250 nm single - contr agg 50 nm agg 250 nm agg quartz LDH (IU /m l) t=3 hours t=24 hours 0 20 40 60 80 100 120 - contr single 50 nm single 250 nm single - contr agg 50 nm agg 250 nm agg quartz AL P ( IU /ml ) t=3 hours t=24 hours *
Figure 10: LDH in BALF 3 and 24 hrs after instillation. * P< 0.05 compared to control. ALP * # *** *
Figure 11: ALP activity in BALF, 3 and 24 hours after instillation. * P< 0.05 compared to – control single. # P< 0.05 versus control agglomerated. ** P< 0.05 50
Albumin in BAL
0 100 200 300 400 500 600 700 800 900- contr
single
50 nm
single
250 nm
single
- contr
agg
50 nm
aggr
250 nm
aggr
quartz
A
lbum
in (
m
g/
L
T = 3hrs T = 24hrsProtein in BAL
0 200 400 600 800 1000 1200 1400 - contr single 50 nm single 250 nm single - contr agg 50 nm aggr 250 nm aggr quartz Pr ot ei n ( m g/ L ) T = 3hrs T = 24hrs Figure 12: Albumin in BALF 3 and 24 hrs after instillation. There are no significant differences.Fibrinogen
0 1 2 3 4 5 6 7 8 9- ctrl
single
50nm
single
250nm
single
- ctrl
agg
50nm
agg
250 nm
agg
Quartz
Fi br inogen ( m g/ m L 3hrs 24hrs * * * 0 50 100 150 200 250 300 350 400 450 - contr single 50 nm single 250 nm single - contr agg 50 nm agg 250 nm agg quartz vW F (m U /m l 3 hrs 24 hrs *Figure 14: Fibrinogen in citrate plasma, 3 and 24 hours after instillation. * P<0.05 compared to control single.
CRP
0 100 200 300 400 500 600 700 800- contr
single
50 nm
single
250 nm
single
- contr
agg
50 nm
agg
250 nm
agg
quartz
CRP ( ug /m L ) 3hrs 24hrsIL-6 serum
0 20 40 60 80 100 120 140 160- contr
single
50 nm
single
250 nm
single
- contr
agg
50 nm
agg
250 nm
agg
quartz
IL -6 (p g/ m L ) 3hrs 24hrs * * * * *** *Figure 16: CRP in citrate plasma, 3 and 24 hours after instillation. * P<0.05 compared to - control single. ** P<0.05 between 50 nm single and agglomerated.
References
1. Balbus, J.M., A.D.Maynard, V.L.Colvin, V.Castranova, G.P.Daston, R.A.Denison, K.L.Dreher,
P.L.Goering, A.M.Goldberg, K.M.Kulinowski, N.A.Monteiro Riviere, G.Oberdorster, G.S.Omenn,
K.E.Pinkerton, K.S.Ramos, K.M.Rest, J.B.Sass, E.K.Silbergeld, and B.A.Wong. 2007. Meeting
report: hazard assessment for nanoparticles-report from an interdisciplinary workshop. Environ
Health Perspect 115:1654-9.
2. Cobben, N.A., J.A.Jacobs, M.P.Dieijen-Visser, P.G.Mulder, E.F.Wouters, and M.Drent. 1999.
Diagnostic value of BAL fluid cellular profile and enzymes in infectious pulmonary disorders. Eur.
Respir. J. 14:496-502.
3. de Jong, W.H., W.I.Hagens, P.Krystek, M.C.Burger, A.J.Sips, and R.E.Geertsma. 2008. Particle
size-dependent organ distribution of gold nanoparticles after intravenous administration. Biomaterials
29:1912-9.
4. Dhawan, A., V.Sharma, and D.Parmar. 2008. Nanomaterials: A challenge for toxicologists.
Nanotoxicology 3:1-9.
5. Donaldson, K. and P.J.Borm. 2007. Approaches to the toxicological testing of particles. In Particle
Toxicology. Taylor and Francis group.
6. Duffin, R., P.S.Gilmour, R.P.Schins, A.Clouter, K.Guy, D.M.Brown, W.MacNee, P.J.Borm,
K.Donaldson, and V.Stone. 2001. Aluminium lactate treatment of DQ12 quartz inhibits its ability to
cause inflammation, chemokine expression, and nuclear factor-kappaB activation. Toxicol. Appl.
7. Henderson, R.F., K.E.Driscoll, J.R.Harkema, R.C.Lindenschmidt, I.Y.Chang, K.R.Maples, and
E.B.Barr. 1995. A comparison of the inflammatory response of the lung to inhaled versus instilled
particles in F344 rats. Fundam. Appl. Toxicol. 24:183-197.
8. Rejman, J., V.Oberle, I.S.Zuhorn, and D.Hoekstra. 2004. Size-dependent internalization of particles
via the pathways of clathrin- and caveolae-mediated endocytosis. Biochem. J. 377:159-169.
9. Semmler-Behnke, M., W.G.Kreyling, J.Lipka, S.Fertsch, A.Wenk, S.Takenaka, G.Schmid, and
W.Brandau. 2008. Biodistribution of 1.4- and 18-nm gold particles in rats. Small 4:2108-11.
10. Tabata, Y. and Y.Ikada. 1988. Effect of the size and surface charge of polymer microspheres on their
phagocytosis by macrophage. Biomaterials 9:356-362.
11. Williams, D.a.C.C. 1996. Transmission Electron Microscopy. III Imaging Plenum Press New York,
359 pp.
12. Yu, L., L.Yung, C.Ong, Y.Tan, K.Balasubramaniam, D.Hartono, G.Shui, M.Wenk, and W.Ong.
2007. Translocation and effects of gold nanoparticles after inhalation exposure in rats.
RIVM
National Institute for Public Health and the Environment P.O. Box 1