The intake of acrylamide, nitrate and
ochratoxin A in people aged 7 to 69
living in the Netherlands
RIVM Letter report 2014-0002 L. Geraets et al.
Colophon
© RIVM 2011
Parts of this publication may be reproduced, provided acknowledgement is given to the 'National Institute for Public Health and the Environment', along with the title and year of publication.
This is a publication of:
National Institute for Public Health and the Environment
P.O. Box 1│3720 BA Bilthoven The Netherlands
www.rivm.nl/en L. Geraets, RIVM J.D. te Biesebeek, RIVM G. van Donkersgoed, RIVM N. Koopman, RIVM
P.E. Boon, RIVM
Contact: Polly E. Boon
Centre for Nutrition, Prevention and Health Services, Food Safety polly.boon@rivm.nl
This investigation was performed by order and for the account of the
Netherlands Food and Consumer Product Safety Authority (NVWA), Office for Risk Assessment, within the framework of project ‘Intake calculations and modelling’, research question 10A.8.5.
Publiekssamenvatting
De inname van acrylamide, nitraat en ochratoxine A in de Nederlandse bevolking van 7 – 69 jaar
De voeding van kinderen (7-15 jaar) en (jong) volwassenen (16-69 jaar) in Nederland is veilig wat betreft de inname van nitraat, dat vooral in groenten zit. De hoeveelheid acrylamide waaraan beide leeftijdsgroepen worden blootgesteld via de voeding zou mogelijk schadelijk kunnen zijn voor de gezondheid.
Acrylamide zit in gebakken en gefrituurde producten. Voor ochratoxine A, dat wordt veroorzaakt door schimmels, kan niet worden beoordeeld of de voeding veilig is. Meer onderzoek is nodig om de innameberekening te verfijnen. Dit blijkt uit een studie van het RIVM waarin is berekend hoeveel de Nederlandse bevolking van de drie genoemde stoffen binnenkrijgt via de voeding. Voor alle drie de stoffen, maar vooral voor nitraat en ochratoxine A, zijn concentratiegegevens noodzakelijk die een goede afspiegeling zijn voor de gehalten aanwezig in voedselproducten. Voor acrylamide, een mogelijk
kankerverwekkende stof, is aangetoond dat het schadelijk is in dieren, maar dit is (nog) niet overtuigend aangetoond in de mens. Meer kennis is nodig over de werking van deze stof bij de mens om te kunnen vaststellen of de berekende inname inderdaad onveilig is.
Om de inname via de voeding te berekenen zijn voedselconsumptiegegevens van de Voedselconsumptiepeiling (VCP) gecombineerd met beschikbare concentratiegegevens van de stoffen in producten. Vervolgens is de berekende inname vergeleken met gezondheidslimieten die voor de stoffen gelden om per stof mogelijke gezondheidsrisico’s te bepalen.
Trefwoorden:
Acrylamide, nitraat, ochratoxine A, Nederlandse populatie, langetermijninname, statistisch modelleren
Abstract
The intake of acrylamide, nitrate and ochratoxin A in people aged 7 to 69 living in the Netherlands.
The diet of children (aged 7 to 15) and (young) adults (aged 16 to 69) in the Netherlands is safe with respect to the intake of nitrate, which is mainly present in vegetables. The amount of acrylamide (which is present in baked and fried foods) to which both age groups are exposed may have an adverse health effect. For ochratoxin A (which is produced by fungi), it was not feasible to determine whether the diet was safe. More research is required to refine the intake calculation.
These are the results of a study performed by the National Institute for Public Health and the Environment (RIVM) into the dietary intake of acrylamide, nitrate and ochratoxin A in the Dutch population. Concentration data that reflect those present in food products are needed for all three compounds, but especially for nitrate and ochratoxin A. Acrylamide has been shown to be carcinogenic in animals, but (so far) this has not been convincingly shown in humans. A greater insight is required into the toxicological effect of this substance in humans to establish whether the calculated intake is adverse.
To calculate the dietary exposure, food consumption data derived from the Dutch National Food Consumption Survey were linked to data on concentration levels in foods. The exposure estimates were compared with the compound-specific health reference values to assess possible health risks.
Keywords:
Acrylamide, nitrate, ochratoxin A, Dutch population, long-term intake, statistical modelling
Contents
1
Introduction—9
2
Methods—11
2.1
DNFCS 2007-2010—11
2.2
Concentration data—11
2.3
Linkage between food consumption and concentration data—12
2.4
Method of dietary exposure assessment—13
2.5
Risk assessment—14
3
Results—17
3.1
Update food conversion model—17
3.2
Exposure to acrylamide—17
3.3
Exposure to nitrate—19
3.4
Exposure to OTA—20
4
General discussion—23
4.1
Methodological issues related to the exposure assessment—23
4.2
Risk assessment—31
4.3
Comparison with the children’s study—33
4.4
Conclusions and recommendations—34
Acknowledgements—35
References—37
Appendix A. List of concentrations in food groups or RACs used in the dietary exposure assessment—41
Appendix B. Details on linkage of analysed foods, food groups or raw agricultural commodities to relevant new food codes entered in DNFCS 2007-2010—47
1
Introduction
Recently, from 2007 to 2010, a food consumption survey was conducted among children and adults aged 7 to 69 years living in the Netherlands, the so-called Dutch National Food Consumption Survey (DNFCS) 2007-2010 (van Rossum et al., 2011). The main aim of the study was to gain insight into the diet of the population investigated to establish 1) the consumption of food groups, 2) the intake of energy and nutrients, and 3) the use of dietary supplements. The data are however also very well suitable to study research questions related to food safety.
The last food consumption survey that covered the main part of the Dutch population was conducted in 1997/1998 (DNFCS-3), more than 10 years ago (Kistemaker et al., 1998). Since then two more recent DNFCSs have been performed, but only in a selected age group of the Dutch population: young adults (19-30 years) in 2003 (Ocké et al., 2005) and young children
(2-6 years) in 2005/2006 (Ocké et al., 2008). The present data form therefore the first dataset with up-to-date information since a decade on the dietary habits of children aged 7 years and older, and adults living in the Netherlands.
In this study we used the new food consumption data to conduct an exposure assessment to three compounds, namely acrylamide, nitrate and ochratoxin A (OTA). The long-term dietary intake of acrylamide, nitrate and OTA was previously evaluated in young children aged 2 to 6 years living in the
Netherlands (Boon et al., 2009). For acrylamide there was a probability of an adverse health effect occurring in young children, but the extent to which this could happen was unclear. A possible health risk of OTA could not be
determined, due to the use of (partly) targeted data (Boon et al., 2009). Nitrate is a compound which is presently being re-evaluated by the Netherlands Food and Consumer Product Authority (NVWA) together with the Netherlands Nutrition Centre.
It was hypothesized based on the results from the young children’s study that the exposure (per kg bodyweight) for all substances would be reduced in older children and adults, resulting in an increased margin of exposure (MOE) or safety (MOS) for acrylamide and very likely in exposures below the acceptable daily intake (ADI) or tolerable weekly intake (TWI) for nitrate and OTA, respectively.
2
Methods
2.1 DNFCS 2007-2010
The target population of the DNFCS 2007-2010 consisted of people aged 7 to 69 years living in the Netherlands (van Rossum et al., 2011). Pregnant and breast-feeding women, as well as institutionalised people were not included. Respondents were selected from representative consumer panels of the Market Research GfK Panel Services. A maximum of one person per household was included in the survey to avoid correlations in dietary consumption patterns between members of the same family. In addition, the panels only included people with sufficient knowledge of the Dutch language. In total
5,502 individuals were invited to participate in the study, of which 3,819 consented (net response of 69%). Children were overrepresented in the study population and adults underrepresented.
The food consumption data were collected over a 3-year period from March 2007 to April 2010 via two non-consecutive 24-hour dietary recalls. Children aged 7 to 15 years were interviewed face to face during home visits in the presence of at least one of the child’s parents or carers. Participants aged 16 and over were interviewed by telephone, at dates and times unannounced to the participants. The interval between the two 24-hour recalls was about 4 weeks (2 to 6 weeks). Portion sizes of the foods consumed could be quantified in several ways: by means of quantities as shown on photos in a provided picture booklet, or in household measures, standard units, by weight and/or volume. The survey covered all days of the weeks and all four seasons. National and/or religious holidays or holidays of the participants were not included in the survey. For more details see van Rossum et al. (2011).
2.2 Concentration data
The concentration data used to assess the dietary exposure to acrylamide and OTA were the same data as used for the exposure assessment in the young children’s study conducted in 2008-2009 (Boon et al., 2009). For nitrate however new up-to-date data were used as analysed in 2007–2010 by the Netherlands Food and Product Safety Authority (NVWA), Dutch Product Association and Bakker Barendrecht B.V., except for tap water, potatoes, cereals, some specific fruits and vegetables for which no new up-to-date data were available. For these products, nitrate concentration data were used as in the young children’s study (for more details see Appendix A). The concentration data of acrylamide were collected in 2006 and 2007, and those of OTA in 2002– 2006. These data were derived from monitoring programmes performed in the Netherlands by the NVWA. All concentration data were present in the Quality Agricultural Products (KAP) database1. Concentrations of OTA in meat were not
available in the Netherlands. Therefore, reported concentrations in pork from Germany (SCOOP, 2002) and in poultry from Denmark (Jørgensen, 1998) were used, as in the young children’s study.
The non-detect samples were assumed to contain concentrations equal to half the limit of reporting (LOR), the middle bound scenario. The same procedure of assigning ½ LOR to non-detect samples was followed as described in Boon et al. (2009).
Concentration data of OTA were a mixture of monitoring and survey concentration data. Survey concentration data are obtained from targeted sampling of batches suspected of containing (possible) higher concentrations of a compound. These data are not suitable to estimate a reliable exposure to contaminants. Based on indications of the NVWA survey samples of fig and peanut, as well as all samples of other foods that were analysed more than once on the same day (the so-called duplo and triplo samples) were removed from the OTA concentration database. Raisin samples were also identified as survey samples. These samples were, as in the young children’s study, however not removed from the database. The consumption of raisins is, as opposed to the consumption of figs, not negligible in the target population (on average 0.9 g/d). Not addressing this food in the assessment may therefore have resulted in an underestimation of the exposure. Since, no OTA concentrations in comparable foods were available, we used the average OTA concentration of the survey samples in the exposure assessment. Also the consumption of peanuts is not negligible in the study population (on average 0.1 g/d). For this food, the OTA concentrations in nuts (all nuts grouped together because of data scarcity) were used in the exposure assessment (Appendix A). The remaining OTA
concentration dataset contained only the results of samples analysed as part of the monitoring programme. The remaining samples may also not be completely random, as they are sampled to ensure compliance with legal limits.
For more details on the concentration data of acrylamide, nitrate and OTA used in the exposure assessments see Appendix A of this report and Boon et al. (2009).
2.3 Linkage between food consumption and concentration data
Nitrate and OTA are predominantly analysed in raw agricultural commodities (RACs), including peels and non-edible parts. To model the dietary exposure to chemicals using concentrations analysed at RAC level a link between
concentration and food consumption data needs to be established. In that way, also prepared foods (like apple cake, salads, bread) containing RACs as
ingredients will be included in the exposure assessment. To establish this a food conversion model has been developed in 1995 (van Dooren et al., 1995), which has been regularly updated since then to cover new foods as recorded in later Dutch food consumption surveys. In this database, food codes as used in the food consumption surveys have been converted to RAC level (including their weight fractions) using several sources of information, including recipes from cookbooks, food legislation and information from either literature, label of the product, internet or manufacturer, as well as recipes developed and used for the purpose of the Dutch Food Composition Database NEVO (NEVO-Foundation, 1996; NEVO-Foundation, 2001; NEVO-Foundation, 2006). Furthermore, nutrient concentrations as listed in NEVO were used in the conversion or as check for the amounts deduced from other sources. When there is only little information of a food, ingredient levels of a similar food were used. The type of processing a RAC has undergone before consumption is also recorded. For example, apple juice may be converted to RAC ‘apple’ with processing type ‘juicing’, apple eaten peeled to RAC ‘apple’ and processing type ‘peeling’, and apple eaten with skin to RAC ‘apple’ with processing type ‘raw’. In this way, the effect of processing on
concentrations in RACs before consumption can be taken into account in an exposure assessment. For more details on the food conversion model, see van Dooren et al. (1995).
To use the food conversion model to assess the dietary exposure to nitrate and OTA with the new food consumption data of DNFCS 2007-2010, the model was updated by also including the new food codes used in this survey. This was only done for the RAC ingredients that were relevant for the dietary exposure to nitrate and OTA, based on the RACs that were analysed for these two compounds (see Appendix A of this report).
Acrylamide, and also partly OTA and nitrate, are analysed at the level of food as eaten. For example, acrylamide was analysed in biscuits, nitrate in frozen spinach, and OTA in toast. These foods were either linked directly to foods coded in the food consumption survey (e.g. frozen spinach, crisps) or by creating food groups. These food groups consisted of comparable foods as those analysed based on chemical concentrations and food characteristics. The grouping as established in the young children’s study was used (Appendix D of Boon et al., 2009), and updated with relevant new food codes as recorded in the DNFCS 2007-2010.
For the details on linkage between food consumption and concentration data see Appendix B of this report.
2.4 Method of dietary exposure assessment
Long-term exposure modelling
The dietary exposure was calculated using the Monte Carlo Risk Assessment programme (MCRA), Release 7.0, available for registered users at the RIVM website (de Boer & van der Voet, 2010). All daily consumption patterns (e.g., 7,638 for the total population (2 days × 3,819 individuals)) were multiplied with the mean concentration of the substance per consumed food and summed over foods consumed per day per individual. The estimated exposures were adjusted for the individual’s body weight. This resulted in an exposure distribution. Since all three substances studied here are expected to be present at levels for which chronic effects are the relevant health effects, the mean concentration was used because fluctuations in daily concentrations are assumed to average out in the long run.
A distribution of daily exposures, calculated as described above using mean concentrations, includes both the variation between individuals and between the two days of one individual. However, to assess the long-term intake within a population only the former type of variation is of interest, since in the long run the variation between different days of one individual will level out. Therefore, the within-person (between days) variation was first removed from the
distribution of daily exposures using the beta-binomial-normal (BBN) model (de Boer & van der Voet, 2010; Slob, 2006). To remove the within-person variation from the daily exposures, the BBN models transform the daily exposure
distribution into a normal distribution. After removal of the within-person variation, the normal distribution is back-transformed and is now considered a long-term exposure distribution. The reported percentiles of the long-term exposure distribution are P50, P95 and P99. For nitrate and OTA processing factors were included in the calculations to make the assessment more accurate. See Appendix C for the processing factors used, as well as for the methodology to include them in the exposure assessments.
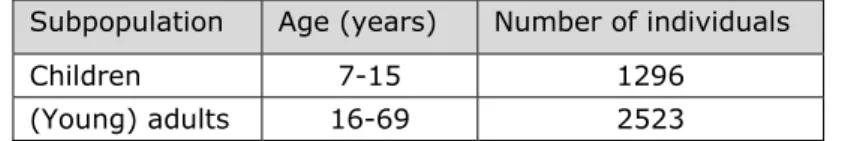
Table 2-1. Number of children aged 7 to 15 years and (young) adults aged 16 to 69 years in DNFCS 2007-2010.
Subpopulation Age (years) Number of individuals Children 7-15 1296
(Young) adults 16-69 2523
In order to perform the dietary exposure assessment, the individuals from the DNFCS 2007-2010 were divided in two age groups, i.e. 7 to 15 years (described as ‘children’ in the present report) and 16 to 69 years (described as ‘(young) adults’ in the present report). Children are known to have higher exposure levels per kg body weight. The division at age 16 was based on the fact that the method of data collection in the DNFCS 2007-2010 differed between children aged 7 to 15 years and the (young) adults aged 16 to 69 years (see section 2.1). Furthermore, the DNFCS 2007-2010 contained a relatively high number of children compared to adults (Table 2-1).
The exposure assessment of nitrate in the young children’s study was calculated using season-specific nitrate concentrations, since nitrate levels in vegetables might be higher in the winter period due to different lighting conditions (Boon et al., 2009). As preliminary analyses in the present study indicated that the nitrate exposure did not differ between the summer and winter period (as was also evident from only small differences in summer and winter nitrate
concentrations for specific vegetables with for some vegetables even higher nitrate concentrations in the summer), total nitrate concentrations were used in the present study. Subsequently, the nitrate exposure assessment was not divided in an exposure assessment for the summer and winter period. This choice was endorsed by the aim to assess the long-term exposure to nitrate.
Potential season-specific differences average out in the long run.
Uncertainty analyses
With the use of the bootstrap method, we assessed the uncertainties due to the limited size of the dataset for both concentration and food consumption data. These uncertainties were quantified via a 95% uncertainty interval around the percentiles of exposure (Boon et al., 2009). Other sources of uncertainty, such as sampling uncertainty, under- or over-reporting of foods, and linkage of foods consumed to foods, can however not yet be quantified and will either result in a possible overestimation and/or underestimation of the exposure. This will be addressed shortly in the discussion.
2.5 Risk assessment
Though the main aim of this study was to conduct an exposure assessment, a risk assessment was included as well. For this, the exposures to nitrate and OTA were compared with their respective health-based reference values, and for acrylamide, margins of safety (MOS) for neurotoxicity and margins of exposure (MOE) for carcinogenicity were calculated. An update of the toxicity data of these three substances based on a review of the scientific literature and evaluations published since Boon et al. (2009) was outside the scope of this report. Therefore, the same substance-specific health-based reference values are used as described in Boon et al. (2009).
For acrylamide, the no-observed-adverse effect level (NOAEL; 0.2 mg/kg bw/d) for neurotoxicity and the 2.5% lower confidence limit of the benchmark dose for a 10% increase in cancer incidence (BMDL10; 0.30 mg/kg bw/d) were divided by
the P50, P95 and P99 of exposure (Burek et al., 1980; FAO/WHO, 2006; Johnson et al., 1986). For nitrate, the acceptable daily intake (ADI) of
3.7 mg/kg bw/d was used (FAO/WHO, 2003). The tolerable weekly intake (TWI) of 120 ng/kg bw/week was used for OTA (EFSA, 2006b). Because of this, the estimated long-term exposures per day were multiplied by a factor seven to obtain the long-term exposure per week. This approach is slightly different as compared to Boon et al. (2009) in which the long-term daily exposure was compared to a tolerable daily intake derived from the TWI. For both nitrate and OTA, the percentage of the children and (young) adults exceeding the ADI and TWI, respectively, was calculated.
3
Results
3.1 Update food conversion model
In total 577 new NEVO codes were used in DNFCS 2007-2010 to code the foods consumed by the target population. Of these codes, 563 were relevant for the exposure assessment to nitrate and OTA. The remaining 14 codes were not converted because they did not contain at least one relevant RAC ingredient. These were mainly codes related to meat products.
For the relevant NEVO codes, the conversion was based on different sources of information. For 299 codes we used recipe data as developed and used for the purpose of the NEVO 2011 (RIVM, 2011). Of 106 codes the information was listed in this database (RIVM, 2011). For the remaining 193 codes the
information was directly obtained from the RIVM. In all of these recipes NEVO codes are described in percentages of other NEVO codes. For example, new NEVO code ‘Nougat with chocolate’ consists of 53 g of NEVO code ‘Sugar’, 27 g of NEVO code ‘Almond nuts blanched, unsalted’ and 20 g of NEVO code
‘Chocolate dark’. In all cases the underlying NEVO codes were already converted to RAC, including processing type information, within the conversion model. In total 247 new NEVO codes were converted by equating them to comparable existing NEVO codes. For example, new NEVO code ‘Low-fat margarine Becel light’ was deemed comparable to existing NEVO code ‘Low-fat margarine 35% fat <10 g saturated’. The remaining NEVO codes (17) were (partly) converted based on ingredient information obtained from the label of the food or nutrient information as listed in NEVO (e.g. carbohydrate concentration was equalled to sugar), or the related food consisted of only one RAC ingredient (e.g. sundried tomatoes, nuts macademia).
When converting NEVO codes to RAC ingredients, three RACs were identified for which no code was yet present in the conversion model. For these RACs new codes were generated. During the conversion one processing type (e.g. peeling, drying, boiling in water, etc.) was identified per RAC ingredient.
3.2 Exposure to acrylamide
Exposure calculation
The exposure to acrylamide was shown to be higher in children as compared to the (young) adult population (Table 3-1). The median long-term exposure to acrylamide in children was 0.6 μg/kg bw/d (P95 = 1.4 μg/kg bw/d). Of this subpopulation, 1% had an acrylamide exposure above 2.1 μg/kg bw/d. The median long-term exposure to acrylamide for the (young) adult population was 0.3 μg/kg bw/d (P95 = 0.9 μg/kg bw/d; Table 3-1). Of this subpopulation, the P99 of exposure was 1.4 μg/kg bw/d.
Contribution of the most important food groups
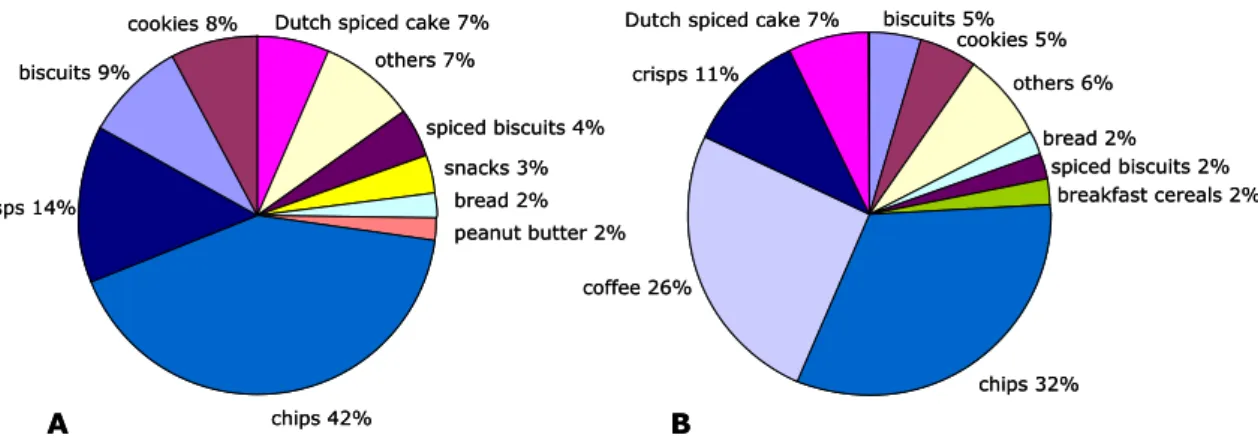
The most important sources contributing to the average acrylamide intake in Dutch children were chips (French fries) (42%) and crisps (14%) (Figure 3-1A). Also biscuits (9%), cookies (8%) and Dutch spiced cake (7%) contributed considerably to the acrylamide intake.
Table 3-1. Percentiles of long-term dietary exposure of children aged 7 to 15 years and (young) adults aged 16 to 69 years in the Netherlands to acrylamide assuming samples with a concentration below LOR1 to equal ½ LOR.
Age (years) Percentiles of exposure (μg/kg bw/d)
P50 P95 P99 7-15 0.6 [0.5-0.7]2 1.4 [1.2-1.8 ]2 2.1 [1.7-2.9]2 16-69 0.3 [0.3-0.3 ]2 [0.8-1.0]0.9 2 [1.2-1.6]1.4 2
1 LOR = limit of reporting
2 2.5% lower - 97.5% upper confidence limits
For the Dutch (young) adult population, the most important source contributing to the average acrylamide intake was, similar to the younger individuals, chips (French fries) (32%) (Figure 3-1B). In addition, an important source of dietary acrylamide exposure for this subpopulation was coffee (26%). Furthermore, crisps (11%) and Dutch spiced cake (7%) contributed considerably to the acrylamide intake.
Figure 3-1. Contribution of the most important food groups to the dietary exposure of children aged 7 to 15 years (A) and (young) adults aged 16 to 69 years (B) in the Netherlands to acrylamide, assuming samples below the limit of reporting (LOR) to equal ½ LOR. Note that coffee is used here as the total of all three coffee-related food groups (Appendix B).
Risk assessment
MOS and MOE for the P50, P95 and P99 of exposure to acrylamide for both studied populations were calculated for neurotoxicity and carcinogenicity, respectively (Table 3-2). The MOS for neurotoxicity for the (young) adult population ranged from 667 for the P50 to 143 for the P99. For children, these numbers equalled 333 and 95, respectively (Table 3-2). For the MOE for carcinogenicity, the levels ranged from 1000 for the P50 to 214 for the P99 in (young) adults, and 500 to 143 for the children, respectively (Table 3-2).
Dutch spiced cake 7% others 7% spiced biscuits 4% snacks 3% bread 2% peanut butter 2% chips 42% crisps 14% biscuits 9% cookies 8% biscuits 5% cookies 5% others 6% bread 2% spiced biscuits 2% breakfast cereals 2% chips 32% coffee 26% crisps 11% Dutch spiced cake 7%
A B
Dutch spiced cake 7% others 7% spiced biscuits 4% snacks 3% bread 2% peanut butter 2% chips 42% crisps 14% biscuits 9% cookies 8% biscuits 5% cookies 5% others 6% bread 2% spiced biscuits 2% breakfast cereals 2% chips 32% coffee 26% crisps 11% Dutch spiced cake 7%
Table 3-2. Percentiles of long-term dietary exposure to acrylamide of children aged 7 to 15 years and (young) adults aged 16 to 69 years in the Netherlands and corresponding margins of safety (MOS) for neurotoxicity and margins of exposure (MOE) for carcinogenicity.
Age (years) Percentiles of exposure (μg/kg bw/d), MOS and MOE
P50 P95 P99
Exp1 MOSn2 MOEc2 Exp1 MOSn2 MOEc2 Exp1 MOSn2 MOEc2
7-15 0.6 333 500 1.4 143 214 2.1
[2.9]3 [69]95 4 [103]143 4
16-69 0.3 667 1000 0.9 222 333 1.4
[1.6]3 [125]143 4 [188]214 4
1 Exp = exposure
2 Margin of safety for neurotoxicity (MOSn) was calculated by dividing the NOAEL
(highest dose from subchronic rat study without morphological nerve changes) by the P50, P95 or P99 of exposure (NOAEL: 0.2 mg/kg bw/d); Margin of exposure for carcinogenicity (MOEc) was calculated by dividing the BMDL10 (2.5% lower
confidence limit of the benchmark dose for a 10% increase in cancer incidence) by the P50, P95 or P99 of exposure (BMDL10: 0.3 mg/kg bw/d)
3 97.5% upper confidence limits 4 2.5% lower confidence limits
3.3 Exposure to nitrate
Exposure calculation
The intake of nitrate was shown to be higher in children as compared to the (young) adult population (Table 3-3). The median long-term intake of nitrate in children was 1.2 mg/kg bw/d (P95 = 2.0 mg/kg bw/d). Of this subpopulation, 1% had an exposure above 2.6 mg/kg bw/d. The median long-term intake of nitrate in (young) adults was 0.9 mg/kg bw/d (P95 = 1.8 mg/kg bw/d). Of the (young) adults, 1% had a nitrate intake above 2.4 mg/kg bw/d.
Table 3-3. Percentiles of long-term dietary exposure of children aged 7 to 15 years and (young) adults aged 16 to 69 years in the Netherlands to nitrate assuming samples with a concentration below LOR1 to equal ½ LOR.
Age (years) Percentiles of exposure (mg/kg bw/d)
P50 P95 P99
7-15 1.2
[1.1-1.2]2 [1.8-2.4]2.0 2 [2.2-3.2]2.6 2
16-69 0.9
[0.9-1.0]2 [1.6-2.0]1.8 2 [2.1-2.7]2.4 2
1 LOR = limit of reporting
2 2.5% lower - 97.5% upper confidence limits
Contribution of the most important food groups
Potatoes were for both age groups the most important source of dietary intake of nitrate in the Netherlands (Figure 3-2). Other sources were cabbage lettuce and tap water. These are all food products with relatively low nitrate
concentrations but high dietary consumption.
Risk assessment
The percentage of the children and (young) adults exceeding the ADI of nitrate (3.7 mg/kg bw/d) was less than 1% for both subpopulations (Table 3-4).
Figure 3-2. Contribution (%) of the most important food groups to the dietary exposure of children aged 7 to 15 years (A) and (young) adults aged 16 to 69 years (B) in the Netherlands to nitrate, assuming samples below the limit of reporting (LOR) to equal ½ LOR.
Table 3-4. Percentage of children aged 7 to 15 years and (young) adults aged 16 to 69 years in the Netherlands that exceeded the acceptable daily intake (ADI) of 3.7 mg/kg bw/d for nitrate, assuming samples below the LOR1 to equal
½ LOR.
Age (years) Percentage of population
exceeding ADI
7-15 0.04 [0-0.37]2
16-69 0.03 [0-0.12]2
1 LOR = limit of reporting
2 2.5% lower - 97.5% upper confidence limits
3.4 Exposure to OTA
Exposure calculation
The long-term intake to OTA per day as calculated by MCRA was converted into a long-term intake per week2 as the health-based reference value of OTA was a
tolerable weekly intake (see below). The weekly dietary exposure to OTA was shown to be higher in the children population as compared to the (young) adult population (Table 3-5). The median long-term weekly exposure to OTA for children and (young) adults was 72 ng/kg bw/week (P95 = 166 ng/kg bw/week) and 54 ng/kg bw/week (P95 = 122 ng/kg bw/week), respectively.
Contribution of the most important food groups
The most important sources contributing to the average OTA intake in children were nuts (48%), wheat (30%) and rye (12%). Cookies (3%), raisins (2%) and sunflower kernel (2%) contributed only slightly to the OTA intake. All the other foods contributed for 3% to the intake (see Figure 3-3).
2 We are aware that the ‘true’ long-term exposure per week may be different from a long-term exposure per
week estimated by multiplying the daily long-term exposure by seven. In future exposure assessments dealing with health-based limit values expressed per week, this issue deserves further elaboration.
potatoes 21% cabbage lettuce 18% tap water 9% iceberg lettuce 4% endive 3%
green beans (fresh) 3% beetroot 3% courgette 3% spinach frozen 2% spinach creamed frozen 2% other 31% potatoes 31% cabbage lettuce 7% tap water 7% apple 4% endive 4% spinach creamed frozen 4% green beans (fresh) 3%
spinach frozen 3% water lemonade 3% cucumber 3% other 31%
A
B
potatoes 21% cabbage lettuce 18% tap water 9% iceberg lettuce 4% endive 3%green beans (fresh) 3% beetroot 3% courgette 3% spinach frozen 2% spinach creamed frozen 2% other 31% potatoes 31% cabbage lettuce 7% tap water 7% apple 4% endive 4% spinach creamed frozen 4% green beans (fresh) 3%
spinach frozen 3% water lemonade 3%
cucumber 3% other 31%
Table 3-5. Percentiles of long-term weekly dietary exposure of children aged 7 to 15 and (young) adults aged 16-69 years to OTA in the Netherlands assuming samples with a concentration below LOR1 to equal ½ LOR.
Age (years) Percentiles of exposure (ng/kg bw/week)
P50 P95 P99 7-15 72 [41-106]2 166 [81-281]2 235 [109-425]2 16-69 54 [34-77]2 [72-199]122 2 [95-293]171 2
1 LOR = limit of reporting
2 2.5% lower - 97.5% upper confidence limits
The important sources contributing to the average OTA intake in Dutch (young) adults were nuts (44%), wheat (23%) and rye (14%). Wine (5%), coffee beans (4%) and sunflower kernel (3%) also contributed slightly to the OTA intake. All the other foods contributed for 8% to the intake (see Figure 3-3).
Figure 3-3. Contribution (%) of the most important food groups to the dietary
exposure of children aged 7 to15 years (A) and (young) adults aged 16 to 69 years (B) to OTA in the Netherlands, assuming samples below the limit of reporting (LOR) to equal ½ LOR.
Risk assessment
The percentage of the children and young adults exceeding the TWI for OTA was 15.6% and 5.4%, respectively (Table 3-6). However, the confidence intervals around these two best estimates were very large.
Table 3-6. Percentage of children aged 7 to 15 years and (young) adults aged 16 to 69 years in the Netherlands that exceeded the tolerable weekly intake (TWI) (120 ng/kg bw/week) of OTA assuming samples with a concentration below LOR1 to equal ½ LOR.
Age (years) Percentage of population
exceeding TWI
7-15 15.6 [0.5-41]2
16-69 5.4 [0.2-22]2
1 LOR = limit of reporting
2 2.5% lower - 97.5% upper confidence limits
rye 12 % cookies 3 % other 3 % raisins 2 % sunflower kernel 2 % nut 48 % wheat 30 % rye 14 % other 8 % sunflower kernel 3 % nut 43 % wine 5 % wheat 23 % coffee beans 4% A B rye 12 % cookies 3 % other 3 % raisins 2 % sunflower kernel 2 % nut 48 % wheat 30 % rye 14 % other 8 % sunflower kernel 3 % nut 43 % wine 5 % wheat 23 % coffee beans 4% A B
4
General discussion
The present study describes the exposure assessment of acrylamide, nitrate and OTA in the Dutch population aged 7 to 69 years living in the Netherlands. For this, food consumption data from the recent DNFCS 2007-2010 were combined with concentration data derived from Dutch monitoring programmes and additional other sources using advanced statistical models. Below, the results will be discussed in relation to the methods and input data used. Furthermore, issues with respect to the risk assessment will be discussed and a comparison with the previous study in young children aged 2 to 6 years (Boon et al., 2009) is included. Finally, conclusions will be presented and recommendations are given.
4.1 Methodological issues related to the exposure assessment
4.1.1 Conversion model
In this project the conversion model, in which all the NEVO codes present in the different food consumption surveys conducted since 1997/1998 are included, was updated to also include the new NEVO codes as used in DNFCS 2007-2010, as far as needed for the exposure assessment to nitrate and OTA, the two compounds that are analysed for a large part in RACs (section 2.1). A relatively large number of the codes (247) were converted to RAC level by equating them to a comparable, already existing NEVO code. Despite the fact that similarities between the codes could be large, this type of conversion is not optimal and may be subject to flawed conversions in those cases where recipes of foods have changed in time. Since recipes are known to change continuously, we
recommend that these NEVO codes should be checked and, if needed, updated using recipe information derived from manufacturers and/or based on label information. Furthermore, when equating new NEVO codes to already existing NEVO codes the goal of the present study was leading, resulting in choices that may not be optimal for the use of the conversion model for other exposure assessment purposes. This should be kept in mind when using the conversion model for the exposure assessment to other contaminants. Only 14 new NEVO codes were not converted since they were not relevant for the exposure assessment of nitrate and OTA.
A large part (> 50%) of the conversion of the new NEVO codes was based on recipe information obtained from the RIVM, underlying NEVO (RIVM, 2011). These codes were mainly codes that referred to general foods that could not be linked to specific foods of a certain brand (e.g. vegetables winter-average, boiled without salt; yoghurt whole with fruits; salad cucumber-). In these recipes new NEVO codes are described in percentages of already existing NEVO codes. Using this information, no longer optimal conversions of the already existing NEVOs due to changes in recipes in time may have propagated into the conversion of the new NEVO codes. This approach shows that a critical
examination of the already existing codes as used in the DNFCS 2007-2010, as well as those part of the NEVO recipes, is needed to optimise the linkage between food consumption data and concentration data. If this is done, also the NEVO codes used in the food consumption survey in young children (Ocké et al., 2008) should be included, since this age group is not covered in DNFCS 2007-2010. Furthermore, the description of new NEVO codes in percentages of already existing NEVO codes was set up to efficiently calculate the nutrient
composition of these codes without the need of laboratory analyses. It is unclear whether choices made for this purpose are also optimal for the purpose of converting foods to RAC level.
Foods consumed by the respondents taking part in DNFCS 2007-2010 were categorised according to the EPIC Soft food group classification, including facets and descriptors for further specification of the foods such as preparation method and fat content (van Rossum et al., 2011). To calculate the energy and nutrient intakes the categorised foods were subsequently linked to NEVO codes present in NEVO (RIVM, 2011). For this, more than 28,000 different food items were linked to 1,599 NEVO codes. It is clear that by using NEVO codes as a starting point of the conversion to RAC level, a lot of detailed information is not used. A 2008 study therefore advised to improve the conversion by using this extra information stored in the food consumption data (Boon et al., 2008).
Furthermore, this information can also be used to update the already existing NEVO codes used in DNFCS 2007-2010 and those part of the NEVO recipes (see above).
When converting foods as consumed to RAC level, it is important to also record processing information regarding the RAC ingredient. For example, RAC ‘banana’ may be linked to processing types ‘peeling’ or ‘drying’ when it belongs to a food containing banana without peel or dried banana. The reason for this is that concentrations of many chemicals analysed in RACs are affected when they are processed before consumption (e.g. peeling of citrus fruits). To address this in an exposure assessment, processing factors quantifying the effect of processing on the chemical level should be linked to the right RAC – processing type combination. Many RAC ingredients undergo different processing steps before consumption. For example, an apple that is part of an apple pie is washed, peeled, and baked before consumption, and a boiled potato is peeled, washed and boiled. Which processing type should be linked in these cases? In the Dutch RAC conversion model only one processing type is identified per RAC ingredient, most often the one identifying the last processing step. So the apple in an apple pie is linked to processing type ‘baking’ and the boiled potato is linked to ‘boiling’. When no processing information is available in the name of the NEVO code (e.g. pear), the most likely processing type or the processing type that results in a worst-case estimation of the exposure is assumed. For example, citrus fruits are very likely at least peeled before consumption, whereas pear can be consumed with or without peel, and carrots raw, peeled and / or boiled. The choice of the processing factor is at the moment rather arbitrary and subject to subjective choices of the person doing the conversion. It is therefore important that this process is further optimised and standardised in the future. Also the possibility of recording more than one processing type per food – RAC combination needs to be examined.
The conversion model is a very important part of the linkage of consumption and concentration data at RAC level, and thus in the dietary exposure assessment. Further optimization of this model by using the information presently recorded in the food consumption surveys as well as the use of processing info deserves further research.
4.1.2 Food consumption data
For the exposure assessment performed in the current study, consumption data of the DNFCS 2007-2010 were used (van Rossum et al., 2011). These are the first food consumption data for persons aged ≥ 7 years that have come available
within the Netherlands since 13 years. This dietary survey was conducted according to international guidelines as set by EFSA (EFSA, 2009) to obtain dietary consumption information suitable for both the purpose of nutrition and food safety.
The population of this survey consisted of 3,819 individuals. The distribution of levels of education (or level of education of parents/carers), region, and urbanization in the study population was close to that of the general Dutch population (van Rossum et al., 2011). The food consumption data were
therefore considered representative for the diet of the Dutch population, though the results are not fully representative for immigrants. In contrast to the DNFCS-3 (Kistemaker et al., 1998), pregnant and lactating women were not included in the current survey. As the consumption of pregnant and lactating women are considered not representative for the consumption of the general population, not including this subpopulation improves the representativeness of the consumption data for the general population.
As a maximum of only one person per household was included, correlations in dietary consumption patterns between members of the same family were avoided. Furthermore, in the DNFCS 2007-2010, for each individual the two 24-hour dietary recalls were conducted, in contrast to DNFCS-3, on two non-consecutive days with an interval of 2 to 6 weeks. The two non-non-consecutive 24-hour dietary recalls are considered less correlated and more independent, and therefore resulting in more accurate estimations of long-term exposure. Food consumption surveys are important tools to gain insight in food
consumption patterns within a population. However, food consumption surveys have also some disadvantages that may have affected some of the exposure assessments reported here. A disadvantage of food consumption surveys is that eating patterns may be influenced or changed due to the recall process. Due to the use of the unannounced 24-h recall approach in the group of 16-69 years, this disadvantage was kept at a minimum for this age group. However, people may still omit reporting foods with an unhealthy image or over-report foods that are assumed healthy. A possible effect of this on the exposure assessment may differ. For example, due to the unhealthy image of crisps and chips the
consumption of these foods may be underreported resulting in an
underestimation of acrylamide intake. Conversely, foods that are known to be healthy like fruits and vegetables may be eaten more on recording days than in practice resulting in an overestimation of the intake of nitrate. For the children aged 7 to 15 years the home visits were not unannounced.
Linked to this is the possible overall underestimation of consumption levels (Biro et al., 2002). Low reporting of energy intake was evaluated by means of the ratio of the reported energy intake and estimated energy requirements for basal metabolic rate by van Rossum et al. (2011). The mean expected ratio of the energy intake and energy requirements was 1.74, whereas the mean observed ratio was 1.46 (van Rossum et al., 2011). Based on age-specific cut offs, the proportion of low reporters was estimated to be 17%, while the proportion of high energy reporters was 1.5% (van Rossum et al., 2011). As the method of dietary recall varied between the children and the (young) adults subpopulations (see section 2.1), this dissimilarity might have affected the reported
consumption in the two subpopulations differently. How this has affected the exposure assessment to the three substances is unclear. For this, information regarding over-or under-reporting at food level is needed.
However, despite these possible disadvantages the food consumption data of DNFCS 2007-2010 are the most optimal data that can be obtained for food safety purposes as argued in the guidance document about the general principles for the collection of national food consumption data for food safety purposes (EFSA, 2009). Furthermore, with the use of EPIC-Soft a lot of details have been recorded which can also be useful for food safety purposes. The full potential of this information deserves further attention (see section 4.1.1).
4.1.3 Concentration and processing data
Concentration data used for the exposure assessment of acrylamide, nitrate and OTA as described in the current report were derived from monitoring
programmes performed in the Netherlands by the NVWA and some other parties (Appendix A). Additionally, survey and literature data for OTA were added to the database to make the exposure assessment more complete. The data used for the assessment of acrylamide and OTA were identical to those used in the young children’s study (Boon et al., 2009). For nitrate, concentrations of some
products were replaced by more recent data (Appendix A).
The non-detect samples were assumed to contain concentrations equal to ½ LOR, the middle bound scenario. This was based on the possibility that the food or RAC could be contaminated. For example, acrylamide concentrations in bread were below the LOR. However, bread can contain some acrylamide (FSA, 2005; Matthys et al., 2005) and is consumed regularly and in large quantities in the Netherlands. The middle bound scenario was assumed to result in a realistic estimate of exposure for all three substances. Additionally, based on Boon et al. (2009), varying the concentrations assigned to non-detect samples (i.e.
0 mg/kg or a concentration equal to the LOR) had a negligible effect on the exposure levels of acrylamide and nitrate in young children, due to the relatively low number of non-detect samples for these two substances. For OTA, the number of non-detects was higher, resulting in a significant effect on the exposure depending on the concentration assigned to the non-detect samples. This will be addressed below.
The acrylamide concentration data used for the current exposure assessments were collected by the NVWA in 2006 and 2007. Since the discovery of
acrylamide in foods, food industry and national authorities of the European Union are cooperating to investigate pathways of acrylamide formation and intervention measures to reduce its exposure (CIAA, 2011). Due to the ongoing mitigation measures, as well as the potential adverse health effects of
acrylamide exposure, it is important to use the most up-to-date acrylamide concentration data for an acrylamide exposure assessment. The lack of up-to-date acrylamide concentration data might have led to an overestimation of the exposures as reported in this report, assuming that acrylamide concentrations in processed foods are still declining. Additionally, the number of foods analysed for the presence of acrylamide was small (particularly when compared to the large number of foods consumed), which might have led to an increase of the uncertainty of the exposure assessment.
The nitrate exposure assessment was performed at least partially with up-to-date nitrate concentration data. However, for potatoes, cereals, specific fruits and some vegetables no up-to-date concentration data were available and therefore data from previous years were used (see Appendix A). Especially the data on some fruits and wheat were very old. A comparison of the concentration data of the vegetables for which new data were available with the data as used
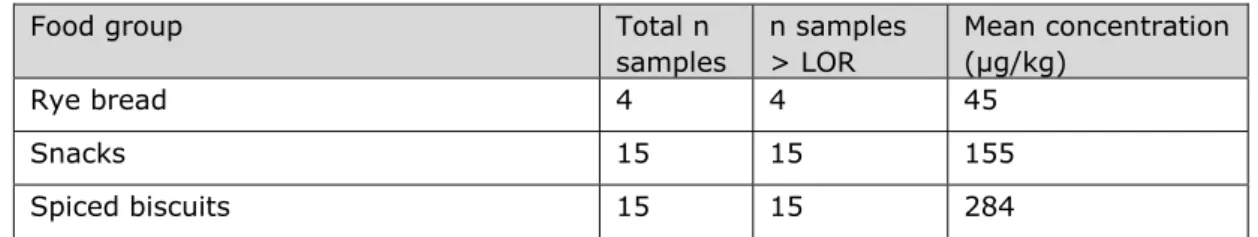
Table 4-1. Mean nitrate concentration of the five foods contributing most to the nitrate exposure for which new concentration data were available.
Food Mean concentration (mg/kg) % reduction
2002-20061 2007-2010
Cabbage lettuce 2663 2442 8
Iceberg lettuce 945 794 16
Endive 1669 1604 4
Green beans (fresh) 576 452 21
Beetroot 1945 1246 36
1 These concentration data were used in the young children study (Boon et al., 2009).
in the young children’s study showed that for a large part of these vegetables the nitrate concentrations had decreased. This is evident from Table 4-1 that lists, as an example, the mean nitrate concentration of the five vegetables that contributed most to the exposure in children and (young) adults for which new concentration data were available in the present study. Nitrate concentrations in products are however mainly dependent on weather conditions (hours of
sunshine). It is unclear whether this observed decrease is therefore a robust decrease or just an effect of overall better weather conditions for nitrate reduction by the plant in the second period. If these conditions deteriorate, nitrate concentration may increase again.
Furthermore the number of samples of the majority of foods was very limited (Appendix A) and other dietary sources such as cured meat that can also contribute to the intake of nitrate were not taken into account in the current exposure assessment. The performed exposure assessment for nitrate was therefore far from optimal. The reported exposures may either under- or overestimate the true nitrate intake. For a more accurate assessment, up-to-date concentration data of all sources of exposure should be made available in sufficient numbers to assure that the analysed concentrations represent the concentrations people are exposed to.
In the present assessment, we used a mean nitrate concentration of 5.1 mg/L of nitrate in tap water, the mean concentration analysed in 2006 (Appendix A). However, there are areas in the Netherlands with higher concentrations in tap water. Using higher concentration (15 and 30 mg/L) in the young children study showed that the percentage of children exceeding the ADI increased
considerable (Boon et al., 2009). It is therefore to be expected that a certain percentage of the children aged 7 and over and adults living in such areas may also be at risk, especially if they live there for longer periods. As recommended by Boon et al. (2009), further research is needed to establish the factors contributing to high nitrate concentrations in tap water. It should however be noted that it was assumed that different food groups (soft drinks, juices reconstituted or not) consisted for 100% of highly contaminated tap water, which might have led to an overestimate of the intake of nitrate via tap water for children living in highly contaminated areas.
Monitoring concentration data of OTA collected by the NVWA (monitoring programmes 2002-2006) were used to assess the exposure. Because concentrations of OTA in meat were not available in the Netherlands, the reported concentrations in pork from Germany (SCOOP, 2002) and in poultry from Denmark (Jørgensen, 1998) were used. The pork and chicken
concentration data were added in order not to underestimate the daily intake of OTA. Figure 3-3 however shows that the contribution of pork and chicken meat
to the OTA intake is very small, i.e. below 0.2% (data not shown). Thus, the lack of Dutch monitoring data for pork and chicken is considered not as relevant as anticipated. Furthermore, the use of targeted concentrations for raisins did not influence the OTA exposure levels largely, given the low contribution of this food to the total exposure (≤ 2%; Figure 3-3). As for peanuts only concentration data from targeted sampling were available, the mean OTA concentration in nuts was applied to peanuts and used in the exposure assessment (all nuts for which monitoring concentration data were available, excluding peanuts, were grouped because of data scarcity). As the contribution of peanuts to the OTA intake is high (31-38%; data not shown), availability of specific concentration data for this food is highly recommended. The overall monitoring data were obtained from (partly) targeted sampling, and therefore the OTA exposures as reported in this study are very likely overestimates of the real exposure (Boon et al., 2009). As explained in Boon et al. (2009), mycotoxins are analysed using screening methods with high LORs (2 mg/kg for OTA). Negative screening samples are regarded as zeros, while positive screening samples (level above the LOR) are further analysed with a more sensitive compound-specific analytical method (i.e. an analytical method with a lower LOR). To assess the influence of assigning ½ LOR to the negative samples on the exposure results, sensitivity analyses where the non-detects are replaced by zero (lower bound) or LOR (upper bound) may be performed. In the young children’s study such analyses showed that the OTA exposure of the middle bound scenario was 20 to 50% higher than those of the lower bound scenario, and about 15 to 30% lower than those of the upper bound scenario. This was mainly due to the high fraction of non-detects for wheat and wheat products (60 to 90%). However, in Boon et al. (2009) it was argued that a possible slight overestimation of the exposure due to a high LOR used to calculate the mean OTA concentrations was very likely small in
comparison to the overestimation due to (partly) targeted sampling.
The processing data used in this study are those used in the children’s study (Boon et al., 2009). No effort was made to update these factors. Given the limited processing data on OTA and the rather old data for nitrate, an update of these factors could result in other, possibly lower, exposures than reported here. Given the high exposure to OTA, especially for this substance processing factors may be relevant to refine the assessment.
As the results and quality of the dietary exposure assessment depend highly on the input data such as concentration data, preferably a concentration database should be available that includes up-to-date information of food-specific concentration data of all relevant foods in sufficient numbers per food. This is also true for processing information, especially for substances that pose a possible human health risk.
4.1.4 Linkage of food consumption data to concentration data
Linking of foods consumed to foods analysed is an important step in dietary exposure assessment (Appendix B). As acrylamide was analysed in foods as they are consumed and not in RACs, foods as consumed were directly linked to acrylamide concentrations in foods analysed. For OTA, this linking was also partly applied due to limited concentration data (e.g. food group ‘nut’ consists of almonds, cashew nuts, coconut, hazelnut etc).
Due to the large number of foods consumed and the small number of foods sampled for acrylamide or OTA, the consumed foods were classified into groups
which corresponded best with the analysed foods. For this the same approach was taken as in the young children’s study (Boon et al., 2009) and was mainly based on similar ingredients and characteristics of foods as those analysed, and included expert judgement. New NEVO used in the DNFCS 2007-2010 were assigned to the relevant groups based on these criteria. As a result, an equal (mean) acrylamide or OTA concentration was assigned to all consumed food products in a specific food group (e.g. different types of crisps such as oven baked crisp, tortilla crisps for the food group crisps). The uncertainty in the exposure assessment associated with this will depend on the homogeneity of the different groups. The range in acrylamide or OTA concentration in foods could however be large. Recently, Konings et al. (2010) calculated the 24-h
acrylamide intake based on mean acrylamide concentrations per food group (e.g. food groups chips, crisps, Dutch spiced cake) and compared this calculated acrylamide intake with the actual acrylamide intake measured in a total number of 39 duplicate diets. Results showed a good correlation between the analytically determined acrylamide content and the calculated acrylamide content
(Spearman’s correlation coefficient 0.82; P<0.001) (Konings et al., 2010). Furthermore, fluctuations in daily concentrations are assumed to average out in the long run. As in our study a chronic exposure assessment was performed, the mean concentration of the substances (e.g. acrylamide) in a specific food (group), in stead of the individually measured concentrations, was used. In addition to classifying the consumed foods in similar food groups, OTA concentration data were further linked to the food consumption data using the conversion model, as OTA was mainly measured in RACs. Also the nitrate concentration data can not be linked directly to the consumption data and subsequently the conversion model was also applied for the exposure
assessment of this compound. The conversion model converts foods as eaten in RACs resulting in consumption patterns at RAC level. These consumptions can subsequently be linked to concentrations analysed at this level. The conversion model is therefore an essential tool to use monitoring concentration data of RACs for risk assessment purposes. Presently foods as eaten are converted to a fixed (weight) fraction of a certain RAC per food. It should however be realized that food conversion percentages very likely vary. For example, the percentage of nuts in different ‘Bread nuts whole meal’ will vary between bread recipes. Apart from this variability, there is and always will be uncertainty regarding food conversion. Currently neither the variability nor the uncertainty of the food conversion is quantitatively addressed in exposure assessments.
Current knowledge on the uncertainty concerning the linking of consumption and concentration data is limited. Hence characterization and quantification of the uncertainty associated with this step is important to examine in future research.
4.1.5 Exposure assessment
For modelling of the long-term exposure of acrylamide, nitrate and OTA, the statistical BBN model was used (de Boer et al., 2009). Statistical models that estimate the long-term exposure by correcting for the within-person variation, such as BBN, can however only be applied when the condition of normality of the logarithmic transformed positive daily exposure distribution is approximately met (de Boer et al., 2009). This assumption should therefore always be checked by using, for example, the normal quantile–quantile (q–q) plot, a graphical display of residuals. This graphical method was found preferable to the use of formal lack-of-normality significance tests (de Boer et al., 2009).
Using the q-q plot, it was ascertained that the conversion for acrylamide, in contrast to that for nitrate and OTA, was not optimal for both populations (Figure 4-1AB). Because of this the acrylamide intakes at the higher percentiles were very likely slightly overestimated, given the deviation from normality of the logarithmically transformed positive exposure distribution (difference between the black line and blue graphs in Figure 4-1). However, to which extent is unclear. Presently, no models are available to estimate the long-term exposure based on transformed positive daily exposure distributions that are not
approximately normally distributed. In those situations, a simpler approach can be used, like the OIM (Observed Individual Mean) approach in which all daily exposures are averaged per individual. The OIM model however produces a distribution of individual exposures which is more variable than the true long- term exposure. Consequently, high percentiles in the OIM distribution are expected to be even more conservative (Boon et al., 2011). We therefore used the BBN model.
A A
B B
Figure 4-1. Distribution of the daily exposures in children aged 7 to 15 years (A) and (young) adults aged 16 to 69 years (B) to acrylamide in the
Netherlands after a logarithmic transformation performed with the long-term exposure model BBN, including the best fitting normal distribution indicated in black (left) and the corresponding q–q plot (right) of residuals.
For the current exposure assessments, the individuals of the DNFCS 2007-2010 were divided into two groups dependent on the age, i.e. 7 to 15 years or 16 to 69 years. Due to the overrepresentation of children in the food consumption database the data are not directly suitable to assess the exposure for the total target population living in the Netherlands. For this weighing factors for age are needed. Since no statistical tool for this is presently available for food safety purposes, we performed a separate assessment for children and adults. Also children are known to have a higher exposure after correction for body weight. However, for compounds that are toxic on the long-run the interest may ultimately be an estimate of the life-long exposure. Development of a model that allows the use of weighing factors (for age, but also for other possible variables like socio-demographic factors and season) to extrapolate the exposures to the general population is therefore recommended.
As the (young) adult group covers a wide age class, possible age-dependent differences in intake as a result of age-specific consumption patterns average out within this large group. An alternative approach to assess the exposure would be to model the exposure using age as a co-variable. In this way, age-dependent differences in exposure could be studied more precisely. However, the interest in this study was the long-term exposure. The relevance of
somewhat higher exposure levels during a certain period of time will depend on the toxicity of the substance. This was outside the scope of this project.
In the assessment we quantified, by the use of 95% confidence intervals around the percentiles of exposure, the uncertainty due to the limited size of the
dataset for both the concentration and food consumption data via a bootstrap analysis. However, the other sources of uncertainty as discussed above (e.g. linkage concentration and consumption, over- or underreporting of food consumption, etc) cannot yet be quantified in this way and are not included in this confidence interval. EFSA has proposed a semi-quantitative way of assessing the overall direction of the uncertainty in the overall exposure estimate due to these ‘unquantifiable’ sources of uncertainty (EFSA, 2006a). Such a qualitative analysis of different uncertainty sources was performed in the young children’s study (Table 8-2 in Boon et al., 2009). The results reported are (partly) also applicable to this study. For OTA, the same results are applicable. The exposure to OTA will be most likely conservative due to the use of (partly) targeted monitoring data to assess the exposure, the use of screening methods with high LORs, the (subsequent) high number of non-detects and the use of this high LOR to calculate the mean OTA concentrations. For acrylamide the concentration data used were not updated in this study. Due to continuing mitigation measures resulting in lower acrylamide concentrations in foods, the exposure may have been overestimated in this study. The nitrate concentrations were also for a large part not updated. Furthermore, the data was rather scarce for the majority of foods. The effect of this on the exposure could either be over- or underestimation.
4.2 Risk assessment
As an update of the toxicity data based on an extensive review of the scientific literature was outside the scope of this report, the risk assessment for
acrylamide, nitrate and OTA was performed by comparing the calculated human dietary exposure from the present study with the established substance-specific toxicological points of departures as described in Boon et al. (2009).
To assess whether there is a possible health risk related to the three substances or not the steps of the risk assessment procedure as applied in the young children’s study was used (Figure 2-2 of Boon et al. 2009). The exposure level used for the risk assessment of nitrate and OTA was the P99 level of exposure, as in the young children’s study. For acrylamide, the MOS for neurotoxicity was compared to a value of 100 and the MOE for carcinogenicity to a value of 10,000 (EFSA, 2005).
Based on the point of departure for neurotoxicity, the MOS for the estimated P99 of exposure to acrylamide in the children population was slightly below but close to 100 (i.e. 95; Table 3-2). As a NOAEL is highly dependent on the design of a toxicity study, a different experimental design would result in a different NOAEL3. For the genotoxicity and carcinogenicity, the calculated MOEs were
again far below 10,000, endorsing the high priority for risk management of this substance.
As described in Boon et al. (2009), results from epidemiological studies did not show that acrylamide is a strong carcinogen in humans. Also information was lacking on the mechanism responsible for the carcinogenic effect. Therefore, it was not possible to draw firm conclusions on possible health risks in that study. A review of the scientific literature is needed to establish whether there have been new developments regarding the toxicity of acrylamide since the publication of Boon et al. (2009) that would make firmer conclusions about health risks possible.
For nitrate, the P99 of exposure did not exceed the ADI (Table 3-3), including the 97.5% upper confidence limit. The ADI of nitrate used in the young children study was based on growth depression observed during subchronic dog and chronic rat studies. It can be questioned whether this particular toxicological endpoint is relevant for the adults in the study population, and whether an alternative ADI (based on the second most sensitive endpoint) should be used for this age group. As the nitrate exposure was below the ADI for both
subpopulations, this issue can be left aside.
Apart from growth retardation, nitrate intake, via nitrite formation, may result in the formation of methaemoglobin. This effect of nitrate intake was however not considered here, since this effect is only relevant for infants up to the age of 3 months (Boon et al., 2009).
Another relevant effect of nitrate is the endogenous formation of nitrosamines upon dietary exposure to nitrate. Recently, Zeilmaker et al. (2010) described an
in vitro model in which the formation of the nitrosamine NDMA was observed
after gradually adding nitrite to food samples. Human health based limit values (i.e. virtual safe dose, VSD) for both chronic as well as short-term exposure were estimated using dose-response modelling (Zeilmaker et al., 2010). EFSA (2008) indicated that when nitrate is consumed in a normal diet containing vegetables, other bioactive substances concomitantly consumed, such as the antioxidant vitamin C, may inhibit the endogenous formation of nitrosamines (EFSA, 2008). As in the present study the intake of concomitantly consumed
3 Using dose response modelling, Bokkers et al. (2009) derived a BMDL
05 of 0.05 mg/kg bw/d based on a 2-generation mice study in which a NOAEL for neurotoxicity of 3.1 mg/kg bw/d was established by JECFA (Bokkers et al., 2009; Chapin et al., 1995; FAO/WHO, 2006). Based on this BMDL05, the calculated MOS for neurotoxicity could have been below 100 for all percentiles in both populations.