OPTIONS FOR THE ROAD FREIGHT SECTOR TO MEET LONG TERM CLIMATE TARGETS Anco Hoen PBL Netherlands Environmental Assessment Agency Barry Zondag Significance 1. INTRODUCTION
Growing concerns over climate change have resulted in the formulation of targets for greenhouse gas emission reduction by governments, worldwide. The transport sector is responsible for approximately 20% of total European CO2 emissions, the greenhouse gas that is assumed to be the primary contributor to global warming (IPCC 2013). To achieve long-term climate goals, the European Commission aims for a 60% reduction in CO2 emissions from transport (EC 2011a).
Road freight contributes by about 30% to transport-related CO2 emissions in Europe and this share is expected to grow without additional policy measures. This increase in emissions is mainly the result of increasing road freight traffic (EC 2014). The road freight sector is of particular interest in the research field of mitigation measures, since it is generally seen as a much more challenging sub-sector than passenger road transport when it comes to reducing CO2 emissions (PBL 2009).
This paper derives the policy gap for CO2 emission reduction in the road freight sector and reviews the potential of two pathways to fill this gap: technological (drive train) options and logistic efficiency improvement. It distinguishes between short- or medium- and long-distance freight transport, as mitigation options for both dimensions may be very different.
We assessed the extent to which these two pathways have the potential to fill the policy gap, and which gap remains. The paper is structured as follows. The following section presents an overview of future EU trends in CO2 emissions for the transport sector as a whole and road freight transport in particular. The trend is set against the climate targets in order to assess the policy gap.
Section 3 continues with an assessment of technical mitigation options. The potential of improvements to the internal combustion engine and the
introduction of electric drive trains (with either battery or fuel cell technology) are discussed.
Section 4 discusses the potential of logistic efficiency improvements. There is an ongoing debate on the reduction potential of improvements in logistic efficiency. Some people, often researchers, claim that inefficiencies in distribution processes are high, and improvements could lead to a reduction in mileages (and CO2 emissions) of up to 20% or more. Others, mainly those in the road freight sector itself, claim that the sector is already very efficient as each additional kilometre driven leads to higher costs which the sector will try to avoid at any cost since competition is high and profit margins are small. We try to shed more light on this discussion by decomposing it into the relevant aspects, such as load factors and the ability to increase economies of scale (size of vehicle stock firms, volume of shipments between regions) and the effects of price incentives.
Findings in this paper are based on literature review, data analysis and expert interviews with several stakeholders in the field of road freight transport and experts on logistic efficiency in Belgium and the Netherlands.
2. THE CHALLENGE
2.1 Emission projection and climate goals
The European Commission has committed itself to a maximum increase in global temperature of 2 degrees Celsius. This would require EU-wide CO2 emission reductions of 80% to 95% (EC 2011b). There are also specific targets for the transport sector, such as 60% CO2 reduction by 2050, compared to 1990 levels (EC 2011).
The question we asked ourselves is how this overall transport target would translate to the road freight sector. To answer this question we started by comparing three European emission projections:
‐ RP2011, the reference projection used in the impact assessment that accompanies the White Paper on transport (EC 2011c);
‐ RP2013, the most recent reference projection by the EC published in 2013 (EC 2013);
‐ BP2014, the baseline projection which has not yet been published (EC forthcoming).
There are several differences between these three emission projections. The most important ones that effect CO2 emission levels are the following: The RP2011 not yet takes into account any drops in transport volumes caused by
the economic crisis over the period from 2008 to 2010. Both RP2013 and BP2014 do take the recession into account. RP2013 differs from BP2014 in the sense that the latter assumes only policies that are currently in place, whereas the former assumes that sufficient policies are put in place to meet the 20-20-20 targets1. The biggest difference between the outcomes is that BP2014 has higher volumes (growth in tonne-kilometres) then RP2013, while RP2013 assumes higher efficiency improvements. The end result is that the final energy demand (and CO2 emissions) projected for 2050 in both projections is very comparable. Moreover, differences between the RP2011 and the more recent RP2013 and BP2014 are not substantial, in the long term, since the temporary drop in volume growth due to the recession will be largely compensated for by continuous volume growth in the period following the recession.
The overall picture is that, between 1990 and 2050, road freight transport volume will grow by roughly 150%. We ignored the efficiency improvements included in the reference projections, as the purpose of our paper was to assess the potential of efficiency improvements compared to business as usual. In this way we avoided double counting.
2.2 Policy gap
Although we thus knew what the expected increase in transport volumes, final energy demand and CO2 emissions were, we had not yet answered the question of how large the policy gap is for the freight transport sector. This clearly also depends on the level of CO2 emission reduction in other transport modes. Since this is unclear, we felt it was best to present the target under several different assumptions.
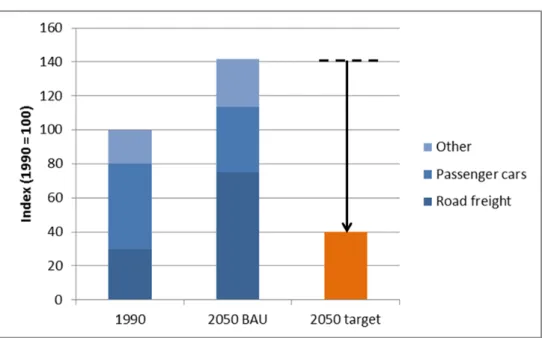
As we already mentioned, in 2010, road freight transport was responsible for approximately 30% of CO2 emissions from transport. Passenger road transport was responsible for 50% and non-road transport for the remaining 20% (EC 2013). These shares were very similar to those of 2000 and 1990. However, there will be a shift in these shares up to 2050, where passenger cars will have a share of roughly 40%, road freight transport 35% and non-road transport approximately 25%. This shift primarily will be the result of CO2 emission legislation that is already in place for passenger cars and vans. Figure 1 depicts these shares along with the projected increase in CO2 emission up to 2050, and also includes the emission reduction target for 2050.
Figure 1 Projected increase in transport-related CO2 emissions, between 1990 and 2050, and the 60% reduction target for 2050
Figure 1 makes clear that even with substantial emission reductions for passenger cars and the non-road-transport sector, there is a substantial gap between the 2050 target and the expected increase in CO2 emissions. To be more precise, in the highly unlikely event that CO2 emissions from passenger cars and non-road transport could be reduced to zero, the 60% target would still require a 50% reduction in heavy-duty road-transport emissions. Clearly, the task for heavy-duty road vehicles would become greater if the other transport modes cannot reduce all of their CO2 emissions. To illustrate this, if non-road transport would be able to reduce its emissions by 20% and passenger cars by 95% (which would require an almost complete transition to zero-emission vehicles), the task for heavy-duty road transport would increase to 80%. And when reductions in non-road transport emissions prove to be too difficult to mitigate (which is not unimaginable, considering the international character of a large share of these emissions) the required reductions would soon rise to 90%.
This illustrates that the long-term target for the road freight sector is very challenging and will require CO2 emission reductions in the range of 60% to 90% from reference scenario levels, provided passenger cars and/or non-road transport will also be able to cut their emissions substantially.
2.3 Routes for emission reduction
After we had obtained a broad idea of the magnitude of the challenge for road freight transport, we reviewed the options for emission reductions. With
respect to climate mitigation measures in transport, three broad pathways can be distinguished:
1. less CO2/MJ (zero or low carbon energy carriers); 2. less CO2/km (vehicle efficiency);
3. fewer kilometres (volume).
Biofuels, for a long time, have been seen as the most viable and easy solution to reduce CO2 emissions from freight transport. However, biofuels have lost momentum over the last years, due to food-competition issues and indirect land-use effects which have given rise to doubts about the real CO2 reduction potential and about their ‘sustainability’ (CE 2013). For this reason, we excluded biofuels as a mitigation option from our analysis, to see what emission reductions would be feasible if biofuels would play no role or only a marginal one, in the long term.
As a consequence we will focus on pathway 2 and 3. Pathway 2 is discussed in section 3 and will give an overview of recent literature regarding vehicle efficiency. A distinction will be made between efficiency improvements for the internal combustion engine (or conventional diesel engine), and alternative drive trains such as battery or fuel cell technology. Section 4 will look into the option of reducing freight kilometres and ton kilometres through increased logistic efficiency.
3. TECHNICAL MEASURES FOR IMPROVING EFFICIENCY 3.1 Current policies and ambitions
For passenger cars and vans there are CO2 emission standards in place that require manufacturers to reduce the CO2 emissions of new vehicles. For Heavy Duty Vehicles2 (HDVs) no such legislation currently exists. Recently the European Commission has set out a strategy to curb CO2 emissions from these Heavy-Duty Vehicles (HDVs) over the coming years (EC 2014). The strategy focuses on short-term action to certify, report and monitor HDV emissions since CO2 emissions from HDVs are currently neither measured nor reported. This a particularly important hurdle to overcome before discussion on limit values can start. Currently there is very little information available on the real world fuel consumption and CO2 emissions of heavy duty vehicles. This is not surprising if we consider that there are many different types of heavy duty vehicles and, more importantly their energy consumption performance will depend strongly on the load factor, i.e. types of goods
carried and the amount of goods transported. Load factors are also an important issue in the discussion on logistic efficiency improvement which we will discuss in section 4.
Once a proper energy and emission monitoring system is in place the European Commission sees mandatory limits on average CO2 emissions for newly-registered HDVs as the most logical next step. Such a system would likely be very comparable to the system that is already in place for passenger cars and vans.
3.2 Potential efficiency improvements for the internal combustion engine
The two most recent sources that give an overview of technical options that can reduce fuel use of conventional (internal combustion) vehicles are TIAX (2011) and Ricardo (2011). Both have looked at pretty much the same fuel saving-options. The TIAX study is in fact in large part a review of and extension on the Ricardo study. The technological options considered are (TIAX 2011):
‐ aerodynamics: streamlining of vehicles and trailers of tractor-trailer combinations;
‐ light weighting: material substitution to achieve weight reductions;
‐ tires and wheels (reduced rolling resistance): low rolling resistance tires, wide-base
‐ tires, and automatic tire pressure adjustment;
‐ transmission and driveline: technologies applied to automatic, manual, and automated manual
‐ transmission baselines;
‐ engine efficiency: higher cylinder and fuel injection pressures, advanced turbocharger geometries, improved controls, heat recovery, electrification of accessories, and higher peak thermal efficiencies; ‐ hybridization: electric and hydraulic hybridization.
Comparing the reported efficiency improvements between both studies is somewhat problematic since they adopt quite different business as usual (BAU) scenarios. The most apparent difference is the autonomous efficiency improvement of almost 20% between 2010 and 2030 assumed in Ricardo (2011). CE (2012) has carried out a comparison between both studies and concludes that differences between both studies are in fact small when the differences in assumptions for the baseline are compensated for. CE (2012) also concludes that TIAX uses slightly more accurate and up-to-date
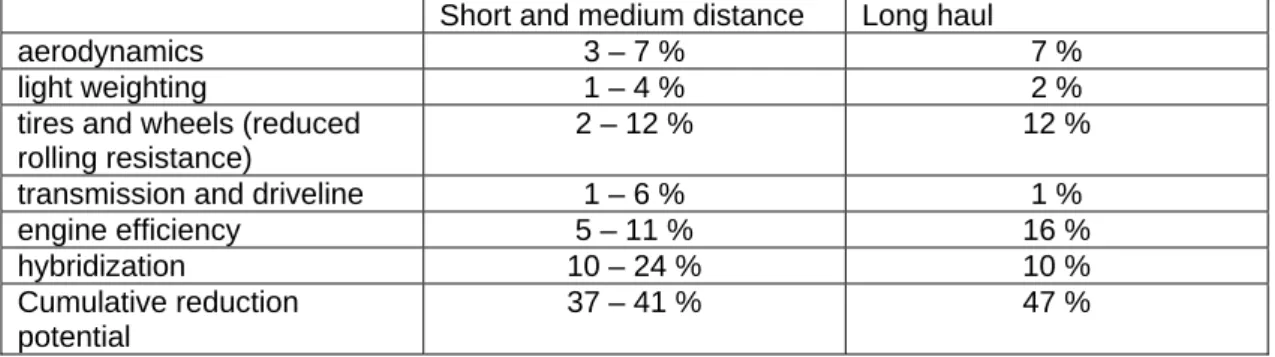
assumptions and data. We follow this conclusion and therefore only show saving-options from TIAX (2011), see Table 1.
Table 1 Relative reduction potential of main fuel-saving options in Europe
Short and medium distance Long haul
aerodynamics 3 – 7 % 7 %
light weighting 1 – 4 % 2 %
tires and wheels (reduced rolling resistance)
2 – 12 % 12 %
transmission and driveline 1 – 6 % 1 %
engine efficiency 5 – 11 % 16 %
hybridization 10 – 24 % 10 %
Cumulative reduction potential
37 – 41 % 47 %
Source TIAX (2011) summarized by PBL
As Table 1 shows TIAX (2011) conclude that the total reduction potential is in the range of 40 to 50% for both short/medium and long haul freight vehicles. The differences per technology option differ quite substantially however. Long haul vehicles can benefit more from energy conserving tires due to their higher mileages. Short/medium distance vehicles benefit more from hybridization since they will typically drive fewer kilometres with constant speeds.
A 40-50% reduction is quite substantial. We may raise the question however whether this technical potential can be converted into a real world reduction. This question may in part be answered by examining the costs of the fuel-saving options. CE (2012) has calculated marginal abatement cost curves for the options identified in the TIAX report. For short and medium distance trucks they find that a reduction of up to 44% is cost-effective from an end-user perspective. For long-haul trucks abatement options of up-to 36% are cost-effective. These percentages apply however for the entire life-time of the vehicle. Due to ‘consumer myopia’ buyers/users of these vehicles typically want to earn back fuel savings over a period of three to four years instead of the entire life-time of the vehicle. In that case abatement potentials of only 10% for short and medium term trucks are cost-effective. For long haul trucks a shorter time horizon has less impact: abatement options of up to 33% are cost-effective (CE 2012).
But even if cost calculations showed that these up-front costs can be fully compensated transport companies may be hesitant to invest in them. This hesitation is likely to increase if investment costs are higher, earn back periods are longer and technologies are less proven. The fact that heavy duty vehicles fuel consumption per kilometre has remained almost stable in the last
25 years may be an indication of this hesitance, since some of the options shown in Table 1 were already available (TIAX 2011).
3.3 Alternative drive trains
There are alternatives to the internal combustion engines. Electric drive trains (also called battery electric vehicles) are a very promising option to reduce CO2 emission from light duty vehicles. For heavy duty vehicles electric drive trains are generally less feasible. This has to do with their relatively high energy consumption for which larger battery packs are needed. This is especially the case for larger long haul trucks due to the high per-kilometre energy consumption of heavy vehicles and their high daily operating range (CE 2013). Large battery packs would considerably increase vehicle costs and consequently the overall costs of freight transport. A specific concern of alternative drivetrains as seen by truck manufacturers is the increase in vehicle weight. Many alternative drive trains lead to additional weight, at the expense of vehicle payload (CE 2013).
For short distance transport nevertheless, battery electric technology is a feasible option, as distribution trucks generally have lower daily driving distances, and recharging can occur at scheduled downtimes (CE 2013). Moreover, the operating costs of light-duty trucks are not expected to vary largely between conventional and electric engines (Zondag et al. 2013). Electric city distribution gives a strong incentive to use urban consolidation centres to transfer the long distance transport by large heavy duty vehicles into lighter heavy duty vehicles (gross vehicle weight between 3.5 and 10 tons). Such transhipment results in additional costs but also gives the opportunity to consolidate flows and save costs by increasing the utilization factor of vehicles (Zondag et al. 2013). Although the overall effects are hard to estimate, it would seem that electric city distribution is feasible. Following estimates from Zondag et al. (2013) with respect to changes in transport activity we estimate a 5 to 10% reduction in CO2 emission reduction from electric city distribution.
Fuel cell trucks could be a viable long term option, particularly for long haul applications, because of the superior driving range compared to battery electric drivetrains. Electric drive-trains may even be an option for long haul trucks if the energy supply is integrated in the infrastructure either through overhead catenary infrastructure or dynamic inductive infrastructure (CE 2013).
There are two major uncertainties that determine whether alternative drive trains will have a large market share on the long term. First, the costs of both the electric (particularly the batteries) and fuel cell drive train will have to drop significantly in order to be a viable alternative to conventional technology. And even then these abatement options would be higher than the marginal abatement cost curves we discussed in the previous paragraph, meaning they are not cos-effective from an end-user perspective. Second, alternative drive trains require major investments in energy infrastructure, especially for long haul applications especially (CE 2013).
If these drivetrains do get a dominant market share emission reductions of up to 90% compared to current levels are possible (CE 2013). Obviously, the energy carriers (electricity and hydrogen) would have to be produced with a low carbon intensity to have the maximum benefit in terms of CO2 reduction.
3.4 Conclusion on technical potential
We have argued in this section that technical options, particularly advanced drive-trains such as hybrid, battery electric and fuel cell can drastically reduce CO2 emissions of freight transport on the long run. If the maximum technical potential is fulfilled a 90% reduction is feasible. This would most likely be sufficient to reach the 50 to 80% overall CO2 reduction in road freight transport that would be required to meet the overall transport goal of 60% reduction compared to 1990.
As we have already argued we must be careful in drawing such conclusions. The maximum technical potential would require investments which are not cost-effective from an end-user perspective. The success of these technologies (particularly electric and fuel cell drive trains) depends highly on cost developments. These costs however can significantly drop only if mass-production levels are reached. Obviously mass-mass-production will only occur if demand for these technologies increases substantially.
But even if cost calculations would show that these up-front costs can be fully compensated due to fuel savings transport companies may be hesitant to invest in them.
One might argue that if climate goals are considered to be important that governments can impose legislation that requires transport companies to adopt fuel efficient technologies. This however doesn’t negate the fact that such legislation will impose up-front costs for these companies. We will see in the next section that cost levels are of vital importance to transport and
distribution companies since profit margins are small. This tells us that any measure that imposes additional costs is not likely to be greeted with enthusiasm by the freight transport sector. The bottom-line is that such push-measures would require a wide scale implementation, ensuring a level playing field for transport companies.
All in all we feel that the realistic potential of technical options is probably somewhere around 20%. Additional reductions would require increasing financial support from governments.
4. LOGISTIC EFFICIENCY 4.1 Logistic CO2 efficiency
In the Netherlands, and elsewhere, there is an ongoing debate on the reduction potential of improvements in logistic efficiency. Some people, often researchers, claim that inefficiencies in distribution processes are high and improvements could lead to substantial reductions in costs and CO2 emissions (Rothengatter, 2009; Ruijgrok, 2012). Others, mainly the road freight sector itself, claim that the sector is already very efficient as each additional kilometre driven leads to higher costs which the sector will try to avoid due to fierce competition. So far the debate has been confusing and it is especially hard to find a common definition and acceptable indicators to assess the performance of the very heterogeneous road freight sector.
The first issue is the definition of logistic efficiency which is often related to logistics costs. This is in line with the often applied theory of ‘shipment size optimization’ (Mc Fadden et al. 1986; de Jong and Ben-Akiva, 2007). This theory focuses on minimizing the combined storage and transportation costs. In this paper we focus on the contribution that the road freight sector can make to reduce its CO2 emissions, and efficiency is defined accordingly. If transporting a shipment between production site A and consumption site B can be done with 20% less CO2 emissions than the logistic efficiency increases with 20%, provided the CO2 reduction is not the result of the use of more efficient drive trains. Although there is a substantial overlap in logistic efficiency in terms of costs and CO2 emissions, as vehicle mileages, transport costs and CO2 emissions are related, there are also substantial differences especially regarding the role of storage costs.
If we decompose road freight transport in its most relevant aspects, affecting the CO2 emissions by shipment, the main aspects are:
‐ the load factor of these vehicles, and ‐ the share of empty vehicle kilometres.
The optimal combination of these elements varies by type of transport, geographical connections and options of the carrier (e.g. vehicle stock). For example, a fully loaded heavy duty vehicle is more efficient than using two fully loaded light duty vehicles. Vice versa a light duty vehicle is more suitable to transport a small shipment than a heavy duty vehicle. A company owning a large and diversified vehicle stock, has other options to optimize than a driver owning one truck.
Despite the impacts of the other variables, such as empty vehicle kilometres and types of vehicles, there is in the policy debate often strong focus on the low load factors of the trucks as a single measure for efficiency. In the Netherlands the load factor for trucks, expressed in ton km versus deadweight of vehicle km, is around 40%. The load factors differ widely by type of transport and product type and it does not make sense to use a single indicator and target for the whole sector (TLN, 2013). For example, waste collection transport can hardly have a load factor of above 50% as it makes sense to start with an empty vehicle. Furthermore some product types are not weight but volume restricted (e.g. chips or electronic products), meaning the truck is full in terms of volume, but its load factor is below 100% due to the low weight of these goods.
In our view an integrated approach is needed to study the main aspects influencing logistic efficiency. Performing such analysis at the micro level offers the best potential for an empirical verification of theoretically assumed scale and scope advantages. The interaction between the aspects of choice of mode (or vehicle type) and choice of shipment size has been well-documented in the literature (McFadden, 1986; Holguin-Veras, 2002). A study by Abate and de Jong (2014) investigates, by using micro data, how variations in route/haul, carrier and vehicle characteristics affect the optimal vehicle size choice and the associated shipment size. Among others this study confirms the prediction of shipment size theory that trip distance and total freight demand have significant positive effects on shipment size choice resulting in more consolidated truck loads. Put differently, firms realize economies of distance by using heavier vehicles for longer trips and economics of scale by hauling larger quantities (Abate & De Jong 2014).
We have assessed the potential of various road freight market segments to improve their CO2 efficiency based on literature review, data analysis and expert-interviews held in The Netherlands and Belgium. For each market segment we have looked at the existing situation and options to optimize the logistic efficiency in this segment. The options are supported by basic theoretical principles, as increasing scale of the transport volumes and vehicle stock size, which enables more efficient vehicle type and shipment size choices.
Realizing these options often require the co-operation of several actors which in practice is complicated. Vertical co-operation between shippers (e.g. producers like Nike or Heinz) and/or receiving parties (e.g. supermarkets) offers the opportunity to increase the transport volumes and reduce the share of empty vehicles by rearranging return loads. The increased transport volumes offer the opportunity to apply more efficient vehicles and/or to increase the load factors of the vehicles. Horizontal co-operation or mergers between carriers increases both the transport volumes and the vehicles stock. A larger vehicle stock facilitates a more efficient match between vehicle types and shipments.
In the tables below we again distinguish the market segments between short and medium distance and long distance international transport. For long distance transport alternative modes and higher capacity vehicles offer the main potential for logistic efficiency gains. For the short and medium distance a better matching between vehicles and shipments and consolidation options offer potential. Of the total road freight flows in the Netherlands, expressed in ton km, around two thirds is short to medium distance transport (up to 300 km) and one third is long distance transport (most of the ton km are realized outside the Netherlands and not included here).
Table logistic efficiency potential short and medium distance road transport
Market segment Description Potential City centre supply potential ++
Still characterized by many small players and individual shops optimizing their logistics within their own constraints (e.g. individual optimization of shipment size and regular use of private transport means).
Urban distribution centres can offer in theory an efficient supply of inner-cities. Heavy duty vehicles can be used to supply the centres and high frequency light duty vehicles can be used to supply the shops (Binsbergen et al., 2001). In practice several cities in the Netherlands have such facility
(http://www.binnenstadservice.nl/english) Cooperation between companies in the same sector or transporting similar
product types. Government initiative and ICT platforms can support exchange of knowledge.
Use of logistic expertise to balance the negative impacts on logistic efficiency of local environmental policies like time windows and vehicle type restrictions in urban areas (Hans Quack, 2008). Supermarkets
supply
potential ±
Professional market segment with large players and the three main holdings have a market share of 80%. Strong focus on reliability, also to match logistics and staff planning, and low costs.
The transport between distribution centre and supermarket is already very
professional and small gains can still be realized by ongoing move towards high capacity vehicles with two layers. The transport between producer and distribution centres and transport between distribution centres offers more potential. The large network of suppliers offers opportunities to use one way logistic concepts reducing the amount of empty vehicle kilometres. Backhauling, supermarkets picking up their products at the gates of the factories, might be an upcoming logistic trend.
National dry and liquid bulk cargo
potential -
This is a diverse segment (e.g. the supply of gas stations, construction-related transport, industrial
transport). The transport flows are often one way and mixing of product types is often forbidden.
In many cases the options to consolidate shipments or to arrange return loads are limited. In case of longer distances multi-modal options can be efficient
alternatives.
Last mile distributions
potential ++
This segment includes various transport types like delivery, return and waste flows. This market segments is very fast growing as part of the growth in e-commerce. Characteristics are that the market is demand driven as part of the services of the shipper (often free of cost and delivered within 24 hours).
Financial incentives can be applied to increase the efficiency (consolidating of shipments, better routing) of this type of transport (e.g. delivery within 3 days is cheaper than within 1 day). However this requires a change in the market and acceptance of direct payment of the shipment costs by the clients. The delivery of packages of various companies in the same street can be more efficient by a co-operation between carriers.
Further government interventions might be expected in this market segments as it influences urban living conditions.
Table logistic efficiency potential long distance road transport Market segment Description Potential International long distance transport potential ±
International long distance transport can be
characterized by relative large and professional carriers. In practice return trips are only partly paid and arrangement of return loads is a necessity. A further scale increase can be expected in the coming decade.
The use of higher capacity vehicle offers efficiency gains, however in several countries legislation is still under discussion. An alternative technological development is the use of automated trucks platooning in groups (one or two automated trucks behind an occupied vehicle).
The trans-European networks can become more and more a type of super networks connecting large scale European hubs. These connections are often multi-modal and offer the
opportunity to apply synchro-modality concepts in practice.
4.3 Conclusions on logistic efficiency potential
Experiences with the so-called ‘lean and green award’ program illustrate that many companies are capable of realizing the target of a 20% reduction in CO2 emissions within a period of five years (Connekt 2014). In the award program calculated CO2 reductions are independently verified and the 20% target is often realized within a few years by rationalizing logistic processes and/or seeking co-operation. Still we would like to note that measuring CO2 emissions is often difficult and these figures need to be treated carefully. A survey of the top 100 logistic service providers in the Netherlands (Verweij, 2013) shows that 30% believes that a 20% reduction in CO2 is possible, 30% believes that a reduction is possible but 20% is somewhat high and 25% thinks that this is not possible as it is not important enough for their clients.
Research also shows that logistic costs and CO2 reductions can be realized by collaborative networks (Groothedde et al, 2005; Binsbergen et al. 2001). In the work of Groothedde this is largely realized by shifting consolidated flows to modes that are better suited for handling large volumes, so economies of scale can be obtained. Ruijgrok (2012) estimates, based on the dissertations of Groothedde (2005) and van der Vlist (2007), that there is potential for a 20 to 40% reduction in logistic costs. However to realize these reductions several uncertain conditions apply, namely sufficient priority for logistics at a management level, sufficient trust between companies to co-operate efficiently and share the benefits and sufficient scale and professionalism of carriers.
Considering the literature and experts interviews we belief that logistic CO2 efficiency gains of up to 20% are feasible on the long run (2050), without structural changes in the logistic sector. The sector will benefit of ICT developments offering better information on the location and timing of vehicles and shipments and the options to co-operate. More structural changes, such as increasing scale of logistic companies in the sector, seems necessary for reductions above 20%. The larger companies can benefit from economies of scale since they have more consolidation options and more choice options for the vehicles, and because they are financially more capable to invest in innovations. In addition their larger and professional staff is better able to manage network relationships with shippers and other carriers. We strongly support the idea to verify these theoretical arguments with empirical data and believe that the micro level offers the best opportunity to do so.
Pricing policies are often considered to be an incentive to improve influence logistic efficiency. An international review study of Significance and CE Delft (2010) indicates that the price sensitivity of European road freight transport differs by type of price changes (fuel, vehicle km or ton km) and type of impact (fuel use, vehicle km and ton km). If we consider the sensitivity of changes in vehicle km price (e.g. toll) on vehicle km a best-guess price elasticity of -0.9 is presented. Of this elasticity roughly two third (ton km -0.6) is a demand effect (i.e. fewer tonne-kilometres and one third is an efficiency effect (vehicle kilometres -0.9 including fewer tonne-kilometres). Please note that the variable vehicle costs (excluding labour costs) account for no more than 33% of the total vehicle costs. This means that price increases in variable costs need to be large, beyond the range from which these elasticity’s have been derived, to realize substantial efficiency impacts. Furthermore these price increases will have severe demand impacts as well.
5. CONCLUSIONS AND DISCUSSION
This paper set out to seek the CO2 reduction potential of technical and logistic efficiency gains in the road freight sector. We show that meeting long term European climate targets requires a CO2 reduction in this sub sector of 60-90%, assuming other transport modes substantially reduce their emissions as well.
This paper shows that the maximum potential to reduce CO2 emissions in this sub sector is 90%. The largest potential by far is found in technology, particularly electric drive and fuel cell drive trains. Fulfilling this potential would
require huge up front investments, particularly in the early years of technology adoption in both vehicles and the infrastructure which is required to supply these vehicles with the energy needed. Conclusions we draw from cost effectiveness calculations and interviews on the improvement of logistic efficiency give rise to believe that, particularly in the road freight sector, these investments are unlikely to be made.
A ‘realistic’ potential of technological measures and logistic efficiency in our expert judgement can achieve a CO2 reduction of 20-30% in the long run.
Higher reductions are attainable by logistic co-operation between companies and increasing scale and professionalism of carriers. This applies to both logistic efficiency gains, benefiting from scale and scope advantages, and the adoption of advanced technological options, which all benefit from a more capital intensive sector. In such a scenario a reduction of 30 to 50% in CO2 emissions may be attainable. Additional empirical work, preferable at a micro level, is needed however to validate these expert assumptions on scale and scope advantages.
In any case these reduction potentials are clearly not sufficient to meet the policy gap of 60% to 90%. This means that alternative measures will be needed to meet long term climate goals. Demand regulations and adoption of cost-ineffective measures will be required leading to costs that will have to be borne by the transport sector, consumers and/or government. We may also conclude that biofuels should not be discarded as a technological option too soon, despite discussions on sustainability, food competition, indirect land-use emissions and availability.
BIBLIOGRAPHY
Abate M., G.C. de Jong, (2014), The optimal shipment size and truck size choice- the allocation of trucks across hauls, Transportation research A, Vol 59 pp. 262–277, 2014
Binsbergen A.J. van, J.G.S.N. Visser, (2001) Innovation steps towards efficient Goods distribution systems for Urban areas, T2001/5, May 2001, TRAIL thesis series, Delft University Press, The Netherlands
CE Delft, (2012), Marginal abatement cost curves for Heavy Duty Vehicles Background report Delft : CE Delft, 2012
CE Delft (2013), Zero emissions trucks, An overview of state-of-the-art technologies and their potential.
Connekt (2014) lean and green, http://lean-green.nl/lean-and-green/
De Jong G.C., M. Ben-Akiva (2007), A micro-simulation model of shipment size and transport chain choice, Transportation Research part B, 41(9), pp. 950–965
European Commission (2011a), White paper, Roadmap to a single European Transport Area, Towards a competitive and resource efficient transport system, COM(2011) 144 final, Brussels: European Commission, 2011.
European Commission (2011b), A Roadmap for moving to a competitive low carbon economy in 2050, COM(2011) 112 final, Brussels: European Commission.
European Commission (2011c), Impact assessment Accompanying document to the White paper Roadmap to a Single European Transport Area – Towards a competitive and resource efficient transport system, COM(2011) 144 final, Brussels: European Commission.
European Commission (2013), EU Energy, Transport and GHG Emissions, Trends to 2050, Reference scenario 2013.
European Commission (2014), website
http://ec.europa.eu/clima/policies/transport/vehicles/heavy/index_en.htm
Groothedde B., (2005), Collaborative Logistics and Transportation Networks, a modelling approach to network design, T2005/15, November 2005, TRAIL Thesis Series, The Netherlands
Groothedde B, C. Ruijgrok, L. Tavasszy (2005), Towards collaborative, intermodal hub networks, A case study in the fast moving consumer goods market, Transportation Research Part E 41 (2005), pp 567–583
Holguin-Veras, J. (2002), Revealed preference analysis of commercial vehicle choice process, Journal of Transportation Engineering, 128(4), 336–346
IPCC (2013) Summary for Policymakers. In: Climate Change 2013: The Physical Science Basis. Contribution of Working Group I to the Fifth Assessment Report of the Intergovernmental Panel on Climate Change, Cambridge University Press, Cambridge, United Kingdom and New York, NY, USA.
McFadden D., Winston C., and Boersch-Supan A. (1986), Joint estimation of freight transportation decisions under non-random sampling. In: A. Daugherty, ed. Analytical studies in in transport economics. Cambridge University Press, 137–157
PBL (2009a), Getting into the right lane for 2050, PBL, Netherlands Environmental Assessment Agency, The Hague.
Quak H. (2008), Sustainability of Urban Freight Transport, Retail Distribution and Local Regulations in Cities, TRAIL Thesis Series T2008/5, the Netherlands, TRAIL Research School
Ricardo & AEA (2011), Reduction and Testing of Greenhouse Gas (GHG) Emissions from Heavy Duty Vehicles – Lot 1: Strategy Oxfordshire : AEA, 2011.
Rothengatter, W. (2009), European Transport in a Competitive Economy. Paper for Netherlands Environmental Assessment Agency.
Ruijgrok K. (2012), innovatie en duurzaamheid in de logistiek, uitdagingen en ontwikkelingsmogelijkheden voor de periode tot 2040, Preadvies voor de Raden voor de Leefomgeving en Infrastructuur, Delft
TIAX (2011) European Union Greenhouse Gas Reduction Potential for Heavy-Duty Vehicles Cupertino : TIAX, 2011
TLN (2013), Beladingsgraad van gewicht en volume, het vergelijken van lood en veren, Zoetermeer, The Netherlands
van der Vlist, P. (2007), Synchronizing the Retail Supply Chain. Erasmus Research Institute of Management (ERIM).
Verweij K. (2013), Analyse Top-100 Logistieke dienstverleners, website:
http://www.bciglobal.com/artikelen-columns_detail.asp?cat=5026&dc=26420
Zondag B., H.A. Nijland, A. Hoen, D. Snellen (2013) The electric vehicle scenario: does it get us in to the right lane and can we afford it? PBL Netherlands Environmental Assessment Agency, ETC Conference paper.
NOTES
1The proposed EU legislation '20-20-20 by 2020' (EC, 2008a; EP, 2008) calls
for a reduction of greenhouse gas emissions of at least 20 % by 2020 compared to 1990 across all sectors.
2In this paper by Heavy Duty Vehicles we mean vehicles with a gross vehicle