AnAlysing the emission
gAp between pledged
emission reductions
under
the Cancún Agreements and
the 2 °C climate target
Analysing the emission gap between pledged
emission reductions under the Cancún Agreements
and the 2 °C climate target
Analysing the emission gap between
pledged emission reductions under the
Cancún Agreements and the 2 °C
climate target
Michel den Elzen1Mark Roelfsema1 Andries Hof1 Hannes Böttcher2 Giacomo Grassi3
1 PBL Netherlands Environmental Assessment Agency, Bilthoven, the Netherlands 2 Institute for Applied Systems Analysis (IIASA), Laxenburg, Austria
Analysing the emission gap between pledged emission reductions under the Cancún Agreements and the 2 °C climate target
© PBL Netherlands Environmental Assessment Agency (PBL) The Hague/Bilthoven, 2012 ISBN: 978-90-78645-95-5 PBL publication number: 500114021 Corresponding author Michel.denElzen@pbl.nl Authors
Michel den Elzen1, Mark Roelfsema1, Andries Hof1, Hannes Böttcher2, Giacomo Grassi3 1 PBL Netherlands Environmental Assessment Agency, The Hague, The Netherlands 2 Institute for Applied Systems Analysis (IIASA), Laxenburg, Austria
3 European Commission – Joint Research Centre of the European Commission (JRC), Ispra, Italy Contributions
Michael Obersteiner2, Franziska Albrecht2, Angelica Mendoza Beltran1, Ilona Kirhensteine3, Tim Scarbrough3, Jasper van Vliet1, Detlef van Vuuren1
1 PBL Netherlands Environmental Assessment Agency, The Hague, The Netherlands 2 Institute for Applied Systems Analysis (IIASA), Laxenburg, Austria
3 AMEC Environment & Infrastructure UK Limited Acknowledgements
The project was financed by the European Commission, Directorate General Climate Action, and the Dutch Ministry of Infrastructure and the Environment. This report has benefited from the comments of Ariane Labat and Tom van Ierland (European Commission, DG Clima), and Pieter Boot, Corjan Brink, Frank Dietz and Ton Manders (all PBL). English-language editing
Annemieke Righart Graphics
Marian Abels Layout
Studio RIVM (Martin Middelburg), Bilthoven
This publication can be downloaded from: www.pbl.nl/en. A hard copy may be ordered from: reports@pbl.nl, citing the PBL publication number or ISBN.
Parts of this publication may be reproduced, providing the source is stated, in the form: Elzen, M.G.J. den et al. (2012),
Analysing the emission gap between pledged emission reductions under the Cancún Agreements and the 2 °C climate target,
The Hague: PBL Netherlands Environmental Assessment Agency.
PBL Netherlands Environmental Assessment Agency is the national institute for strategic policy analysis in the field of the environment, nature and spatial planning. We contribute to improving the quality of political and administrative decision-making, by conducting outlook studies, analyses and evaluations in which an integrated approach is considered paramount. Policy relevance is the prime concern in all our studies. We conduct solicited and unsolicited research that is both independent and always scientifically sound.
Contents
FindinGs 7
Analysing the emission gap between pledged emission reductions under the Cancún Agreements and the 2 °C climate target 8
Introduction 8 Summary 8 FuLL rEsuLts 17 1 introduction 18 1.1 Objective 18 1.2 Background 18 1.3 Method 19 1.4 Structure 20
2 reduction pledges by Annex i countries 22
2.1 Description and clarification of pledges 22 2.2 Overview of reductions 24
2.3 Main uncertainties 24
3 Mitigation action plans by non-Annex i countries 28
3.1 Description of the mitigation action plans 29 3.2 Overview of reductions 32
4 Emissions by 2020, resulting from reduction pledges in Cancún Agreements, set against 2 °c pathways 38
4.1 Four pledge scenarios 39
4.2 Expected emissions for 2020, based on pledges 39
4.3 Which emission levels for 2020 would be consistent with achieving the 2 °c and 1.5 °C climate targets? 41 4.4 How wide is the emission gap in relation to the 2 °c climate target? 43
5 risks and uncertainties that could widen the emission gap 48
5.1 Risks related to conditionality of pledges 49 5.2 Lenient or unclear accounting rules 49 5.3 Other risks 51
5.4 Uncertainties 52
5.5 Total effect of risks and uncertainties 53
6 Options for bridging the emission gap 54
7 the role of land use, land-use change and forestry accounting rules in achieving reduction pledges 60
7.1 Background 60
EEN
8 Options for dealing with Kyoto surplus assigned amount units in achieving reduction pledges 66
8.1 Background 66
8.2 Effectiveness of options for emission reductions by 2020 67
9 Overview of reductions by the ten largest emitting countries 70
9.1 Pledges by Annex I countries 70 9.2 Pledges by non-Annex I countries 78
10 Conclusions 92
references 94
Appendix A. Model description and assumptions 99
Appendix B. Annex i reduction efforts compared with business-as-usual emission projections 102
Glossary 104
7 |
EEN
FI
N
d
IN
gs
FIN
d
IN
gs
Analysing the emission gap
between pledged emission
reductions under the
Cancún Agreements and
the 2 °C climate target
Introduction
Following the United Nations Climate Change Conference in Durban, in 2011, international climate policy has taken a further step towards agreement on legally binding commitments to reduce greenhouse gases. However, none of these commitments will be implemented before 2020. Therefore, the pledges to reduce greenhouse gas emissions as put forward by Parties in the Cancún Agreements (2010) still hold. These pledges have a voluntary nature and, therefore, a route of ‘pledge and review’ will be followed until 2020. This report reviews the country pledges and presents answers to several
questions around this subject. What would be the emission level by 2020 if pledges indeed are achieved? How much do these pledges contribute to the long-term target of limiting global warming to a maximum of 2 °C? What are the risks of widening the emission gap between the proposed levels and those necessary for reaching the 2 °C target? Which measures could reduce this emission gap?
This report is the result of work done for the European Commission (DG Climate Action) and the Dutch Ministry of Infrastructure and the Environment.
Summary
Background and aim
• In the United Nations climate negotiations in Cancún (2010) and earlier in Copenhagen (2009), urgent action was called for to limit global warming to 2 °C. In order to reach this climate goal, countries were encouraged to submit emission reduction proposals for the year 2020 and accompanying mitigation actions. Since the climate
negotiations in Copenhagen (2009), 42 Annex I Parties (developed countries) have submitted quantified economy-wide emission reduction targets for 2020, and 45 non-Annex I Parties (developing countries) have submitted nationally appropriate mitigation actions (NAMAs) for inclusion in the Appendices to the 2009 Copenhagen Accord (UNFCCC, 2009b). Of these NAMAs, 15 contained quantified economy-wide targets. These pledges and NAMAs have subsequently been ‘anchored’ in the 2010 Cancún Agreements (UNFCCC, 2010a, b, c, d). Together, the emissions from these Annex I countries represent about 40% of global emissions (level of 2005) and for the non-Annex I countries this is about 35%. • Before the UN climate negotiations in Cancún, several
studies projected the effect of these pledges on the emission level of 2020 and compared this level with the level needed for limiting global warming to certain temperature increases (e.g. Den Elzen et al., 2010a; European Climate Foundation, 2010; Rogelj et al., 2010; Stern and Taylor, 2010; Den Elzen et al., 2011b). The UNEP Emissions Gap Report (2010) and Höhne et al (2011) provide a summary of these studies. The UNEP Emissions Gap Report (and later also its update Bridging the Emissions Gap, UNEP, 2011) concluded that the pledges for 2020 were expected of leading to emission levels of above those being consistent with a likely chance of achieving a 2 °C global temperature limit (based on cost-optimal 2 °C emission pathways). This difference between expected emission levels and those needed for limiting global warming to a certain temperature is referred to as the ‘emission gap’. • The UN climate negotiations in Durban (2011)
established a new body to negotiate a global agreement that would cover all countries by 2015. The new
agreement is not scheduled to have any effect until 2020, and therefore is unlikely to affect the level of
9
Findings |
pledges for 2020 and accompanying actions submitted in the Cancún Agreements. However, since the climate negotiations in Cancún, additional information provided by countries, especially regarding projected emission levels without climate policy (business-as-usual emissions), has led to changes in the expected emission levels that would result from the pledges and to further insight into the uncertainties regarding the emission gap. In this context, the main objective of this report can be formulated as follows:
This report analyses the effect of the pledges submitted by
Parties in the Cancún Agreements on the emission gap, taking into account all the new information available. It pays specific attention to uncertainties and risks and provides a detailed description of the emission implications of the pledges and actions by the 12 largest emitting countries and regions.
• This report is an update of the PBL report Evaluation of the Copenhagen Accord (Den Elzen et al., 2010). The main updates consist of taking into account the business-as-usual emission projections as provided by countries themselves, and include CO2 emissions from land use, land-use change and forestry (LULUCF), describe more uncertainties and factors that influence the emission gap, and include more countries in the pledge analysis. • In the original report, the evaluation of the pledges was
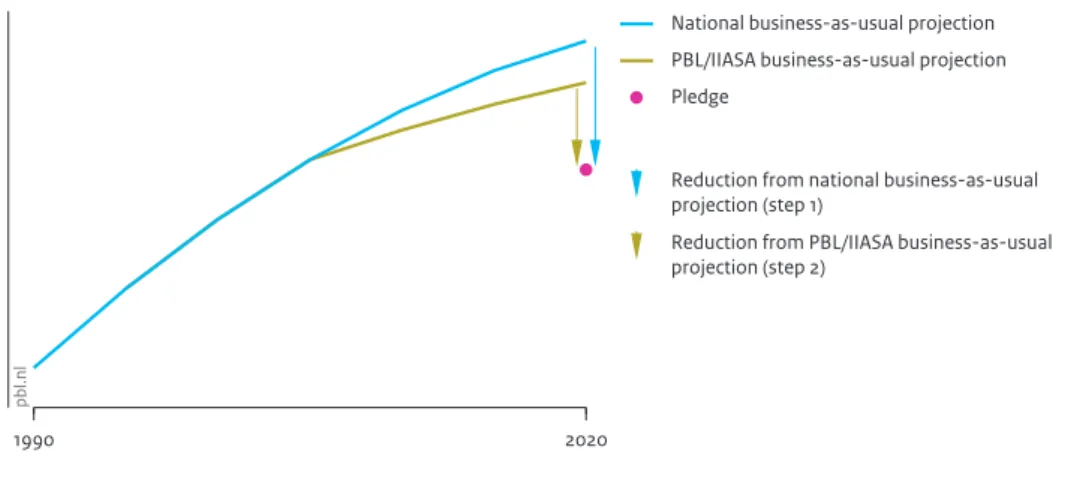
performed within the FAIR modelling framework (Den Elzen et al., 2011a; 2011b), using the following business-as-usual projections from several sources: projections published by the countries themselves (e.g. national communications, national climate action plans), PBL/ IIASA projections (for Annex I countries: PBL business-as-usual projections), and projections based on data from the World Energy Outlook (WEO-2010) (IEA, 2010). PBL/IIASA projections contain all Kyoto greenhouse gases (except CO2 emissions from land-use change) and have been developed for the upcoming OECD
Environmental Outlook to 2050 (OECD, 2012). These projections had been made using the PBL energy model ‘TIMER’ (Van Vuuren et al., 2006; 2011) and the PBL land-use model ‘IMAGE’ (Bouwman et al., 2006). These business-as-usual emission projections were based on GDP projections calculated by the OECD ENV-Linkages model (Burniaux and Chateau, 2008), and projections from the ENV-Linkages model of the OECD (Burniaux and Chateau, 2008). These GDP projections do not include any possible effects of future climate policy. For the non-Annex I countries, projections for CO2 emissions from land-use change (e.g. from deforestation) were based on the IIASA forestry model ‘G4M’ (Kindermann et al., 2006; 2008). For the WEO–2010 projections, data on energy-related CO2 emissions were taken from the World Energy Outlook 2010 (IEA, 2010) and the greenhouse gas emissions from other sources were derived from the PBL/IIASA business-as-usual projections.
If all Annex I pledges would be fully implemented,
Annex I emissions could reach a level by 2020 that
is 12% to 18% below the level of 1990; however, if
only their unconditional pledges would be
implemented, the decrease would only be 5%
below the 1990 level
• Since the climate negotiations in Copenhagen, there have been no substantial changes in the proposed emission reductions by Annex I Parties. This means that, if the low and high pledges were to be fully imple-mented, this, by 2020, would lead to an aggregate Annex I emission level (excluding CO2 emissions from land use, land-use change and forestry (LULUCF)) of 12% to 18% below 1990 levels. This is less than the range of 25% to 40% that was reported by the IPCC as being consistent with scenarios stabilising greenhouse gas concentrations at 450 ppm CO2 eq. If Annex I countries with only a conditional pledge and those that
announced not to be on board for a second commit-ment period under the Kyoto Protocol do not imple-ment their low pledges, the Annex I emission level by 2020 would increase to 5% below 1990 levels. Figure S.1 presents a comparison of the reductions relative to PBL business-as-usual emission projections for 2020 resulting from i) pledges by Annex I countries, and ii) the IPCC AR4 25% to 40% reduction range.
• There are some important uncertainties that affect the targeted Annex I emission levels that would result from the pledges, besides the conditionality of the pledges. The accounting rules for LULUCF credits and surplus assigned amount units (AAUs) are one of those uncertainties. LULUCF accounting rules may result in additional credits from land-use change activities, such as forest management. Annex I countries could use these LULUCF credits to achieve their pledges and thereby lower the reduction target of greenhouse gas emissions that exclude CO2 from LULUCF or land use. Surplus AAUs may result from the first commitment period (2008–2012) of the Kyoto Protocol. New surplus AAUs could also arise in the period up to 2020, because pledges by Russia and the Ukraine are expected by 2020 to lead to emission levels of above business-as-usual emission projections. In Figure S.1, surplus AAUs for the 2013–2020 period are assumed to be fully used and traded, but not included are Kyoto surplus AAUs and LULUCF credits from accounting rules.
Upward revisions of business-as-usual emission
projections have led to higher emission levels
expected from pledges by non-Annex I countries
• Since the Cancún climate negotiations, non-Annex I countries have not changed their reduction proposals (mitigation actions). However, new information from non-Annex I countries about published business-as-usual emissions to which their pledges are connected
– especially from Brazil, China and India – has increased projected emission levels resulting from their pledges by 1.0 to 1.5 Gt CO2 eq.
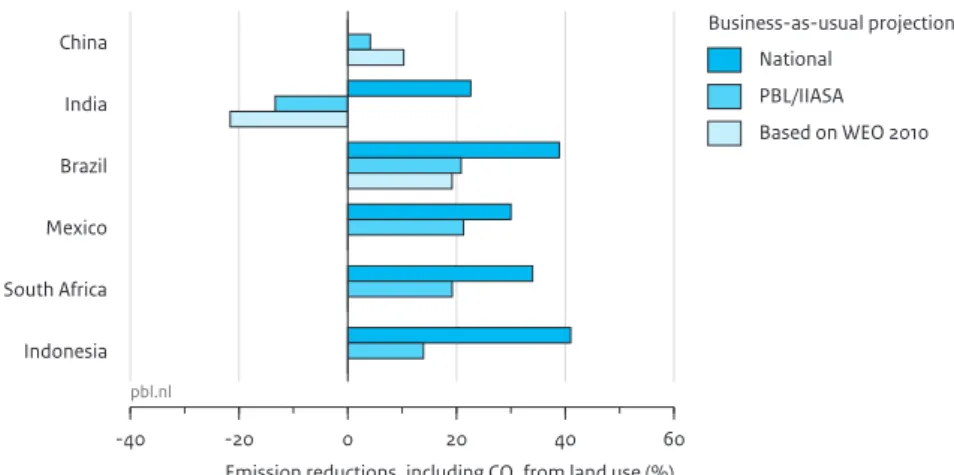
• The mitigation action plans by the seven largest emitting non-Annex I countries (China, India, Brazil, Indonesia, Mexico, South Africa and South Korea), which together will be responsible for more than two-thirds of non-Annex I business-as-usual emissions by 2020, are estimated to reduce emissions, by 2020, by approximately 3% to 6% below PBL/IIASA business-as-usual emission projections. As GDP growth is very uncertain for China and India, the emissions resulting from their pledged actions are uncertain, as well. This implies that the reduction range could still change, substantially. Nine other non-Annex I countries also have pledged reductions, leading to a total reduction below PBL/IIASA business-as-usual projections, of 21% and 25% for their low and high pledges, respectively. • If all other non-Annex I countries (those that have not
pledged quantifiable reductions) were to follow PBL/ IIASA business-as-usual emission projections, then the emissions in the group of non-Annex I countries, by 2020, would be about 3% and 4% below PBL/IIASA
business-as-usual emission projections (including CO2 from LULUCF) for the low and high pledges,
respectively. This is less than the 15% to 30% reported in the literature as consistent with scenarios that would stabilise emission levels at 450 ppm CO2 eq (Figure S.2). If non-Annex I countries with only a conditional pledge would not implement their low pledges, the
aggregated emission level of the entire group of non-Annex I countries, by 2020, would increase to 1% below the PBL/IIASA business-as-usual emission projections (Figure S.2).
• Our analysis shows that about 60% of the total reduction by non-Annex I countries would come from reductions in emissions from deforestation (REDD) and other land-use related emissions. This makes the non-Annex I contribution to emission reductions highly uncertain.
• China and India have set emission intensity targets, for which the emission target level heavily depends on GDP growth. For China, the non-fossil fuel target of 15% may be more limiting than its intensity target, leading to a reduction, by 2020, of 4% below PBL/IIASA business-as-usual emission projections. For India, the
Figure S.1 Other Annex I Canada Japan United States New Zealand Australia EU27 Kazachstan Ukraine Russian Federation Total Annex I
IPCC reduction targets for achieving the 2 °C target 40% below 1990
25% below 1990 OECD
countries OECD Non-countries Total -2 0 2 4 6 8 Low pledges pb l.n l OECD countries OECD
Non-countries Total -2 0 2 4 6 8 High pledges pb l.n l OECD countries OECD
Non-countries Total -2 0 2 4 6 8 Unconditional pledges pb l.n l
Greenhouse gas emission reductions from PBL business-as-usual projections for Annex I countries, by 2020
Emissions, excluding CO Emissions, excluding CO2 from
land use (Gt CO2 eq) 2 from
land use (Gt CO2 eq)
Emissions, excluding CO2 from
land use (Gt CO2 eq)
Source: PBL
Emission reductions based on PBL business-as-usual projections resulting from the Annex I pledges compared with the IPCC reduction range for achieving the 2 °C climate target.
11
Findings |
Gt CO2 eq by 2020. The current estimate is about 2.5 Gt CO2 eq higher, which is mainly due to the higher business-as-usual emissions published by developing countries, Russia and the Ukraine themselves.
• Whether the 2 °C climate target could be achieved depends to some extent on the emission level of 2020, but longer term reductions are even more important. The literature assessment in the revised UNEP Bridging the Emissions Gap report (2011) shows that least-cost emission pathways consistent with a ‘likely’ chance of achieving the 2 °C target, generally, peak before 2020, and have emission levels in 2020 of around 44 Gt CO2 eq (20th–80th percentile range: 41–46 Gt CO2 eq). For a medium likelihood of achieving the 2 °C target, 2020 emissions levels must be around 46 Gt CO2 eq (range: 45–49 Gt CO2 eq). Therefore, the emission gap between the levels resulting from the pledges (51 to 55 Gt CO2 eq) and those consistent with achieving the 2 °C target, ranges from 7 to 11 Gt CO2 eq for a likely chance and from 5 to 9 Gt CO2 eq for a medium chance of achieving this target. For the likely chance this would imply that 5% to 40% of the mitigation effort must be achieved. For a medium chance, this range is between 5% and 50%. emission target level is 13% above PBL/IIASA
business-as-usual emission projections, but 23% below the business-as-usual projection provided by India itself.
To have a likely chance of limiting global warming
to 2 °C, the 2020 emission gap could be about 5 to 9
Gt CO
2eq, which is 2.5 Gt CO
2eq higher than in our
earlier assessment
• Based on the same pledge scenarios as described in UNEP (2010, 2011) studies, this study projects global emissions to be as high as about 55.4 Gt CO2 eq by 2020, if all countries were to implement their unconditional pledges under lenient accounting rules (i.e. the maximum use of LULUCF credits and surplus AAUs), and 54.5 Gt CO2 eq under strict accounting rules (i.e. the impact of LULUCF credits and surplus AAUs are set to zero). The emission level in 2020 could be as low as about 50.9 Gt CO2 eq if all countries were to implement their conditional pledges under strict accounting rules, and 54.3 Gt CO2 eq under lenient accounting rules. Before the Cancún climate negotiations, it was estimated that if all countries were to implement their conditional pledges under strict accounting rules, the emission level would be about 48.5
Figure S.2 Countries Total -4 0 4 8 12
Emissions, including CO2 from
land use (Gt CO2 eq)
Small countries South Korea Mexico Indonesia Brazil China South Africa India Total non-Annex I
Reduction targets, taken from the literature, for achieving the 2 °C target 30% below business-as-usual projections
15% below business-as-usual projections
Unconditional pledges
Greenhouse gas emission reductions from PBL/IIASA business-as-usual projections, for non-Annex I countries, by 2020 pb l.n l Countries Total -4 0 4 8 12
Emissions, including CO2 from
land use (Gt CO2 eq)
Low pledges pb l.n l Countries Total -4 0 4 8 12
Emissions, including CO2 from
land use (Gt CO2 eq)
High pledges
pb
l.n
l
Source: PBL
Non-Annex I emission reductions compared against business-as-usual projections with the reduction range which, according to the literature, would be needed to achieve the 2 °C climate target.
Figure S.3
Business-as-usual emissions
A: Emissions according to other international studie B: Pledges formulated as intensity targets (including effect Indonesia)
REDD+ action contributions to pledges
Emissions, including CO2 from land use (Gt CO2 eq)
Emissions from international shipping and aviation
Uncertainties
Conditionality risk
Pledges depending on international action
Accounting risks
Surplus AAUs from the 2008-2012 period, used in 2020 Trade in new surplus AAUs Unclear accounting rules for land-use emissions (Annex I) Unclear accounting rules for land-use emissions (non-Annex I)
Other risks
Leakage effects Double counting CDM offsets
Contributions by Annex I Non-Annex I International shipping Risks -3 -2 -1 0 1 2 3 pbl.nl
Impacts of risks and uncertainties on global greenhouse gas emissions, by 2020, for low pledges with strict accounting rules
-3 -2 -1 0 1 2 3 Emissions, including CO2 from land use (Gt CO2 eq) pbl.nl
Source: PBL
13
Findings |
• As explained above, most least-cost emission pathways restrict 2020 emissions consistent with the
2 °C target to no more than 49 Gt CO2 eq. However, recent studies of multi-gas emission pathways show that even emission levels of up to 50 to 51 Gt CO2 eq could still be consistent with a medium chance of achieving the 2 °C target, if higher costs are allowed across the entire 21st century. Such scenarios, however, also depend more heavily on advanced future technologies with negative emissions. The OECD (2012) has a similar finding of substantial additional costs after 2020.
Several uncertainties, mainly related to accounting
rules and business-as-usual emission projections,
together, could result in a global emission level of
close to that of the PBL/IIASA business-as-usual
projections for 2020
• There are several risks and uncertainties that could lead to higher or lower emission levels resulting from the pledges. First of all, a major risk relates to pledges being conditional on international action and availability of international support. It is uncertain whether pledges, conditional or not, will be achieved. If only the conditional pledges would not be achieved, this would lead to an increase in emissions of 2.4 Gt CO2 eq (about 70% of which comes from Annex I countries). Furthermore, carry-over and use of Kyoto surplus assigned amount units could increase emissions by up to 2.9 Gt CO2 eq, for trading of new surplus assigned amount units the increase could be 0.3 to 0.6 Gt CO2 eq, and for the use of LULUCF credits resulting from the accounting rules this could be up to 0.4 Gt CO2 eq (all coming from Annex I countries) (see Figure S.3). • With regard to non-Annex I countries, the most
important uncertainty relates to pledges formulated as intensity targets. Due to uncertain business-as-usual GDP projections, this could increase emissions by about 2.6 Gt CO2 eq (but could also lead to lower emission levels). Other important uncertainties concern
contributions from REDD+ actions (which could increase or decrease emissions by 1.5 Gt CO2 eq) and business-as-usual emission developments (which could increase the global emission level by 2.6 Gt CO2 eq, but, again, could also lead to a lower emission level). Finally, land-use accounting rules for afforestation, reforestation and forest management could increase emissions by about 0.7 Gt CO2 eq.
• Risks that are difficult to attribute to Annex I or non-Annex I countries include: i) double counting of offset emissions (which happens if the same amount in emission reduction is counted for achieving the pledges of two countries), which could increase emissions by 0.9 to 1.1 Gt CO2 eq; ii) uncertainty about business-as-usual emissions from international shipping, which could increase emissions by 0.2 Gt CO2 eq; and iii) leakage
effects that occur if emissions are shifted from countries that have emission targets onto countries without emission targets, which could increase emissions by 0.05 to 0.55 Gt CO2 eq.
• When all the risks and uncertainties explored in this study are taken into account, including the possible overlaps, the total emission level by 2020 could end up close to the PBL/IIASA business-as-usual emission projection of 56 Gt CO2 eq.
A selected set of options could result in an
additional emission reduction of 4.1 Gt CO
2eq,
which would narrow the emission gap towards
achieving the 2 °C target
• The most ambitious interpretation of the pledges assumes that high pledges are adopted and strict accounting rules are applied (meaning that no surplus assigned amount units can be used and no credits for LULUCF accounting rules are given). In this scenario, the pledges would lead to an emission reduction of about 5 Gt CO2 eq, compared to business-as-usual emission levels. A selected set of options could result in an additional reduction in emissions of 4.1 Gt CO2 eq, which would narrow the 2020 emission gap towards achieving the 2 °C target (Figure S.4):
o Additional reductions of 0.7 Gt CO2 eq in China and 0.6 Gt CO2 eq in India, which are presented in their national plans, but are not part of the pledges; o Reducing emissions from deforestation by up to 50%
by 2020, below 2005 levels, which would reduce global emissions by about 0.9 Gt CO2 eq; o Reductions in countries that currently have not
submitted any pledges, which could be expected to contribute about 0.7 Gt CO2 eq;
o Ensuring strict additionality of offsets, by ensuring that CDM projects lead to real emission reductions, compared to business-as-usual emissions, which could contribute about 0.4 Gt CO2 eq;
o Reducing hydrofluorocarbon (HFC) emissions, which could contribute 0.5 Gt CO2 eq;
o Reducing emissions from international shipping, which could contribute 0.3 Gt CO2 eq.
All these options could reduce the global emission level of 2020 to about 46.7 Gt CO2 eq, just within the range consistent with the level required for having a medium chance of achieving the 2 °C target, according to the UNEP Bridging the Emissions Gap Report (2011).
• The above options do not include the possible impact of implemented measures that go beyond current pledges and/or strengthen pledges. For instance, the IPCC emission reduction range for 2020, necessary to keep the temperature increase below 2 °C, could be followed. For this, the total Annex I emission target for
2020 has to increase to 25% below 1990 levels. This would narrow the gap by an additional 1.5 Gt CO2 eq. An increase in the targeted level towards 30% and 40% below the 1990 level would result in additional reductions of 2.4 and 4.3 Gt CO2 eq, respectively.
Land Use, Land Use Change and Forestry (LULUCF)
accounting rules as agreed in Durban could lead to
additional LULUCF credits of up to 2% of 1990
Annex I emissions
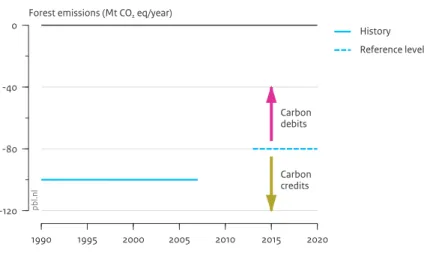
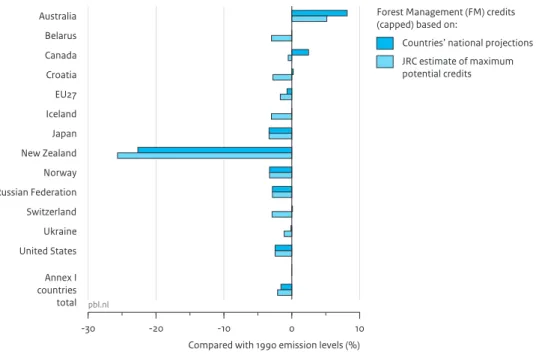
• LULUCF accounting rules could generate credits or debits. The emission levels resulting from the pledges by Annex I countries could change substantially if these credits were to be taken into account. In the Durban climate negotiations, Parties agreed on LULUCF accounting rules for the post-2012 commitment period. A main feature of these new rules is that accounting of forest management becomes mandatory. The credits and debits during the commitment period will be calculated by subtracting a reference level from the actually reported emissions or removals. For most countries (those of the EU, Australia, New Zealand, Canada, Switzerland, Ukraine, Croatia), this reference level is based on business-as-usual emission
projections. For Norway, Russia and Belarus, it is based on the net forest management emission level of 1990. Furthermore, there is a cap on forest management credits equal to 3.5% of base-year emissions. • The current LULUCF accounting rules may result in
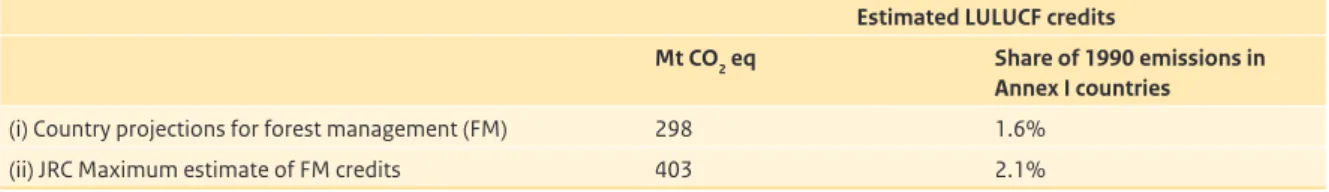
additional LULUCF credits of up to about 2% of 1990
Annex I emissions or 400 Mt CO2 eq, as calculated with the Joint Research Centre’s LULUCF tool, version 8 December (JRC/EC, 2011). The LULUCF accounting rules have a relatively small impact on the EU reduction target that includes LULUCF credits, but can have a larger impact for some other countries. For instance, for New Zealand, the accounting rules could lower the reduction target that includes LULUCF credits, with more than 25% of its 1990 emission levels. For Australia, the combined effect of i) maximum land-use credits from LULUCF accounting rules, and ii) adding deforestation emissions of 2000 to the base-year emissions, leads to an emission target for 2020, including LULUCF credits, of 23% above 1990 levels for the unconditional pledge, and 4% below 1990 levels for the conditional pledge.
Theoretically, having no restrictions on carry-over
of surplus AAUs could decrease the ambition level
for Annex I countries, as a whole, by 15% of 1990
emission levels
• In the Kyoto Protocol, it was decided that countries with emission levels below their Kyoto target would be allowed to carry over the difference to subsequent commitment periods to reward overachievement. This difference is referred to as surplus AAUs. Most surplus assigned amount units originate from the economic downfall of former Eastern Bloc countries, but also some western European countries have generated surplus AAUs. Surplus AAUs can be sold or used domestically to meet future mitigation commitments
Figure S.4 1990 1995 2000 2005 2010 2015 2020 35 40 45 50 55
60 Emissions, including CO2 from land use (Gt CO2 eq/year) History
PBL/IIASA business-as-usual projections Emissions after implementation of high pledges Emissions after implementiion of options Enhanced mitigation options
Chinese and Indian national climate plans (additional effect) Reductions by countries without pledge
Halving deforestation emissions (additional effect) Ensuring strict rules on additionality of offsets Reduction in HFC emissions in non-Annex I countries Reduction in international bunker emissions Probability of achieving the 2 °C target
Medium chance Likely chance
Impact of enhanced mitigation options on global greenhouse gas emissions under strict accounting rules
pb
l.n
l
Source: PBL
The effect of some options that could increase the ambition level, based on policy choices that have been discussed in the negotiations and corresponding literature.
15
Findings |
up to 2020. Both activities can result in higher 2020 emission levels.
• Options for addressing the carry-over and use of Kyoto surplus AAUs vary from prohibiting such carry-over, to restricting their use, to having no restrictions on carry-over (current Kyoto Protocol rules). For no restrictions on carry-over, the ambition level of Annex I countries as a whole could decrease by 14% (equivalent to 2.9 Gt CO2 eq), and, for the EU 30% target, by up to 14% (equivalent to 0.8 Gt CO2 eq) of 1990 emission levels. Decreases in ambition level will be much smaller if the use of surplus AAUs to achieve the future targets is restricted, such as under the other options.
• The actual effect of surplus AAUs on emission
reductions depends on how much of them will actually be traded. The EU, for instance, has decided that surplus AAUs cannot be used by Member States to achieve their 20% unconditional target (for the 30% target, the rules are still unclear). Moreover, without the participation of Russia as largest potential seller and Japan and Canada as potential buyers in a second commitment period, it is unlikely that much surplus AAUs will be traded.
A closer look at the individual pledges of the ten
major emitting economies reveals that the
uncertainty regarding China’s pledge is very large
and that national business-as-usual emission
projections are generally much higher than PBL/
IIASA projections
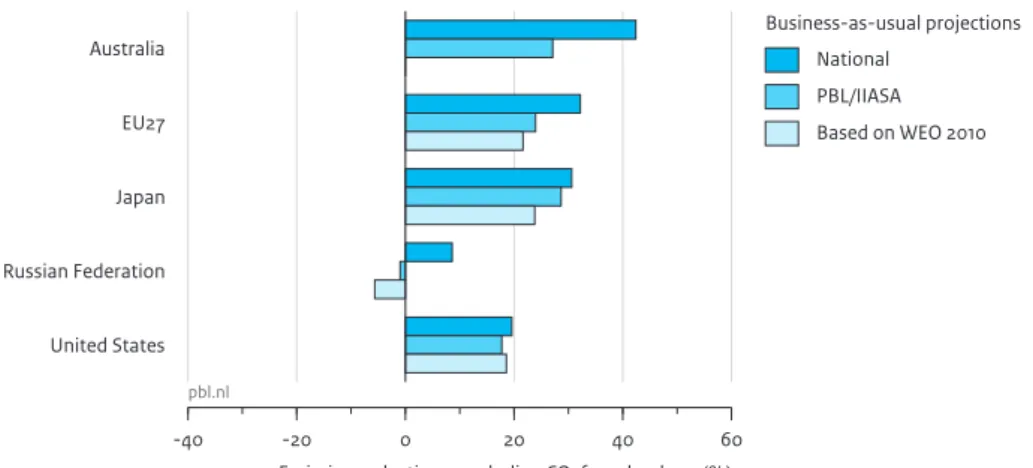
• A closer look at the pledges by the ten major emitting countries led to a few interesting findings. Firstly, national business-as-usual emission projections provided by Annex I countries and non-Annex I countries are in most cases higher than the PBL projections. For non-Annex I countries that generally have pledged targets relative to business-as-usual levels, this implies that the emission reductions from PBL business-as-usual projections are lower than the pledged reductions. The second finding relates to the fact that China pledged an intensity target without providing reference projections of its GDP growth (which is uncertain). The emission level resulting from China’s pledge is therefore very uncertain. This study shows that the 2020 emission level for China is expected to be 12.9 Gt CO2 eq according to the PBL/ IIASA business-as-usual projections, with a reduction of 4%, whereas according to projections by the World Energy Outlook (WEO-2010), this is 11.4 Gt CO2 eq, with a reduction of 10%. Finally, Brazil has provided a new, higher estimate for its business-as-usual emissions, to which its 36% to 39% reduction pledge is to be applied.
This lead to higher greenhouse gas emissions resulting from its pledges; in particular, due to higher
deforestation emissions, and lower reductions compared to PBL/IIASA business-as-usual projections. This study estimates that all reductions will result from REDD actions (about 560 Mt CO2).
17 Findings |
full resul
ts
full resul
ts
one
Introduction
1.1 Objective
In the Cancún Agreements, Annex I Parties (industrialised countries) and non-Annex I Parties (developing countries) made voluntary pledges to reduce greenhouse gas emissions by 2020. The Cancún Agreements also state a long-term target of limiting temperature increase to a maximum of 2 °C above pre-industrial levels. This report is an update of the PBL report evaluation of the
Copenhagen Accord (Den elzen et al., 2010a), which similar to earlier studies showed that there is a possible gap in emissions between the emission level resulting from the pledges and the level necessary to achieve the 2 °C target. The updates involve new information on many topics that have become available over the last two years, including updated national business-as-usual emission projections as provided by the countries themselves, and more information on uncertainties and on factors influencing the size of the emission gap.
In this context, the main objective of this report can be formulated as follows:
This report analyses the effect of the pledges put forward by the Parties in the Cancún Agreements on the emission gap, taking into account all the new information available. It pays specific attention to uncertainties and risks and describes in more detail the emission implications of the pledges and actions of the 12 largest emitting countries or regions.
1.2 Background
Climate negotiations take place under the United nations Framework Convention on Climate Change (UnFCCC). In December 2010, at the annual UnFCCC conference in Cancún, Mexico, it was recognised ‘that deep cuts in global greenhouse gas emissions are required according to science, and as documented in the Fourth Assessment Report of the Intergovernmental Panel on Climate Change, with a view to reducing global greenhouse gas emissions so as to hold the increase in global average temperature below 2 °C above pre-industrial levels, and that Parties should take urgent action to achieve this long-term goal, consistent with science and on the basis of equity; also recognises the need to consider, in the context of the first review […] strengthening the long-term global goal on the basis of the best available scientific knowledge, including in relation to a global average temperature rise of 1.5 °C.’ (UnFCCC, 2010b). one year earlier, the Copenhagen Accord of 20091 (UnFCCC, 2009b) also referred to a 2 °C target, and encouraged countries to submit their emission reduction proposals and actions for the year 2020. Following that conference, 42 Annex I Parties (developed countries) submitted quantified economy-wide emission targets for 2020. In addition, 44 non-Annex I Parties (developing countries) submitted so-called nationally appropriate mitigation actions (nAMAs) for inclusion in the Appendices to the 2009 Copenhagen Accord. The reduction proposals and actions have not changed
19
1 Introduction |
one one
significantly since early 2010 and were ‘anchored’ in the Cancún Agreements (UnFCCC, 2010a, d, c) in December 2010. More specifically, the Cancún Agreement (UnFCCC, 2010b) ‘takes note of quantified economy-wide emission reduction targets to be implemented by Parties included in Annex I to the Convention as communicated by them and contained in document FCCC/SB/2011/InF.14’, and ‘takes note of nationally appropriate mitigation actions to be implemented by Parties not included in Annex I to the Convention as communicated by them and contained in document FCCC/AWGLCA/2011/InF.15’.
In December 2011, at the annual Un climate negotiations in Durban, South Africa, the international community established a new body to negotiate and develop a new protocol for a global agreement. This body, the Ad Hoc Working Group on the Durban Platform for enhanced Action, should reach such an agreement in 2015, which will not take effect until 2020. Therefore, such an agreement is unlikely to affect the ambition levels of the reduction pledges proposed in the Cancún Agreements. Before the Un climate negotiations in Cancún, several studies determined the effect of the pledges put forward by the Parties in the Copenhagen Accord (UnFCCC, 2009b) on the global emission level by 2020. These studies also analysed the size of the gap between the emission level resulting from those pledges and the level needed to limit climate change to a certain temperature (e.g. Den elzen et al., 2010a; european Climate Foundation, 2010; Rogelj et al., 2010a; Stern and Taylor, 2010; Den elzen et al., 2011c). These studies were assessed in the UneP emissions Gap Report for the Cancún climate negotiations (UneP, 2010) and later published in Höhne et al (2011c). According to their shared main conclusion, pledges for 2020 lead to higher emission levels than those consistent with a likely chance of achieving the target of limiting global
temperature to 2 °C (based on cost-optimal 2 °C emission pathways).
Climate negotiations are an ongoing process, and, since Cancún, there have been developments that may have influenced the size of the emission gap. Firstly, following the negotiations in Cancún, two workshops were held; one at the climate conference in Bangkok (April 2011) and one at the climate conference in Bonn (June 2011), as mandated in the Cancún Agreements. The workshops allowed countries to clarify assumptions and conditions regarding their pledges (UnFCCC, 2011f, g). The
workshops provided much useful information, but there were no new announcements that would increase the ambition levels (UnFCCC, 2011d). Secondly, many non-Annex I countries provided information about their business-as-usual emissions through national
communications to the UnFCCC2, national climate action
plans or other national documentation, or in statements by government officials. Because non-Annex I countries expressed their reduction pledges relative to their business-as-usual emission levels, information on these levels influences emission levels resulting from the pledges. Thirdly, projections of business-as-usual emissions and economic growth especially in China, but also in the non-Annex I countries without a reduction pledge, have been revised. Fourthly, in the Durban climate negotiations, Parties agreed on Land Use, Land Use Change and Forestry (LULUCF) accounting rules for the post-2012 commitment period. These rules may strongly influence the emission reduction levels, excluding LULUCF, resulting from the Annex I pledges. Finally, there are updates regarding the mitigation potential of reforestation and avoided deforestation, options for carry-over of surplus assigned amount units (AAUs) from the Kyoto Protocol’s first commitment period, as well as new insights into the 2020 emission levels that would be consistent with achieving the 2 °C limit to a global temperature increase.
1.3 Method
Pledges were evaluated within the FAIR modelling framework (Den elzen et al., 2011b; 2011c) (see Appendix A). Because the size of the emission gap strongly depends on business-as-usual emission projections, we compared the pledged reductions against business-as-usual projections from several sources. These were projections by the countries themselves3, PBL/IIASA projections (for Annex I countries we refer to the PBL business-as-usual projections), and those based on data from the World energy outlook (Weo-2010) (IeA, 2010), when available. PBL/IIASA projections contain all Kyoto greenhouse gases (except Co2 emissions from land-use change) and were developed for the coming oeCD environmental outlook (oeCD, 2012). These projections were calculated using the PBL energy model ‘TIMeR’ (Van Vuuren et al., 2006; 2011) and the PBL land-use model ‘IMAGe’ (Bouwman et al., 2006), and using the GDP projections from the enV-Linkages model of the oeCD (Burniaux and Chateau, 2008). Data on Co2 emissions from land-use change (e.g. deforestation), for the non-Annex I countries, were based on the IIASA forestry model ‘G4M’ (Kindermann et al., 2006; 2008). For the Weo projections, data on energy-related Co2 emissions were taken from the World energy outlook 2010 (IeA, 2010) and the greenhouse gas emissions from the other sources were derived from the PBL/IIASA business-as-usual projections. Appendix B provides a comparison of business-as-usual scenarios from the different sources.
19
one
1.4 Structure
The structure of the report is organised around the following main policy questions:
• What is the contribution of Annex I reduction pledges to emission reductions by 2020? (Chapter 2)
• What is the contribution of mitigation actions by non-Annex I countries to emission reductions by 2020? (Chapter 3)
• What if any will be the emission gap in 2020 between the emission level to be expected from the pledges and mitigation plans, on the one hand, and that consistent with achieving the long-term 2 °C climate target, on the other? (Chapter 4)
• What are the options for narrowing this emission gap? (Chapter 5)
• What are the main risks of increasing the emission gap? (Chapter 6)
• What is the effect of forestry accounting rules on effective emission reductions by Annex I countries in 2020? (Chapter 7)
• Which options are on the negotiation table regarding the use of Kyoto surplus AAUs for reaching future reduction targets, and how do these affect reduction levels? (Chapter 8)
• How do the emission reduction pledges by the twelve major emitting economies (including the eU) relate to projected emission levels? (Chapter 9)
• Main conclusions (Chapter 10)
Notes
1 Http://unfccc.int/meetings/copenhagen_dec_2009/
items/5262.php.
2 See for example: http://unfccc.int/national_reports/non–
annex_i_natcom/items/2979.php.
3 For Annex I countries, see: http://unfccc.int/national_
reports/annex_i_natcom/submitted_natcom/items/4903. php.
two
Reduction pledges by
Annex I countries
Key findings
• Full implementation of the low pledges as put forward by Annex I Parties in the Cancún Agreements are estimated to lead to an Annex I emission level by 2020 which is 12% below the 1990 level. For the high pledges, this would be 18%. these numbers exclude emissions from land use, land-use change and forestry. this is less than the range of 25% to 40% that was reported by the IPCC to be consistent with scenarios stabilising at 450 ppm Co2 eq.
• If the Annex I countries that presented only a conditional pledge and that announced not to be on board for a second commitment period under the Kyoto Protocol do not implement their low pledges, the Annex I emission level by 2020 increases to 5% below 1990 levels. • the pledges by Russia, the Ukraine and Kazakhstan
lead to emission levels of above their business-as-usual level; thus creating new surplus assigned amount units (AAUs). the amount of new surplus AAUs has been adjusted downward, due to higher PBL business-as-usual estimates for Russia and the Ukraine. If surplus AAUs remain unused or not traded, the Annex I emission levels in the low pledge scenario would decrease from 12% to 16% (range 13-17%) below 1990 levels, by 2020, depending on business-as-usual emission projections. Emission levels in the high pledge scenarios would not decrease according to the national business-as-usual projections, but would decrease to 19% below the 1990 level according to PBL business-as-usual projections.
• the Annex I emission level that would result from implementation of the high pledges could increase by up to 2%, from the 1990 emission level, under the land-use and forestry accounting rules as agreed by the Parties during the Durban climate negotiations. • Since the Cancún climate negotiations, no Annex I
country has changed its reduction proposal. Some Annex I countries, notably Australia, have made clarifications about the assumptions and conditions with respect to their proposed reductions, but this hardly has affected the overall Annex I reduction target.
• the EU clarified that surplus AAUs and credits from land-use accounting cannot be used for achieving the 20% unconditional target.
2.1 Description and clarification of
pledges
Reduction pledges as put forward by major Annex I countries in the Cancún Agreements can be summarised as follows. the EU has made an unconditional reduction pledge of 20% from 1990 levels, and a conditional pledge of 30%, under the precondition that other Annex I countries commit to comparable emission reductions and that more advanced non-Annex I countries contribute adequately according to their responsibilities and respective capabilities. the United States pledged to reduce their greenhouse gas emissions by 17% from 2005
23
2 Reduction pledges by Annex I countries |
two two
levels, by 2020, under an international climate agreement, but made this commitment contingent on passing legislation at home. Japan pledged a 25% reduction from 1990 levels, subject to the establishment of a fair and effective international framework in which all major economies participate and come to an agreement on ambitious reduction targets. Canada matched the US pledge to reduce emissions by 17% relative to 2005 levels. Norway and Russia pledged reduction targets of 30% to 40% and 15% to 25%, respectively, relative to 1990 levels. Australia, finally, pledged reduction targets of 5%, 15% and 25% from 2000 levels, by 2020, with the last two pledges being
conditional on mitigation action by others.
Since the Cancún climate negotiations, none of the Annex I countries changed their reduction proposals. In the UNFCCC’s Climate Change Conferences in Bangkok (April 2011) and Bonn (June 2011), some Annex I countries have clarified the assumptions and conditions regarding their proposed emission reductions (for an overview, see UNFCCC, 2011d; Höhne et al., 2011b, a; and Earth Negotiations Bulletin, IISD, 2011). the most important clarifications that could have an effect on the projected 2020 emission level came from Australia and the EU.
Australia provided new information during the Bangkok conference on the interpretation of its targets. First, Australia stated that its pledge includes net Co2 emissions from deforestation to be added to its base-year (2000) emissions by applying Article 3.71 to future emission levels. the net Co2 emissions from deforestation appear to be based on those reported under the Kyoto Protocol’s Article 3.3. this would imply a deforestation emission level of about 70 Mt Co2 eq in 2000, which is a similar level as was found by Höhne et al (2011b). Adding these emissions to Australia’s energy and industrial greenhouse gas emissions of 496 Mt Co2 eq of 2000, the total 2000 emission level on which the pledges are based amounts to 566 Mt Co2 eq. therefore, for Australia, we calculated absolute allowed emission levels for 2020 of 538, 481, and 425 Mt Co2 eq for their respective reduction targets of 5%, 15% and 25%. the 5% target would translate into an effective greenhouse gas emission target (including all greenhouse gases under the Kyoto Protocol and emissions from deforestation, but excluding those from LULUCF) of 29% above 1990 levels, while for the 25% target this would be 2%. this compares to a target of +8% for the first commitment period.
the European Union made some clarifications and communicated some expectations on the following issues:
• Emissions from international aviation are included in the target, and it is foreseen that legislation will need
to include international maritime emissions if on an international level no progress is made towards the inclusion of these emissions;
• LULUCF emissions and emission removals through sinks resulting from LULUCF activities, and related accounting rules, at present, are not included in the 20% reduction target, but may be at a later stage, given that, from a legislative viewpoint, accounting rules should ensure permanence and environmental integrity;
• the EU anticipates achieving up to a maximum of 4% of the 20% target and 9% of the 30% target by using international offsets (JI and CDM credits). the pledges of the major Annex I countries differ in general assumptions and conditions. Some Annex I countries made both an unconditional pledge and a more ambitious pledge in the Cancún Agreement. the more ambitious pledges are conditional, mainly on a high level of ambition from other countries or domestic legislation (see UNFCCC (2011d) and table 2.1 for details of these conditions). other countries made only one pledge, conditional or unconditional, or without being unclear on this issue. For the purpose of this report, we developed three scenarios, providing a range of plausible outcomes for the Annex I emission level by 2020:
1. an unconditional pledge scenario; 2. a low pledge scenario;
3. a high pledge scenario.
the unconditional pledge scenario is based on the least ambitious scenario according to the UNEP (2010, 2011) reports. In this scenario, all countries with both an unconditional and a conditional pledge are assumed to implement their least ambitious, unconditional pledges. For countries that only provided a conditional pledge, their business-as-usual emissions are assumed. this holds for Canada, Japan, the United States and Russia – all countries that have indicated not to be on board for a second commitment period of the Kyoto Protocol. Given that all these countries are implementing and/or planning to implement some domestic climate policies, this is a conservative assumption and represents the low end of the expected emission reductions.
the low pledge and high pledge scenarios are based on UNFCCC documents (e.g. UNFCCC, 2011d). the low pledge scenario refers to a scenario in which all countries with only one conditional emission reduction pledge for 2020 implement these pledges, and all countries with only an unconditional or both an unconditional and a conditional pledge implement their least ambitious, unconditional pledges. the high pledge scenario refers to a scenario in which all countries implement their most ambitious, conditional emission reduction pledge for 2020.
two
therefore, for Annex I countries that have made a conditional pledge only, such as Canada, Japan and the United States, we assumed this pledge to be
implemented, for both the low pledge and high pledge scenarios. the unconditional pledge scenario, thus, leads to the highest emission level for 2020, and the high pledge scenario to the lowest.
the 2020 emission level resulting from the pledges not only depends on the conditionality of the pledges; accounting rules for Land Use, Land Use Change and Forestry (LULUCF) credits (and debits) and surplus AAUs, leakage effects, and double counting of CDM projects also play an important role (Section 2.3 presents the results under lenient rules, where these allowances and credits can be used). In the three scenarios, we assumed strict accounting rules, meaning allowances from LULUCF accounting credits and surplus AAUs will not be used for achieving reduction pledges. However, we did allow for trade in new surplus AAUs in the low pledge and high pledge scenarios. Finally, we assumed no leakage effects and no double counting of CDM projects.
2.2 Overview of reductions
the emission reductions expected from theunconditional, low and high pledges by Annex I countries are given in table 2.1. Although the targets were proposed relative to different base years, for the sake of
comparability, they are all shown against 1990 and 2005 levels.
the unconditional pledges would result in an Annex I emission target for 2020 of 5%, the low pledges in 12%, and the high pledges in 18% below the 1990 level, for all greenhouse gas emissions, except for Co2 emissions from LULUCF. According to the IPCC Fourth Assessment Report (AR4) (Gupta et al., 2007), a reduction of 25% to 40% below 1990 levels would be needed to achieve the long-term 2 °C climate target. Figure 2.1 shows the reductions relative to PBL business-as-usual emission projections for 2020 resulting from the pledges by Annex I countries compared against the IPCC AR4 25% to 40% reduction range (see Appendix B for a comparison with other business-as-usual emission projections). the figure also shows the new surplus AAUs from Russia and the Ukraine.
2.3 Main uncertainties
there are several major uncertainties – apart from the conditionality of the pledges discussed above – that may strongly influence the emission reductions resulting from the Annex I pledges. Some important ones relate to
LULUCF accounting rules and the use of surplus AAUs. Chapter 5 elaborates further on these uncertainties. Below, a brief explanation is presented of the
assumptions that underlie the reduction efforts as given in table 2.1 and Figure 2.1, including a focus on their impact on the aggregated reduction for Annex I countries as a group (table 2.2).
2.3.1 LULUCF accounting rules
the LULUCF rules for the current Kyoto commitment period state that individual countries should keep an account of their greenhouse gas fluxes from
afforestation, reforestation and deforestation, and offer the choice of also including forest management (with a cap on accruing emission allowances), cropland
management, grassland management and revegetation. After years of negotiations, a decision was made in Durban regarding LULUCF accounting rules for the second (post-2012) commitment period2. the main features of the new rules include:
• Accounting of forest management becomes mandatory. the credits and debits during the
commitment period will be calculated by subtracting a ‘reference level’ from the actually reported emissions or removals. For most countries (i.e. EU countries, Australia, New Zealand, Canada, Switzerland, Ukraine, Croatia), this reference level is based on business-as-usual projections. For Norway, Russia and Belarus, it is based on 1990 net emissions from forest management. For Japan, it is set to zero. Furthermore, there is a cap on forest management credits that equals 3.5% of base-year emission levels (usually 1990).
• Rules on accounting of afforestation, reforestation and deforestation, cropland management, pasture management and re-vegetation, remain essentially the same as under the first Kyoto commitment period. For all Annex I countries, LULUCF credits during the second commitment period resulting from these rules will be calculated using the JRC LULUCF tool, version December 20103, of the European Commission, Joint Research Centre (JRC). Depending on the amount of forest management credits, credits resulting from LULUCF may result in additional total emission credits for all Annex I countries, ranging from 1.6% to 2.1% of 1990 emission levels (table 2.2). LULUCF credits may not lead to additional greenhouse gas reductions, as LULUCF activities take place regardless of further policy
intervention (UNEP, 2010)4. LULUCF credits could be used to replace other mitigation actions and therefore weaken the total reduction effort of Annex I countries. Chapter 7 discusses, in more detail, the implications of the LULUCF credits that result from the agreed accounting rules, including their impacts on individual Annex I countries.
25
2 Reduction pledges by Annex I countries |
two two
table 2.1
Emission targets of Annex I countries in 2020 resulting from the pledges put forward by the Parties in the Cancún Agreements
Topic Emissions in Mt CO2 eq*
(excluding LULUCF)
Unconditional pledge Low pledge High pledge
1990 2005 % relative to 1990 % relative to 2005 % relative to 1990 % relative to 2005 % relative to 1990 % relative to 2005 Australia 418 528 29 2 29 2 2 –19 Belarus 139 84 –5 57 –5 57 –10 49 Canada 590 731 27 3 3 –17 3 –17 Croatia 31 30 –5 –1 –5 –1 –5 –1 EU27 5,589 5,149 –20 –13 –20 –13 –30 –24 Iceland 3 4 –30 –36 –30 –36 –30 –36 Japan 1,267 1,351 5 –1 –25 –30 –25 –30 New Zealand 59 75 –10 –29 –10 –29 –20 –37 Norway 50 54 –30 –35 –30 –35 –40 –45 Russia 3,351 2,118 –26 17 –15 34 –25 19 Switzerland 53 54 –20 –22 –20 –22 –30 –31 Ukraine 931 425 –20 75 –20 75 –20 75 United States 6,167 7,185 18 1 –3 –17 –3 –17 Kazakhstan 370 245 –26 11 –26 11 –26 11 Annex I total** 19,019 18,034 –5 1 –12 –7 –18 –13
Source: Annex I countries base-year emissions are based on UNFCCC national inventory submissions.
* All greenhouse gas emissions in this report refer to all emissions relevant under the Kyoto Protocol (Annex A) with the exception of emissions from LULUCF, i.e. the global warming potential-weighted sum of six Kyoto greenhouse gas emissions.
** total Annex I emissions exclude emissions from turkey.
Pledges differ in scope and conditionality. the following qualifications apply (UNFCCC, 2011d):
Australia’s pledge accounts for Co2 emissions from deforestation in its base-year (2000) emissions. Australia will unconditionally reduce its emissions by 5% below 2000 levels, by 2020, and by up to 15% or 25% under certain conditions. Australia will reduce emissions by 25% below 2000 levels, conditional on an ambitious global deal capable of stabilising greenhouse gas concentrations at 450 ppm Co2 eq. the 15% target applies if there is a global agreement which falls short of securing atmospheric stabilisation at 450 ppm Co2 eq under which all major developing economies commit to substantially restraining their emissions and advanced economies take on commitments comparable to those of Australia.
Canada will reduce its carbon emissions by 17% from 2005 levels, over the next 10 years, as part of the Copenhagen Accord on climate change.
The EU has pledged to cut its greenhouse gas emissions by 20% below 1990 levels, by 2020, and to extend this cut to 30%, on the condition that other Annex I countries commit to comparable emission reductions and that non-Annex I countries contribute adequately.
Japan will reduce greenhouse gas emissions by 25% below 1990 levels, by 2020, on the condition that all major emitters commit to ambitious targets.
New Zealand’s pledge is conditional on the Copenhagen Agreement (450 ppm, comparable efforts), including LULUCF and carbon market use.
Norway puts forward emission reduction targets of 30% to 40% below 1990 levels, by 2020, and signals that it may move to a reduction of 40% as part of a global and comprehensive agreement for the period beyond 2012.
Russia’s range of greenhouse gas emission reductions depends on the following conditions: (i) Appropriate accounting of the potential contribution of Russian forests to meeting the obligations of the anthropogenic emissions reduction; (ii) All major emitters comply with the legally binding obligation to reduce anthropogenic greenhouse gas emissions.
The United States’ reduction target for 2020 is around 17% below 2005 levels, in conformity with anticipated US energy and climate legislation, recognising that the final target is yet to be submitted to the Secretariat in light of enacted legislation.
the targets in table 2.1 exclude emissions from and uptake by the LULUCF sector (emissions from deforestation, thus, are also excluded). therefore, the targets are expressed as effective targets for industrial processes, solvent and other product uses, and the energy, agriculture and waste sectors. Chapter 7 describes the targets that include land-use credits from land-use accounting rules as agreed at the Durban climate negotiations.
two
‘Kyoto surplus AAUs’ relate to the surplus assigned amount units (AAUs) that are generated during the Kyoto period. Countries may carry-over or bank these surplus AAUs for use in the following commitment period. Surplus AAUs may be sold or used domestically to meet future mitigation commitments up to 2020. If this happens, then estimates of 2020 emissions would increase, because these surplus AAUs could be used to achieve the pledges, replacing domestic emission reductions. the UNFCCC negotiation text5 basically describes four options for dealing with Kyoto surplus AAUs, for achieving the reduction pledges by 2020 (see Chapter 8):
• option 1 is the status quo, implying no restrictions on the future use of Kyoto surplus assigned amount units. this will lead to about 3 Gt Co2 eq in surplus AAUs by 2020.
• option 2 allows full use of new surplus assigned amount units, but restricts their carry-over to a certain percentage. the percentages currently proposed are 1, 2, 5, and 10. this leads to surplus AAUs varying from 0.1 to 1 Gt Co2 eq by 2020.
2.3.2 Surplus assigned amount units
Another major uncertainty concerns the use of surplus assigned amount units (AAUs), often referred to as ‘hot air’, notably from Russia, the Ukraine, Belarus, Kazakhstan and other countries in central and eastern Europe. Surplus AAUs may be carried over from the first commitment period of Kyoto or result from pledges for 2020.
New surplus AAUs are generated because the reduction pledges by Russia and the Ukraine are well above their business-as-usual emission projections. If these surplus AAUs would not be used or traded, the Annex I emission level resulting from the low pledge would decrease from 12% to 16% below 1990 levels, under the PBL business-as-usual scenario, with a range of 13% to 17% for alternative business-as-usual projections. For the high pledges, the emission level of 18% below 1990 levels would decrease to 19%, with a range of 18% to 20% (table 2.2, third column). Figure 2.1 Other Annex I Canada Japan United States New Zealand Australia EU27 Kazachstan Ukraine Russian Federation Total Annex I
IPCC reduction targets for achieving the 2 °C target 40% below 1990
25% below 1990 OECD
countries OECD Non-countries Total -2 0 2 4 6 8 Low pledges pb l.n l OECD countries OECD
Non-countries Total -2 0 2 4 6 8 High pledges pb l.n l OECD countries OECD
Non-countries Total -2 0 2 4 6 8 Unconditional pledges pb l.n l
Greenhouse gas emission reductions from PBL business-as-usual projections for Annex I countries, by 2020
Emissions, excluding CO Emissions, excluding CO2 from
land use (Gt CO2 eq) 2 from
land use (Gt CO2 eq)
Emissions, excluding CO2 from
land use (Gt CO2 eq)
Source: PBL
Pledged reductions by Annex I countries or regions below PBL business-as-usual emission projections compared against the IPCC reduction range needed for achieving the 2 °C climate target.
27
2 Reduction pledges by Annex I countries |
two two
• option 3 restricts surplus AAUs to be used for future domestic compliance only. this means that surplus AAUs cannot be sold, and may only be used for reaching reduction targets. this will lead to between 0.4 and 0.8 Gt Co2 eq in surplus AAUs by 2020. • option 4 prohibits the carry-over of surplus AAUs as
well as the use of new surplus AAUs, leading to the phasing out of surplus AAUs by 2020.
In the first three columns in table 2.2, it is assumed that surplus AAUs during the Kyoto period cannot be carried over or banked for use in the next commitment period. the last column of table 2.2 shows the impact of option 2, with varying carry-over of between 2% to 5% of the total surplus AAUs from the Kyoto commitment period. Chapter 8 discusses in more detail the implications of the various options for the use of carried over Kyoto surplus AAUs.
Notes
1 Article 3.7 allows emissions from deforestation to be
included in the base year for those Parties with a net source of emissions from land-use change and the forestry sector and applied to the target in the first Kyoto commitment period.
2 Http://unfccc.int/files/meetings/durban_nov_2011/
decisions/application/pdf/awgkp_lulucf.pdf.
3 Http://afoludata.jrc.ec.europa.eu/index.php/models/
JRC_LULUCF_tooL.
4 Land use and forestry measures tend to remove Co 2 and
thus decrease the atmospheric Co2 built up. However, it cannot be guaranteed that the accounted land use and forestry adjustments reflect real, additional and permanent changes ‒ there is no way to ensure that carbon stored in a planted forest or in agricultural soils will not be
subsequently released.
5 FCCC/KP/AwG/2010/CRP.4/Rev.4.
table 2.2
Impact of including allowance increases from land-use and forestry (LULUCF) rules and new surplus assigned amount units (AAUs) for Russia and the Ukraine, for the aggregated emission reduction by Annex I countries under the unconditional pledge, low pledge and high pledge scenarios
Annex I countriesi as a
group, emission reduction from 1990 levels (%)
Default: excluding LULUCF credits & including new surplus AAUs*
Including LULUCF credits** & including new surplus AAUs
Excluding LULUCF credits & excluding new surplus AAUs**
Excluding LULUCF credits & including new surplus AAUs & including Kyoto surplus AAUs***
Unconditional pledge 5% [1%;6%]* 3% to 4% 6% [ 2%; 7%]** 2% to 3% Low pledge 12% 11% 16% [13%;17%]** 9% to 11% High pledge 18% 16% 19% [18%;20%]** 15% to 16% i total emissions from Annex I countries exclude emissions from turkey.
* the range reflects the impact of different business-as-usual emission projections, default: PBL business-as-usual emission projections, and range based on world Energy outlook business-as-usual emissions and national business-as-usual emissions provided by the countries themselves.
** Impact of LULUCF accounting rules. the range is based on countries’ projections and a maximum estimate of emissions from forest management, as described in Chapter 7.