Consumption
Driven Analysis of Thermal Comfort and Energy
Heating System Strategies for Old Houses: a Model
Academic year 2019-2020
Master of Science in de ingenieurswetenschappen: architectuur
Master's dissertation submitted in order to obtain the academic degree of
Counsellors: Ir.-arch. Kjartan Van den Brande, Josué Borrajo Bastero
Supervisors: Prof. dr. ir.-arch. Jelle Laverge, Dr. ir.-arch. Marc Delghust
Student number: 01504553
Elien Vander Stichele
"The author gives permission to make this master dissertation available for consultation and to copy parts of this master dissertation for personal use. In all cases of other use, the copyright terms have to be respected, in particular with regard to the obligation to state explicitly the source when quoting results from this master dissertation."
"De auteur geeft de toelating deze masterproef voor consultatie beschikbaar te stellen en delen van de masterproef te kopiëren voor persoonlijk gebruik. Elk ander gebruik valt onder de bepalingen van het auteursrecht, in het bijzonder met betrekking tot de verplichting de bron uitdrukkelijk te vermelden bij het aanhalen van resultaten uit deze masterproef."
Acknowledgement
First, I would like to thank my supervisors Prof. dr. ir. -arch Jelle Laverge and dr. ir-arch Marc Delghust, and counsellors Josué Borrajo Bastero and ir. -arch Kjartan Van den Brande for their guidance throughout the whole process. Before and during the corona era they dedicated a lot of their time to provide advice, feedback and modelling help. Their invested time is much appreciated.
I would also like to thank my friends and family, who have heard more about my thesis than they ever wanted to know. They dread the sentence ‘I think there is something wrong with my simulations and I have to begin anew’ more than ever. They supported me through the difficult moments. My special thanks go to my brother and father, whose computers turned into a second and a third simulation machine. I would also to thank Els, Janne and Silke to propose improvements for my text and graphs, and taking time to read through my whole thesis.
Overview
Heating System Strategies for Old Houses: a Model Driven Analysis of Thermal Comfort and Energy Consumption
Elien Vander Stichele
Supervisor: Prof. dr. ir.-arch. Jelle Laverge, dr. ir.-arch. Marc Delghust
Counsellors: ir.-arch. Kjartan Van den Brande, Josué Borrajo Bastero
Master’s dissertation submitted in order to obtain the academic degree of Master of Science in de ingenieurswetenschappen: architectuur
Academic year 2019-2020
Summary
This master dissertation discusses the compatibility of a heating system with older houses. The different heating system options are discussed and simulated. This thesis also determines from which insulation level these heating systems can be considered to create a thermally comfortable environment in residential terraced houses.
This master thesis is divided into three main parts. The first part is a literature study where the Belgian context is researched. Additionally, simulation parameters are researched which have an important influence on the outcome of the simulations. The second part translates the literature study into the research question, and evaluation criteria. The models, boundary conditions and parameters that were used, are discussed and explained. The last part discusses the results of the simulations. This study focusses on when a heating system provides a thermally comfortable environment in a house, and in combination with which kind of insulation level. The main focus is on the thermal comfort and energy consumption.
Heating System Strategies for Old Houses: a Model Driven Analysis of
Thermal Comfort and Energy Consumption
Elien Vander Stichele
Supervisors: Prof. dr. Ir.-arch. Jelle Laverge, Dr. Ir.-arch. Marc Delghust, Ir.-arch. Kjartan Van den Brande, Josué Borrajo Bastero
Abstract: Replacing an old high-temperature heating system in
an uninsulated older house is not always an evident choice. Heating systems with a lower temperature regime in those older houses do not always provide thermal comfort. Therefore, the present study assesses the compatibility of a heating system with an older house, and which kind of measures that must be taken to create a thermally comfortable environment with the given heating system. The simulations are executed for three occupants, a low, average and high cost profile. Every profile is again divided in three scenarios. The first is where the heating only starts when someone is present, the second scenario is where the heating starts one hour earlier, and the last scenario is without any setback temperature. The study is carried out with the simulation program Dymola, with the main focus on primary energy consumption and thermal comfort.
The results of the simulations show that the insulation degree has a large impact on the feasibility of installing a heating system, and in particular on a low temperature regime.
Keywords Simulation, Old houses, heating strategies, thermal
comfort, primary energy consumption
I. INTRODUCTION
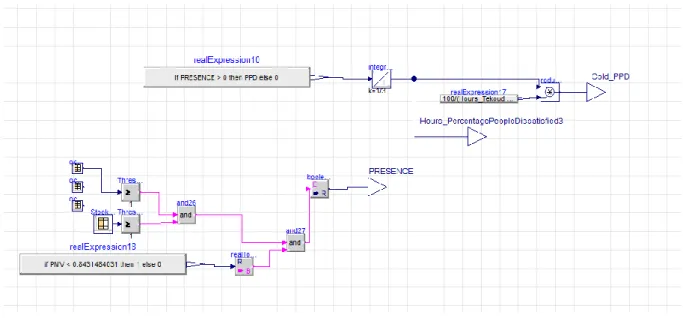
The Belgian housing market mostly consists of older houses. In fact, more than the majority was built before 1970 [1]. Those houses are not very well-insulated, still have older (single pane) windows and are not very airtight most of the time. Consequently, the energy consumption due to heating will be rather high. Contrary, newly built houses are held against the EPB-demands and are built very energy-efficiently, but the houses built after 2006 only represent a minority. Therefore, older houses have a lot of potential to decrease the energy consumption and install a more efficient heating system, while maintaining the comfort.
Most of the time, a gas condensing boiler is proposed in renovation projects.[2] Other literary sources only propose a heat pump in a more thorough renovation. [3]
The aim of this thesis is to delve more deeply into the situation of the older terraced houses. The most optimal choice of heating systems is less obvious and the thermal comfort is not always guaranteed due to high heat losses. Specifically, the goal of this thesis is to research the compatibility of a certain heating system with a certain kind of insulation level. The thermal comfort and the energy consumption are the most important indicators to judge whether a heating system is compatible with a specific insulation level or not. Different kinds of heating systems are modelled in Dymola and simulated with varying degrees of insulation.
Other literature studies [4] [5] [6] show the importance of an occupant and different setpoint temperatures in simulations and calculations. A general occupant or a building standard of a country
II. SIMULATION APPROACH
All simulations are done in the same basic terraced house, which has a gross floor area of 123 m². Four different kinds of heating systems are tested in gradual insulation levels. Those insulation levels are theoretical and aim to search for the absolute minimal possibility of installing a heating system. It ranges from an uninsulated house with single pane windows to a very well-insulated house with high performance glazing.
Steps U-value wall [W/m² K] U-value roof [W/m² K] U-value glass [W/m² K] Original house 1,70 1,90 5,8 Insulation level 1 1,70 1,90 1,1/(2,9) Insulation level 2 0,79 0,56 1,1/(2,9) Insulation level 3 0,52 0,56 1,1/(2,9) Insulation level 4 0,31 0,31 1,1/(2,9) Insulation level 5 0,19 0,19 1,1 Table 1: insulation levels
The four considered systems are chosen in such a way that the temperature regime decreases with each system. The first considered system shows the older situation, an older oil boiler with a lower efficiency and a high temperature regime. The second system is a gas condensing boiler with the existing radiators. The temperature regime is around +/-55°C-45°C and is regulated in accordance with the outdoor temperature. The third system is a low temperature regime of a heat pump (45°C-35°C) with the existing radiators. The last heating system is a heat pump with floorheating, at temperature regime of 35°C-30°C.
For each heating regime, three different kinds of occupant profiles are simulated: a low, average and high comfort profile. The low and average profile have a setback temperature and a setpoint temperature, the high comfort profile has only a constant setpoint temperature. The results are checked in three key rooms: the living room, bathroom and bedroom.
III. EVALUATION OF THE SIMULATION
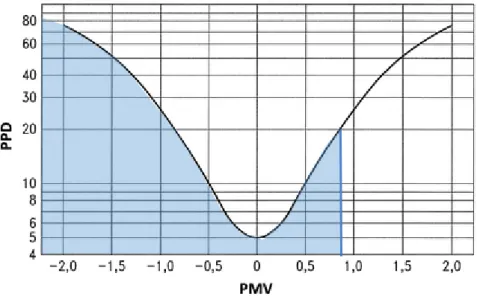
The two most important evaluation parameters of the results are the thermal comfort and the energy consumption. A maximum of 20 percentage people dissatisfied (PPD) is taken as a hard limit, based on the comfort method of Fanger. The second indicator is the energy consumption, but this only plays an important role when the comfort is met.
IV. SIMULATION RESULTS
The results are split into two cases with different approaches. The first one is where the original house has single pane windows that need to be replaced immediately, the other case is where older double pane windows are present that do no need to be replaced
comfort is met in three rooms, a value in grey only in the living room and bedroom.
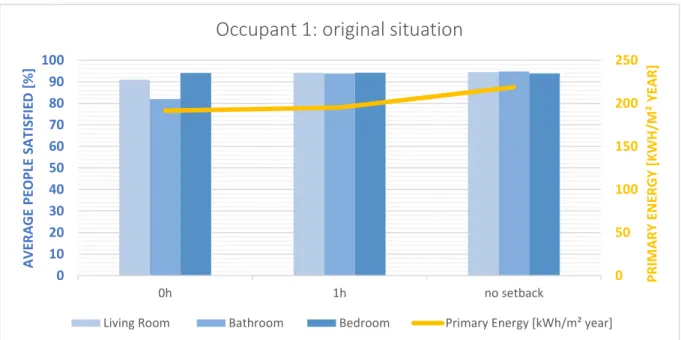
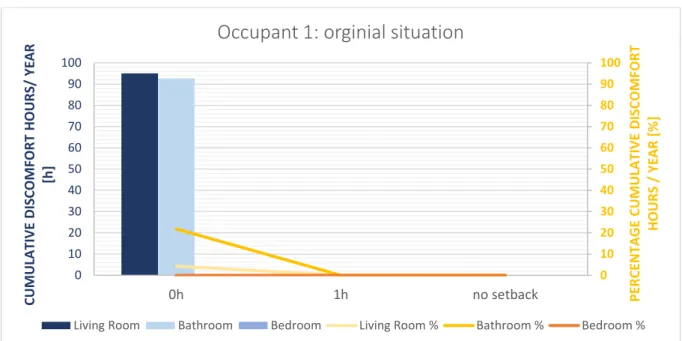
A. Case 1 Occupant 1
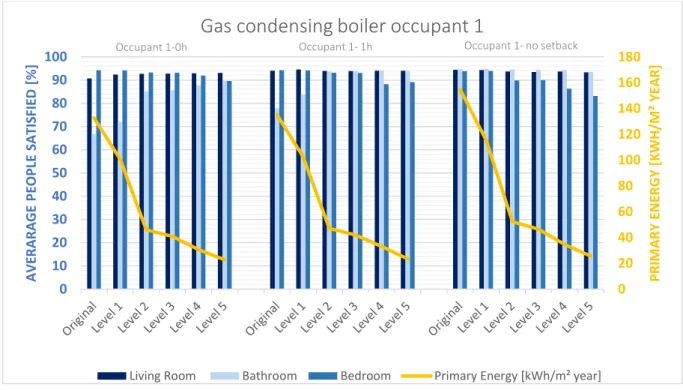
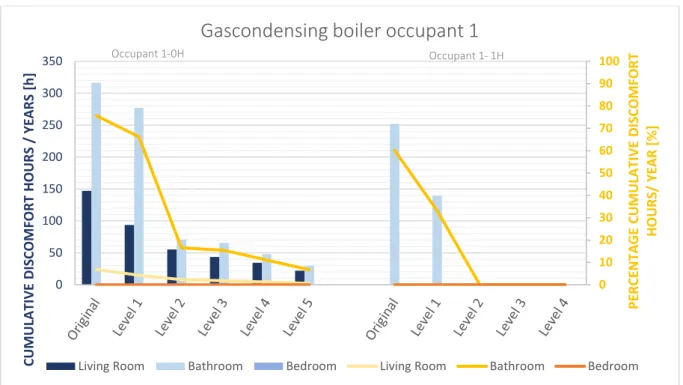
Occupancy profile 1 is characterized by a low setpoint temperature and a small difference between the setpoint and setback temperature. The highest energy consumption can be seen with the oil boiler, but the comfort is guaranteed in all three rooms. The gas condensing boiler, the second heating system, immediately provides comfort in the living room and bedroom, but for a complete comfort in the bathroom, a minimal amount of insulation must be placed. From level 2 onwards, the comfort is completely guaranteed in all rooms.
A heat pump is theoretically a possibility from level 2, where the temperatures only narrowly fall in the comfort zone. It is more recommended to insulate up to level 4, where the setpoint temperature is met more closely. The comfort in the bathroom is never reached. This means that even for a low occupancy profile, an extra heating system must be installed or other radiators with different dimensions must be considered.
The floor heating provides comfort in two rooms from insulation level 2, and a complete comfort from level 4. The primary energy consumption is the lowest of all considered heating systems, but the installation cost is the highest.
Primary energy consumption [kWh/m² year]
Original
case Level 1 Level 2 Level 3 Level 4 Level 5 Occupant 1 – 1h Heating demand 142 107 51 46 35 26 Reduction[%] -25 -64 -68 -75 -82 Oil boiler 196
Gas condensing boiler 135 102 47 42 31 23
Heat pump 45°C - - 34 30 21 15
Heat pump max 50°C - - 36 32 23 16
Floor heating (no setb) - - 27 24 18 15 Table 2: summary occupant 1, case 1.
Occupant 2
Occupant 2 is characterized by higher setpoint and consequently a larger difference between setpoint and setback temperature. Therefore, the thermal comfort is only reached at the more insulated levels.
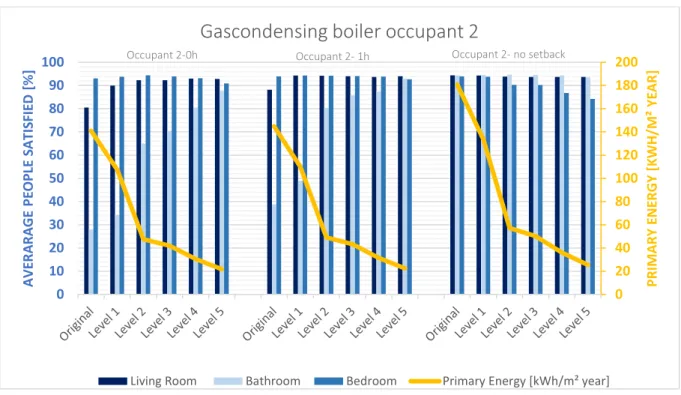
For the original house, only a high temperature regime is a possibility. Only from level 1, where the windows are replaced, the gas condensing boiler provides comfort in the living room and bedroom. At level 4, a completely thermally comfortable situation is created, also in the bathroom.
A heat pump with radiators can only be considered in the more insulated levels, but only for comfort in the living room and bedroom. The floor heating can be installed from level 2 on, but never reaches any comfort in the bathroom. The floor heating provides an earlier comfort than the heat pump with the radiators, because in this case, the heating is not turned off. The constancy of the temperature plays an important role.
The total primary energy consumption is the lowest with the heat pump, but this system does not reach a complete comfort in all rooms, in contrast to the gas condensing boiler.
Primary energy consumption [kWh/m² year]
Original
case Level 1 Level 2 Level 3 Level 4 Level 5
Occupant 2 – 1h
Heating demand 177 134 64 57 43 33
Oil boiler 220
Gas condensing boiler - 110 49 43 31 22
Heat pump 45°C - - - - 21 14
Heat pump max 50°C - - - 33 23 16
Floor heating (no setb) - - 27 24 18 14 Table 3: Summary occupant 2, case 2
Occupant 3
Occupant 3 is characterized by a high setpoint temperature, but without any setback, which means that the heating is constantly on. The consequence of a scenario without setback is that the temperature is more constant and no large temperature gaps must be made up for, which results in an earlier thermal comfort. At the original level, only the oil boiler has reached a comfort in all three rooms. However, from insulation level 2 on, the comfort for the gas condensing boiler is also reached in the three rooms. The same conclusion stands for a heat pump with the existing radiators, which also provide a complete comfort from level 2 on. In contrast, a floor heating system requires a more thorough renovation. This earlier realisation of the comfort comes at a cost of a higher energy consumption.
Primary energy consumption [kWh/m² year]
Original
case Level 1 Level 2 Level 3 Level 4 Level 5
Occupant 3 – no setb
Heating demand 216 163 78 70 53 40
Oil boiler 332
Gas condensing boiler 221 167 75 67 49 35
Heat pump - - 56 50 36 26
Floor heating (no setb) - - - 30 23 18 Table 4: Summary occupant 3, case 1
Remarks on the simulations
Some important remarks can be made on the simulations results. The most important are the time when the heating is started, the heating regime and the dimensioning of the radiators.
Start time heating
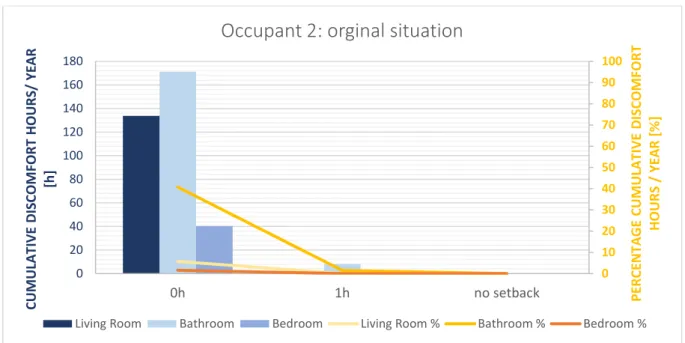
The time when the heating starts to achieve the setpoint temperature heavily influences the comfort in a room. Three scenarios are simulated: the case where the heating starts only when someone is present (0h), the case where the heating is on one hour before presence (1h) and the case where there is no setback temperature (no setb). A scenario without setback provides thermal comfort before the other scenarios. However, the most optimal balance between comfort and energy consumption is scenario 1h.
An example of the cumulative discomfort hours can be found underneath, in Figure 1. The cumulative discomfort hours are shown for a heat pump with radiators for occupant 2. There is a significant difference between the 3 setups.
Figure 1: Cumulative discomfort hours for a system with a heat pump and existing radiators, occupant 2
Heating regime
Four heating systems are simulated in combination with different occupants and insulation levels. However, the heating systems are now only tested with one heating regime, except for the heat pump. Instead of only working with a fixed water setpoint temperature, an adaptive heating curve is also simulated. In Figure 2, the difference between the two heating regimes is shown in terms of percentage cumulative discomfort hours / year. The decrease in discomfort can mainly be seen in the lower insulation levels and in the bathroom. In some cases, this results in an earlier realised comfort. This means that a heat pump could be installed without a thorough renovation, at the cost of a higher energy consumption.
Figure 2: Difference in percentage cumulative discomfort hours/year, for 45°C and 50°C
Dimensions of the radiators
The existing dimensions of the radiators play an important role. In this case, the original dimensions of the radiators are chosen 2,7 to 1,5 times the actual heat loss calculation, according to older rules of thumb for dimensioning radiators. However, when less powerful radiators are present in the original situation, the feasibility of installing a low temperature heating system is less sure. Only in the most insulated levels, it is then possible to install a heat pump, or in some cases it is even not possible. This is illustrated in Figure 3, where the alternative dimensions are shown for occupant 2, with a heat pump and radiators. The alternative dimensions are gradually closer to the heat loss calculations.
Whereas in the original case the comfort in living room and bedroom is met at insulation level 5, the comfort is not always guaranteed in the other dimensions.
Figure 3: Alternative dimensions B. Case 2
Occupant 1
In the situation with the older double pane windows (level 1), the oil boiler provides comfort in all rooms. In contrast, the gas condensing boiler only provides comfort in the living room and the bedroom. The bathroom is only thermally comfortable when a minimum of insulation is placed. A heat pump (45°C) with radiators is not a possibility when the windows are not replaced. However, the heat pump with an adaptive heating curve (max 50°C) provides comfort in the living room and bedroom, namely from level 2.
A floor heating system is only possible when the house is insulated up to level 3 and the floor heating is constantly on.
Primary energy consumption [kWh/m² year]
Level 1 Level 2 Level 3 Level 4
Occupant 1 – 1h
Heating demand 125 66 61 49
Reduction[%] 47 52 61
Oil boiler 169
Gas condensing boiler 109 58 53 43
Heat pump 45°C - - - -
Heat pump max 50°C - 49 45 35
Floor heating (no setb) - - 32 27
Table 5: Summary occupant 1, case 2 Occupant 2
At level 1, where the windows were replaced with old double pane windows, only a high temperature regime of an oil boiler provides a thermally comfortable environment. Replacing this heating system is only possible with a gas condensing boiler. However, the comfort in the bathroom is never fulfilled.
Heating with the existing radiators and a heat pump is not a possibility. However, at level 4, a floor heating system could be considered for the living room and the bedroom, but only if the floor heating is on constantly.
Primary energy consumption [kWh/m²year]
Level 1 Level 2 Level 3 Level 4
Occupant 2 – 1h
Heating demand 152 82 67 62
Oil boiler 188
Gas condensing boiler 117 62 57 45
Heat pump 45°C - - - -
Heat pump 50°C - - - -
Occupant 3
The occupant without setback and a high setpoint temperature has a higher comfort than the other two profiles. The fact that the heating is on constantly ensures that a gas condensing boiler provides a thermally comfortable environment from level 2 onwards with a minimum amount of insulation. A heat pump provides a complete thermally comfortable environment from level 3 on, but has a rather high primary energy consumption.
A floor heating system with a heat pump is not a possibility in this case.
Primary energy consumption [kWh/m² year]
Level 1 Level 2 Level 3 Level 4
Occupant 3 – no setb
Heating demand 186 101 93 76
Oil boiler 284
Gas condensing boiler 177 94 87 70
Heat pump - 73 69 57
Floor heating (no setb) - - - -
Table 7: Summary occupant 3, case 2 Case 1 Vs Case 2
The comparison between case 1 and case 2 shows the importance of the timing of replacing the windows. The difference is the most noticeable for the lower temperature regimes, such as the heat pump with the radiators or the heat pump with the floor heating.
The possibility of installing a gas condensing boiler is mainly the same for both cases, except for the primary energy consumption, which is a higher for case 2. However, installing a heat pump is more of a challenge. Whereas the heat pump with radiators provides comfort in the living room and bedroom for case 1 at insulation level 2 for occupant 1 and 3, and at insulation level 4 for occupant 2, this is completely different for case 2. Here, a heat pump with radiators (45°C) is never possible for occupant 1 and 2. Occupant 3, the case without a setback, shows no difference, as insulation level 2 remains the minimum.
The most distinctive difference is for the floor heating systems. In case 1, insulation level 2 is the minimum for occupant 1 and 2, and insulation level 4 for occupant 3. In contrast, for case 2, the minimum is level 3 for occupant 1 , level 4 for occupant 2, and floor heating is not a possibility for occupant 3.
Another important factor of the older double pane windows is the energy consumption. The more insulated the house, the more pronounced the difference between the 2 cases. The older double pane windows have a higher impact on the energy consumption at level 4 than at level 2.
Figure 4: Difference in energy consumption between case 1 and case 2
V. CONCLUSION
In this study, the compatibility of a heating system with older houses is researched. Four different heating systems are simulated in gradual insulation levels, for three different occupancy profiles. The general conclusion is that replacing an older heating system with a gas condensing boiler is almost always a solution and heating with a heat pump is most of the time only feasible at more insulated levels, depending on when the heating starts and the occupant. Another conclusion is that the best balance between comfort and energy consumption is when the heating starts one hour before occupancy.
Factors such as the time when the heating starts (0h, 1h and no setback), the occupancy profiles and the dimensions of the radiators have a large influence on the creation of thermal comfort and the primary energy consumption.
The results are dependent on the simulations. Other methods of developing the models could have different results. It could be useful to combine the results of the simulations with field data to assess if the results are confirmed.
VI. REFERENCES
[1] Statbel. (2019, October 17). Gebouwenpark. Retrieved 23
December 2019, from
https://statbel.fgov.be/nl/themas/bouwen-wonen/gebouwenpark#news
[2] Van Holm, M., Verbeke, S., Cuypers, D., & Vandevelde, B. (2014). Belgische woningtypologie Nationale brochure over de TABULA woningtypologie.
[3] CARSA, TUDelft, METU, Cyl. (2018). Series of energy efficient conservation interventions and their impact and results of the validation of the SUI concept ( M12 ) Haarlem [Internal document].
[4] Andersen, R. K. (2012). The influence of occupants’ behaviour on energy consumption investigated in 290 identical dwellings and in 35 apartments. Abstract from 10th International Conference on Healthy Buildings, Brisbane, Australia. [5] Mora, D., Carpino, C., & De Simone, M. (2018). Energy
consumption of residential buildings and occupancy profiles. A case study in Mediterranean climatic conditions. Energy Efficiency, 11(1), 121–145.
[6] De Meester, T., Marique, A. F., De Herde, A., & Reiter, S. (2013). Impacts of occupant behaviours on residential heating consumption for detached houses in a temperate climate in the northern part of Europe. Energy and Buildings, 57, 313– 323.
Verwarmingsstrategieën voor oude huizen: een analyse van
thermisch comfort en energieverbruik aan de hand van
simulatiemodellen
Elien Vander SticheleBegeleiders: Prof. dr. ir.-arch. Jelle Laverge, dr. ir. -arch. Marc Delghust, ir.-arch. Kjartan Van Den Brande, Josué Borrajo Bastero
Abstract: Het vervangen van een oud verwarmingssysteem met
een hoog temperatuurregime is niet altijd een evidente keuze in een ouder ongeïsoleerd huis, aangezien een laag temperatuurregime niet altijd een thermisch comfort kan garanderen. Daarom onderzoekt deze studie de combineerbaarheid van een verwarmingssysteem met een ouder huis, en welke ingrepen uitgevoerd moeten worden om een thermische behaaglijke omgeving te creëren met het gegeven systeem. De simulaties zijn zowel uitgevoerd voor een laag, gemiddeld en hoog comfort profiel. Elk profiel is daarop nog verdeeld in drie scenario’s. Het eerste scenario is waar de verwarming slechts start wanneer er iemand aanwezig is. Het volgende scenario is waar de verwarming een uur eerder start en het laatste scenario is waarbij de verwarming constant aan blijft en er geen verlagingstemperatuur is. Deze studie is uitgevoerd met het dynamische simulatieprogramma Dymola, waarbij de focus vooral ligt op het primair energieverbruik en het thermisch comfort. De resultaten van de simulaties tonen aan dat de isolatiegraad een grote impact heeft op het installeren van een bepaald verwarmingssysteem, en in het bijzonder op de haalbaarheid van lage temperatuurregimes.
Kernwoorden: Simulatie, oude huizen, verwarmingstrategieën,
thermisch comfort, primair energieverbruik
I. INLEIDING
De Belgische woonmarkt bestaat vooral uit oudere huizen, meer dan de helft van alle residentiële huizen is gebouwd voor 1970 [1]. Meestal zijn deze huizen niet goed geïsoleerd, hebben ze nog steeds enkele beglazing en zijn ze niet erg luchtdicht gebouwd. Bijgevolg is het energieverbruik te wijten aan ruimteverwarming aan de hoge kant. Dit is in contrast met de nieuwbouwwoningen die moeten voldoen aan de EPB-wetgeving en erg energie-efficiënt gebouwd zijn. Maar de huizen die gebouwd zijn na 2006 zijn in de minderheid. Er is dus een grote opportuniteit om oudere gebouwen te renoveren en het energieverbruik te verminderen, en een meer efficiënt verwarmingssysteem te installeren, met behoud van het thermisch comfort.
In renovatieprojecten wordt meestal een gas condensatie ketel voorgesteld ter vervanging van de oudere installatie [2]. In enkele andere bronnen wordt de haalbaarheid van een warmtepomp aangehaald, maar enkel in meer doorgedreven renovaties. [3]
Het doel van deze studie is dan ook om dieper in te gaan op de situatie van de oudere rijhuizen. De meest optimale keuze voor een bepaald verwarmingssysteem is niet altijd even duidelijk, en het thermisch comfort is niet altijd gevrijwaard door mogelijks erg hoge warmteverliezen. Het hoofddoel van deze thesis is dan ook om de compatibiliteit van een verwarmingssysteem met een bepaalde isolatiegraad te onderzoeken. Het thermisch comfort en het energieverbruik zijn de meest belangrijke indicators om te oordelen of een systeem een goede combinatie is met een bepaalde isolatiegraad. Verschillende van deze verwarmingssystemen zijn gemodelleerd in Dymola, en worden gesimuleerd met verschillende isolatiegraden.
Andere literatuurbronnen [4] [5] [6] tonen de belangrijke invloed aan van de bewoner en zijn insteltemperatuur in verschillende berekening en simulaties. Het gebruik van een algemene bewoner of de bouwnorm van een bepaald land resulteert vaak in een uitkomst die verschilt van de werkelijke situatie. Deze verschillen hebben een erg grote invloed op de uitkomst van een simulatie en moeten daardoor meegenomen worden in het onderzoek.
II. AANPAK VAN SIMULEREN
Alle simulaties zijn uitgevoerd in hetzelfde rijhuis, dat een bruto oppervlakte van 123 m² heeft. Vier verschillende verwarmingssystemen worden getest met telkens gradueel oplopende isolatieniveaus. Deze isolatieniveaus zijn theoretisch en hebben als doel het absolute minimum te zoeken waarbij het mogelijk is om een bepaald verwarmingssysteem te installeren. De isolatieniveaus variëren van een totaal ongeïsoleerd huis met enkele beglazing tot een erg goed geïsoleerd huis met performante beglazing. De verschillende niveaus kunnen gevonden worden in onderstaande tabel. Tussenstappen U-waarde muur [W/m² K] U-waarde dak [W/m² K] U-waarde glas [W/m² K] Originele huis 1,70 1,90 5,8 Isolatie niveau 1 1,70 1,90 1,1/ (2,9) Isolatie niveau 2 0,79 0,56 1,1/ (2,9) Isolatie niveau 3 0,52 0,56 1,1/ (2,9) Isolatie niveau 4 0,31 0,31 1,1/ (2,9) Isolatie niveau 5 0,19 0,19 1,1 Tabel 1: Isolatie niveaus
De vier overwogen verwarmingssystemen zijn zo gekozen dat ze per verwarmingssysteem afnemen van temperatuurregime. Het eerste systeem toont de oudere situatie, waarbij er gekozen was voor een stookolieketel met een lagere efficiëntie, en een hoge werkingstemperatuur. Het tweede verwarmingssysteem is een gas condensatie ketel die werkt op de bestaande radiatoren. Het temperatuurregime wordt geregeld via een buitensensor en past het regime aan aan de buitentemperatuur. Gemiddeld genomen is de temperatuur rond de 55°C-45°C. Het derde systeem is een warmtepomp die werkt op een laagtemperatuurregime van 45°C-35°C, samen met de bestaande radiatoren. Het laatste systeem is een droog vloerverwarmingssysteem dat werkt met een warmtepomp van 35°C-30°C.
Elk verwarmingssysteem wordt gesimuleerd voor drie verschillende bewonersprofielen, nl. een laag, gemiddeld en hoog comfort profiel. Het laag en gemiddeld profiel hebben een instel- en verlagingstemperatuur, het hoog comfort profiel heeft enkel een constante insteltemperatuur. De resultaten worden bekijken in drie verschillende ruimtes, namelijk in de leefruimte, de badkamer en de slaapkamer.
III. EVALUATIE VAN DE SIMULATIES
De twee meest belangrijke evaluatieparameters van de simulatie zijn het thermisch comfort en het energieverbruik. Gebaseerd op de
ontevreden mensen genomen als een harde limiet. De tweede indicator is het energieverbruik, maar dit is enkel van belang als het comfort behaald is.
IV. RESULTATEN VAN DE SIMULATIES
De resultaten zijn opgesplitst in twee verschillende aanpakken. Enerzijds is het vertrekpunt het originele huis met enkele beglazing die onmiddellijk vervangen moet worden. Anderzijds is het vertrekpunt een huis waarbij er oudere dubbele beglazing aanwezig is die niet onmiddellijk vervangen moet worden.
Bij elke case wordt een overzichtstabel weergegeven met het primair energieverbruik. Een waarde in zwart betekent dat het comfort behaald is in drie ruimtes, een grijze waarde betekent dat het comfort enkel in de leefruimte en slaapkamer behaald is. Case 1
Bewoner 1
Bewonersprofiel 1 is gekenmerkt door een lage insteltemperatuur en een relatief klein verschil tussen instel- en verlagingstemperatuur. Het hoogste energieverbruik kan vastgesteld worden bij de stookolieketel, maar het comfort is wel in alle drie de ruimtes gegarandeerd. De gas condensatieketel verschaft comfort in de leefruimte en slaapkamer vanaf de originele situatie, maar voor thermisch comfort in de badkamer moet er geïsoleerd worden tot niveau 2.
Een warmtepomp is theoretisch gezien een mogelijkheid vanaf niveau 2, waar de temperaturen net in de comfortzone vallen. Het is meer aangeraden om te isoleren tot niveau 4, waar de temperaturen beter aansluiten bij de insteltemperatuur. Desondanks wordt het thermisch comfort in de badkamer nooit bereikt. Dit betekent dat zelfs voor een bewonersprofiel met een lage insteltemperatuur, een extra verwarmingssysteem of groter gedimensioneerde radiatoren overwogen moeten worden.
Het vloerverwarmingssyteem zorgt voor comfort vanaf isolatieniveau 2 in de leefruimte en slaapkamer. Een volledig comfort, inclusief badkamer, kan bereikt worden vanaf niveau 4. Het primair energieverbruik is dan het laagste van alle verwarmingssystemen, maar de installatiekosten zijn de hoogste.
Primair energieverbruik [kWh/m² jaar]
Origineel huis Niveau 1 Niveau 2 Niveau 3 Niveau 4 Niveau 5
Bewoner 1 – 1h Verwarmingsvraag 142 107 51 46 35 26 Vermindering [%] -25 -64 -68 -75 -82 Stookolieketel 196 Gas condensatie ketel 135 102 47 42 31 23 Warmtepomp 45°C - - 34 30 21 15 Warmtepomp max 50°C - - 36 32 23 16 Vloerverwarming (geen verlagingstemp.) - - 27 24 18 15
Tabel 2: Samenvatting bewoner 1, case 1 Bewoner 2
Het tweede bewonersprofiel is gekenmerkt door een groter verschil tussen instel-en verlagingstemperatuur. Hierdoor is het comfort enkel gerealiseerd in de meer geïsoleerde niveaus. In de situatie van het originele huis, kan enkel een hoog temperatuurregime zorgen voor comfort. Wanneer enkel de ramen vervangen zijn
in de leefruimte en slaapkamer, en vanaf isolatieniveau 4, ook in de badkamer.
Een warmtepomp kan enkel overwogen worden in de meer geïsoleerde niveaus, maar kan enkel zorgen voor comfort in de leefruimte en slaapkamer. Een vloerverwarmingssysteem kan geïnstalleerd worden vanaf niveau 2, maar kan ook nooit comfort garanderen in de badkamer. Een vloerverwarmingssysteem heeft hier eerder comfort dan de warmtepomp met de radiatoren, doordat het vloerverwarmingssysteem geen verlagingstemperatuur heeft. De constante temperatuur speelt een belangrijke rol.
Het laagste primair energieverbruik kan gezien worden bij de warmtepompen, hoewel deze geen volledig comfort bieden, in tegenstelling tot de gas condensatie ketel.
Primair energieverbruik [kWh/m² jaar]
Origineel huis Niveau 1 Niveau 2 Niveau 3 Niveau 4 Niveau 5 Bewonder 2 – 1h Verwarmingsvraag 177 134 64 57 43 33 Stookolieketel 220 Gas condensatie ketel - 110 49 43 31 22 Warmtepomp 45°C - - - - 21 14 Warmtepomp max 50°C - - - 33 23 16 Vloerverwarming (geen verlagingstemp.) - - 27 24 18 14
Tabel 3: Samenvatting bewoner 2, case 1 Bewoner 3
Het derde bewonersprofiel is gekenmerkt door een hoge insteltemperatuur en geen verlagingstemperatuur, wat betekent dat de hoge insteltemperatuur temperatuur altijd behouden blijft. Bijgevolg is de binnentemperatuur meer constant en moet er geen groot verschil in temperatuur opgehaald worden. Dit resulteert in een eerder behaald comfort.
Als het huis in de originele staat is, kan enkel de stookolieketel zorgen voor een thermisch comfort. Maar, vanaf isolatieniveau 2 garandeert de gas condensatie ketel ook een compleet comfort in alle ruimtes. Dezelfde conclusie kan getrokken worden voor de warmtepomp in combinatie met de radiatoren, waar er ook comfort in drie ruimtes is vanaf niveau 2. Dit is in tegenstelling met de vloerverwarming, die een meer doorgedreven renovatie vraagt.
Hoewel het comfort eerder gerealiseerd is bij bewoner 3 dan bij de andere bewoners, heeft dit een hoger energieverbruik tot gevolg.
Primair energieverbruik [kWh/m² jaar]
Origineel huis Niveau 1 Niveau 2 Niveau 3 Niveau 4 Niveau 5 Bewoner 3 Verwarmingsvraag 216 163 78 70 53 40 Stookolieketel 332 Gas condensatie ketel 221 167 75 67 49 35 Warmtepomp 45°C - - 56 50 36 26 Vloerverwarming (geen verlagingstemp.) - - - 30 23 18
Tabel 4: Samenvatting bewoner 3, case 1
Starttijd van de verwarming
Deze factor heeft een grote invloed op het thermisch comfort van een ruimte. Er worden telkens drie scenario’s gesimuleerd. Het eerste geval is waarbij de verwarming enkel aan is wanneer er een bewoner aanwezig is (0h), het tweede scenario is waarbij de verwarming één uur eerder opgestart wordt (1h), en het laatste geval is waarbij er geen verlagingstemperatuur is (geen verlaginstemp.).
Het scenario zonder verlagingstemperatuur zorgt voor eerder comfort dan de twee andere scenario’s. Maar het meest ideale scenario is waarbij de verwarming één uur voor aanwezigheid start, omdat het de meest optimale balans heeft tussen comfort en energieverbruik. Een voorbeeld hiervan kan gevonden worden in Figuur 1, waarbij de cumulatieve discomfort uren getoond worden voor een verwarmingssysteem met een warmtepomp, voor bewonersprofiel 2. Een significant verschil is te zien tussen de drie scenario’s.
Figuur 1: Cumulatieve discomfort uren voor een verwarmingssysteem met een warmtepomp en bestaande radiatoren, bewoner 2
Verwarmingsregime
Vier verschillende verwarmingssystemen worden gesimuleerd in combinatie met verschillende bewoners en isolatieniveaus. Maar deze verwarmingssystemen zijn nu enkel getest met één regime, behalve voor de warmtepomp met de radiatoren. In plaats van enkel te werken met een vaste watertemperatuur van 45°C, wordt de situatie met een aanpasbare verwarmingscurve ook gesimuleerd, met een maximum watertemperatuur tot 50°C. In Figuur 2 is het verschil tussen de twee temperatuurregimes getoond. Er is een duidelijke afname van het aantal uren waar er thermische onbehaaglijkheid heerst, vooral in de minder geïsoleerde niveaus en in de badkamer. In sommige gevallen kan deze aanpassing leiden tot een eerder gerealiseerd thermisch comfort. Dit kan betekenen dat een warmtepomp geïnstalleerd kan worden in een huis zonder dat er een doorgedreven renovatie uitgevoerd is, hoewel het energieverbruik wel hoger ligt.
Figuur 2: Verschil in percentage cumulatieve discomfort uren/ jaar voor 45°C
Dimensionering van de radiatoren
De bestaande dimensionering van de radiatoren spelen een belangrijke rol. In dit geval zijn de originele dimensionering 2,7 tot 1,5 keer de warmteverliesberekening gesimuleerd, volgens oude dimensioneringsregels. Maar in het geval dat de originele radiatoren minder vermogen hebben, kan de haalbaarheid van een laag temperatuurregime in het gedrang komen. Enkel in de meest geïsoleerde niveaus is het dan mogelijk om een warmtepomp te installeren, en in sommige gevallen is het zelf niet mogelijk. Dit wordt geïllustreerd door Figuur 3, waar de alternatieve dimensioneringen getoond worden voor bewonersprofiel 2, in het geval er verwarmd wordt met een warmtepomp met radiatoren. De alternatieve dimensionering zijn hier gradueel dichter gekozen bij de warmteverliesberekeningen.
Waar bij de originele dimensies het thermisch comfort in de leefruimte en slaapkamer behaald is op isolatieniveau 5, is het comfort niet altijd gerealiseerd in de alternatieve dimensioneringen.
Figuur 3: Alternatieve dimensionering van de radiatoren
A. Case 2 Bewoner 1
Wanneer er gekeken wordt naar de situatie met enkel de oude dubbele beglazing, zorgt een stookolieketel voor comfort in de drie ruimtes. Dit staat in contrast met de gas condensatie ketel, die enkel comfort garandeert in de leefruimte en slaapkamer. De badkamer is enkel thermisch behaaglijk wanneer er een minimum aan isolatie geplaatst is. Een warmtepomp (45°C) behoort niet tot de mogelijkheden wanneer het huis nog oudere dubbele beglazing heeft. Wanneer er gekozen wordt voor een aanpasbare verwarmingscurve (tot maximum 50°C), wordt het comfort wel gerealiseerd vanaf isolatieniveau 2 in de leefruimte en slaapkamer. Een vloerwarmingsysteem is enkel een mogelijkheid wanneer het huis geïsoleerd is tot isolatieniveau 3, en de vloerverwarming constant in gebruik is.
Primair energieverbruik [kWh/m² jaar]
Niveau 1 Niveau 2 Niveau 3 Niveau 4
Bewoner 1 – 1h Verwarmingsvraag 125 66 61 49 Vermindering [%] 47 52 61 Stookolieketel 169 Gas condensatie ketel 109 58 53 43 Warmtepomp 45°C - - - - Warmtepomp max 50°C - 49 45 35 Vloerverwarming (geen verlagingstemp.) - - 32 27
Bewoner 2
Op niveau 1, waar enkel de beglazing vervangen werd met oudere dubbele beglazing, is enkel een hoog temperatuurregime mogelijk voor een thermisch behaaglijke omgeving. Het verwarmingssysteem vervangen is enkel mogelijk met een gas condensatie ketel, hoewel er nooit thermisch comfort in de badkamer bereikt kan worden. Verwarmen met de bestaande radiatoren en een warmtepomp is geen mogelijkheid.
Een warmtepomp in combinatie met vloerverwarming kan wel vanaf isolatieniveau 4, voor de leefruimte en de slaapkamer. De verwarming is in dit geval wel constant aan.
Primair energieverbruik [kWh/m² jaar]
Niveau 1 Niveau 2 Niveau 3 Niveau 4
Bewoner 2 – 1h Verwarmingsvraag 152 82 67 62 Stookolieketel 188 Gas condensatie ketel 117 62 57 45 Warmtepomp 45°C - - - - Warmtepomp max 50°C - - - - Vloerverwarming (geen verlagingstemp.) - - - 27
Tabel 6: Samenvatting bewoner 2, case 2 Bewoner 3
De bewoner zonder verlagingstemperatuur en een hoge insteltemperatuur heeft een hoger comfort dan de andere bewonersprofielen. Door het feit dat de verwarming constant aan staat, zorgt een gas condensatie ketel al voor een compleet comfort vanaf isolatieniveau 2, waarbij er enkel een minimum van isolatie geplaatst is. Een warmtepomp met bestaande radiatoren is mogelijk van isolatieniveau 2, en een compleet comfort vanaf niveau 3, maar bijgevolg is het energieverbruik wel aan de hoge kant. Vloerverwarming is hier niet mogelijk, de hoge temperaturen kunnen niet bereikt worden.
Primair energieverbruik [kWh/m² jaar]
Niveau 1 Niveau 2 Niveau 3 Niveau 4
Bewoner 3 Verwarmingsvraag 186 101 93 76 Stookolieketel 284 Gas condensatie ketel 177 94 87 70 Warmtepomp 45°C - 73 69 57 Vloerverwarming (geen verlagingstemp.) - - - -
Tabel 7: Samenvatting bewoner 3, case 2 Case 1 Vs. Case 2
De vergelijking tussen case 1 en case 2 toont het belang van de timing van het vervangen van de ramen. Het verschil is het meest waarneembaar voor de lagere temperatuurregimes, zoals de warmtepomp met de originele radiatoren of de warmtepomp met de vloerverwarming.
De mogelijkheid om de oudere installatie te vervangen met een gas condensatie ketel is quasi gelijk voor beide gevallen, het enige verschil is het primair energieverbruik, wat hoger is voor geval 2. Daarentegen is verwarmen met een warmtepomp een grotere uitdaging. Waar in geval 1 de warmtepomp met de bestaande radiatoren een thermisch comfort (in de leefruimte en slaapkamer)
mogelijkheid voor bewoner 1 en 2. In het geval van bewoner 3 is de situatie ongewijzigd; isolatieniveau 2 blijft het minimum.
Het meest uitgesproken verschil is op te merken bij de vloerverwarming. In geval 1 is isolatieniveau 2 een minimum voor bewoner 1 en 2, en isolatieniveau 4 voor bewoner 3. In het tweede geval is dit minimum opgetrokken tot niveau 3 voor bewoner 1 en niveau 4 voor bewoner 2, en zelf helemaal geen mogelijkheid voor bewoner 3.
Een andere belangrijke factor voor case 2 met de oudere dubbele beglazing is het energieverbruik. Hoe meer geïsoleerd het huis is, hoe duidelijker het verschil is tussen beide gevallen. De oudere beglazing heeft een grotere impact op de energieconsumptie op niveau 4 dan op niveau 2.
Figuur 4: Verschil in primair energieverbruik tussen case 1 en case 2
V. CONCLUSIE
In deze studie is de combineerbaarheid van een verwarmingssysteem met een ouder huis onderzocht. Vier verschillende verwarmingssystemen zijn gesimuleerd in gradueel oplopende isolatieniveaus, met verschillende bewonersprofielen. Een algemene conclusie die kan gemaakt worden is dat de meest optimale balans tussen thermisch comfort en energieverbruik is wanneer de verwarming één uur wordt opgestart voor de aanwezigheid van de bewoners. Het vervangen van een ouder verwarmingssysteem is bijna in elke situatie mogelijk met een gas condensatie ketel, mits het eventueel installeren van een bijverwarming in de badkamer. Verwarmen met een warmtepomp is meestal enkel haalbaar in de meer geïsoleerde niveaus, hoewel het sterk afhangt van het tijdstip waarop de verwarming gestart wordt en het bewonersprofiel.
Factoren zoals de dimensionering van de radiatoren, het bewonersprofiel met verschillende insteltemperaturen en het moment waarop de verwarming gestart wordt (0h, 1h, geen verlagingstemperatuur) hebben een grote invloed op het eventueel creëren van een thermische behaaglijke situatie, en op het primair energieverbruik.
De resultaten zijn afhankelijk van de simulaties. Andere methodes of andere ontwikkelde modellen kunnen resulteren in afwijkende resultaten. Het combineren van deze simulatieresultaten met data uit de realiteit kan in dit geval nuttig zijn om de resultaten af te toetsen aan de werkelijkheid.
[2] Van Holm, M., Verbeke, S., Cuypers, D., & Vandevelde, B. (2014). Belgische woningtypologie Nationale brochure over de TABULA woningtypologie.
[3] CARSA, TUDelft, METU, Cyl. (2018). Series of energy efficient conservation interventions and their impact and results of the validation of the SUI concept ( M12 ) Haarlem [Internal document].
[4] Andersen, R. K. (2012). The influence of occupants’ behaviour on energy consumption investigated in 290 identical dwellings and in 35 apartments. Abstract from 10th International Conference on Healthy Buildings, Brisbane, Australia. [5] Mora, D., Carpino, C., & De Simone, M. (2018). Energy
consumption of residential buildings and occupancy profiles. A case study in Mediterranean climatic conditions. Energy Efficiency, 11(1), 121–145.
[6] De Meester, T., Marique, A. F., De Herde, A., & Reiter, S. (2013). Impacts of occupant behaviours on residential heating consumption for detached houses in a temperate climate in the northern part of Europe. Energy and Buildings, 57, 313– 323.
Table of contents
FREQUENTLY USED SYMBOLS OR ABBREVIATIONS ... 5
LIST OF TABLES ... 6
LIST OF FIGURES ... 7
PART 1: LITERATURE STUDY ... 11
1. CONTEXT OF THE LITERATURE STUDY ... 11
1.1. RENOVATION CONTEXT IN BELGIUM ... 11 1.2. ENERGY CONSUMPTION IN BELGIUM ... 12
2. LITERATURE RESEARCH ... 15
2.1. TABULA: BELGIAN HOUSING MATRIX ... 15 2.2. HEATING SYSTEMS IN RENOVATION CONTEXT ... 19 2.3. EXEMPLARY STUDY: LOW TEMPERATURE REGIME IN OLD TERRACED HOUSES ... 20 2.4. SIMULATION PARAMETERS ... 22
2.4.1. OCCUPATION ... 22 2.4.1.1. INFLUENCE OF THE OCCUPANTS ... 22 2.4.1.2. INFLUENCE OF THE RENOVATION: REBOUND EFFECT ... 23 2.4.1.3. OCCUPANCY SCHEDULES ... 23 2.4.2. COMFORT ... 26 2.4.2.1. DIFFERENT COMFORT / SETPOINT DEFINITIONS ... 26 2.4.2.2. EVALUATION OF COMFORT: FANGER MODEL... 28 2.4.2.3. TEMPERATURE EXCEEDANCE METHOD ... 29 2.4.2.4. WEIGHTED TEMPERATURE EXCEEDANCE METHOD ... 30
PART 2: RESEARCH ... 31 3. RESEARCH QUESTIONS ... 31 3.1. EVALUATION CRITERIA ... 31 3.1.1. COMFORT ... 32 3.2.2. ENERGY CONSUMPTION ... 32 3.2.3. INSULATION LEVELS ... 33 4. DEVELOPED MODELS ... 35 4.1. BUILDING ENVELOPES ... 35
4.2.1. THE DIMENSIONING OF THE RADIATORS ... 37 4.2.2. RADIATOR WITH GAS BOILER 90°C – 70 °C ... 39 4.2.3. RADIATOR WITH GAS CONDENSING BOILER ... 40 4.2.4. RADIATOR WITH HEAT PUMP 45°C-35°C ... 41 4.2.5. FLOOR HEATING ... 42
4.3. COMFORT MODEL ... 43 4.4. OCCUPANTS ... 48
4.4.1. A LOW COST PROFILE ... 48 4.4.2. AVERAGE PROFILE ... 49 4.4.3. HIGH COST PROFILE ... 49
PART 3: RESULTS ... 51
5. RESULTS ... 51
5.1. CASE 1: EARLY REPLACEMENT OF THE WINDOWS ... 53
5.1.1. ORIGINAL STATE: OIL BOILER WITH RADIATORS, 90-70°C ... 53 5.1.1.1. OCCUPANT 1 ... 53 5.1.1.2. OCCUPANT 2 ... 54 5.1.1.3. OCCUPANT 3 ... 55 5.1.2. RENOVATION ... 57 5.1.2.1. RADIATORS WITH GAS CONDENSING BOILER ADAPTIVE HEATING CURVE ... 57 5.1.2.1.1. OCCUPANT 1... 57 5.1.2.1.2. OCCUPANT 2... 60 5.1.2.1.3. OCCUPANT 3... 62 5.1.2.2. RADIATORS WITH HEAT PUMP 45-35 °C ... 65 5.1.2.2.1. OCCUPANT 1... 66 5.1.2.2.2. OCCUPANT 2... 68 5.1.2.2.3. OCCUPANT 3... 71 5.1.2.2.4. COMFORT IMPROVEMENT: HEATING CURVE ... 73 5.1.2.2.5. ILLUSTRATION: OTHER DIMENSIONING OF THE RADIATORS ... 78 5.1.2.3. FLOOR HEATING 35 °C ... 83 5.1.2.3.1. OCCUPANT 1... 84 5.1.2.3.2. OCCUPANT 2... 85 5.1.2.3.3. OCCUPANT 3... 87 5.1.2.4. CONCLUSION CASE 1 ... 89
5.2. CASE 2: OLD DOUBLE GLASS PANE WINDOWS ... 93
5.2.1. ORIGINAL STATE: GAS BOILER WITH RADIATORS, 90-70°C ... 93 5.2.2. RENOVATION ... 93 5.2.2.1. RADIATORS WITH GAS CONDENSING BOILER ... 94 5.2.2.1.1. OCCUPANT 1... 94 5.2.2.1.2. OCCUPANT 2... 95 5.2.2.1.3. OCCUPANT 3... 96 5.2.2.2. RADIATORS WITH HEAT PUMP ... 97 5.2.2.2.1. OCCUPANT 1... 97 5.2.2.2.2. OCCUPANT 2... 98 5.2.2.2.3. OCCUPANT 3... 100
5.2.2.2.4. IMPROVEMENT HEATING CURVE ... 101 5.2.2.3. FLOOR HEATING ... 103 5.2.2.3.1. OCCUPANT 1... 103 5.2.2.3.2. OCCUPANT 2... 104 5.2.2.3.3. OCCUPANT 3... 105 5.2.2.4. CONCLUSION CASE 2 ... 106 5.2.2.5. COMPARISON CASE 1 AND CASE 2 ... 108
6. CONCLUSION ... 111
6.1. GENERAL CONCLUSION ... 111 6.2. FURTHER RESEARCH ... 111
7. BIBLIOGRAPHY... 113
8. APPENDIX ... 117
APPENDIX A.1: SETPOINT TEMPERATURES OF SIMULATION STUDIES ... 119
APPENDIX A.2: OCCUPANCY PROFILES OF SIMULATION STUDIES ... 121
APPENDIX B: CALIBRATION OCCUPANCY PROFILES TO FANGER METHOD ... 123
APPENDIX C: COMPOSITION OF CONSTRUCTION ELEMENTS ... 126
Frequently used symbols or abbreviations
Abbreviations Explanation Unit
0h The heating only starts when
someone is present
1h The heating starts one hour
before someone is present
COP Coefficient of performance -
EPB ‘Energie-prestatie en
binnenklimaat’
Energy perfomance and indoor climate - EPC ‘Energie-prestatie-certificaat’ Energy performance certificate -
HVAC Heating, ventilation and air conditioning
-
n-50 Infiltration rate h-1
NZEB Nearly zero energy building -
PMV Predicted mean vote %
PPD Percentage people dissatisfied %
PPSAVERAGE Average percent people
satisfied
%
PV panel Photo-voltaic panel -
List of Tables
Table 1: Distribution of houses based on date of construction and typology ... 11 Table 2: Components of the E-level ... 12 Table 3: Overview of calculation of the E-level, (Energiesparen, n.d.-d) ... 13 Table 4: Construction and heating installation characteristics based on date of construction (Tabula-project) ... 15 Table 5: Typical information on fiche Tabula-project ... 16 Table 6: U-values of low energy renovation (Tabula-project)... 16 Table 7: U-values of nearly energy zero building renovation (Tabula-project) ... 17 Table 8: Most common heating possibilities ... 19 Table 9: Temperature and setback time of general occupant, according to building standard of each country ... 22 Table 10: U-values of the simulations, case 1 ... 33 Table 11: U-values of the simulations, case 2 ... 34 Table 12: Gross and net floor area of the Venning house... 35 Table 13: Starting U-values, based on Tabula 1945-1970 ... 37 Table 14: U-values of typical house of 1971-1990 ... 37 Table 15: Power radiators 90°C-70°C ... 37 Table 16: Power radiators heat loss simulation ... 38 Table 17: Power radiators 75°C-65°C ... 38 Table 18: Power radiators 45°C -35°C ... 38 Table 19: Comfort bands classified according to PMV ... 43 Table 20: Internal heat gains ... 48 Table 21: Setpoint temperatures low cost profile ... 48 Table 22: Occupancy schedule low cost profile ... 48 Table 23: Setpoint temperature average profile ... 49 Table 24: occupancy schedule average profile ... 49 Table 25: Setpoint temperature high-cost profile ... 49 Table 26: Occupancy schedule high-cost profile ... 49 Table 27: Occupant 1-1h: temperature on 15 January ... 59 Table 28: comparison energy consumption 1h and no setback, seen from scenario 1h. Black represents two or less rooms in the comfort band, bold represents three rooms in comfort band. ... 60 Table 29: Occupant 2-1h: temperature on 15 January ... 62 Table 30: occupant 3: temperature on 15 January ... 63 Table 31: Differences in energy consumption between occupants, seen from the first mentioned occupant ... 63 Table 32: Occupant 1-1h: temperature on 15 January ... 68 Table 33: Occupant 2-1h: temperature on 15 January ... 71 Table 34: Occupant 3: temperature on 15 January ... 72 Table 35: Occupant 1-1h: difference in setpoint temperature between a heat pump with max 50°C and 45°C ... 75 Table 36: Occupant 1-1h: difference in energy consumption between HP with max 50°C and 45°C .. 75 Table 37: Occupant 2-1h: difference in energy consumption between HP with max 50°C and 45°C .. 75 Table 38: Occupant 2-1h: difference in setpoint temperature between HP with max 50°C and 45°C . 77 Table 39: Alternative dimensions radiators ... 78
Table 40: Occupant 1-1h: Difference in temperature on 15 January: alternative dimension 2 ... 79 Table 41: Occupant 1-1h: Difference in temperature on 15 January: alternative dimension 3 ... 79 Table 42: Occupant 2-1h: Difference in temperature on 15 January: alternative dimension 2 ... 80 Table 43: Occupant 2-1h: Difference in temperature on 15 January: alternative dimension 3 ... 80 Table 44: Occupant 3: Difference in temperature on 15 January: alternative dimension 2 ... 81 Table 45: Occupant 3: Difference in temperature on 15 January: alternative dimension 3 ... 81 Table 46: occupant 1: temperature on 15January ... 85 Table 47: Occupant 2: temperature on 15 January ... 87 Table 48: Occupant 3: temperature on 15 January ... 88 Table 49: Case 1: Overview energy consumption ... 89 Table 50: Case 1: overview energy prices ... 91 Table 51: Oil boiler: difference in primary energy between case 1 and 2 ... 93 Table 52: Case 2: insulation degrees ... 93 Table 53: occupant 1-1h: temperature on 15 January ... 94 Table 54: Occupant 2-1h: temperature on 15 January ... 95 Table 55: occupant 3: temperature on 15 January ... 96 Table 56: occupant 1-1h: temperature on 15 January ... 97 Table 57: comparison primary energy consumption between case 1 and case 2, seen from case 1. .. 97 Table 58: Occupant 2-1h: actual temperature on 15January ... 99 Table 59: Occupant 3: actual temperature on 15January ... 100 Table 60: Occupant 1: actual temperature on 15January, comparison between HP 45°C and 50°C . 102 Table 61: Occupant 2: actual temperature on 15January, comparison between HP 45°C and 50°C . 102 Table 62: Occupant 1: actual temperature on 15 January ... 103 Table 63: Occupant 2: actual temperature on 15 January ... 104 Table 64: occupant 3: actual temperature on 15 January ... 105 Table 65: Case 2: overview comfort versus energy consumption ... 107 Table 66: Overview prices case 2 for each heating system ... 108
List of Figures
Figure 1: Average energy performance score based on date of construction ... 11 Figure 2: Page 1 of fiche Tabula: existing situation ... 17 Figure 3: Page 2 of fiche Tabula: renovation proposal ... 18 Figure 4: Page 3 of fiche Tabula: energy performance and comfort ... 18 Figure 5: Seven occupancy profiles (Aerts, Minnen, Glorieux, Wouters, & Descamps, 2012) ... 24 Figure 6: Seven occupancy profiles from the Netherlands (Guerra-Santin & Silvester, 2017) ... 25 Figure 7: Increase of energy consumption according to setpoint temperature (Mora, Carpino, & De Simone, 2018) ... 27 Figure 8: Relation of PPD to PMV Fabbri (2015). ... 28 Figure 9: Weighting factors for primary energy (ISO 52000-1, 2017) ... 32 Figure 10: Floor plans of the considered Venning house ... 35 Figure 11: Building envelope in Modelica ... 36 Figure 12: Oil boiler with radiators 90°C-70°C in Modelica... 39 Figure 13: Gas condensing boiler with radiators in Modelica ... 40
Figure 15: Heat pump with floor heating in Modelica ... 42 Figure 16: Division in comfort bands based on PMV in Modelica ... 43 Figure 17: Cumulative comfort hours in Modelica ... 44 Figure 18: Visualization of area from which average PPD is calculated, based on image of Fabbri (2015). ... 45 Figure 19: Calculation average PPD, based on presence and PPD in Modelica ... 46 Figure 20: Overview simulations ... 51 Figure 21: Oil boiler occupant 1: average people satisfied and primary energy ... 53 Figure 22: Oil boiler occupant 1: percentage and absolute discomfort hours/ year ... 54 Figure 23: Oil boiler occupant 2: average people satisfied and primary energy ... 54 Figure 24: Oil boiler occupant 2: percentage and absolute discomfort hours/ year ... 55 Figure 25: Oil boiler occupant 3: percentage comfort hours and primary energy ... 56 Figure 26: Water setpoint temperature of the gas condensing boiler, from 12 December to 20 March ... 57 Figure 27: Gas condensing boiler occupant 1: average people satisfied and primary energy ... 58 Figure 28: Gas condensing boiler occupant 1: percentage and absolute discomfort hours/ year ... 59 Figure 29: Gas condensing boiler occupant 2: average people satisfied and energy use... 61 Figure 30: Gas condensing boiler occupant 2: percentage and absolute discomfort hours/ year ... 61 Figure 31: Gas condensing boiler occupant 3: average people satisfied and energy consumption ... 62 Figure 32: Setpoint temperature and outdoor temperature in relation to COP ... 65 Figure 33: Heat pump occupant 1: average people satisfied and energy consumption ... 67 Figure 34: Heat pump occupant 1: cumulative discomfort hours ... 67 Figure 35: Heat pump occupant 2: average people satisfied and primary energy ... 70 Figure 36: Heat pump occupant 2: absolute and cumulative discomfort hours ... 70 Figure 37: Heat pump occupant3: average people satisfied and energy consumption ... 72 Figure 38: Heat pump occupant 3: absolute and cumulative discomfort hours / year ... 72 Figure 39: Heat pump occupant 1: comparison between setpoint 45°C and 50°C ... 74 Figure 40: Heat pump occupant 1: comparison between setpoint 45°C and 50°C ... 74 Figure 41: Heat pump occupant 2: comparison between setpoint 45°C and 50°C ... 76 Figure 42: Heat pump occupant 2: comparison between setpoint 45°C and 50°C ... 77 Figure 43: Heat pump occupant 1: Percentage cumulative discomfort hours alternative dimensions 79 Figure 44: Heat pump occupant 2: Percentage cumulative discomfort hours alternative dimensions 80 Figure 45: Heat pump occupant 3: Percentage cumulative discomfort hours alternative dimensions 81 Figure 46: Setpoint temperature and outdoor temperature in relation to COP ... 83 Figure 47: Floor heating occupant 1: average people satisfied and energy consumption ... 84 Figure 48: Floor heating occupant 1: absolute and cumulative discomfort hours / year ... 85 Figure 49: Floor heating occupant 2: average people satisfied and energy consumption ... 86 Figure 50: Floor heating occupant 2: absolute and cumulative discomfort hours / year ... 86 Figure 51: Floor heating occupant 3 : average people satisfied and energy consumption ... 87 Figure 52: Floor heating occupant 3: absolute and cumulative discomfort hours / year ... 88 Figure 53: Case 1: overview primary energy consumption ... 90
Figure 54: Gas boiler occupant 1: Percentage cumulative discomfort hours and energy consumption 94
Figure 55: Gas boiler occupant 2: Percentage cumulative discomfort hours and energy consumption ... 95 Figure 56: Gas boiler occupant 3: Percentage cumulative discomfort hours and energy consumption ... 96 Figure 57: Heat pump occupant 1: percentage cumulative discomfort hours and energy consumption ... 98
Figure 58: Heat pump occupant 2: percentage cumulative discomfort hours and energy consumption ... 99 Figure 59: Heat pump occupant 3: percentage cumulative discomfort hours and energy consumption ... 100 Figure 60: Heat pump occupant 1: Comparison cumulative discomfort hours and energy consumption between HP 45°C and max 50°C ... 101 Figure 61: Heat pump occupant 2: Comparison cumulative discomfort hours and energy consumption between HP 45°C and max 50°C ... 102 Figure 62: Floor heating occupant 1: percentage cumulative discomfort hours and energy consumption ... 103 Figure 63: Floor heating occupant 2: percentage cumulative discomfort hours and energy consumption ... 104 Figure 64: Floor heating occupant 3: percentage cumulative discomfort hours and energy consumption ... 105 Figure 65: Case 2: Overview primary energy consumption ... 106 Figure 66: Comparison primary energy use ... 109
PART 1: LITERATURE STUDY
1. Context of the literature study
1.1. Renovation context in Belgium
Newly built houses have a lot of options to heat with sustainable heat sources. Construction elements have a low thermal transmittance and the energy consumption due to heating is very low. Options such as low temperature regimes could be considered. But those low-energy houses are in the minority. According to the statistics of StatBel, the Belgian statistical office, 80% of all the buildings were built before 1990, and even almost 60% before 1970 (Statbel, 2019). This can be seen in Table 1.
<1945 1946-1970 1971-1991 1992-2002 2002-2011 2011-… Total % Terraced house 751,740 238,888 107,970 25,189 29,796 23,981 1,177,564 26.6 Semi-detached 370,107 272,212 167,269 49,657 64,471 49,383 973,099 22.0 Detached house 252,774 300,766 456,086 210,894 133,170 58,676 1,412,366 31.9 Apartment buildings 53,128 56,216 36,545 19,941 25,341 16,545 207,716 4.7 Other 151,552 166,404 180,948 66,114 45,297 45,297 655,612 14.8 Total 1,579,301 1,034,486 948,818 371,795 298,075 193,882 4,426,357 100 % 35.7 23.4 21.4 8.4 7.0 4.0 100
Those older houses usually have a higher energy consumption. This can be seen in Figure 1, where the average energy score [kWh/m²] is displayed, grouped together according to the year of construction of the house (Verbeeck, 2015). The older houses have a high energy score, which is a consequence of the lack of insulation and older glazing. Additionally, houses of the 1960s are not very airtight most of the time, and can have a very high n-50 value, which is nefarious for the indoor comfort and energy consumption. But nevertheless, those uninsulated houses have much potential. With some (gradual) improvements, the energy consumption and the thermal comfort of a house could be drastically improved.
1.2. Energy consumption in Belgium
Global warming is a very topical issue nowadays. Every sector strives to reduce its impact and tries to save energy. As of today, the residential heating is responsible for 13.3 % of the total emission in Belgium (Klimaat.be, n.d.). To have a broader context of the energy consumption in Belgium, and how the government deals with trying to reduce its impact, a closer look is taken to the EPB regulations.
In 2002, the European Union approved the directive 2002/91/EG, the EPBD or the Energy Performance Building Directive, to reduce the emission of CO2. This resulted in the EPB guidelines, the minimum demands for energy performance of buildings. The ultimate goal of the EPBD is to eliminate CO2 emission of the (residential) heating sector. In 2050, all newly built houses and older houses must be zero emission buildings. The EPB is concerned with the insulation, ventilation, installations and overheating. At this moment, the EPB is not valid for every building. In the residential sector, only newly built houses or houses which have undergone a very thorough renovation have to meet the demands. (Energiesparen, n.d.-d)
EPB in Flanders
The Flemish government implemented the EPB- method in 2006 to control the energy efficiency of the newly built houses and renovated houses. Two important aspects of the EPB in Flanders are the E-level and the S-level.
E-level
Energy performance Indoor climate
Building envelope Installation
U and R values S-level Installation demands Ventilation K- level Renewable energy installations Overheating Net energy consumption
Table 2: Components of the E-level (Energiesparen, n.d.-a)
The E-level indicates how much gross energy is consumed compared to a reference building with the same dimensions. It is a dimensionless number that indicates the global energy prestation of a building. In 2006, an E-level of 100 was the norm, whereas from 2020 onwards, an E-level of 35 is the new norm in Flanders. This means a building or an apartment must be nearly energy neutral. The required E-level for extensive renovations is 70.
The S-level only concerns the building envelope. It is more narrow than the E-level, because it only expresses the energy efficiency of the envelope of the building. It is a dimensionless number that takes into account the heat losses and the heat gains. Together, the S-level and the E-level are concerned with two energy conserving steps. First, the energy demand is lowered with a good insulated building envelope, indicated by the S-level. Secondly, the performance of the installations can be improved, which is an important factor in the calculation of the E-level. The next few paragraphs take a closer look at how the E-level is calculated. (Energiesparen, n.d.-b, n.d.-e)
E-level calculation method
An overview of the calculation can be found in Table 3. Firstly, the monthly net energy need is calculated. The building is split up into sub-volumes with the same EPB-demands. In most houses, the demands are the same for the whole building, which results in one zone, with one setpoint temperature of 18°C. Secondly the net energy need is converted to monthly gross energy need. This figure is determined by the efficiency of the delivery, the efficiency of the transport and the efficiency of the storage of a heating system.
After this, as a third step, the monthly end use of energy is calculated for space heating and domestic hot water. In addition, the monthly end energy use for auxiliary functions is calculated, along with the end energy use for cooling and the electricity production of CPH installation or PV-panels. The fourth step is the conversion of the monthly gross energy to yearly primary energy consumption. The primary energy is calculated with the conversion factors, which are specific for each fuel.
Step 1 & step 2 Step 3 Step 4 Step 5
Heating
Heat losses Monthly net energy need Monthly gross energy need Monthly end energy use for space heating Monthly total to yearly energy end consumption + conversion to primary energy Characteristic yearly primary energy consumption and reference value E-level Useful heat gains System efficiency Generation efficiency Domestic hot water
System efficiency End energy use for domestic hot
water Contribution of the thermal solar
energy system Generation efficiency
Auxiliary
Energy use of the auxiliary function of the installation Energy use for the auxiliary functions and the ventilators Energy use of the ventilators
Cooling End energy use for cooling PVV
WKK
Energy gain because of CHP or PV-panels
Table 3: Overview of calculation of the E-level, (Energiesparen, n.d.-c)
Finally the reference value for the characteristic yearly primary energy consumption is calculated. This value is important to make an E-level independent from the dimensions of the building. A large building uses more energy, but by dividing the building by the reference value, the E-level is more independent. The reference value takes into account the surface, the protected volume and ventilation (Flemish Government & Flemish Energy Agency (VEA), 2018).