003136
Published by:
National Institute for Public Health and the Environment
P.O. Box 1 | 3720 BA Bilthoven www.rivm.com
november 2011
Exposure and
potential
health effects
Exposure and potential health effects associated with the use of PX-10
in the Dutch armed forces
Ook voor de subtitel is ruimte gereserveerd en deze kan over 1 of meer regels lopen
en wordt verticaal in het midden uitgelijnd
Exposure and potential health effects
associated with the use of PX-10 in the
Dutch Armed Forces
Colophon
© RIVM 2011
Parts of this publication may be reproduced, provided acknowledgement is given to the 'National Institute for Public Health and the Environment', along with the title and year of publication.
This investigation has been performed by order and for the account of the Dutch Ministry of Defence, within the framework of Gezondheidsonderzoek PX-10 (E/609037).
Schram-Bijkerk, D. (ed.)
1Tongeren, M. van
2Vermeulen, R.C.H.
3Contact:
Dieneke Schram-Bijkerk
Centre for Environmental Health
Dieneke.Schram@rivm.nl
Contributors: Heederik, D.J.3 Portengen, L.3 Vlaanderen, J.3 Robertson, A.2 Schmid, K.2 Cherrie, J.W.2 MacCalman, L.2 Reviewed by: Stayner, L.T.4 Schneider, T.51 National Institute for Public Health and the Environment, Bilthoven, The Netherlands 2 Institute of Occupational Medicine, Edinburgh, United Kingdom
3 Institute for Risk Assessment Sciences/Utrecht University, Utrecht, The Netherlands 4 University of Illinois, Chicago, United States
Abstract
Exposure and potential health effects associated with the use of PX-10 in the Dutch Armed Forces
The possibility that members of the Dutch Armed Forces developed acute mye-loid leukaemia (AML) or other forms of hematopoietic cancer due to exposure to PX-10 while cleaning and maintaining weapons can be essentially excluded. Until 1970, PX-10 contained small amounts (0.1%) of benzene, a known carcinogen; thereafter, the concentrations of benzene in PX-10 fell sharply. Consequently, the total cumulative exposure of military personnel to benzene over the years was low.
This is the conclusion of a study into the effects and health risks of working with PX-10. The study was commissioned by the Dutch Ministry of Defence in 2008 after liability claims were filed against it related to serious health complaints due to activities involving exposure to PX-10.
Three to four per 1,000 Dutch men develop AML during their lifetime without having had any contact with PX-10. The additional risk of developing AML among military personnel who worked with PX-10 intensively for many years was de-termined to be 0.03 extra cases per 1,000 men. Therefore, it is highly unlikely that additional cases of AML developed, even if a few thousand military person-nel were intensively exposed to PX-10.
The exposure to benzene by inhalation and dermal contact varied by time period and working situation. The yearly average concentrations were 0.5 ppm, which is below the currently established occupational exposure limit of 1 ppm during an eight-hour period. PX-10 also contained other volatile components that can have neurological effects. The study determined that the yearly average concen-trations of volatile organic compounds (VOCs) were 2–100 ppm, depending on the working situation. As dose-response associations have not been established for VOCs, the risk of developing neurological disorders from exposure to the VOCs in PX-10 could not be calculated.
Keywords:
soldiers, PX-10, volatile organic compounds, cleaning and maintaining weapons, health effects
Rapport in het kort
Blootstelling en mogelijke gezondheidseffecten door het gebruik van PX-10 in de Nederlandse krijgsmacht
Het is praktisch uitgesloten dat defensiepersoneel acute myeloïde leukemie, of aanverwante vormen van kanker heeft ontwikkeld door te werken met het wa-penonderhoudsmiddel PX-10. Dit middel bevatte tot 1970 lage concentraties (0,1 procent) van de kankerverwekkende stof benzeen. Daarna daalden de con-centraties van deze stof in het product sterk, waardoor de totale blootstelling voor Defensiepersoneel gering was.
Dit blijkt uit berekeningen van de blootstelling aan en de gezondheidseffecten van werken met PX-10. Het Ministerie van Defensie heeft dit onderzoek uitgezet, nadat het in 2008 aansprakelijk was gesteld voor gezondheidsschade door werk-zaamheden met PX-10.
Drie tot vier van elke 1.000 Nederlandse mannen krijgen AML, zonder dat ze ooit met PX-10 gewerkt hebben. Onder defensiepersoneel, dat vele jaren dage-lijks intensief met PX-10 werkte, is er volgens de berekeningen sprake van 0,03
extra gevallen per 1.000 mannen. Het is daarom onwaarschijnlijk dat er
daad-werkelijk extra gevallen van AML zijn opgetreden, zelfs als een paar duizend werknemers in hoge mate zijn blootgesteld aan PX-10.
Hoeveel benzeen het defensiepersoneel inademde of opnam via de huid is af-hankelijk van de periode waarin de werkzaamheden plaatsvonden en het type werkzaamheden met PX-10. Het jaarlijks gemiddelde per persoon was maximaal 0,5 parts per million (ppm), wat onder de huidige norm ligt van gemiddeld 1 ppm per werkdag. PX-10 bevat ook andere oplosmiddelen die effecten kunnen hebben op het zenuwstelsel. Uit dit onderzoek blijkt dat de blootstelling aan de totale hoeveelheid van deze oplosmiddelen gemiddeld tussen de 2 en 100 ppm lag, afhankelijk van het type werkzaamheden. Het is echter niet mogelijk aan te geven wat de effecten hiervan zijn op de gezondheid, omdat de precieze relatie tussen blootstelling en gezondheidseffecten niet bekend is.
Trefwoorden:
militairen, PX-10, vluchtige organische componenten (VOC’s), wapenonder-houdsmiddel, gezondheidseffecten
Contents
Summary—9
1 Introduction—13
1.1 Background—13 1.2 Objectives—13
1.3 Organization of the report—14
2 Use of PX-10: Definition of scenarios—15 3 Methods of exposure assessment—17 3.1 Benzene and VOCs content of PX-10—17 3.2 Modelling approach—17
3.3 Laboratory experiments—18
3.4 Emission rates of benzene and VOCs—20 3.5 Monte Carlo simulation—20
3.6 Dermal exposure—21
4 Results of exposure assessment—23 4.1 Laboratory experiments—23
4.1.1 Evaluating the effect of benzene content in PX-10 on the ‘passive’ evaporation rate—23
4.1.2 Effects of other components in PX-10 on benzene emission rates—24 4.1.3 Stability of emission rate over time—24
4.1.4 Impact of cleaning activities on the benzene evaporation rate—25 4.1.5 Effect of air speed over evaporation surface on evaporation rate—26 4.1.6 Effect of container dimensions on the benzene evaporation rate—27 4.1.7 Cleaning torpedoes—27
4.1.8 Summary of laboratory experiments—27 4.2 Model estimates for benzene exposure—28
4.2.1 Benzene exposure after top-up of PX-10 baths—29
4.2.2 Average daily benzene exposure from near-field and far-field sources—29 4.2.3 Average daily benzene exposure from near-field and far-field sources adjusted
for reported daily working hours at the PX-10 task—33 4.2.4 Sensitivity analysis—35
4.3 Model estimates for VOCs exposure—36
5 Quantification of potential health effects—41 5.1 Methods: life table analysis—41
5.2 Results—46
6 Discussion—49
6.1 Exposure assessment—49 6.1.1 Dealing with uncertainties—49 6.1.2 Evaporation rate of benzene—50
6.1.3 Exposure levels in different use scenario’s—50 6.1.4 Dermal exposure—51
6.1.5 VOCs exposure—52
6.2 Potential health effects at low levels of exposure—52 6.2.1 Potential confounding factors—53
Acknowledgement—55 References—57
Appendix 1: Scenario description and input parameters for exposure modelling— 61
Summary
Background
In 2008, liability claims were filed against the Ministry of Defence (MoD) related to serious health complaints due to activities involving exposure to PX-10. PX-10 is a water displacing substance that has been used for cleaning and maintaining steel surfaces of weapons until 1995. It contained 0.1% of the carcinogen ben-zene till 1970. In response, the MoD commissioned the Dutch National Institute for Public Health and the Environment (RIVM) to quantify the exposure to toxic substances and potential health effects associated with the use of PX-10. RIVM coordinated this study, which was performed by the Dutch Institute for Risk As-sessment Sciences (IRAS) of Utrecht University and the Institute of Occupational Medicine in Edinburgh, United Kingdom (IOM). Results of the first part of this study – an independent review of a report from MoD – have been published pre-viously (1). It was concluded that the report was accurate in that benzene expo-sure is associated with acute myeloid leukaemia (AML), but that there is also (limited) evidence for an association with other leukaemia’s and lymphoma (1). Objectives
The aim of this study was to estimate the exposure to benzene and VOCs from use of PX-10 and to quantify potential health effects associated with the ben-zene resulting from past PX-10 use. Although VOCs exposures have been linked to neurological effects, no consistent information on the specific constituents causing these effects, nor dose-response relationships were available. Therefore, it was not possible to quantify the health risks due to exposure to VOCs.
Methods
A workplace exposure model was developed and used to estimate the past inha-lation and dermal exposure to volatile organic compounds (VOCs) and, in par-ticular, to benzene from PX-10 use. Six representative use scenarios of PX-10 were defined in focus group meetings with former employees/members of the Navy who had used PX-10, i.e.:
Onshore cleaning of small arms; Cleaning of small arms on board;
Onshore small arms workshop in large room; Onshore small arms workshop in small room;
Onshore washing room for cleaning of torpedo parts; Onshore torpedo workshop.
Employees from other branches of military service also had been invited for the focus groups, but did not participate. Estimates of the emission rates were ob-tained from experiments using a white spirit mixture, similar to PX-10. The in-formation from the focus group meetings and laboratory experiments was used to model the yearly average exposure to benzene and VOCs for each of the six use scenarios. Subsequently, two careers were defined to quantify the risk of developing leukaemia and its subtypes and lymphoma due to exposure to ben-zene (see box 1). These careers included two exposure scenarios with relatively high average exposures (cleaning small arms in weapon rooms and on board of ships) and a civilian who worked many years with PX-10. Therefore, these ca-reers represent worst-case scenarios. Subsequently, the risk of developing
leu-(ALL), chronic lymphocytic leukaemia (CLL), non-Hodgkin lymphoma (NHL) and multiple myeloma (MM) was modelled. The risks were estimated based on life table analysis of hypothetical cohorts of 100,000 exposed workers in the two defined careers, as it is not exactly known how many people worked in these careers and when. Three weighting functions were applied in the life table analy-sis, addressing different assumptions regarding the reduction in risk with time since last exposure. In addition, different types of risk models (multiplicative model vs. additive model) and exposure-response models (spline vs. linear model) were used. The main reason to present the outcomes of multiple models is that there is no model that is universally better. As such these different mod-els represent the uncertainty in estimated additional cases. Conclusions were based on the median of the different estimates.
Table S1: Careers used in the quantification of health effects. Career 1 ‘military personnel of the
Navy’
Cleaning small arms in weapon rooms and on ships
Duration career: 38 yrs (age 18-55) Start career: 1964
Rotation land-ship: 3 yrs
Phase 1 (Seaman) Duration: 6 yrs Exposure: 4-8 hours/day Phase 2 (Corporal) Duration: 9 yrs Exposure: 1-4 hours/day Phase 3 (Sergeant)
Duration: until end of career Exposure: several hours/month
Career 2 ‘civilian’
Cleaning small arms in small workshops
Duration career: 48 yrs (age 18-65) Start career: 1945
Exposure: 8 hours/day
Full duration of career at the same work-place
Results
The experiments showed that benzene would have rapidly evaporated from an open bath with PX-10. A half-life of 2 hours was estimated for the benzene con-tent in a PX-10 bath, meaning that the benzene emission rate from an open bath of PX-10 would have reduced rapidly in the first hours and would have been negligible at the beginning of the next day. Therefore, the long-term expo-sure to benzene was, to a large extent, determined by the frequency and amount of topping–up of the bath (approximately once a week) and the fre-quency of completely changing the bath with fresh PX-10 in the scenarios using an open bath (approximately once a month).
Estimates of average yearly benzene exposure ranged for the different use sce-narios between 0.009 to 0.4 ppm before 1970, 0.004 to 0.2 ppm between 1970 and 1980, and between 0.001 and 0.04 ppm after 1980. In addition to the in-halable route, exposure via the dermal route would also have contributed to overall systemic exposure. Due to the manual nature of the cleaning procedures this exposure route could have been substantial. Modelling of the dermal
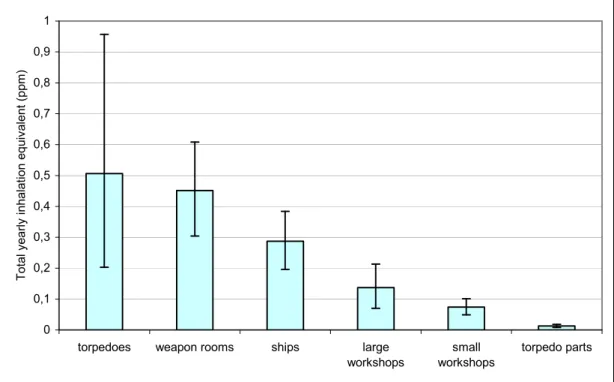
expo-sure route showed that this route resulted in yearly inhalation equivalents below 0.2 ppm but was still the main exposure route in certain operations like for in-stance in the maintenance of torpedoes onshore. Nevertheless, the inhalation exposure to benzene was the main contribution in most of the tasks. Combining the dermal and inhalation route resulted in exposure estimates that were on a yearly average base maximally 0.5 ppm, see Figure S1. VOCs exposure yearly average levels varied from 2 to 100 ppm depending on the working situation.
0 0,1 0,2 0,3 0,4 0,5 0,6 0,7 0,8 0,9 1
torpedoes weapon rooms ships large workshops small workshops torpedo parts Tot al y ea rly inhal at ion equi va lent (p pm )
Figure S1: Total yearly benzene exposure before 1970, with error bars indicating the 5th and 95th percentiles of the estimation intervals.
Despite the differences between the two hypothetical careers, the cumulative exposure was similar, i.e. 2.42 ppm-years in career 1 and 2.25 ppm-years in career 2. For career 1 (Cleaning small arms in weapon rooms and on ships) the estimated additional number of cases per 100,000 exposed individuals ranged for leukaemia from 3.9 to 26.3 (median 6.5); for AML from 1.4 to 15.0 (median 3.3); for ALL it was 0.3; for CLL it ranged from 1.7 to 2.9; for NHL from 4.7 to 7.1; and for MM from 7.3 to 11.7.
For career 2 (Cleaning small arms in workshops by civilians) the estimated addi-tional number of cases per 100,000 exposed individuals ranged for leukaemia from 2.6 to 30.3 (median 6.4); for AML from 0.9 to 21.0 (median 2.7); for ALL it was 0.4; for CLL it ranged from 0.9 to 3.2; for NHL from 2.8 to 8.1; and for MM from 4.0 to 13.2.
In summary, the additional risk of developing AML, for which the evidence of a causal association with benzene exposure is most evident, was around 3 cases per 100,000 exposed people, or 0.03 per 1,000 people in both careers. This number is however time-dependent and should not be interpreted as an individ-ual risk. The additional risk and subsequent cases for other leukaemia’s and lymphoma was estimated to be similarly low.
Conclusion
It can be concluded that exposure to benzene did occur while using PX-10 and that these exposures on a yearly average would be likely less than the current occupational exposure limit of 1 ppm. Yearly average exposure to VOCs was up to 100 ppm, which equals the (non-legal) current white-spirit 8-hour threshold value.
Based on the yearly average concentrations and two realistic high-risk careers, it was estimated that the additional risk of AML is 0.03 per 1,000 subjects ex-posed to these exposure scenarios. The additional risk for the other leukaemia subtypes and lymphoma was comparable to the risk of AML. MoD estimated that the number of exposed subjects in these high-risk careers is likely to be in the low thousands. Therefore, the possibility that members of the Dutch Armed Forces developed acute myeloid leukaemia (AML) or other forms of hematopoi-etic cancer due to exposure to PX-10 while cleaning and maintaining weapons can be essentially excluded. It should be noted that both the exposure estimates and risk estimates have considerable uncertainties. As such the estimated num-ber of additional cases should be interpreted with some caution.
VOCs have been linked with some adverse health outcomes, most notably neu-rological symptoms and disorders. As no dose-response relations exist for VOCs or specific components with regard to these disorders, no calculation could be made of the potential health impact. Cases of neurological disorders among sub-jects that worked with PX10 should therefore probably be referred to specialized ‘solvent teams’ for more specific follow-up.
1
Introduction
1.1 Background
In 2008, liability claims were filed against the Ministry of Defence (MoD) related to serious health complaints due to activities involving exposure to PX-10. PX-10 is a water displacing substance that has been widely used for cleaning and main-taining steel surfaces of weapons. Subsequently, this claim has received atten-tion by the naatten-tional government, the military union and the media. As PX-10, at least for part of the time, contained benzene and other organic solvents, the suggestion has been that the MoD, although aware of the potential health ef-fects, has not acted adequately in eliminating or reducing the exposure or in providing appropriate personal protection to their employees. In response, the MoD has agreed to further investigate the use of PX-10, its contents and the potential associated health effects with the goal to objectively assess the poten-tial health risks that (ex-) military personnel might have been exposed to due to the historical use of PX-10.
A preliminary evaluation of the composition, use and potential health effects of PX-10 was made by the Military Medical Service Agency of the Netherlands (2). MoD commissioned the Dutch National Institute for Public Health and the Envi-ronment (RIVM) to independently review this evaluation. Results of this litera-ture review have been published previously (1). In addition, MoD commissioned RIVM to estimate the exposure to toxic substances in PX-10 and to quantify po-tential health effects associated with these exposures (this report). This study was coordinated by RIVM and performed by the Dutch Institute for Risk Assess-ment Sciences (IRAS) of Utrecht University and the Institute of Occupational Medicine in the United Kingdom (IOM).
In our previous report (1), it was concluded that:
The main constituents of PX-10 were white spirit (including aromatics such as toluene and benzene), mineral oils and some additives. Of these expo-sures benzene was identified as being the most important constituent in re-lation to possible health effects.
The concentrations of benzene in PX-10 in the preliminary estimates of MoD (2) were based on a worst-case scenario; we concluded that 10 times lower concentrations were more realistic. The benzene level in PX-10 was reduced from 0.1% before 1970 to 0.03% between 1970 and 1980 and 0.01% after 1980. After 1995 PX-10 was not used anymore.
Next to acute myeloid leukaemia (AML), there is evidence that benzene ex-posure is related to acute lymphocytic leukaemia (ALL), chronic lymphocytic leukaemia (CLL), non-Hodgkin lymphoma (NHL), and multiple myeloma (MM).
In addition to benzene, exposures to other volatile organic compounds (VOCs) will have occurred, among which toluene and xylene. Although VOCs exposures have been linked to neurological effects, the scientific literature is not consistent.
1.2 Objectives
The aim of this study was to estimate the exposure to benzene and VOCs from use of PX-10 and to quantify potential health effects associated with the ben-zene resulting from past PX-10 use. Although VOCs exposures have been linked
causing these effects, nor dose-response relationships were available. Therefore, it was not possible to quantify the health risks due to exposure to VOCs.
1.3 Organization of the report
The report consists of the following elements: Use of PX-10: definition of scenarios (chapter 2).
Exposure assessment of benzene and VOCs based on the identified scenarios of PX-10 use (chapter 3 and 4).
Quantification of health effects due to exposure to benzene (chapter 5). Discussion (chapter 6)
2
Use of PX-10: Definition of scenarios
As no detailed descriptions on the past use of PX-10 were directly available, it was decided to obtain such information through focus group meetings with (for-mer) long-serving employees of the Dutch Armed Forces. The main aim of the focus group meetings was to define representative scenarios for the use of PX-10 in the Dutch MoD as well as to understand how PX-PX-10 was used within these scenarios. The 23 focus group members, including both civilians and military personnel, were asked to provide information on sizes of rooms, amounts of PX-10 used and type of ventilation, etc. Two focus group meetings were organized, one for exposure scenarios during cleaning and handling of small arms, and one for scenarios during cleaning of large arms. The members of the focus groups, which included current and retired military and civilian personnel, represented only the Dutch Navy; there was no representation from other areas of the Dutch Armed Forces despite the efforts from MoD to include employees from other branches of services.
As a result of the discussion with the focus groups six different exposure scenar-ios were identified. These six scenarscenar-ios are described briefly below and represent the most important and frequent past usage of PX-10 in the Dutch Navy.
1. Onshore cleaning of small arms (military personnel): Cleaning of small arms was carried out in a small workshop in the onshore armoury (where hand-guns were stored). These armouries were well-protected and enclosed rooms below or above ground with little ventilation. There were typically three baths in the workshop, each containing about 200 litres of PX-10. Small arms (guns, pistols) were dismantled; the individual parts soaked in the baths, cleaned with a brush and often dried using compressed air; 2. Cleaning of small arms onboard (military personnel): Constables were
re-sponsible for cleaning of all small arms onboard. The baths for the cleaning of small arms with PX-10 onboard ships were generally smaller than in the armoury and typically contained about 20 litres of PX-10. The workspaces were of variable dimensions, but were generally smaller than the onshore facilities;
3. Onshore small arms workshop (civilian staff) in small room: Large numbers of arms were delivered to the workshop where full maintenance was per-formed. Large baths with hundreds of litres of PX-10 were used for the cleaning of the weapons;
4. Onshore small arms workshop (civilian staff) in large room: Large numbers of arms were delivered to the workshop where full maintenance was per-formed. Large baths with hundreds of litres of PX-10 were used for the cleaning of the weapons;
5. Onshore washing room: Smaller parts of the torpedoes were cleaned by soaking and washing in large open baths filled with PX-10. This room was adjacent to the torpedo hall;
6. Onshore torpedo workshop: The main body of the torpedoes were manually cleaned by wiping with a cloth soaked in PX-10. This was carried out in a large hall (torpedo hall).
Following the focus group discussions the exposure scenarios were described in as much detail as was available and distributed to the participants together with a list of further follow-up questions. This was done to help refine the scenario descriptions, in particular for information on essential parameters that were
re-quired for estimation of exposure (e.g. specific sizes of rooms described in the scenarios etc.). Besides the consensus on the parameter estimates the range was also recorded and subsequently used in the sensitivity analyses (4.2.4.). There were two additional scenarios, for which there was not enough information available to sensibly describe the exposure determinants:
Onshore Ammunition Maintenance: Ammunition was dismantled and cleaned by hand in a bath with PX-10. For the manual cleaning of the large parts of the ammunition there was a pump dispenser for PX-10, which was applied directly onto a towel; and
Onshore Maintenance of Large Arms (non-torpedo): No former personnel from the large arms armoury hall were available for the focus group. The work was carried out mainly by civilians and continued until the late 1980s. However, the use of PX-10 was less intense compared with use of PX-10 in the torpedo hall.
Based on the information that was obtained from the focus group it seems that the exposure to benzene can be assumed to be similar or lower than in the other scenarios with PX-10 baths.
The six scenarios have been divided into two different exposure types:
a) Usage of PX-10 in open baths, with continuous evaporation of PX-10 (sce-nario 1-5). The tasks that were performed at such workplaces consisted of cleaning metal pieces with PX-10. These tasks have been reported to be similar to household dish cleaning with a brush and were performed with completely submerged hands and part of the forearms in the PX-10 liquid; and
b) Treatment of metal surfaces with a cloth soaked in PX-10 (scenario 6). The skin contact with the PX-10 was reported to be less extensive than in the bath tasks, as the hands were not permanently submerged. In most cases the contact with PX-10 was limited to the inner side of one hand and forearm.
3
Methods of exposure assessment
As no measurement data are available for benzene exposure during activities involving PX-10, it was necessary to develop a model to estimate the past expo-sures. This Chapter describes the methodology used for estimating the past ex-posure to benzene and total VOCs from use of PX-10.
3.1 Benzene and VOCs content of PX-10
As described previously (1), the main constituents of PX-10 were white spirit (including aromatics such as toluene and benzene), mineral oils and some addi-tives. Tables 3-1 and 3-2. present the best estimates of the content of benzene and VOCs respectively, which were described in our previous report and which were used in the quantification of exposure.
Table 3-1: Best estimates of historical benzene in white spirit.
% Benzene in white spirit Period
Best estimate Upper limit
before 1970 0.1 0.2
1970-1980 0.03 0.1
1980 onwards 0.01 0.03
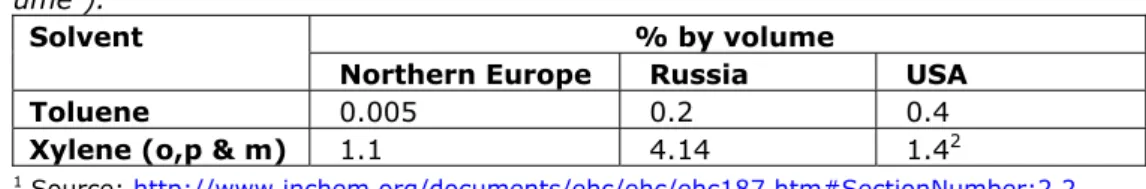
Table 3-2: Reported proportions of toluene and xylene in white spirit (in % vol-ume1).
% by volume Solvent
Northern Europe Russia USA
Toluene 0.005 0.2 0.4
Xylene (o,p & m) 1.1 4.14 1.42
1 Source: http://www.inchem.org/documents/ehc/ehc/ehc187.htm#SectionNumber:2.2,
visited October 26, 2011.
2 C
8 aromatics, includes ethyl benzene.
3.2 Modelling approach
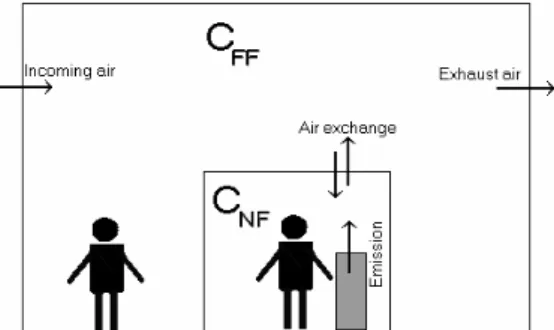
To predict the inhalation benzene exposure we adapted a deterministic two-compartment mass-balance model originally developed by Cherrie and Schnei-der (3). The model consists of two ‘boxes’; a small near-field comprising a vir-tual cube of 2 metre sides centred on the workers head (8 m3) and a large far-field describing the rest of the room. Each far-field is assumed to be perfectly mixed but exchanging air with the other field at a defined rate. This simplification makes it possible to calculate two components of the exposure, i.e. exposures originating from near-field sources (e.g. due to a worker’s task) and exposures originating in the far-field (e.g. due to activities by other workers or other proc-ess-related emissions).
Figure 3-1: Schematic description of the two compartment model at a workplace (CFF: concentration in the far-field, CNF: concentration in the near-field).
The basic model is described by two simultaneous differential equations repre-senting the exchange of contaminant mass between the compartments, includ-ing mass lost from the system by air exchange with the external environment.
NF FF NF NF T NF NF
N
C
Q
C
Q
dt
dC
V
.
.
[equation 1] FF FF NF FF NF NF T FF FFF
C
Q
C
Q
C
Q
dt
dC
V
.
.
.
[equation 2]The volume airflow into and out of the near-field (QNF) defines the exchange be-tween the two compartments (defined by their respective near-field and far-field volumes, VNF and VFF), while QFF defines the volume airflow from the far-field out to the external environment (e.g. external ventilation). The mass emission rate into the near-field (εNT) or into the far-field (εFT) are used to calculate the near- and far-field concentration of a contaminant. These differential equations can be solved simultaneously over time and allow an iterative calculation of the concen-tration in each of the compartments.
To be able to implement this model to estimate benzene exposure for a range of PX-10 exposure scenarios, a number of input parameters were required, includ-ing emission rates, room sizes, ventilation rates, bath sizes, workinclud-ing hours, amounts of replaced PX-10 and the frequency of such replacement (see Appen-dix 1: Scenario description and input parameters for exposure modelling). The benzene emission rates were based on experiments carried out at the laboratory of the IOM (see section 3.3 of this report). The other input parameters were based on information provided by the focus groups or from information provided by the Dutch MoD. The airflow between the near- and far-field compartments (QNF) was arbitrarily set at 10 m3/min, which was based on an estimate of the airflow arising from convection and some bulk air movement, and was the mid-value chosen by Cherrie (1999) (4). To account for the uncertainties in these input parameters the model was implemented as a probabilistic model using Monte Carlo simulations.
3.3 Laboratory experiments
A series of laboratory experiments were carried out at the IOM to estimate the evaporation rate of benzene from PX-10 and to assess the effect of several fac-tors. In particular the experiments investigated the following:
the ‘passive’ evaporation rate of benzene for PX-10 with different levels of benzene;
the impact of composition of PX-10 such as mineral oil, fatty ester acid on the benzene evaporation rate;
the change in evaporation rate over time;
the impact of carrying out cleaning activities (i.e. agitating the cleaning solu-tion) on the evaporation rates;
the impact of the air speed over the evaporation surface on the evaporation rate; and
the impact of the surface area/volume ratio of the container on the evapora-tion rate.
As production has been discontinued no PX-10 was available for the experiments and therefore, a mixture of white spirit, mineral oils and fatty acids was pre-pared for the experiments. The composition was based on the information ob-tained from the review of the report of the Dutch MoD and based on the old ma-terial data sheets (1). Benzene was added for most of the experiments, although for some experiments simulating cleaning activities, benzene was replaced by toluene to minimise potential risk for the staff undertaking the experiments. The experiments were carried out within a fully enclosed box
(31.5 x 31 x 34 cm) inside a ventilated fume cupboard (Figure 3-2). A container with PX-10 with a volume of 8 cm³ and a surface area of 6.4 cm² was placed inside the box. The airflow in and out of the box was kept at a constant rate and mixing of the air was ensured by an internal fan. A carbon filter was used to re-move any volatile agents from the air flowing into the box.
The concentration of total VOCs was continuously measured with a direct read-ing detector (Phocheck photo ionisation detector, model 1000, ION Science Ltd., Cambs UK) placed in the box. In addition, benzene in air was sampled with co-conut charcoal sorbent tubes which were analysed for benzene according to NIOSH method 1501. obstacle 31 [cm] 34 [ cm ] Surface Q1=Q2 (measured) (internal ventilation assuring complete mixture)
Q2=Q1 (measured) PX-10 liquid Volume, V = 0.033m³ Evaporation Filter, removing background aromatic substances
Ventilator motor: outside box
Pumps
=Q2
Airflow 1cmabove the surface
Figure 3-2: Experimental set up for the determination of the benzene evapora-tion rate (Q=flow through box [m³/min]).
A series of experiments were carried out to test whether the benzene emission rates increased linearly with the benzene concentration using white spirit mix-tures with benzene contents ranging from 0 to 5%.
3.4 Emission rates of benzene and VOCs
The emission rate from the container with PX-10 was calculated from the air concentration assuming a steady state condition. Under steady-state condition, the concentration can be associated with the evaporation rate according to the formula [equation 3].
Q
G
C
ss
[equation 3]Where: Css = Steady state concentration [mg/m³], G = evaporation rate [mg/min], and Q = Flow through box [m³/min]
The steady state, with stable concentrations of all fractions, could not be main-tained as the benzene concentration rapidly declined in the box. Nevertheless the approach allowed the determination of an initial emission rate and the speed of the emission decrease over time. The benzene emission rates in the work-places were estimated using this information on benzene concentration in PX-10 over time and the experimentally determined emission rates. By varying the benzene concentration in the PX-10 simulation, the relationship between ben-zene content in PX-10 and emission rate was established. This approach simu-lated a passive evaporation only. To adjust for active manipulation of PX-10, for example brush cleaning of items, a test procedure was set up investigating the impact of active handling of the materials.
The estimation of the benzene emission from the work with soaked PX-10 cloths was based on the total mass of benzene in the amount of PX-10 that was stated to be used per day and which was assumed to have evaporated during this day. The emission rate was calculated as average over the day.
To estimate exposure to total VOCs, it was assumed that white spirit comprised of a small, highly volatile fraction and a large fraction of medium to low volatile liquids. The highly volatile part of the aromatic fraction was assumed to consist mainly of benzene and toluene, while the aliphatic fraction was assumed to con-sist of hexane and heptane isomers. The evaporation rate of the medium to low volatile components of PX was essentially constant for the duration of the ex-periments.
An approximate estimation of the VOCs emission rate was made, assuming that the information on the evaporation behaviour of benzene in PX-10 (that was de-termined in the experimental setup) was the same as that for all other highly volatile components in PX-10.
3.5 Monte Carlo simulation
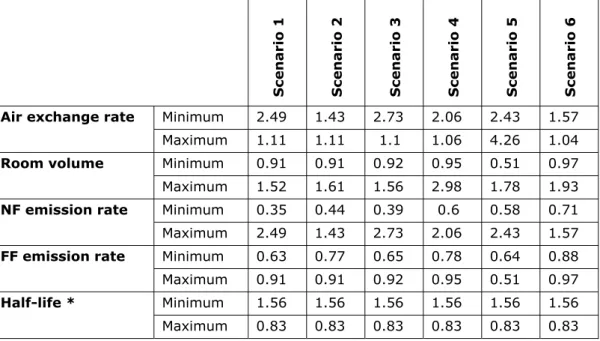
To take into account some of the uncertainty in the model parameters, a prob-abilistic approach was used to estimate benzene and total VOCs exposure. For each model parameter a distribution was provided based on the available infor-mation, and a value picked at random for each run of the model. For each sce-nario the model was run 500 times. The results are provided as the average and standard deviation over all the runs. The probabilistic model was programmed in Matlab (Version 7, MathWorks, Natick, Massachusetts, USA).
While running the model for the exposure calculation the input variables for the model were simulated from triangular distributions, using three defined values:
minimum, maximum and mid-point. To determine the sensitivity of the overall model outcome on changes in the individual input parameters, an additional sensitivity analysis was performed.
The analysis consisted of the following steps:
the mid-points of all the parameters were taken as input parameters for the model and the resulting exposure estimate was defined as baseline;
the model was re-run modifying individually each parameter in the range from minimum to maximum; and
the influence of the individual parameter modification on the outcome of the model was compared with the baseline value.
3.6 Dermal exposure
Due to the extensive use of PX-10 in the absence of any effective personal pro-tective equipment, the contribution of dermal exposure was considered to be potentially significant in some of the PX-10 scenarios. Basically two types of dermal exposure patterns were described for the work with PX-10. The first in-volved completely submerging the hands in PX-10 for extensive periods. The second involved manual cleaning of surfaces with a cloth soaked with PX-10. Both application methods resulted in intense skin contact, although for the latter the skin surface in contact with PX-10 was smaller (inside palm of only one hand). Note that the dermal exposure was only estimated for benzene but not for VOCs as for the latter there were no dermal uptake estimates available. Reported benzene uptake rates, partially derived from animal toxicological ex-periments, vary considerably depending on the experimental model used, the species chosen, the level of benzene applied, length of application, duration of the contact etc. As a consequence the estimated benzene flux through the skin varies to a high extent. The dermal contact of the workers with PX-10 was re-ported to be very intense and there is anecdotal evidence of widespread skin complaints amongst the former users of PX-10. Therefore, the higher reported uptake values were considered most appropriate for this population. Based on the literature review of Nies et al. (5) as well as Nies and Korinth (6) the ben-zene uptake rates could range from 1 mg/cm²/h for short-term contact to 2 mg/cm²/h for long-term contact with benzene. This value for benzene uptake rate of 2 mg/cm²/h is furthermore supported by Adami et al. (7) and Sheehan et al. (8). For the purpose of this study the dermal uptake rate was assumed to be, on average, 1.5 mg/cm²/h, ranging from 1 to 2 mg/cm²/h.
The internal benzene exposure, resulting from dermal uptake of benzene, was subsequently converted to equivalent inhalation exposure, based on a model provided by Nies et al., as well as Nies and Korinth (5, 6):
CF
B
BR
Uptake
EIU
[equation 4]Where: EIU is the equivalent inhalation unit [ppm];
Uptake is the daily dose of dermal exposure [mg/d];
BR is the breathing rate [m³/8-h d], defined as 10 m³ per shift of 8 h; B is the inhalation bioavailability factor (no units), defined as 50%; and CFis the factor to convert concentration to mass per unit volume [mg/m³], i.e. 1 ppm 3.2 mg/m³ of benzene.
4
Results of exposure assessment
4.1 Laboratory experiments
4.1.1 Evaluating the effect of benzene content in PX-10 on the ‘passive’ evaporation rate
A series of experiments were carried out to test whether the benzene emission rates increased linearly with benzene content in the mixture, ranging from 0 to 5%. The evaporation rate from the container was estimated under the assump-tion of steady state condiassump-tions. Figure 4-1 shows the measured emission rate in relation to the level of benzene (%) in the liquid. In experiments without ben-zene added, the resulting air levels were all below the limit of detection. The results seem to support a linear relationship between the (initial) evaporation rate of benzene and the concentration of benzene added to the PX-10 surrogate.
n=4 n=2 n=6 n=2 y = 0.3482x - 0.0022 R2 = 0.9999 0.0 0.5 1.0 1.5 2.0 0 1 2 3 4 5 6
Level of added benzene [%]
In it ia l e va p o ra tio n r at e [ g /m in /m ²] linear regression Figure 4-1: Estimated passive initial benzene emission rate by benzene content level in PX-10.
The measurement results were extrapolated linearly from the laboratory ex-periments to provide a benzene emission rate of PX-10 for a bath with a surface area of 1 m2 using the following linear regression equation:
0022
.
0
*
3482
.
0
BC
G
[equation 5]Where: G is the evaporation rate (in g/min/m²) and BC is the benzene content in PX-10 (volume %).
Using this equation and estimates of past benzene levels in PX-10, the benzene emission rates were estimated for different time periods (Table 4-1).
Table 4-1: Estimated benzene emission rates by time period based on benzene content of PX-10 as estimated previously (1).
Emission rate (g/min/m²) Year
Average Minimum Maximum
<1970 0.03 0.00 0.07
1970-1980 0.01 0.00 0.03
>1980 0.00 0.00 0.01
4.1.2 Effects of other components in PX-10 on benzene emission rates
Experiments were carried out to determine the effect of mineral oil and fatty ester acid on the benzene evaporation rate. However, the results suggested that above components did not have any impact on the benzene emission rate from the PX-10 surrogate (results not shown).
4.1.3 Stability of emission rate over time
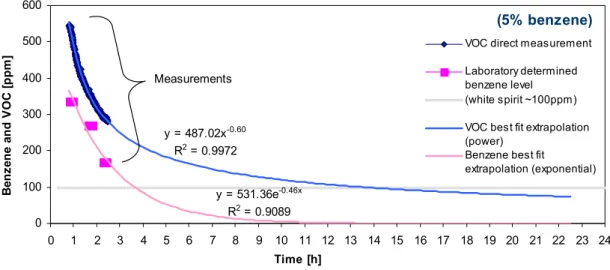
Experiments were carried out to determine the stability of the benzene and total VOCs emission rates over time. The total VOCs concentration in the box re-mained relatively constant over time at 100 ppm when no benzene was added to the white spirit mixture, suggesting a stable VOCs emission rate (horizontal grey line in Figure 4-2). When 5% benzene was added to the white spirit mixture, the total VOCs levels initially increased dramatically (blue line in Figure 4-2), sug-gesting the total air VOCs concentration in this situation was dominated by the benzene levels. However, the total VOCs concentration decreased rapidly over time because of a decrease in the benzene emission rate. This finding was con-firmed by the results of three 10 minute charcoal tube samples, collected at dif-ferent time periods during the experiment. The implication of the decreasing emission rate over time was that the benzene content in the PX-10 mixture was rapidly decreasing, i.e. the mixture is being depleted of benzene.
(5% benzene) y = 487.02x-0.60 R2 = 0.9972 y = 531.36e-0.46x R2 = 0.9089 0 100 200 300 400 500 600 0 1 2 3 4 5 6 7 8 9 10 11 12 13 14 15 16 17 18 19 20 21 22 23 24 Time [h] B en zen e an d V O C [ p p m
] VOC direct measurement
Laboratory determined benzene level (white spirit ~100ppm) VOC best fit extrapolation (power)
Benzene best fit
extrapolation (exponential)
Measurements
Figure 4-2: Total VOCs and benzene concentration over time in the box (meas-ured with 5% benzene in the white spirit mixture). Note the different types of extrapolation for VOCs (approaching 100 ppm) and benzene (approaching 0 ppm).
Based on these results a half-life of 2 hours was estimated for the benzene con-tent in the PX-10 mixture, which is comparable to results by Nicas et al. (9) who estimated a half-life of benzene in a petroleum distillates solvent of 3 to 5 hours.
Based on the experimental results the emission rate (G) was assumed to de-crease exponentially over time according to the following equation:
t t
e
G
[equation 6]With as evaporation constant (defining the speed of decrease) and t for time. In the experiments the was observed to range from 0.21 to 0.71, the ratio of the volume to surface area that was used in the experimental set up. In addi-tion, other factors such as sampling and analytical error, as well as any differ-ences in degree of mixing of benzene in the white spirit solution, may also have played a role. These influences are, however, expected to be minor.
The implication of the exponentially decreasing benzene emission rate over time was that within a day of filling an open bath with fresh PX-10, the benzene con-tent of the mixture would have been negligible. The long-term average emission rates of benzene from the PX-10 bath depended therefore on the frequency and volume of topping up of the bath with fresh PX-10 and on the frequency of com-plete replacement of a bath with fresh PX-10. According to the focus groups, the complete replacement of the baths only occurred occasionally (~ once per month), although topping up of the bath with relatively small amounts of fresh PX-10 occurred more regularly (~ once per week).
4.1.4 Impact of cleaning activities on the benzene evaporation rate
The emission rates will have been affected by agitation of the liquid in the bath. Two separate experiments were carried out to simulate the effect of washing activity on the benzene emission rate. In particular, it was investigated whether the additional exposure as a result of washing could be thought of as an addi-tional surface equivalent, i.e. passive emission from a noaddi-tional addiaddi-tional area. A steel bowl in a fully closed standard laboratory fume hood without ventilation was used to simulate a washing procedure. The fume hood was transformed into a glove box (closed lid with inert plastic and gloves to manipulate things inside the fume hood). Two baths were serially used for this experiment, with surface areas that differed by a factor 4. For both baths the evaporation rates were compared between a still bath (no activity) and cleaning activity. The cleaning activity was simulated by scrubbing a metal piece with a brush dipped every few seconds in the bowl containing simulated PX-10. To minimise the potential risk to the person conducting the work, these experiments were carried out with added toluene instead of benzene. Previous experiments had indicated that the toluene emission rates were comparable to the benzene emission rates.
The results showed an increased emission rate due to the activity of washing metal parts. This increase was best described as additional evaporation surface, not as multiplying factor. An approximation to the added emission was achieved by calculating the additional surface area for the bath when estimating the total emission rate of a bath with activity. The additional equivalent bath surface area required to explain the emission in the experimental setup was estimated to be 800 cm² (uncertainty range 724 cm² to 893 cm²), which corresponded broadly to the total surface area of the gloves, metal piece, etc. that were in contact with PX-10. Based on this observation, the influence of the agitation of the pas-sive bath was assumed to be best estimated with the surface that was brought into contact with PX-10 while carrying out the task. With the help of the task description this additional evaporation surface was estimated to be around
equivalent surface area due to the cleaning activity was added in the model to the surface area of the baths to address additional evaporation.
This was a single exploratory experiment in a fume hood, and needed verifica-tion before being used in the box model, especially because the results de-pended on a manual interaction of a person. The setup of the former experi-ments for the still bath in the box was modified allowing a small metal piece with a known surface area dipping automatically and repeatedly into the evaporation container for a PX-10 with 1% benzene. The VOCs emission during this proce-dure was approximately 9% higher than VOCs emission without the dipper. This dipping disturbed the surface of the PX-10 and added a known wet surface to the surface of the evaporation container. A linear correlation was found between additional evaporation surface ‘x’ and the additional VOCs concentration (VOCs ppm = 20*x cm² - 2E-13, R² = 0.990). Based on this correlation, the influence of the disturbed surface was estimated by the surface of the dipper that was in contact with the mixture. The wet part of the dipper was measured to be around 7.5% which is comparable to the additional solvent emission of 9%.
Both approaches, the up-scaled toluene and the miniature VOCs/benzene, al-though only explorative, supported the assumption that the emission rates dur-ing washdur-ing activities could be approximated by simply adddur-ing the estimated equivalent evaporation surface area to the surface area of the bath.
4.1.5 Effect of air speed over evaporation surface on evaporation rate
The air speed over the surface in the box experiment was measured to be 0.24 m/s for the main experiments. To determine the impact of the internal air speed over the surface, the evaporation was monitored during steady state at the standard flow rate, the internal ventilation was then increased by having the fan directly pointing towards the liquid, doubling the air speed over the surface. This increase approximately doubled the VOCs concentration (Figure 4-3).
0 200 400 600 800 1000 1200 1400 14 :3 8 14 :5 2 15 :0 7 15 :2 1 15 :3 6 15 :5 0 16 :0 4 16 :1 9 16 :3 3 16 :4 8 17 :0 2 Time VO C [ m g /m³ ] Inversed at 16h Steady state Steady state
Figure 4-3: Effect of increasing air speed (double due to ventilation inversion) over the evaporation surface on the emission rate.
Although there is a clear effect of air speed on the evaporation rate, it was not clear whether this has any important implications for the estimated long-term benzene exposure levels in the PX-10 exposure scenarios. Most of the PX-10 baths were positioned in rooms with little ventilation and the wind speed over the actual surface was probably low, because the liquid surface would be
some-what below the edge of the bath. Therefore the data collected at 0.24 m/s might be quite high according to the typical workplace air speed data described by Baldwin and Maynard (10). On the other hand, use of compressed air was re-ported to dry the metal components. Clearly this would have resulted in much higher air speeds and consequently higher evaporation rates. Varying levels of wind speed over the evaporating surface would result in changes in the half-life of the benzene content in the PX-10 mixture. While affecting the pattern of ex-posure, these changes will have little influence on the long-term average expo-sure to benzene. The baseline VOCs emission, however, will have been influ-enced by the air speed, which might have led to higher estimates for the VOCs emission rate. Therefore, the model conditions were assumed to follow the ‘worst case’ conditions with rather high wind speed.
4.1.6 Effect of container dimensions on the benzene evaporation rate
The dimensions of the evaporation container in the experimental box were cho-sen to approximately reflect the miniaturised dimensions of a bath in a work-place environment of an average room. An additional experiment was carried out to determine the impact of the shape of the evaporation container on the benzene emission. A container with double the volume (19 cm³) but the same surface area of 6.4 cm² was used to obtain an extreme value for the long term emission rate. With such a container, a half-life value of 13 hours was measured compared to 2 hours in the used container.
A sensitivity analysis was undertaken to assess the impact of different decrease rates, comparing the model outcomes. The daily average for the exposure to benzene did not change very much using either of the decrease rates. A 2 hour half-life was therefore applied in the main modelling assuming that the chosen dimensions are closer to the up-scaled bath dimensions.
4.1.7 Cleaning torpedoes
It was assumed that the emission rate for situations like the washing of torpe-does with a cloth was best described as a repeated total evaporation of a certain amount of PX-10. The situation is similar to the situation described by Nicas et al. (9) for the liquid wrench (a cleaning, lubricant agent). However, it was very difficult to determine the correct surface area for PX-10 in this task. The calcula-tion of a surface evaporacalcula-tion was therefore omitted and the exposure to ben-zene and total VOCs for this scenario was estimated by the daily amount of PX-10 used for this activity as estimated by the focus groups. It was assumed that all of the benzene evaporated quickly from the thin layer when applied with a cloth to a metal surface. For the estimation of the daily exposure to benzene in the model a total evaporation in the near-field of a worker of all benzene (esti-mated by the amount of PX-10 used per day) was therefore assumed.
4.1.8 Summary of laboratory experiments
The main conclusion from the laboratory experiments was that the emission rate for benzene from PX-10 was not constant but decreased rapidly over time be-cause of its higher vapour pressure compared to white spirit. This observation had significant implications for the predicted benzene exposure level for the ex-posure scenarios where metal parts were cleaned in an open bath (scenario 1-5). In contrast, this observation has limited or no impact on the exposure during the scenario that involved cleaning metal surfaces with a cloth soaked in PX-10 (scenario 6), as it was assumed that this activity will have always been carried out with fresh PX-10.
4.2 Model estimates for benzene exposure
To account for the uncertainties in the various input parameters a deterministic model was implemented using probabilistic techniques. There was uncertainty in the emission rate, room size, air change rate and the parameters associated with the likely dermal uptake.
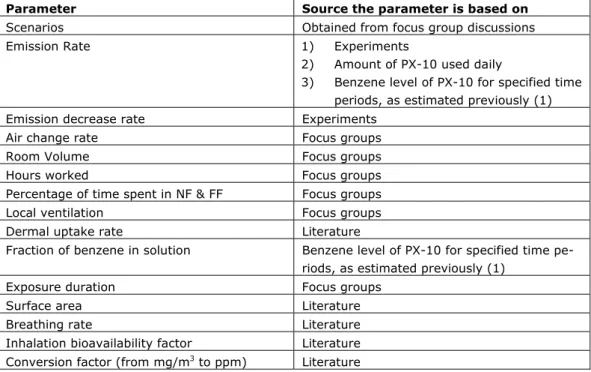
Table 4-2 lists the input parameters used with triangular distribution and the sources on which they were based (see Appendix 1 for detailed information on the ranges used in each of the scenarios). For each scenario the outcomes of the model are presented as average and standard deviation of the simulations. The values are presented as inhalation exposure (in ppm) and as dermal uptake, the latter expressed as inhalation-equivalent (in ppm-eq.), according to the model by Nies et al. (5, 6) and Williams et al. (11).
The emission rates in the model were either based on the results of the experi-ments (for cleaning parts within a bath, scenario 1-5) or based on the total amount of (fresh) PX-10 used (for cleaning of the torpedo tube, scenario 6). The latter was calculated, given the amount used per day and the assumption that all benzene contained within the fresh PX-10 evaporated during eight hours. The percentage of benzene content in PX-10 during various time periods was based on information obtained from the literature and expert review, and are lower than were originally estimated by the Dutch MoD (1). For the exposure scenarios where metal parts were cleaned in an open bath, two events occurred with certain regularity in the scenarios: a) the weekly top-up of PX-10 in a bath and b) much less frequently, a complete renewal of the bath.
Table 4-2: List of input parameters for the modelling (see Appendix 1 for more details).
Parameter Source the parameter is based on
Scenarios Obtained from focus group discussions Emission Rate 1) Experiments
2) Amount of PX-10 used daily
3) Benzene level of PX-10 for specified time periods, as estimated previously (1) Emission decrease rate Experiments
Air change rate Focus groups Room Volume Focus groups Hours worked Focus groups Percentage of time spent in NF & FF Focus groups Local ventilation Focus groups Dermal uptake rate Literature
Fraction of benzene in solution Benzene level of PX-10 for specified time pe-riods, as estimated previously (1)
Exposure duration Focus groups Surface area Literature Breathing rate Literature Inhalation bioavailability factor Literature Conversion factor (from mg/m3 to ppm) Literature
4.2.1 Benzene exposure after top-up of PX-10 baths
The probabilistic model was run for the different time periods, scenarios and the two exposure routes (inhalation and dermal). Due to the rapid evaporation of benzene from the open bath of PX-10, the actual benzene content in the bath would have been negligible within a day of topping up a bath with fresh PX-10. Note that the added amount of benzene following a top-up was rather limited compared to the size of the bath. In general this was assumed to have occurred once a week. Information on the frequency and the amount of PX-10 top-up was obtained from the focus groups. The evaporation rate was calculated for the bath scenarios by calculating the concentration of benzene in the bath given the amount of added PX-10 and dividing it by the volume of the bath.
bath up top PX bath Volume Volume C C 10 [equation 7]
In the case of replacement of all PX-10 in the bath, the whole volume of added PX-10 was considered to have the benzene concentration as estimated previ-ously (1).
4.2.2 Average daily benzene exposure from near-field and far-field sources
Tables 4-3 and 4-4 show the 8 hour-Time Weighted Average (TWA) predicted inhalation, dermal and combined benzene exposures for working with a source in the near-field (NF) only (Table 4-3) and for working with a source in the far-field (FF) only (Table 4-4).
The frequencies with which the baths of PX-10 were completely replaced sub-stantially influenced the exposure to benzene. For each scenario the frequency of total PX-10 replacement has been estimated using information obtained dur-ing the focus groups:
Armouries: from 12/year to 2-3/year; Ships: from 12/year to 4/year;
Workshops: 12/year (one response only); and
Washing room: 40/year (one response only). This last statement has been ignored, as, firstly, it contradicts the focus group discussion where a less frequent ‘topping up’ was stated.
Weekly average exposures were estimated for weeks with 1) a complete bath replacement and 2) PX-10 top-up. The top-ups and full bath replacements were assumed to occur at the start of the week. The weekly average exposures were estimated based on the declining exposure levels during the week, with rela-tively high exposures on the day of full PX-10 replacements and top-ups. The yearly average exposure was calculated based on the information obtained from the focus groups on the frequencies of bath replacements and top-ups. Exposure was assumed to occur only during week days; no holiday breaks were included for the calculation of annual average exposure.
Ø
Ø
Ø
top up full replacementyear
Exposure
Exposure
Exposure
[equation 8]
Where: Exposuretop-up is the exposure during top-up and Exposurefull-replacement is
the exposure during full replacement of the bath. Appendix 1 provides the values for the ranges for the top-up and PX-10 replacement frequen-cies for each scenario.
Table 4-3 shows the average benzene exposure based on 8 hour work shifts that are exclusively spent with a source in the near-field, i.e. next to a bath or work-ing with the soaked cloth. These results do not reflect the actual work hours. Results are presented for the inhalation exposure and the dermal exposure as well as the combined exposure. The combined exposures show values in the range of 0.02 to 0.9 ppm for the highest exposure estimates (i.e. years before 1970). The dermal exposure was much lower than the inhalation exposure for scenarios 1 to 5. However, for scenario 6 the (inhalation equivalent) exposure by the dermal route was similar as the inhalation exposure. This was due to intense dermal contact with fresh PX10, increasing the dermal exposure, and the large size of the torpedo hall, which resulted in a reduction of the inhalation ex-posure compared with similar activities in a small room.
Table 4-4 shows the average benzene exposure based on the weekly average of 8 hour work shifts that are exclusively spent with a source in the far-field but not in the near-field. Due to the small dimensions of some of the rooms and the low ventilation rates, the inhalation exposure levels for far-field sources are similar to the near-field values except for the large torpedo halls. No dermal ex-posure was calculated for these situations, because a far-field source would not lead to dermal exposure (Table 4-5).
Yearly 8h NF inhalation Yearly 8h dermal estimation (inhalation equivalent)
Total (inhalation and dermal) yearly 8h NF inhalation
equiva-lent
Mean 5th 95th Mean 5th 95th Mean 5th 95th
No Description Year
[ppm] [ppm] [ppm] [ppm eq.] [ppm eq.] [ppm eq.] [ppm eq.] [ppm eq.] [ppm eq.]
Before 1970 0.505 0.213 0.914 0.011 0.004 0.021 0.516 0.218 0.935 1970-1980 0.225 0.089 0.406 0.005 0.002 0.010 0.231 0.091 0.416 1 Cleaning small arms in weapon rooms After 1980 0.049 0.019 0.087 0.002 0.001 0.003 0.051 0.020 0.090 Before 1970 0.272 0.104 0.472 0.011 0.003 0.022 0.283 0.107 0.494 1970-1980 0.114 0.041 0.208 0.005 0.002 0.010 0.119 0.043 0.218 2 Cleaning small arms onboard of ships After 1980 0.026 0.010 0.048 0.002 0.001 0.003 0.028 0.010 0.051 Before 1970 0.071 0.027 0.125 0.011 0.004 0.021 0.082 0.031 0.146 1970-1980 0.029 0.011 0.054 0.005 0.002 0.010 0.034 0.013 0.063 3 Cleaning small arms in small workshops After 1980 0.005 0.002 0.009 0.002 0.001 0.003 0.006 0.002 0.012 Before 1970 0.014 0.005 0.025 0.011 0.004 0.020 0.025 0.010 0.045 1970-1980 0.006 0.002 0.011 0.005 0.002 0.010 0.011 0.004 0.021 4 Cleaning small arms in large workshops After 1980 0.001 0.001 0.003 0.001 0.001 0.003 0.003 0.001 0.005 Before 1970 0.174 0.057 0.331 0.011 0.004 0.021 0.185 0.061 0.352 1970-1980 0.080 0.025 0.154 0.005 0.002 0.010 0.085 0.027 0.163 5 Washing of
tor-pedo parts in the
adjacent room After 1980 0.026 0.008 0.054 0.002 0.001 0.003 0.028 0.009 0.057
Before 1970 0.528 0.202 0.875 0.368 0.102 0.672 0.896 0.304 1.547
1970-1980 0.233 0.074 0.415 0.159 0.048 0.314 0.392 0.122 0.729
6 Maintenance
tor-pedoes onshore
After 1980 0.072 0.024 0.132 0.050 0.013 0.097 0.122 0.037 0.230
Note that these numbers are NOT the peak exposure values after a top-up or full replacement – the values of this table take into consideration the decrease over the week.
Yearly FF inhalation Yearly dermal estimation Total (inhalation and dermal) yearly FF inhalation equivalent
Mean 5th 95th Mean 5th 95th
No Description Year
[ppm] [ppm] [ppm] No dermal exposure [ppm eq.] [ppm eq.] [ppm eq.]
Before 1970 0.511 0.208 0.933 0.511 0.208 0.933 1970-1980 0.223 0.088 0.397 0.223 0.088 0.397 1 Cleaning small arms in weapon rooms After 1980 0.049 0.020 0.090 0.049 0.020 0.090 Before 1970 0.273 0.104 0.476 0.273 0.104 0.476 1970-1980 0.113 0.043 0.208 0.113 0.043 0.208 2 Cleaning small arms onboard of ships After 1980 0.026 0.011 0.049 0.026 0.011 0.049 Before 1970 0.066 0.024 0.119 0.066 0.024 0.119 1970-1980 0.026 0.010 0.048 0.026 0.010 0.048 3 Cleaning small arms in small workshops After 1980 0.005 0.002 0.009 0.005 0.002 0.009 Before 1970 0.007 0.003 0.013 0.007 0.003 0.013 1970-1980 0.003 0.001 0.005 0.003 0.001 0.005 4 Cleaning small arms in large workshops After 1980 0.001 0.000 0.001 0.001 0.000 0.001 Before 1970 0.170 0.057 0.330 0.170 0.057 0.330 1970-1980 0.078 0.026 0.152 0.078 0.026 0.152 5 Washing of
tor-pedo parts in the
adjacent room After 1980 0.026 0.008 0.051 0.026 0.008 0.051
Before 1970 0.041 0.016 0.081 0.041 0.016 0.081
1970-1980 0.019 0.006 0.040 0.019 0.006 0.040
6 Maintenance
tor-pedoes onshore
After 1980 0.005 0.002 0.011
No dermal exposure was assumed to occur as this is the far-field of a
working person 0.005 0.002 0.011
Note that the far-field inhalation exposure for the scenario ‘washing of torpedo parts in the annexed room to the torpedo hall’ is based on the FF of the ‘mainte-nance torpedoes in the torpedo hall’ and therefore based on the less accurate total mass-approach. Note furthermore that these numbers are NOT the peak expo-sure values after a top-up or full replacement – the values of this table take into consideration the decrease over the week. The values are shown with a resolution of three digits after the decimal separator, be aware that this high resolution is provided to avoid zero values.
4.2.3 Average daily benzene exposure from near-field and far-field sources adjusted for reported daily working hours at the PX-10 task
Using the average work hours that were reported by the focus group members for the PX-10 activities, the yearly exposure estimates were adjusted using the following procedure:
The time spent on working with PX-10 (NF source) was introduced in the probabilistic modelling, using the range described by the focus group mem-bers; and
The total working time on a day was assumed to be 8 hours. If the time spend on the activity was less than 8 hours, then the remainder of the 8 hours was taken to be the time spent elsewhere. The remainder of the time was selected to be in the far-field for this PX-10 activity, in the far-field for another PX-10 task or in a non-exposed area, depending on the scenario de-scription (see Appendix 1).
Based on these calculations an estimated average exposure for a worker was calculated for each scenario. Table 4-5 presents the results for the inhalation exposure and the dermal exposure as well as the combined exposure. The com-bined results show values in the range of 0.01 to 0.5 ppm for the highest expo-sure estimates (years before 1970). These average values were only slightly lower than the estimated 8 hour values, which can be explained by the fact that for many tasks the focus group stated long working hours – either in the near-field or in the far-near-field, but only little time at another places.
Yearly NF&FF inhalation Yearly dermal estimation (inhala-tion equivalent)
Total (inhalation and dermal) yearly inhalation equivalent
Mean 5th 95th Mean 5th 95th Mean 5th 95th
No Description Year
[ppm] [ppm] [ppm] [ppm eq.] [ppm eq.] [ppm eq.] [ppm eq.] [ppm eq.] [ppm eq.]
Before 1970 0.444 0.300 0.598 0.007 0.004 0.010 0.451 0.304 0.608 1970-1980 0.194 0.127 0.265 0.003 0.002 0.005 0.197 0.129 0.270 1 Cleaning small arms in weapon rooms After 1980 0.043 0.029 0.056 0.001 0.001 0.001 0.044 0.029 0.058 Before 1970 0.284 0.194 0.378 0.004 0.002 0.006 0.287 0.196 0.384 1970-1980 0.120 0.081 0.163 0.002 0.001 0.003 0.122 0.082 0.165 2 Cleaning small arms onboard of ships After 1980 0.028 0.019 0.038 0.001 0.000 0.001 0.029 0.019 0.039 Before 1970 0.070 0.047 0.096 0.004 0.002 0.006 0.074 0.049 0.101 1970-1980 0.029 0.019 0.039 0.002 0.001 0.003 0.030 0.020 0.041 3 Cleaning small arms in small workshops After 1980 0.005 0.003 0.007 0.001 0.000 0.001 0.006 0.003 0.008 Before 1970 0.129 0.066 0.201 0.008 0.004 0.013 0.137 0.070 0.213 1970-1980 0.059 0.029 0.093 0.004 0.002 0.006 0.062 0.031 0.099 4 Cleaning small arms in large workshops After 1980 0.020 0.010 0.032 0.001 0.001 0.002 0.021 0.010 0.034 Before 1970 0.009 0.006 0.013 0.004 0.002 0.005 0.013 0.008 0.018 1970-1980 0.004 0.003 0.005 0.002 0.001 0.003 0.006 0.004 0.008 5 Washing of
tor-pedo parts in the
adjacent room After 1980 0.001 0.001 0.001 0.000 0.000 0.001 0.001 0.001 0.002
Before 1970 0.307 0.160 0.522 0.199 0.043 0.435 0.506 0.203 0.957
1970-1980 0.136 0.065 0.241 0.086 0.021 0.199 0.222 0.086 0.44
6 Maintenance
tor-pedoes onshore
After 1980 0.044 0.022 0.075 0.027 0.006 0.063 0.071 0.028 0.138

![Figure 3-2: Experimental set up for the determination of the benzene evapora- evapora-tion rate (Q=flow through box [m³/min])](https://thumb-eu.123doks.com/thumbv2/5doknet/3046620.8305/20.892.179.793.755.1098/figure-experimental-determination-benzene-evapora-evapora-tion-rate.webp)